Article

Influence of a Diversion Pier on the Hydraulic Characteristics of an Inverted Siphon in a Long-Distance Water Conveyance Channel

1
China South-to-North Water Transfer Group Middle Route Co., Ltd., Henan Branch, Zhengzhou 450018, China
2
College of Water Conservancy and Hydropower Engineering, Hohai University, Nanjing 210098, China
3
Institute of Water Science and Technology, Hohai University, Nanjing 211100, China
4
Nanjing Hydraulic Research Institute, Nanjing 210029, China
*
Author to whom correspondence should be addressed.
Water 2025, 17(16), 2378; https://doi.org/10.3390/w17162378
Submission received: 26 June 2025 / Revised: 3 August 2025 / Accepted: 6 August 2025 / Published: 11 August 2025
(This article belongs to the Section Hydraulics and Hydrodynamics)

Abstract

Since large-flow water diversion began in the middle route of the South-to-North Water Diversion Project, inverted siphons have experienced varying degrees of local flow pattern disorder at their inlets and outlets, resulting in a significant decline in hydraulic performance. Taking the Kuhe inverted siphon as a case study, a combination of numerical simulation and on-site testing was used to explore the causes of flow pattern disorder at the outlet of the inverted siphon. Meanwhile, based on the actual engineering situation, the influence of the flow pattern optimization measure of installing a 5D (five times the diameter of the pier) diversion pier at the outlet of the inverted siphon on its hydraulic characteristics was studied. Research findings indicated that before the implementation of flow pattern optimization measures, the Karman vortex street phenomenon was found to occur when water flowed through the piers; the interaction of the vortex streets behind each pier led to flow pattern disorder and affected the flow capacity. After implementation of the flow pattern optimization measures, the diversion piers had a significant inhibitory effect on the formation and development of the Karman vortex street behind the piers under the dispatching and design flow conditions. The flow velocities in each vertical layer were adjusted, with a significant improvement in the flow pattern. The hydraulic loss of the Kuhe inverted siphon was reduced by 11.5 mm, or approximately 7.8%. Under the dispatching flow condition, the water diversion flow of the Kuhe inverted siphon increased by approximately 4.11%. The water diversion capacity of the structure could be effectively enhanced by adding diversion piers to the tails of the piers. This method can be widely applied in similar open-channel long-distance water diversion projects.

1. Introduction

The main water conveyance canal of the Middle Route Project of the South-to-North Water Transfer Project spans four provinces (municipalities) directly under the jurisdiction of the central government: Henan, Hebei, Beijing, and Tianjin. Since its commissioning on 12 December 2014, the project has operated well under the designed conditions and serves as an important water source for 44 large- and medium-size projects along the route. The project has greatly improved the ecological and investment environments of the water-receiving areas in Henan, Hebei, Beijing, and Tianjin. Promoting the economic and social development of the central and northern regions of China has provided an impetus for social and economic development [1,2,3]. On 29 April 2020, the Middle Route Project of the South-to-North Water Diversion Project initiated large-scale water conveyance for the first time. The inflow rate of the Taocha channel was increased from the designed flow rate of 350 m3/s to 420 m3/s. However, during the large-scale water conveyance period, varying degrees of local flow disorder phenomena occurred at the inlet and outlet of the inverted siphon. These factors increased the head loss of buildings. This affected the overall water conveyance capacity of the main canal to a certain extent. Effective engineering measures are required to improve and stabilize the flow pattern and enhance the flow capacity.
The water flows at the inlet and outlet of the inverted siphon are prone to surface oscillations and vortices, causing local flow disorder. Various measures have been implemented to improve the water flow pattern [4,5]. Shi et al. [6] proposed to improve the influence of water surface oscillation and a tailing vortex at the outlet of the Qihe Canal inverted siphon project by adjusting the shape of the outlet pier. Li et al. [7] used model tests to optimize and modify the shape of the inlet and outlet of the Xiaozhuanggou inverted siphon. This effectively avoided the unfavorable four-sided inflow, reduced the inlet vortex, alleviated downstream scouring, and greatly enhanced the flow capacity of the inverted siphon. The results indicated that improving the design of the inverted siphon structure, adding deflector piers and deflector plates, changing the length of the deflector piers, and optimizing their shapes [8,9] could effectively reduce the flow disorder, thereby enhancing the flow capacity and reducing the hydraulic loss.
Furthermore, relevant data for the three-dimensional flow field inside inverted siphons can be obtained more conveniently through numerical simulations, and the internal flow field can be analyzed more intuitively [10,11,12]. During these simulations, multiple schemes can be run and calculated simultaneously, which can overcome many limitations of model tests. Zhang et al. [13] simulated an inverted siphon project using computational fluid dynamics (CFD) software. Combined with model experiments, the results indicated that when the water flow at the outlet of the inverted siphon passed through the pier wall of the gate chamber, a Karman vortex street occurred behind the gate chamber, causing a disordered water flow pattern and oscillation of the downstream water surface. The phenomenon of Karman vortex streets was initially proposed by physicist von Kármán, and its definition is as follows: Under steady incoming flow conditions around certain objects, periodic shedding of counter-rotating vortices occurs on both sides of the object, forming a regular double row of vortex lines. Initially, these two vortex rows maintain their independent motion, subsequently interacting with and attracting each other with increasing intensity, ultimately developing into a nonlinear phenomenon known as a vortex street. The vortex street intensity and water surface oscillation could be mitigated by extending the outlet pier wall or optimizing the structural dimensions of the pier head.
Most previous studies have focused on model tests and numerical simulations. By contrast, this study combines on-site prototype measurements with high-precision numerical simulations; this method is more consistent with the actual situation and yields smaller errors than model tests. By comparing on-site data with numerical simulation results, the causes of flow-state disorder are analyzed and flow-state optimization measures are evaluated. The mechanism of action is clearly revealed, and the effects and feasibility of the flow-state optimization measures are verified. This study provides a reference for the optimization of water flow patterns in other water conveyance structures of the South-to-North Water Diversion Project.

2. Background

The middle route of the South-to-North Water Diversion Project is a super-large water transfer project across regions and basins, with a total length of 1432 km. It uses the elevation difference to carry water under the action of gravity, with an annual average water transfer volume of 9.5 billion m3. The middle route of the South-to-North Water Diversion Project has greatly alleviated water shortages in the central and northern regions of China. It has increased the water supply for domestic and industrial use by 6.4 billion m3 in Henan, Hebei, Beijing, and Tianjin Provinces (municipalities), and it has provided 3 billion m3 of water for agriculture. The project has greatly improved the ecological and investment environment in the water-receiving areas of Henan, Hebei, Beijing, and Tianjin Provinces (municipalities), which has promoted the economic and social development of the central and northern regions of China.
To further enhance the social benefits of the project, on 29 April 2020, the middle route of the South-to-North Water Diversion Project initiated large-scale water conveyance for the first time. The inflow rate of the Taocha channel was increased from the designed flow rate of 350 m3/s to 420 m3/s. However, during the period of large-scale water conveyance, varying degrees of local flow disorder phenomena occurred at the inlet and outlet of each inverted siphon. These factors increased the head loss of buildings, reduced the flow capacity, and affected the overall water conveyance capacity of the main canal to a certain extent. Thus, effective engineering measures are urgently required to improve the flow state of the inlet and outlet of the inverted siphon, ensure that the water flows smoothly, reduce the hydraulic loss through the buildings, and improve the flow capacity of the inverted siphon.

3. Research on the Hydraulic Characteristics of Inverted Siphons in Water Conveyance Channels

3.1. Unmanned Aerial Vehicle Photography Combined with Velocity Measurements of the Surface Flow Field of Traceless Particles

Particle image velocimetry (PIV) technology was used to measure the surface of the flow field. PIV technology is based on conventional flow display technology, which fully uses and integrates image analysis, optical analysis, and modern computer technologies to overcome the limitations of single-point measurement and display technologies. PIV technology can achieve non-contact, instantaneous, and globally precise measurements of a fluid. The PIV technique has the following advantages: (1) It avoids interference in the flow field caused by measuring instruments, in contrast to invasive measurement methods, such as propeller flowmeters or acoustic Doppler velocimeters (ADVs), and (2) it can achieve instantaneous measurement of the global flow velocity, in contrast to the point-by-point flow-field measurements provided by conventional measurement instruments. To date, PIV technology has been widely applied in model tests and on-site prototype observations; its application in the measurement of complex flow fields is evident. This project is based on the engineering and water flow characteristics described in Section 107 of the middle route of the South-to-North Water Diversion Project and adopts large-scale surface PIV (LSPIV) measurement technology without tracer particles [14,15,16].
The basic principle of PIV technology [17,18] is the uniform incorporation of tracer particles into the fluid to be measured. Using a laser as the light source, a high-speed camera records the positional changes of the tracer particles in the fluid between two exposure times. The velocity of the tracer particles in the flow field is then analyzed using image analysis technology.
Because the tracer particles in the flow field move in concert with the fluid, the velocity of the tracer particles can be regarded as the velocity of the nearby fluid. For a given time interval ( t ), a tracer particle will move from position ( x 1 , y 1 ) to ( x 2 , y 2 ); the instantaneous velocity of each point in the flow field can then be calculated according to Equation (1), allowing the overall flow-field cloud map to be drawn.
u = x 2 x 1 t dx dt v = y 2 y 1 t dy dt u = x t v = y t ,   t 0
For the on-site flow-state observation in this study, a flow-field movement video was captured using a DJI unmanned aerial vehicle (UAV, Shenzhen Dajiang Innovation Technology Co., Ltd, Shenzhen, China). The resolution of the camera was 4K, and the frequency was 50 Hz. This resolution was illuminated using natural light. The obtained videos were imported into PIV software (Version 2.58) based on MATLAB (Version R2021b) and Tecplot (Version 2022 R1) for image recognition, correction, analysis, and flow-field cloud-map drawing.
The surface flow-field information for typical building exits in the Zhengzhou section of the South-to-North Water Diversion Project was obtained using UAV photography combined with a tracerless velocity measurement method. A schematic of the research method is shown in Figure 1. The measurement time was 2 s, and the water delivery flow rate was 210 m3/s.

3.2. Acoustic Doppler Current Profiler (ADCP) Cross-Sectional Velocity Measurements

The velocity of characteristic sections was measured using an acoustic Doppler current profiler (ADCP). When an acoustic pulse signal emitted to the water body encounters suspended particles moving within the water body, reflection occurs. The ADCP can calculate the flow velocity relative to the ADCP based on the difference in frequency between the acoustic pulse signals emitted by and reflected to the ADCP (i.e., the Doppler frequency shift) [19,20,21]. Typical cross-sectional surfaces were selected to measure the cross-sectional flow velocity and explore the flow pattern characteristics of the inlet and outlet water sections.

3.3. Geometric Modeling and Numerical Simulations

Three-dimensional flow-field numerical simulation calculations were performed based on CFD [22,23,24] for the dispatching, design, and increased flow conditions of the Kuhe inverted siphon. Combined with the results of on-site observations, the characteristics of the flow field at the outlet of the Kuhe inverted siphon were analyzed.
(1)
Geometric modeling and meshing
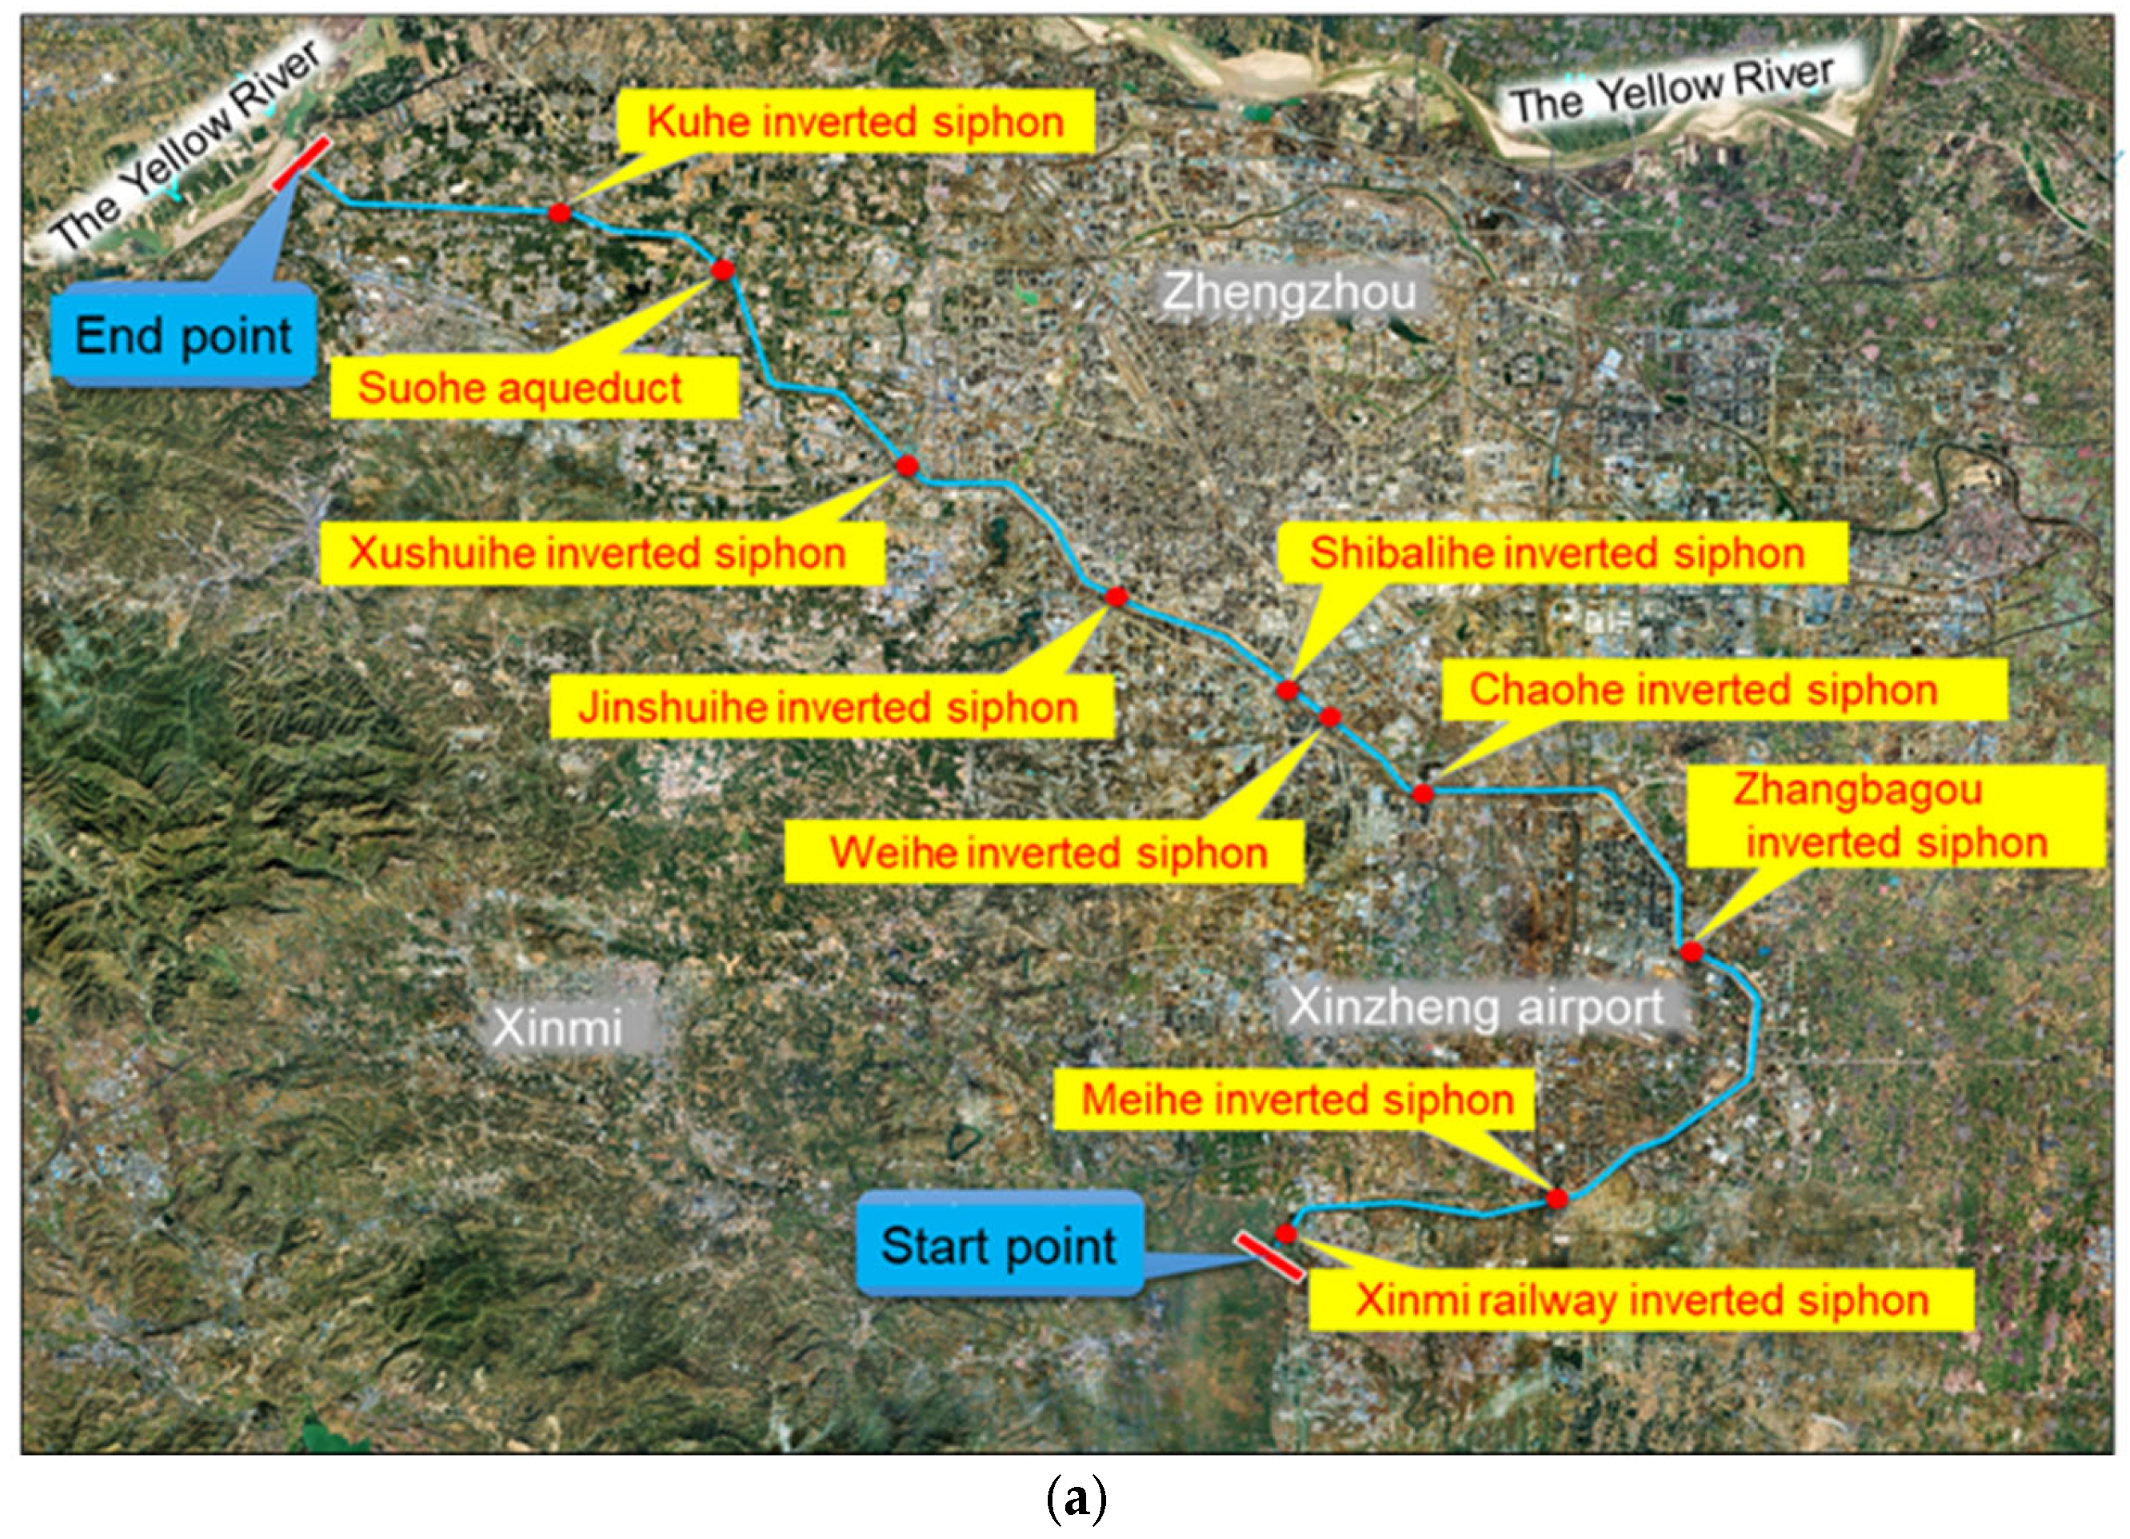
The Kuhe inverted siphon is situated in the Zhengzhou section of the South-to-North Water Diversion Middle Route Project, spanning approximately 107 km from the starting point to the end point, as illustrated in Figure 2a. A total of 10 water conveyance structures have been constructed, comprising one aqueduct and nine inverted siphons. During the high-flow water conveyance operation in 2022, the Karman vortex street phenomenon was most pronounced downstream of the Kuhe inverted siphon.
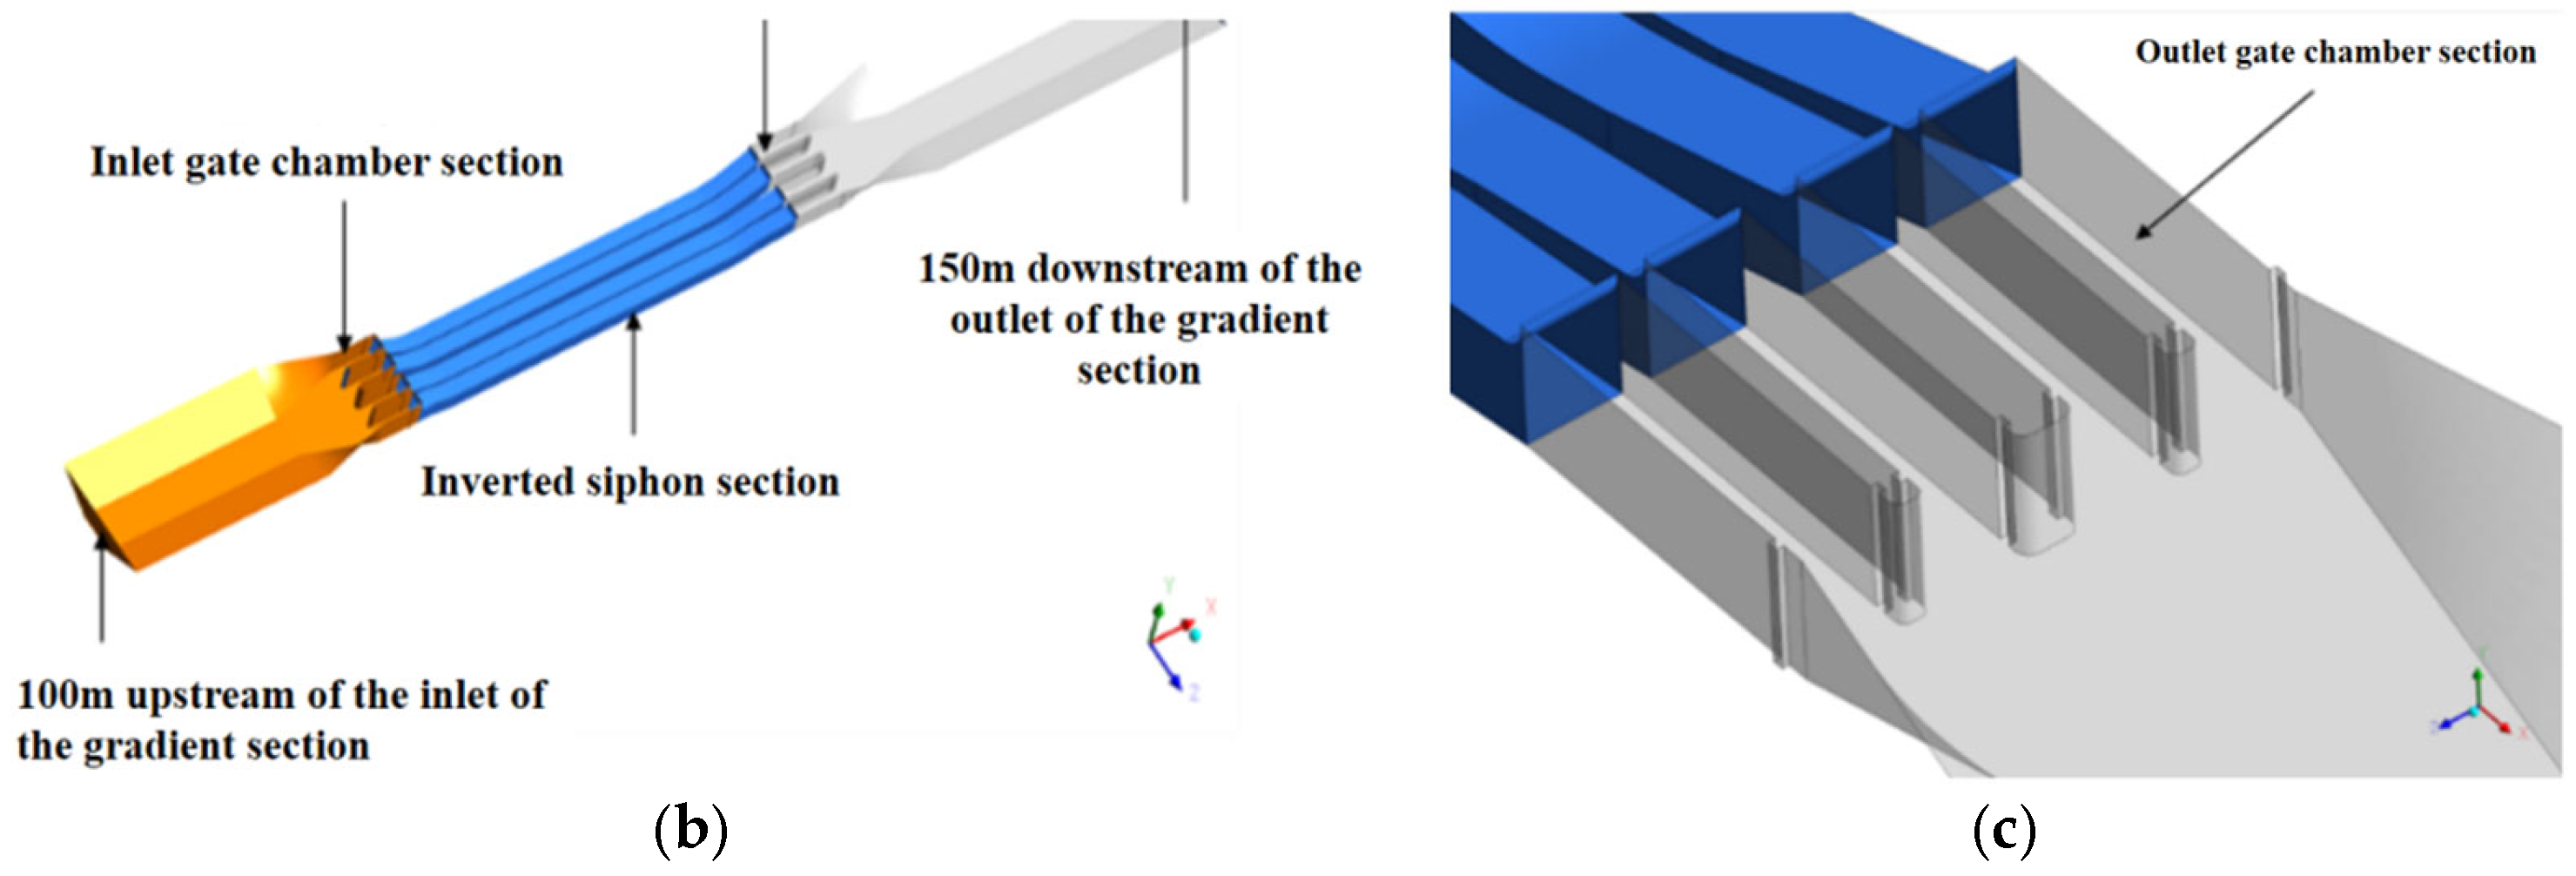
The calculation domain of the hydraulic model was established according to the design diagram of the Kuhe inverted siphon, as shown in Figure 2b,c. The numerical simulation calculation domain included the inlet channel, inlet transition, inlet gate chamber, siphon, outlet gate chamber, outlet transition, and outlet channel sections. The total length of the model was 465 m, the width was 64 m, and the height was 22 m. The lengths of the upstream and downstream channels of the model were 100 m and 150 m, respectively. The imported gradient section was 35 m. The inlet gate chamber section was 20 m, and the sinking section of the inverted siphon inlet was 26 m. The body length of the inverted siphon tube was 135 m. The upward section of the inverted siphon outlet was 34 m. The outlet gate chamber section was 26 m, and the exit gradient section was 40 m. The middle pier of the inverted siphon was 4 m wide, and the side pier was 2 m wide.
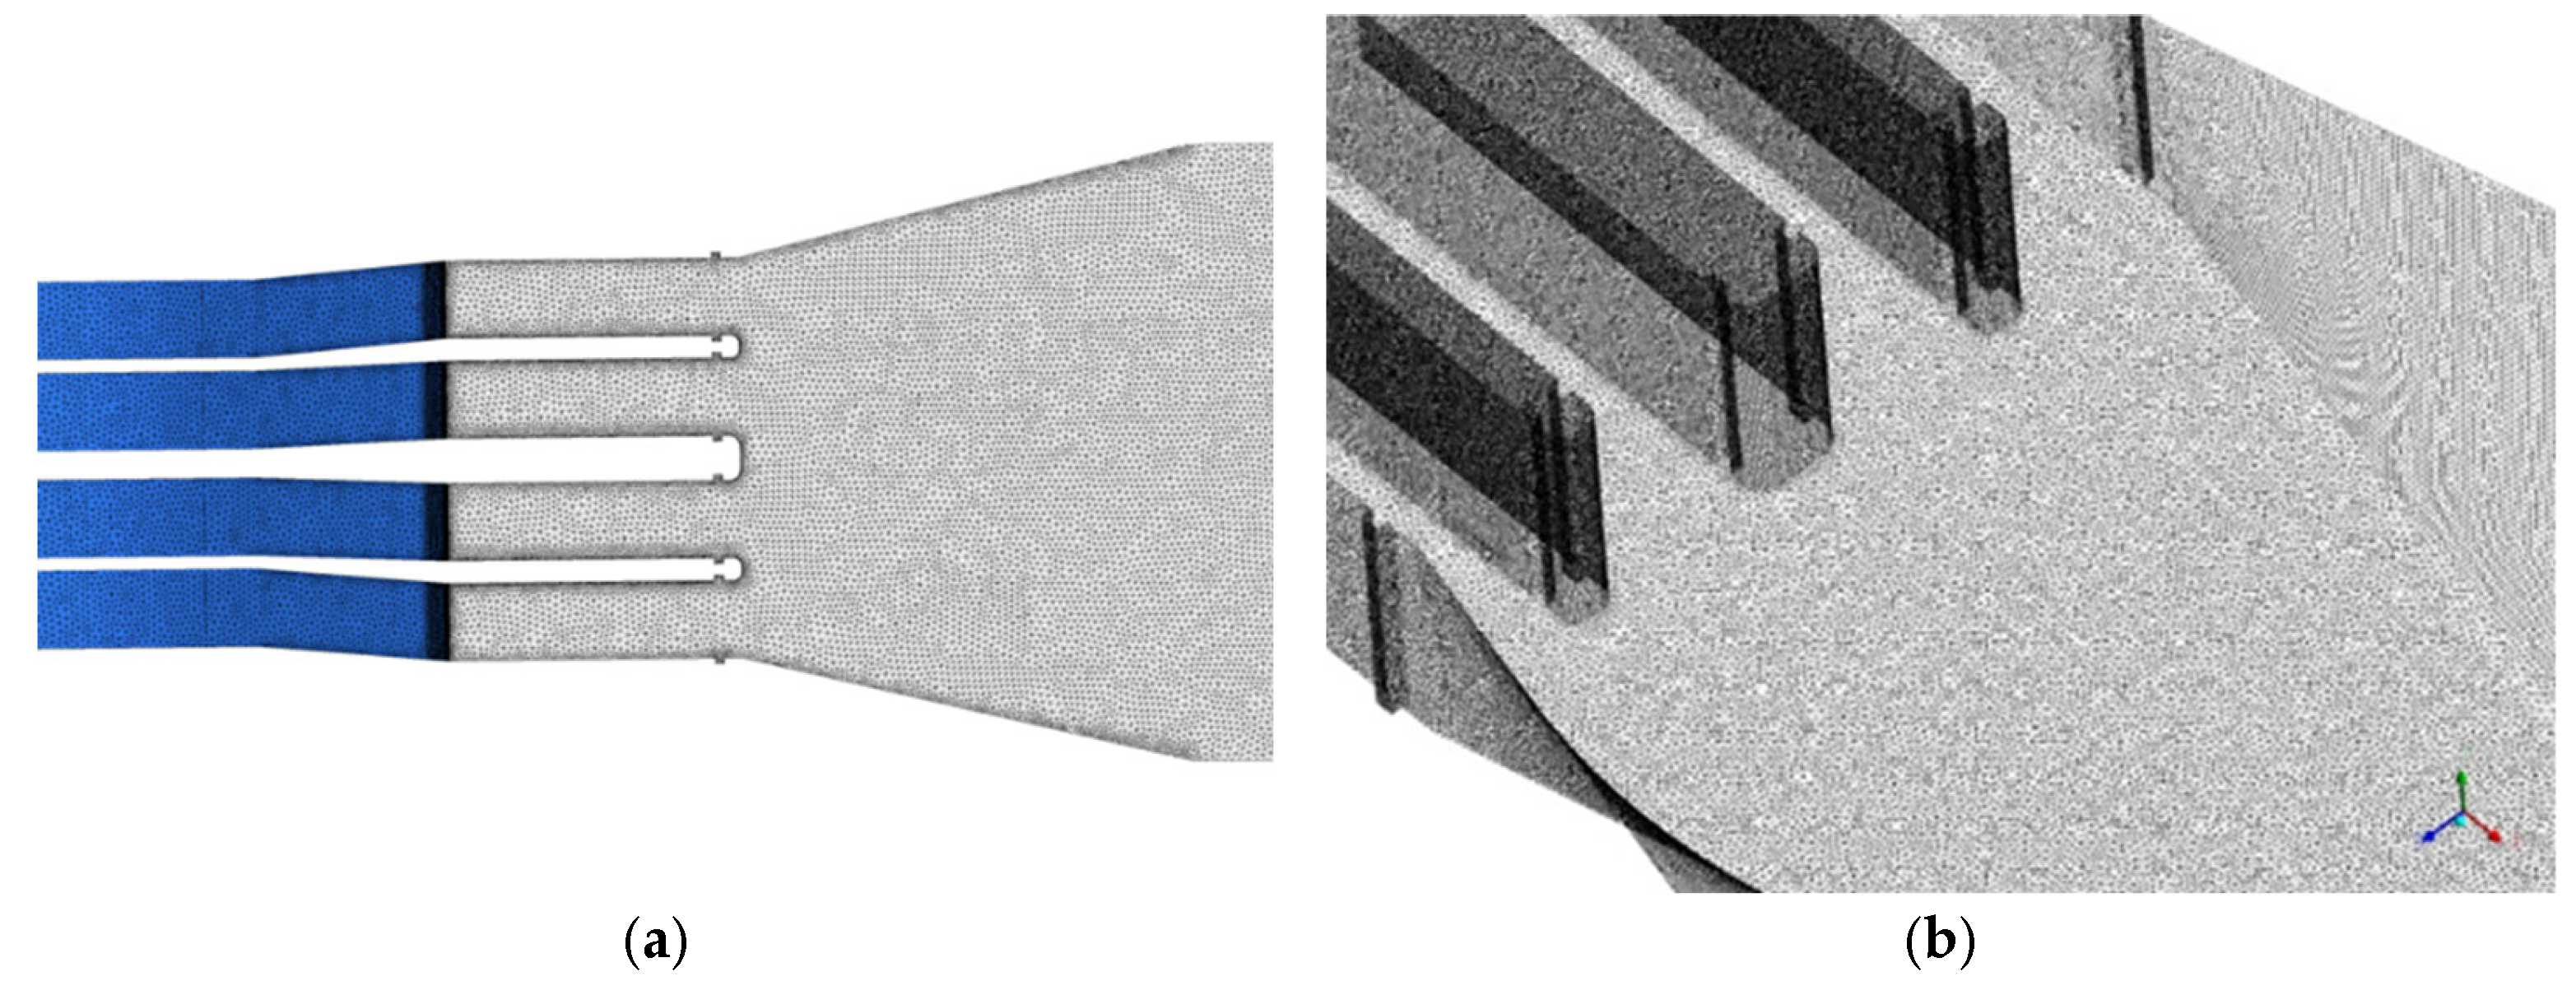
The 3D model of the Kuhe inverted siphon was imported using ANSYS ICEM grid generation software (Version 2022R1). Considering the complexity of the building structure of the Kuhe inverted siphon, a tetrahedral grid with better adaptability was adopted, as shown in Figure 3. During the grid division process, grid encryption processing was performed for the parts with smaller geometric dimensions, such as the gate slot and the locations at the outlet piers where Karman vortex streets were generated. The flow force loss of the water conveyance structure was selected as the evaluation parameter. The inverted siphon was divided into schemes with different grid numbers: 3.86 million, 7.72 million, and 17 million. Under the dispatching flow condition, the hydraulic loss of the model with 3.86 million grids was 0.160 m, whereas the hydraulic losses of the models with grid numbers of 7.72 million and 17 million were 0.153 m and 0.150 m, respectively. The hydraulic loss was closest to the actual measured value in the model with 17 million grids. Thus, the 17-million-grid scheme was selected for the numerical simulations in this study.
(2)
Computation method
The RNG k–ε model [25,26,27] was used for the turbulence modeling, and the VOF method was used to conduct numerical simulations of the gas–liquid two-phase flow in the inverted siphon [28]. The finite volume method based on the finite element method in ANSYS Fluent software (Version 2022R1) was selected to discretize the system of equations. During the discretization process, the shape function was introduced, and the diffusion and pressure gradient terms were represented by the shape function. This method, maintaining the conservation characteristics of the finite volume method, absorbed the numerical accuracy of the finite element method. The flow field was solved using the fully implicit multigrid coupling solution method, which could overcome the repeated iterative process of “assuming the pressure term–solving–correcting the pressure term” required by conventional algorithms.
For the boundary conditions, the inlet boundary of the Kuhe inverted siphon model was defined as a pressure inlet, the outlet boundary was defined as a flow boundary, and the wall surface adopted a non-slip boundary condition. When the RNG k–ε turbulence model is used to close the RANS equation, special treatment methods need to be adopted for the flow near the wall surface. Compared with the standard wall function, the scalable wall function does not have strict requirements for Y+. Therefore, in the calculation process, the scalable wall function was adopted to link the physical quantities at the wall with the corresponding physical quantities in the turbulent core area.
(3)
Model validation
The analysis and verification of the velocity in a typical section located 25 m from the pier head at the outlet of the Kuhe inverted siphon are shown in Figure 4. Analyzing the numerical simulation results and measurement values revealed that the measured values of the flow velocity in the typical section downstream of the pier head are close to the numerical simulation results. The flow velocity distribution trend is relatively consistent, with a small average error of 8.3%.
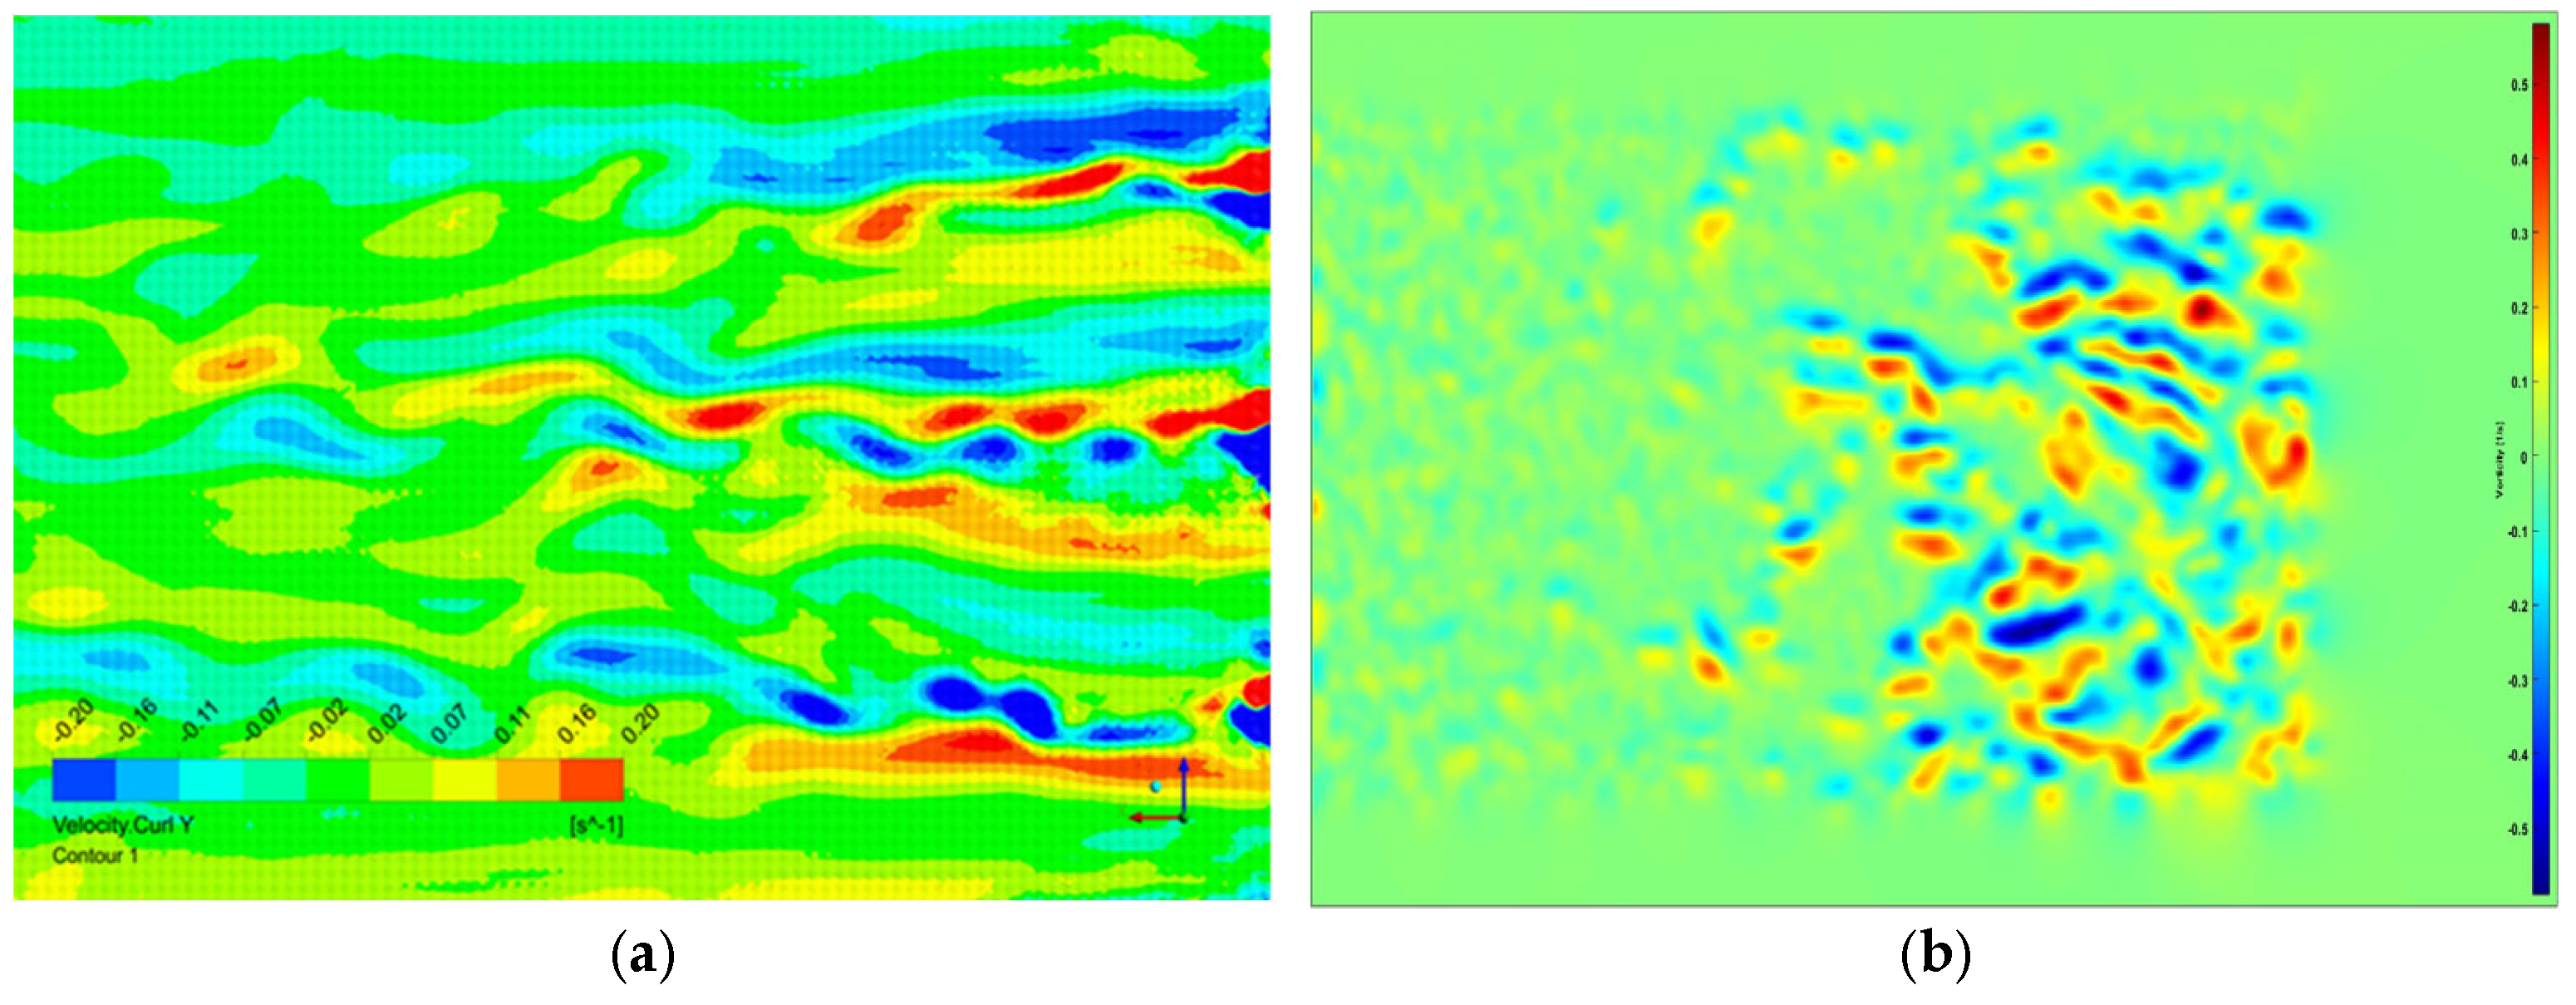
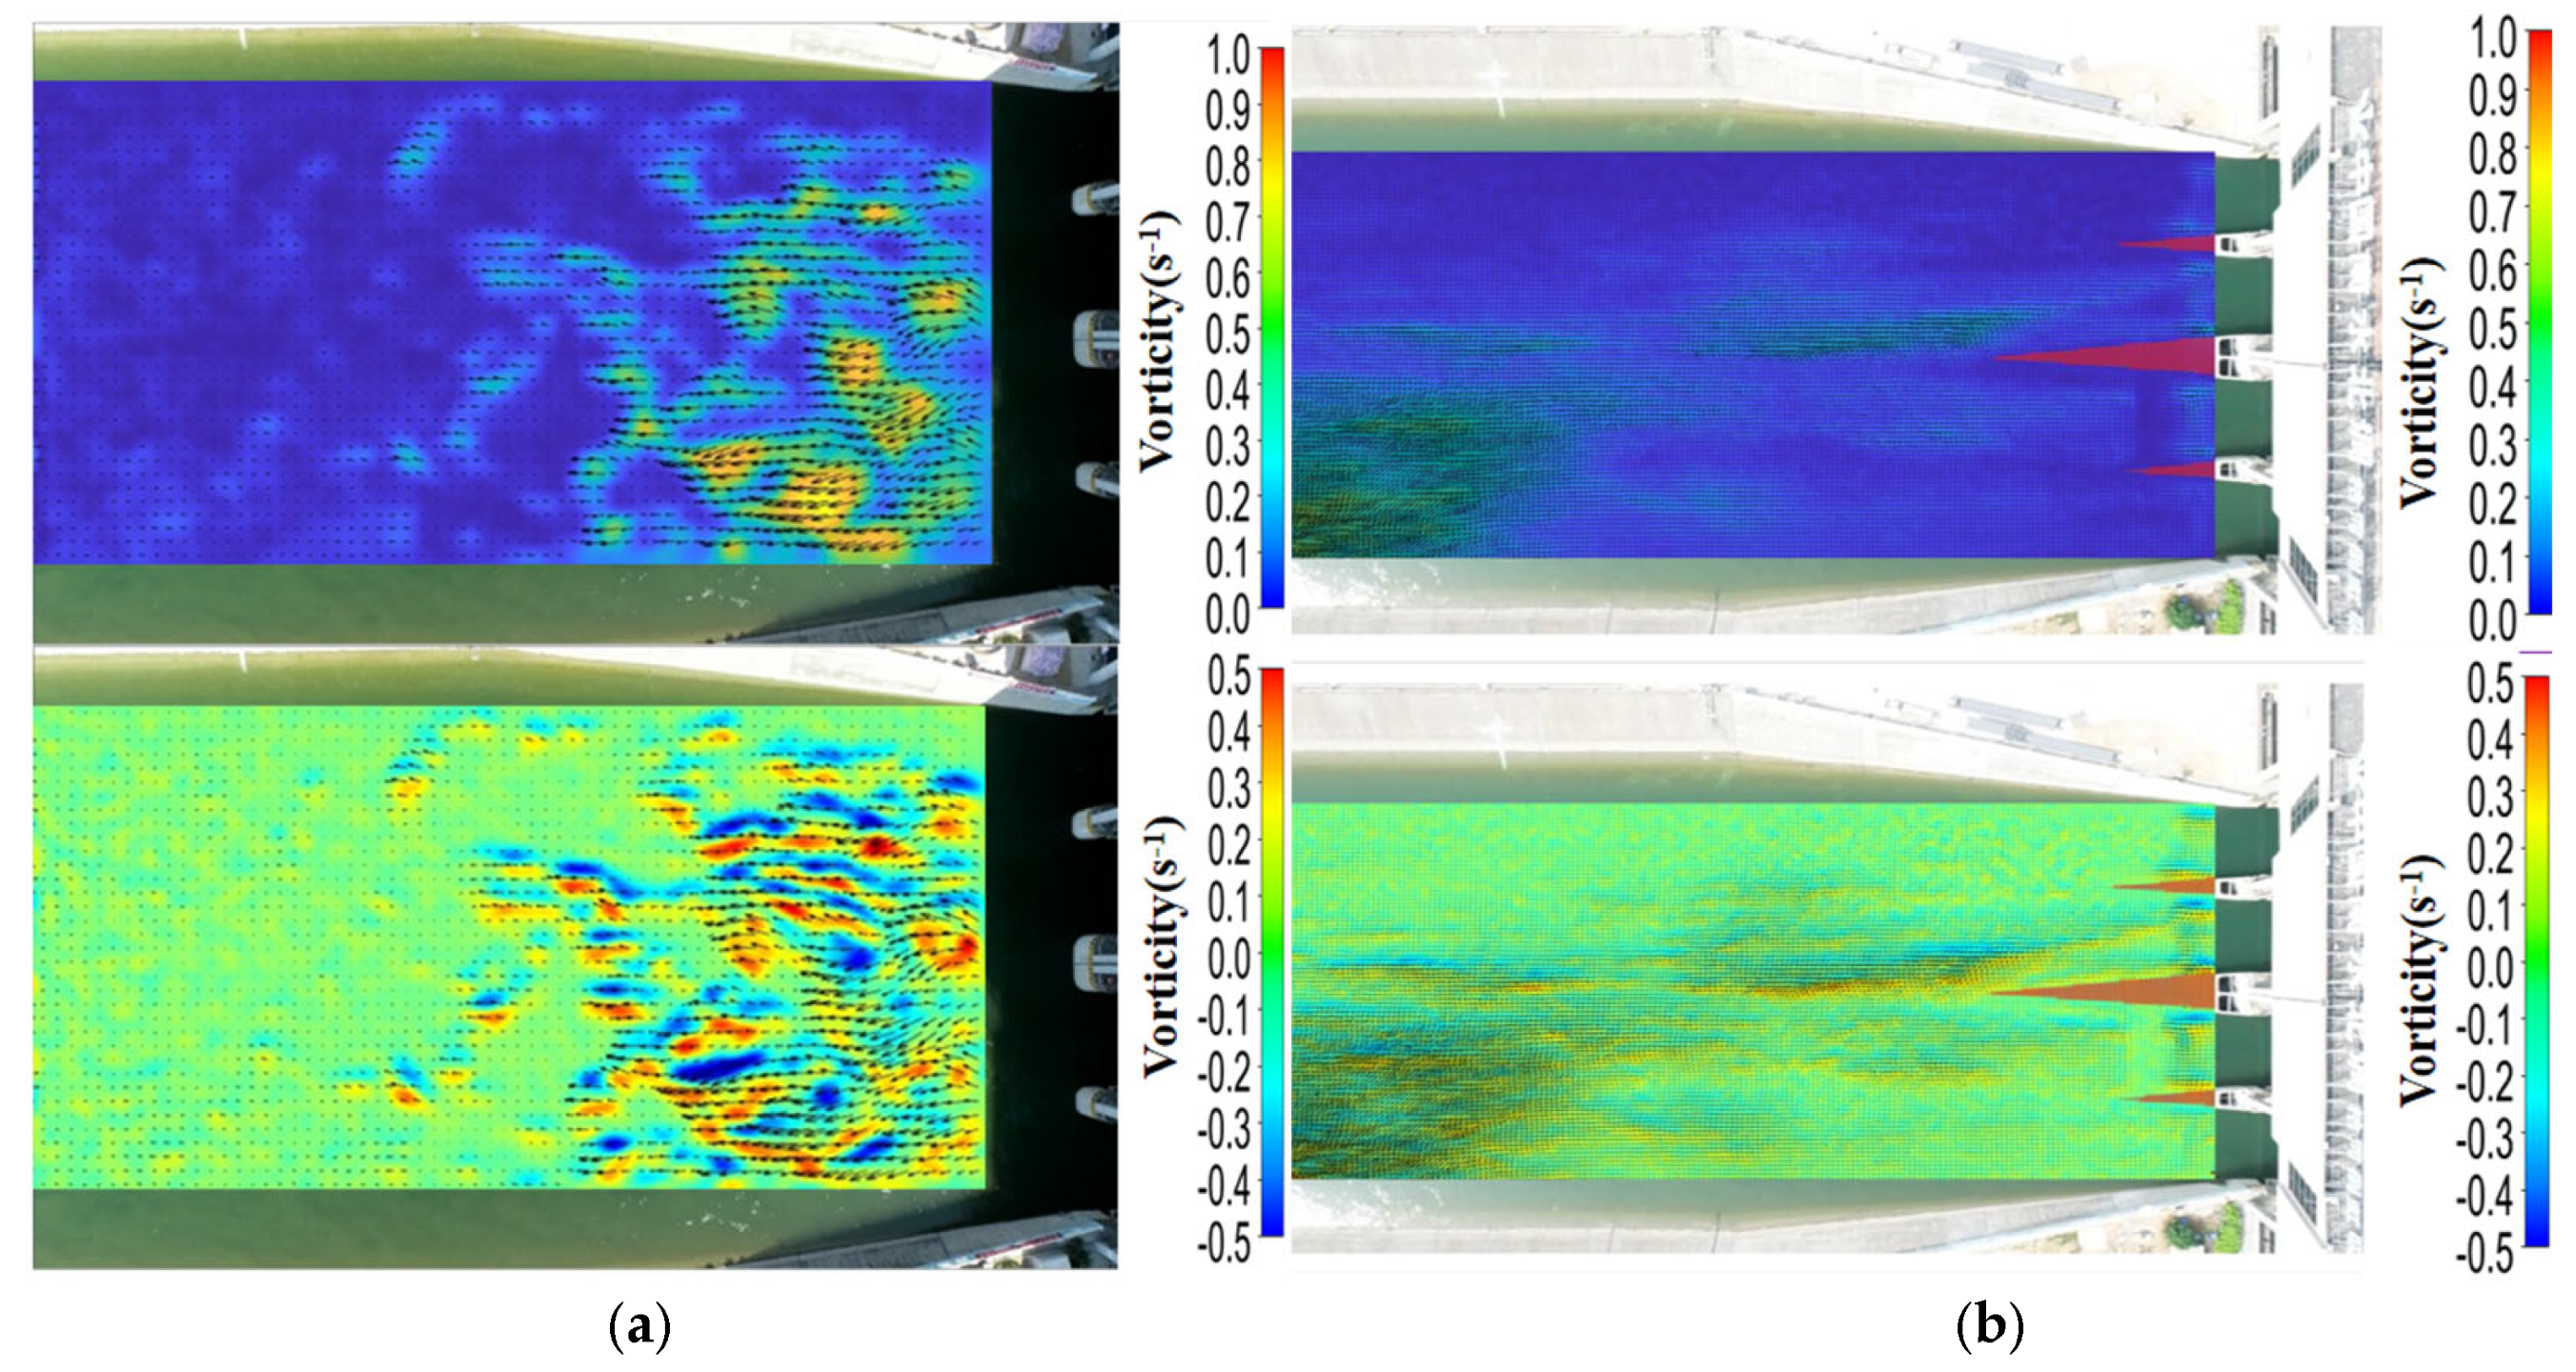
The validation of the numerical simulation results for the surface flow field of the Kuhe inverted siphon is shown in Figure 5. The vortex scales downstream of the exit pier tail are similar, and the vortex downstream of the middle pier tail has the strongest tendency to move downstream. Owing to the influence of wind force on the surface flow field during on-site testing, excessive water surface ripples were generated, which may lead to some local errors.
Under the same working conditions, the on-site test results for the hydraulic loss of the water conveyance structure before the implementation of flow pattern optimization measures are presented in Table 1. The hydraulic loss was approximately equal to the water level difference between the section 100 m upstream of the inverted siphon inlet and the section 200 m downstream of the outlet. The average water levels of the two sections were obtained by averaging the data obtained by the radar water level gauge for 15 consecutive minutes. The average hydraulic loss of the Kuhe inverted siphon was 14.71 cm, and the hydraulic loss calculated by the numerical simulations was 15 cm, which is similar.
The verification of the analysis results of water surface fluctuation, surface flow field, hydraulic loss, and velocity showed that the numerical simulation method has sufficient reliability and can be used to analyze the hydraulic characteristics of water conveyance structures.

4. Results

4.1. Hydraulic Characteristics of Inverted Siphons in Water Conveyance Channels Before the Implementation of Flow Pattern Optimization Measures

4.1.1. Flow Field Under the Dispatching Flow Condition

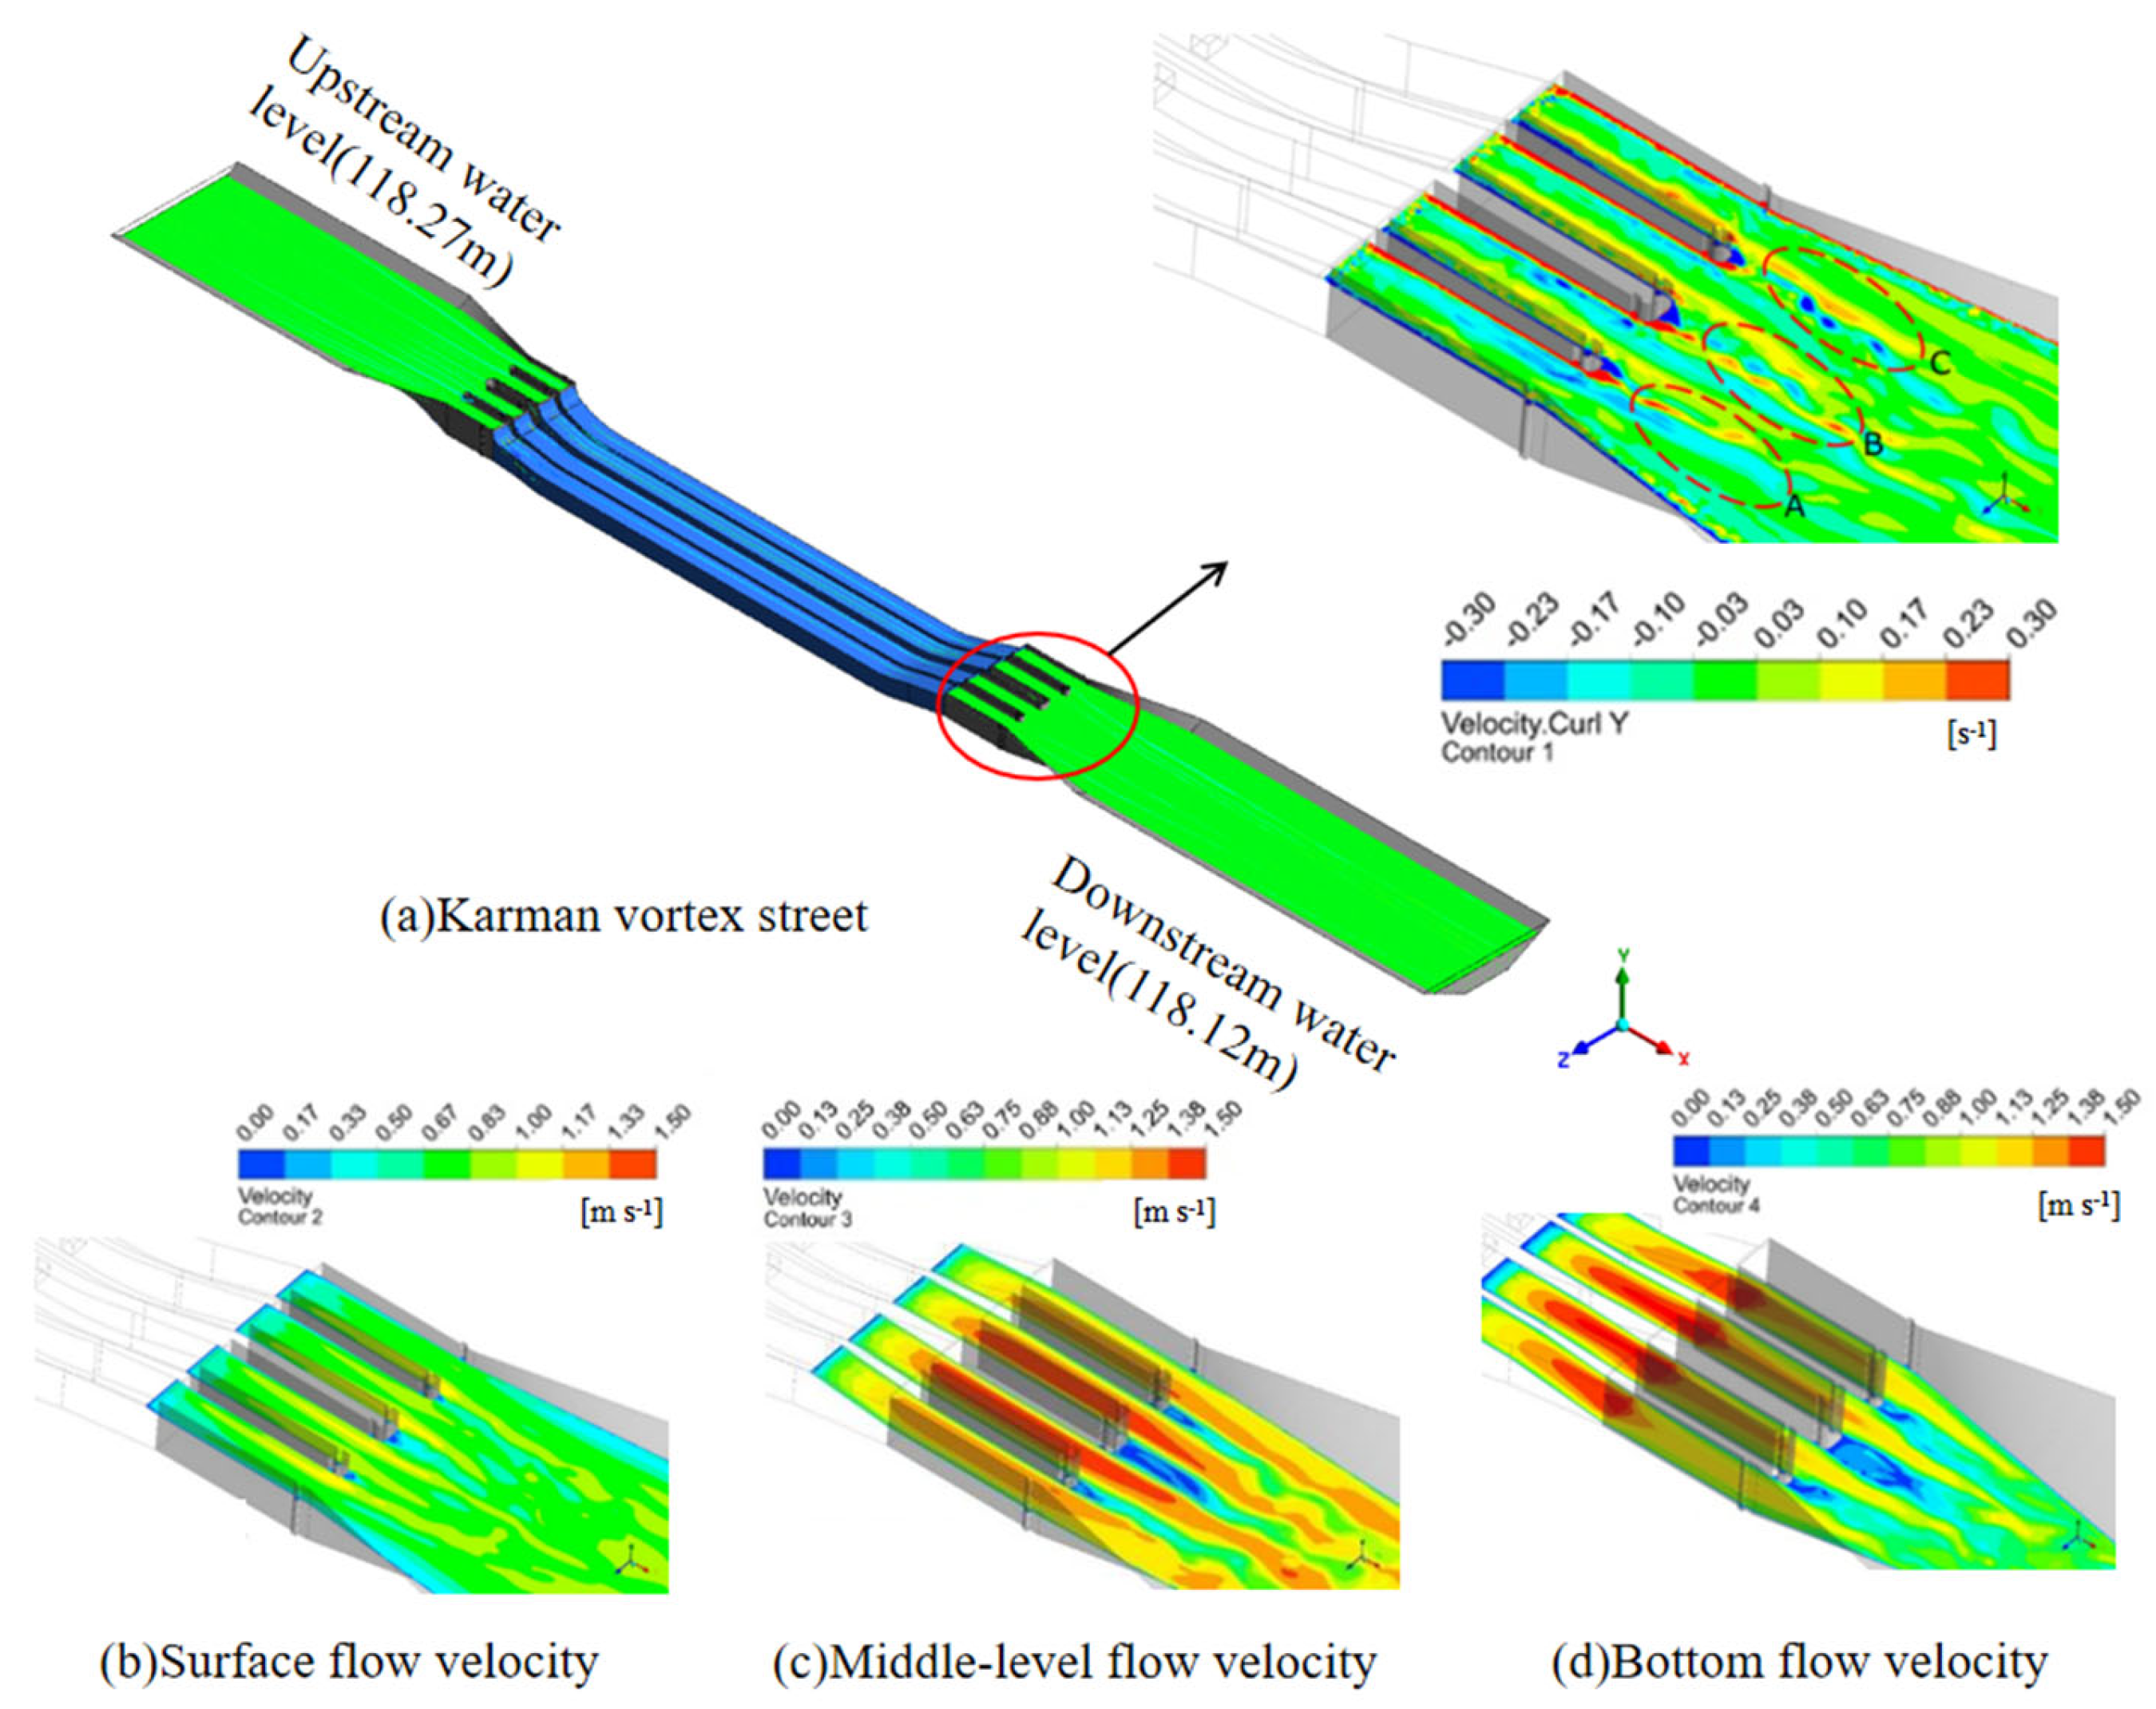
The Karman vortex street on the outlet side of the Kuhe reverse siphon under the dispatching flow condition is shown in Figure 6a. Under the dispatching flow condition, before implementation of optimization measures for the Kuhe reverse siphon flow pattern, small-scale Karman vortex street phenomena occurred in areas A, B, and C downstream of the three piers, starting from the tails of the piers. The Karman vortex street downstream of the tail of Zhongdun (area B) showed the most evident trend of downstream development.
The flow velocity distribution on the outlet side of the Kuhe inverted siphon under the dispatching flow condition is shown in Figure 6b–d. Before implementation of the flow pattern optimization measures, the overall flow velocity in the middle layer of the outlet gate chamber section was the highest, and the velocity was also high in the area of the reflux zone at the pier tail. Compared with the two side piers, the area of the reflux zone at the tail of the middle pier was the largest, indicating that a higher flow velocity and a wider pier width will induce a more evident reflux phenomenon at the tail of the pier.

4.1.2. Flow-Field Results Under the Design Flow Condition

The vortex distribution on the outlet side of the Kuhe inverted siphon is shown in Figure 7a. Under the design flow condition, before implementation of the flow pattern optimization measures, a more evident Karman vortex street phenomenon occurred downstream of the pier tail than that under the dispatching flow condition.
The flow velocity distribution on the outlet side of the Kuhe inverted siphon under the design flow condition is shown in Figure 7b–d. Before implementation of the flow pattern optimization measures, there was a significant distribution of low flow velocities downstream of the pier, whereas there was a significant distribution of high flow velocities downstream of the inverted siphon flow channel, which corresponds to the Karman vortex street phenomenon.

4.2. Hydraulic Characteristics of Inverted Siphons in Water Conveyance Channels After the Implementation of Flow Pattern Optimization Measures

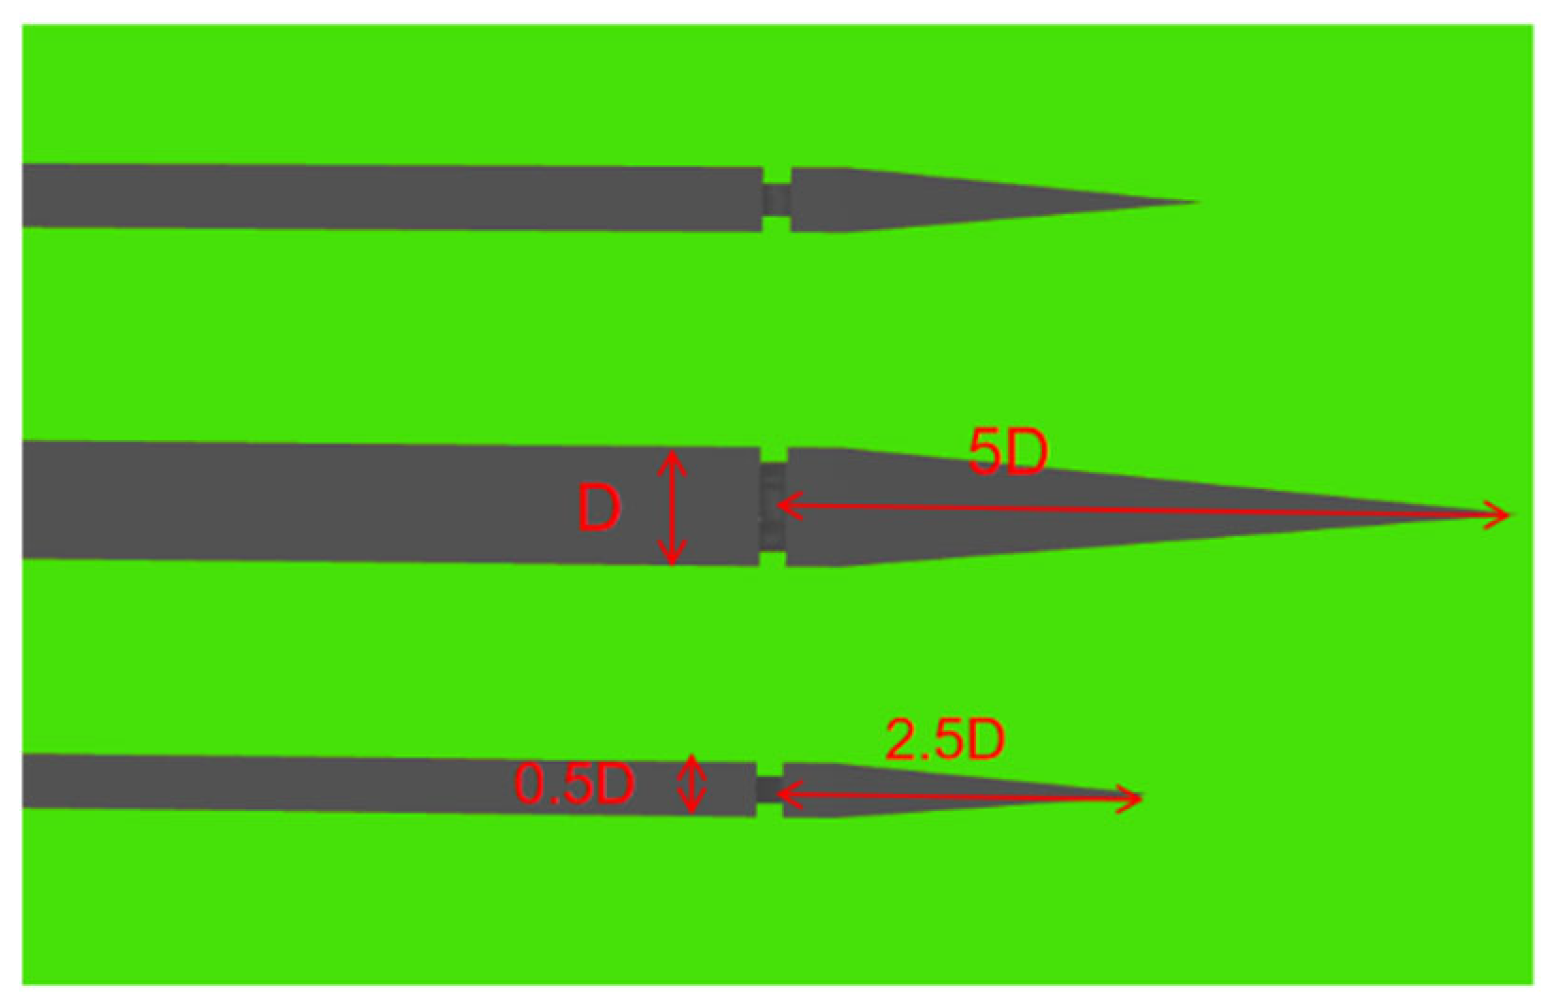
The severe Karman vortex street at the outlet led to flow disorder and affected the flow capacity. Referring to engineering experience and experimental research related to the Lihe Aqueduct [2,29], the effect of diversion piers with a diameter five times that of the piers after the exit gate was evaluated. Owing to the particularity of the midline project, it was impossible to carry out diversion and on-site pouring. Instead, prefabricated diversion piers were used. As the diversion piers were large and the formwork of the circular head was difficult to fabricate, the cross section of the diversion piers was changed to a triangular shape for prefabrication. The triangular diversion piers were analyzed, and the effect was evaluated. As shown in Figure 8, numerical simulations of the water flow at the outlet of the Kuhe inverted siphon were performed after the addition of diversion piers, and the results are described in the following sections.

4.2.1. Flow-Field Results of the Dispatching Flow Condition

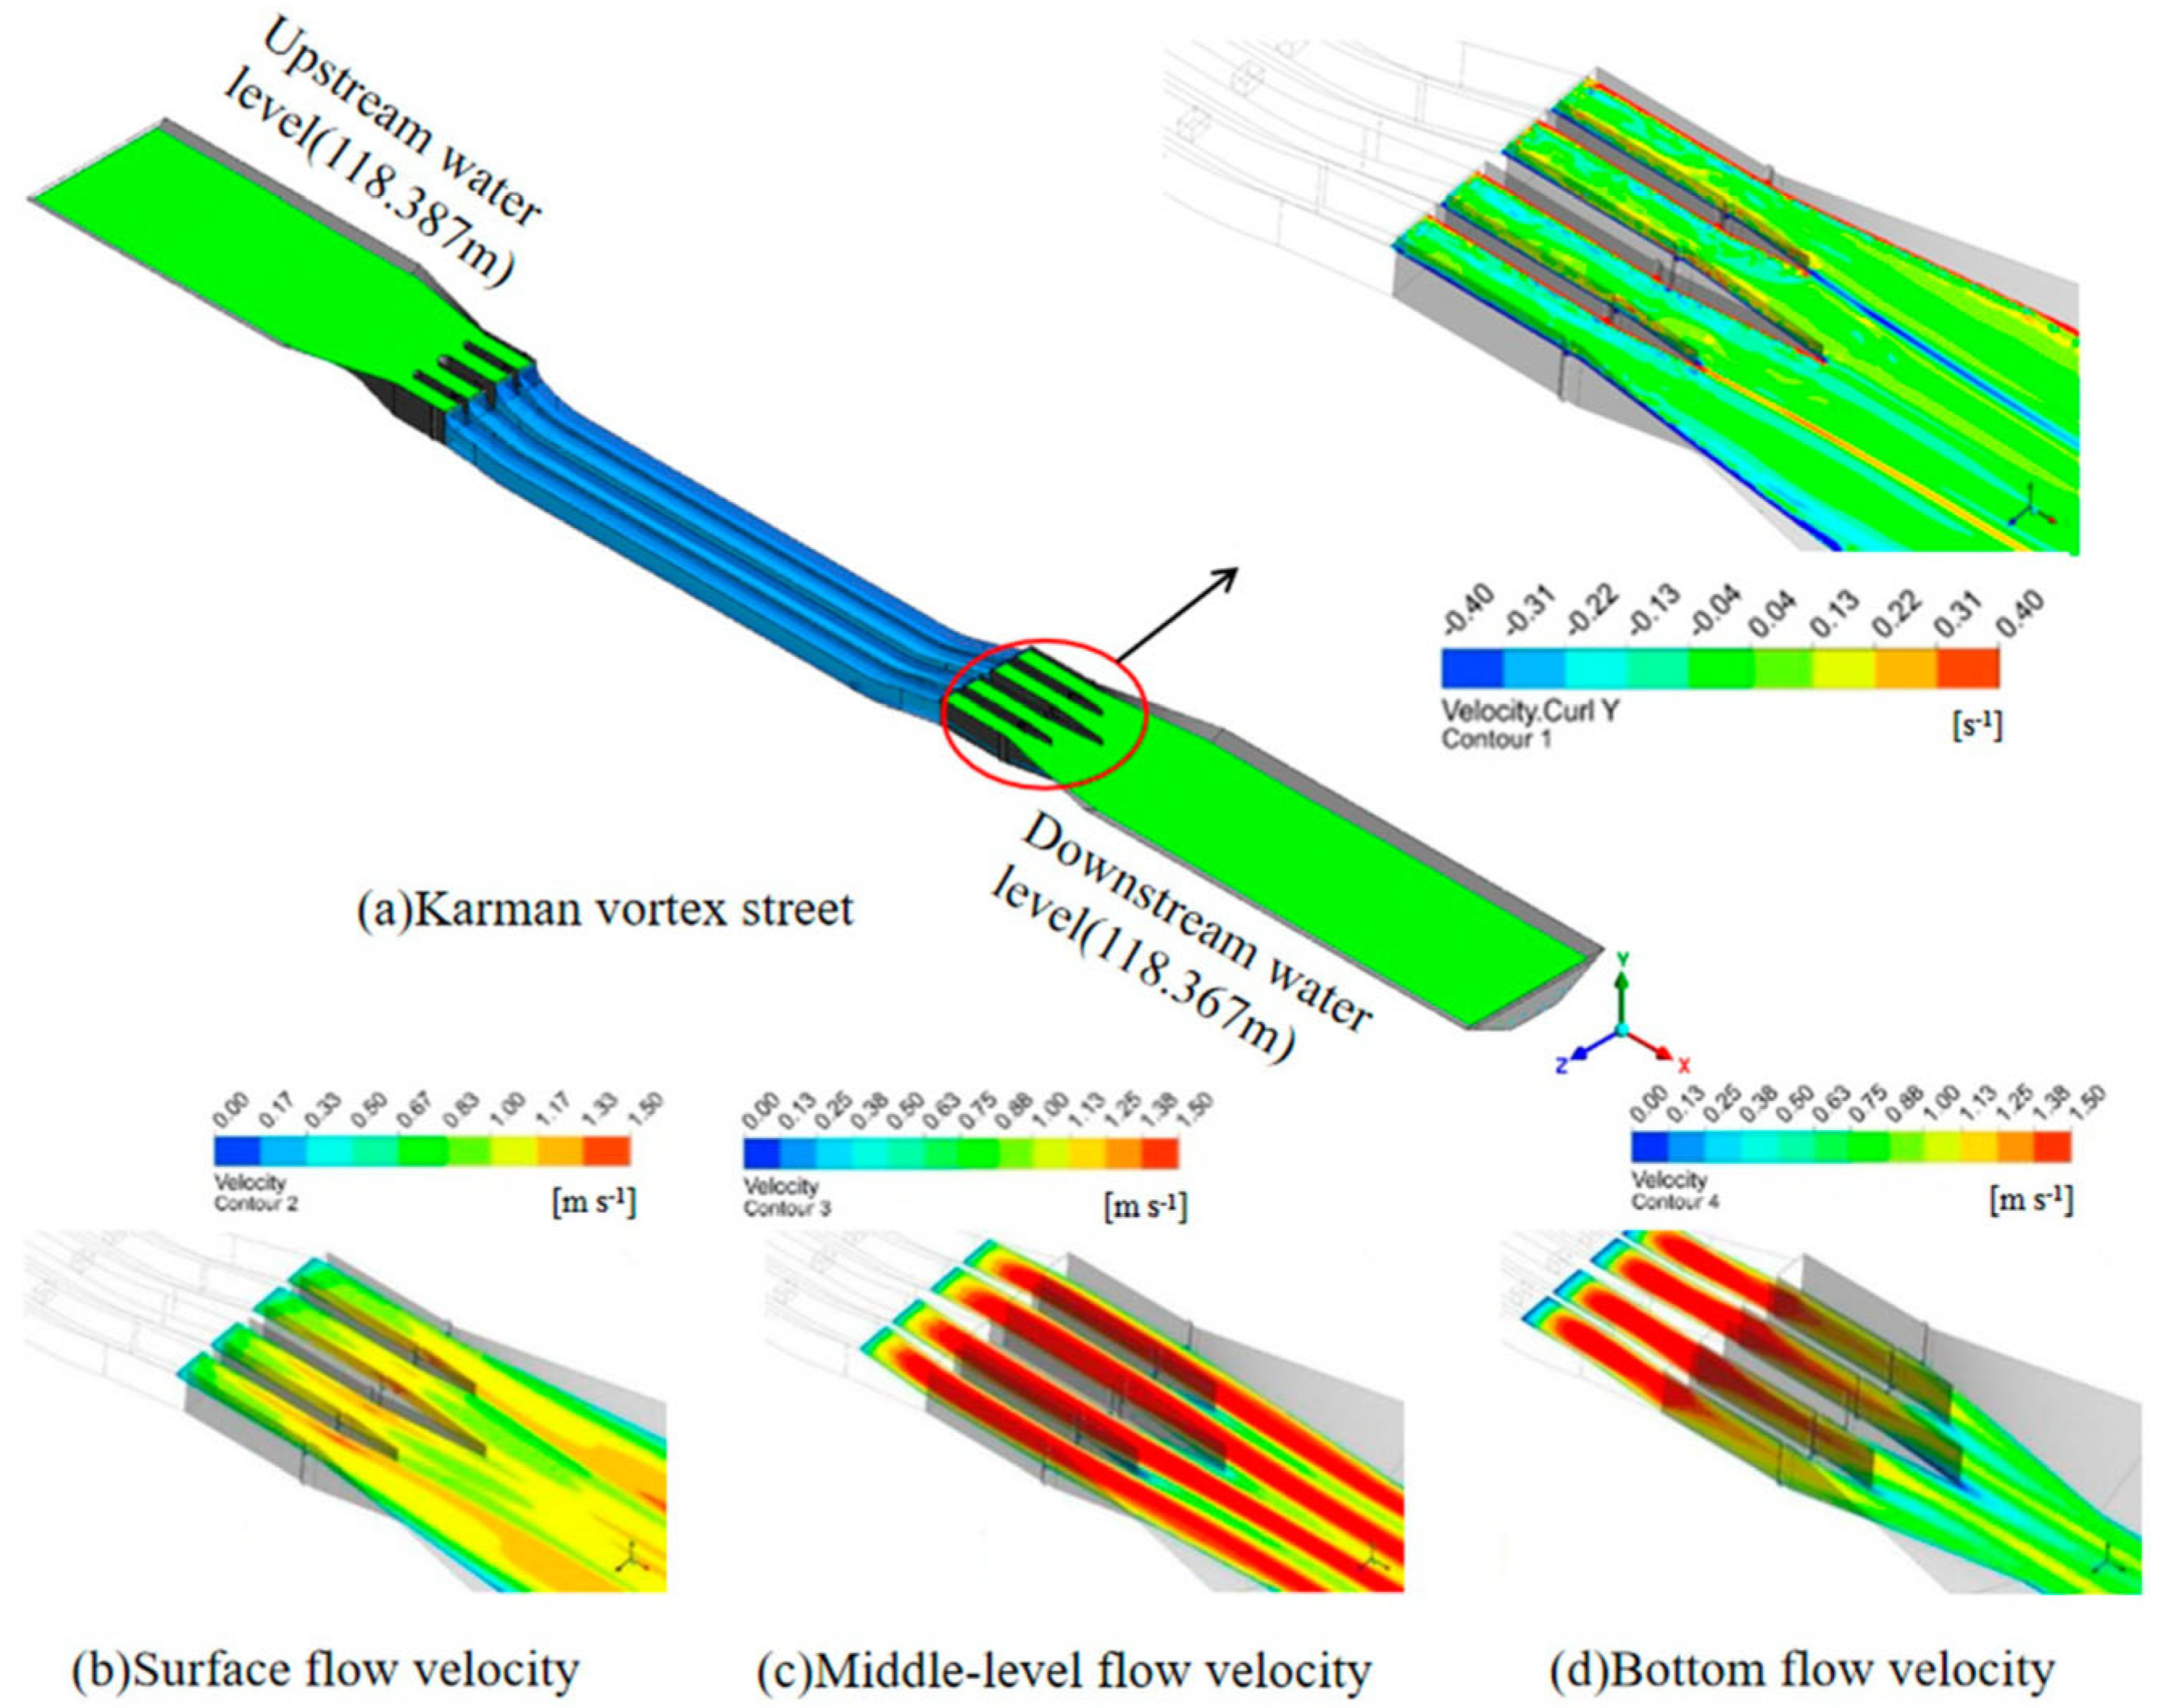
The Karman vortex street on the outlet side of the Kuhe inverted siphon under the dispatching flow condition after the implementation of flow pattern optimization measures is shown in Figure 9a. The Karman vortex street phenomenon downstream of the pier tail effectively disappeared, and the diversion pier significantly inhibited the formation and development of the Karman vortex street.
The flow velocity distribution on the outlet side of the Kuhe inverted siphon under the dispatching flow condition after the implementation of flow pattern optimization measures is shown in Figure 9b–d. The overall flow velocity of the surface and middle layers on the outlet side increased significantly, whereas the overall flow velocity of the bottom layer decreased slightly. In each layer, tail-end reflux was effectively suppressed.

4.2.2. Flow Field Under the Design Flow Condition

The vortex distribution on the outlet side of the Kuhe inverted siphon is shown in Figure 10a. Under the design flow condition, the Karman vortex street phenomenon downstream of the pier tail effectively disappeared after the implementation of flow pattern optimization measures, and thus, the diversion pier had a significant inhibitory effect on the formation and development of the Karman vortex street.
The flow velocity distribution on the outlet side of the dry river inverted siphon under the design flow conditions is shown in Figure 10b–d. After the implementation of flow pattern optimization measures, the changes downstream of the pier were obvious. The low-flow-velocity distribution was suppressed, and the area with high flow velocities expanded. Further, the Karman vortex street phenomenon effectively disappeared.

4.3. Improvement in Hydraulic Characteristics of Inverted Siphons in Water Conveyance Channels

4.3.1. Improvement of the Hydraulic Loss

The average water levels of the stable sections upstream and downstream after implementation of the flow pattern optimization measures are presented in Table 2.
The data for on-site test period 10 were used to evaluate the hydraulic loss after implementation of the flow pattern optimization measures. Before implementation of the flow-state optimization measures, the water level difference of the Kuhe inverted siphon was 14.71 cm. After implementation of the flow pattern optimization measures, the water level difference was 13.56 cm. Thus, the hydraulic loss of the Kuhe inverted siphon was reduced by 11.5 mm after optimization, which is a reduction of approximately 7.8%.

4.3.2. Improvement of the Surface Flow-Field Flow Pattern

Figure 11 shows the surface velocity and vorticity field of the downstream section of the Kuhe inverted siphon outlet before and after the addition of optimization measures. It can be observed that the flow velocity and vorticity distribution behind the pier were relatively uniform, the large local vorticity difference was eliminated, and the changes in the flow velocity and vorticity along the way were not obvious.
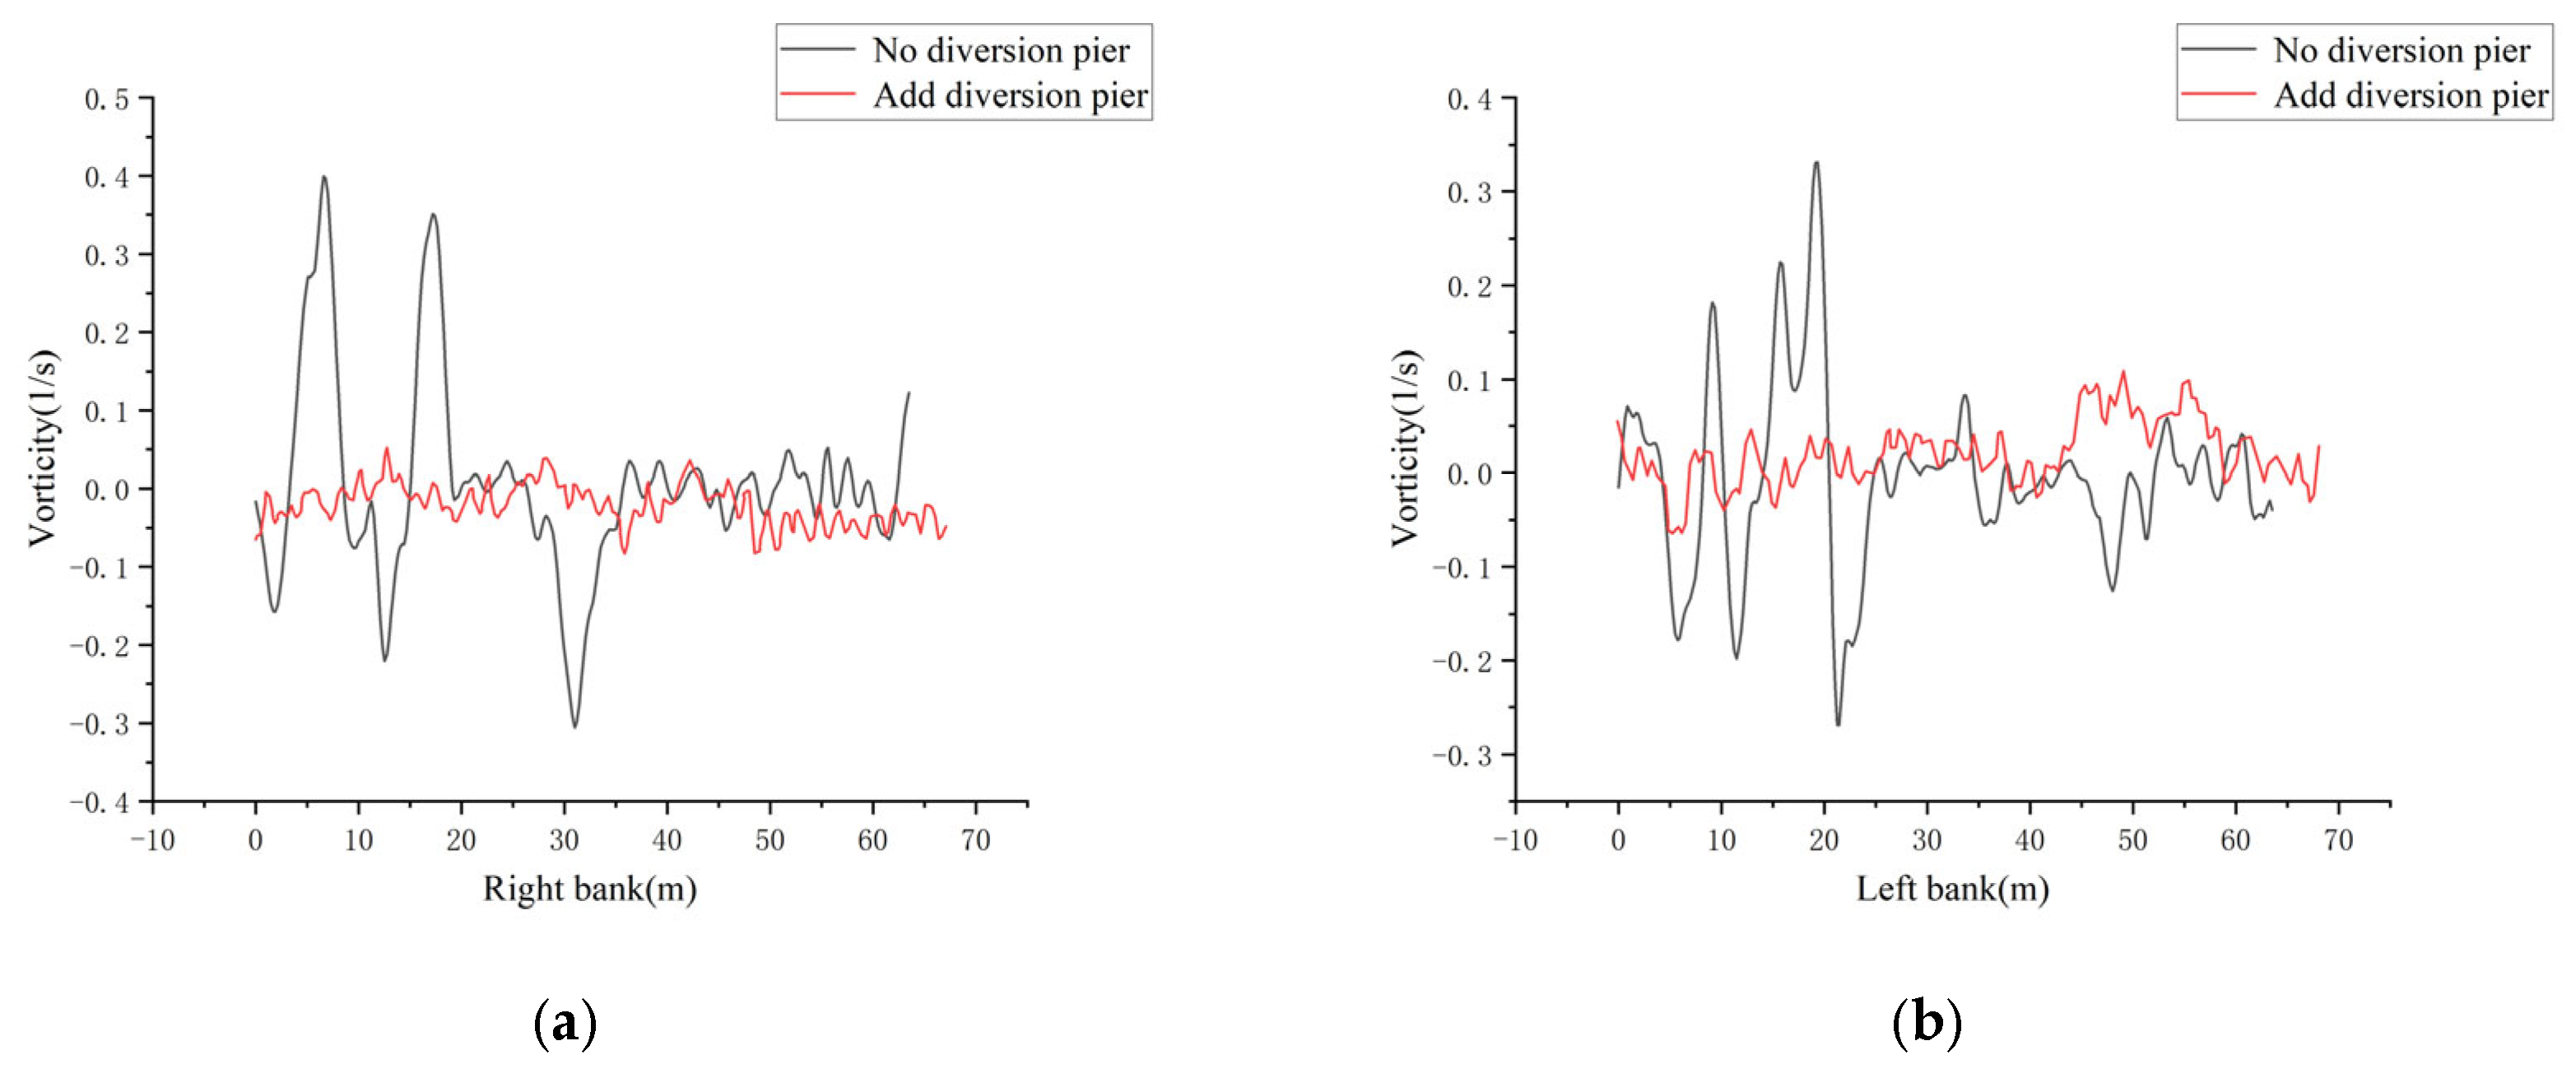
Two lines were fed downstream from the center of the exits of the left and right piers, and the vorticity data on these lines were recorded to reflect the along-path variation in the vorticity downstream of the inverted siphon exit. As shown in Figure 12, the vorticity along the course generally showed a gradually decreasing trend, indicating that as the intensity of the vortex street flowing away from the building outlet gradually weakened, the head loss caused by the vortex street also gradually decreased. Before the implementation of flow pattern optimization measures, the vorticity along the downstream (left bank) section of the Kuhe inverted siphon outlet ranged from −0.26 s−1 to 0.34 s−1; that along the downstream (right bank) section of the Kuhe inverted siphon outlet ranged from −0.3 s−1 to 0.4 s−1. Areas with large vorticity changes were mainly concentrated within the first 20 m. The maximum vorticity on the left side reached 0.34 s−1, whereas that on the right side reached 0.4 s−1. More vortices occurred on the left side than on the right side, and the fluctuations were more obvious. After implementation of the flow pattern optimization measures, the vorticity along the downstream section of the Kuhe inverted siphon outlet ranged from −0.062 s−1 to 0.11 s−1 on the left bank and from −0.08 s−1 to 0.051 s−1 on the right bank.

4.3.3. Improvement of the Flow Velocity Distribution on the Outlet Side

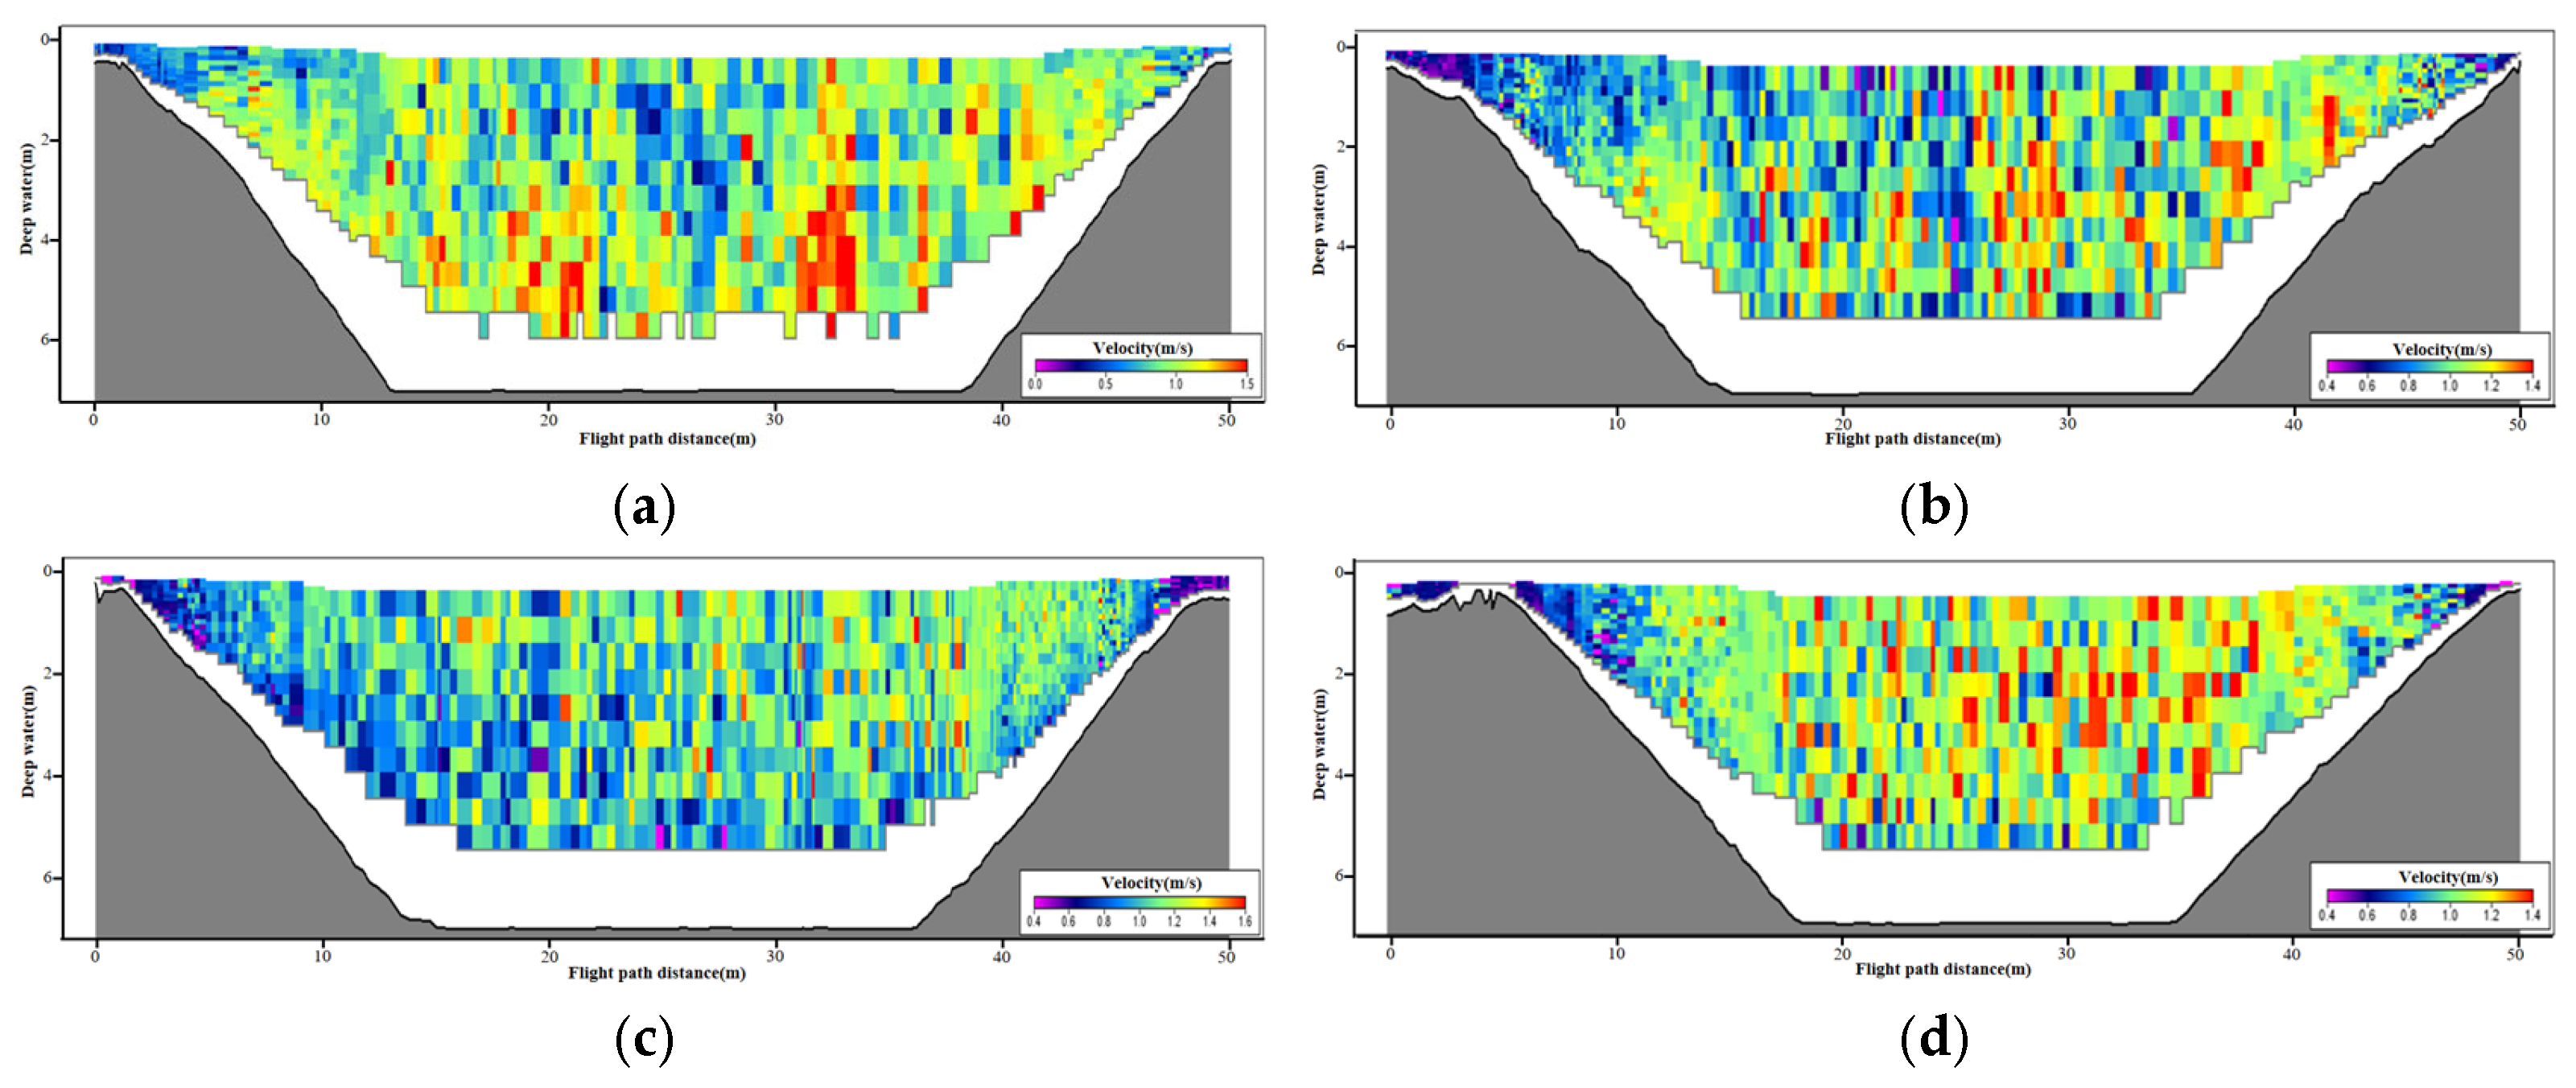
The velocity distributions in the section 25 m downstream of the water conveyance structure and the section 200 m downstream of the outlet were selected as the basis for measuring the improvement in the velocity distribution on the outlet side of the typical water conveyance structure. The velocity distributions before implementation of the flow pattern optimization measures at the cross section 25 m downstream of the Kuhe inverted siphon outlet are shown in Figure 13a, with a total flow rate of 201.722 m3/s. The velocity distributions after implementation of the cross-sectional flow pattern optimization measures 25 m downstream of the Kuhe inverted siphon outlet are shown in Figure 13b, with a total flow rate of 208.232 m3/s. In Figure 13a, the flow velocity at the cross section gradually increases as the water flow leaves the boundaries on both sides, while it decreases in the middle of the cross section. Moreover, the distribution of the flow velocity at the cross section fluctuates significantly. In Figure 13b, the flow velocity at the cross section also increases after the water flow leaves the boundaries on both sides. The flow velocity change in the middle part of the cross section and the flow velocity fluctuation at the cross section are relatively small. The overall flow velocity at the cross section is more uniform. The velocity distributions 200 m downstream of the Kuhe inverted siphon outlet before implementation of the cross-sectional flow pattern optimization measures are shown in Figure 13c, with a total flow rate of 207.689 m3/s. The velocity distributions at the same cross section after implementation of the cross-sectional flow pattern optimization measures, are shown in Figure 13d, with a total flow rate of 209.412 m3/s. In Figure 13c, after the water has traveled a certain distance, although the flow velocity fluctuation has decreased, the cross-sectional flow velocity distribution is still less uniform than that in Figure 13d after optimization, which is manifested as large fluctuations and an insufficiently concentrated velocity.

5. Discussion

5.1. Comparison of Hydraulic Characteristics of Inverted Siphons in Water Conveyance Channels Before and After the Implementation of Flow Pattern Optimization Measures

From the results of the Karman vortex street and flow velocity distribution of inverted siphons in water conveyance channels before the implementation of the flow pattern optimization measures, we can see that a higher flow velocity and a wider pier width will induce a more evident reflux phenomenon at the tail of the pier. Combined with the Karman vortex street phenomenon on the surface, it can be speculated that the tail-end reflux is the main cause of the Karman vortex street, leading to flow disorder.
After the implementation of flow pattern optimization measures, the reduction in the overall flow velocity at the bottom was caused by the complex shape of the gasket at the bottom of the diversion pier blocking the water flow. In each layer, the diversion piers effectively suppressed the generation of tail-end reflux, which is an important reason for the disappearance of the Karman vortex street.

5.2. Improvement in Hydraulic Characteristics After the Implementation of Flow Pattern Optimization Measures

The improvement in the single hydraulic loss of the Kuhe inverted siphon was analyzed. The total occurrence time of the dispatching flow condition was limited after implementation of the flow pattern optimization measures. It was determined that the longer the occurrence time of the dispatching flow condition was, the more stable the test section condition would be.
Results showed that after the addition of the deflector pier, the flow velocity and vorticity distribution behind the pier were relatively uniform, the large local vorticity difference was eliminated, and the changes in the flow velocity and vorticity along the way were not obvious. The variation in the vorticity decreased significantly compared with that before the addition of the deflector pier. This result indicates that the optimization measures added at the outlet of the Kuhe inverted siphon could significantly improve the flow pattern in its downstream section, reducing the vorticity and homogenizing the flow velocity distribution.
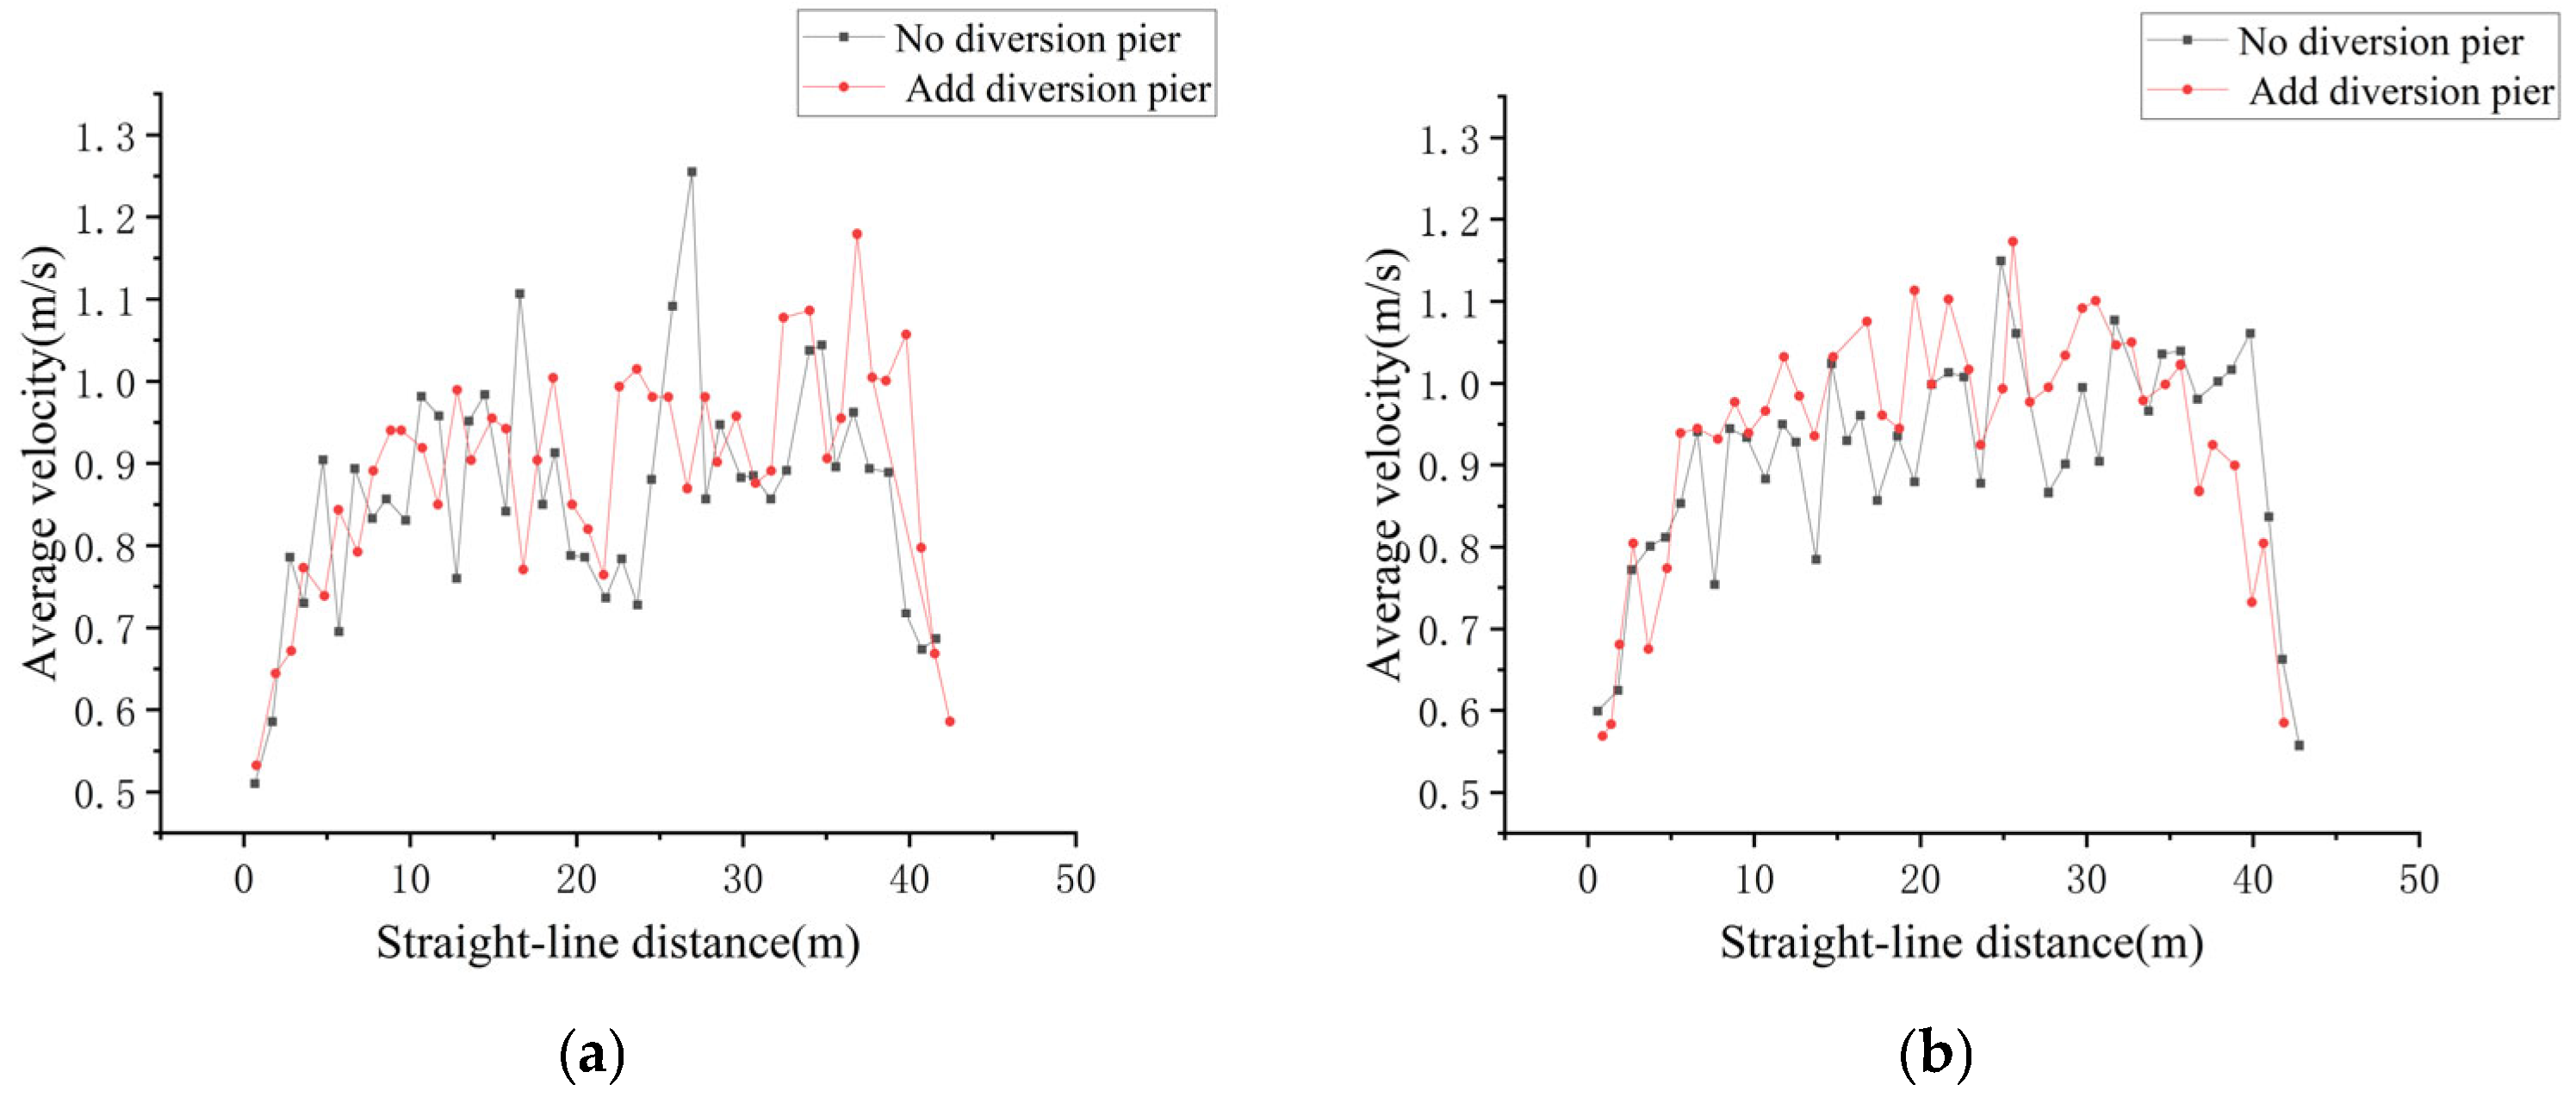
The flow statistics 25 m from the Kuhe inverted siphon outlet before and after implementation of flow pattern optimization and the comparison of the velocity distribution in Figure 14 show that during implementation of the flow pattern optimization measures, certain fluctuations in the velocity occurred in the gradually changing section of the channel, and small backflow and vortex phenomena occurred in the channel section. Therefore, a Karman vortex street phenomenon occurred in the gradually changing section of the channel. After implementation of the flow pattern optimization measures, the fluctuation range of the flow velocity decreased significantly in the cross section of the gradient section of the channel. The uniformity of the flow velocity at the cross section of the channel was somewhat improved, and the Karman vortex street phenomenon was mitigated to a certain extent. The flow statistics in the section 200 m from the Kuhe inverted siphon outlet before and after the implementation of the flow pattern optimization measures and comparison of the flow velocity distribution shown in Figure 13 indicate that the flow velocity in the channel section was generally stable before and after implementation of the flow pattern optimization measures, with no significant backflow or vortices. This indicates that after the Karman vortex street developed at a certain distance downstream, it no longer had an influence on the convective state in that section.
The suction section of the inverted siphon is a pressurized pipe flow. Based on the theory of hydraulics, an analysis of the improvement in the flow capacity of the inverted siphon was conducted. The single-hole flow rate of an inverted siphon is calculated as follows:
Combining the equations Q = μ c A 2 g H and μ c = 1 λ l d + ξ yields the following expression:
Q = 4.429 d 2 H ( λ l 4 R + ξ )
where d is the side length of the inverted siphon rectangular pipeline; H is the head difference between upstream and downstream sections of the inverted siphon; λ is the head loss coefficient along the channel, λ = 8 g n 2 R 1 3 (where n is the roughness); l is the pipe length; A is the area of water passage; g is the gravity coefficient, 9.81 N/kg; μ c is the flow coefficient;   R is the hydraulic radius, R = S L , where S is the overflow area and L is the wetted perimeter; and ξ is the local head loss coefficient.
Considering that the inlet and outlet gate chambers and the inlet and outlet gradient sections of the inverted siphon can still generate some hydraulic losses, the measured head difference in this study is the water head difference between the sections 100 m upstream and 200 m downstream of the Kuhe inverted siphon. When solving the single-hole flow rate of the inverted siphon, a correction factor, k, is set for the measured head difference. Finally, the single-hole flow rate of the inverted siphon in the test section is calculated as follows:
Q = 4.429 d 2 k H ( λ l 4 R + ξ )
After implementation of the flow pattern optimization measures, the water level difference (0.1356 m) between the sections upstream and downstream of the Kuhe inverted siphon and the average single-hole flow rate (52.50 m3/s) were used to solve the equation above, yielding k = 0.9534.
After implementation of the flow pattern optimization measures, assuming that the water level difference (0.147 m) before optimization wass reached for the Kuhe inverted siphon, the calculated average single-hole flow rate was 54.66 m3/s, the total flow rate was 218.64 m3/s, and the flow rate of the Kuhe inverted siphon increased by 4.11%.

6. Conclusions

This study considered a typical channel of an inverted siphon in the middle route of the South-to-North Water Diversion Project. By combining numerical simulations and field testing, the flow pattern optimization and flow capacity improvement under conventional operating conditions were studied, and the following conclusions were reached:
(1)
After implementation of the diversion piers, the water level fluctuation in the gate chamber of the channel inverted siphon significantly reduced, the head loss decreased, and the water conveyance capacity of the building was improved to a certain extent. Before implementation of the flow-state optimization measures, the water level difference of the Kuhe inverted siphon was 14.71 cm; after implementation of the flow pattern optimization measures, the water level difference was 13.56 cm. Thus, the hydraulic loss of the Kuhe inverted siphon was decreased by 11.5 mm, or approximately 7.8%. The flow capacity of the water conveyance structure was thus improved to a certain extent. Under the dispatching flow condition, the water conveyance flow of the Kuhe inverted siphon was increased by approximately 4.11%.
(2)
The surface flow-field and cross-sectional analysis of the water flow in the characteristic area showed that before implementation of the flow pattern optimization measures, the three groups of vortex streets behind the three piers at the outlet of the Kuhe inverted siphon influenced each other, and the flow pattern was disorderly. After implementation of the flow pattern optimization measures, the Karman vortex street phenomenon downstream of the Kuhe inverted siphon was eliminated. The maximum vortex on the left side decreased from 0.34 s−1 to −0.062 s−1, whereas that on the right side decreased from 0.4 s−1 to 0.051 s−1. The average vortex along the channel was significantly reduced, the distribution tended to be uniform, and the pattern of the water flow was significantly improved. ADCP measurements in typical sections showed that the flow velocity distribution in the section downstream of the Kuhe inverted siphon near the tail of the pier was more uniform, the sudden flow velocity drop in the central area of the section disappeared, and the Karman vortex street was eliminated.
(3)
Numerical simulations of the Kuhe inverted siphon were conducted. In the flow velocity distribution under the dispatching and design flow conditions, after adding the 5D diversion pier, the overall flow velocities of the surface and middle layers were increased, while the overall flow velocity of the bottom layer decreased slightly. Adding the 5D diversion pier showed that the flow pattern optimization measures had a significant inhibitory effect on the formation and development of the Karman vortex street behind the pier, and improvement in the flow pattern was evident.
This study verified the effectiveness of a diversion pier for optimizing the flow state of an inverted siphon through numerical simulations and field tests. However, these conclusions are based on a specific building, and its parameters are unique. Therefore, it is necessary to conduct a comparative verification using additional types of inverted siphon buildings. The flow-state response in complex scenarios, such as extreme conditions and sudden hydraulic shocks, was not considered in this study. Future research should examine different inverted siphons used in water diversion projects, conduct hydraulic performance comparisons, and seek universality. Moreover, additional simulations should be conducted under extreme hydraulic conditions.

Author Contributions

Conceptualization, T.M. and X.Y.; methodology, T.M. and X.Y.; software, D.W. and T.M.; validation, J.W., J.H. and L.L.; resources, J.W., J.H. and L.L.; data curation, T.M.; writing—original draft preparation, J.W. and T.M.; writing—review and editing, J.H. and T.M.; visualization, D.W. and T.H.; supervision, X.Y.; project administration, J.W., J.H. and L.L.; funding acquisition, T.M. and X.Y. All authors have read and agreed to the published version of the manuscript.

Funding

The study was funded by the National Key Research and Development Program of China (2022YFC3202602); the Jiangsu Province Innovation Support Program International Science and Technology Cooperation/Hong Kong, Macao and Taiwan Science and Technology Cooperation—Key Country Industrial Technology Research and Development Cooperation Project (BZ2023047); and the second batch of the Provincial-Level Scientific and Technological Research and Development Plan Joint Fund project of Henan Province in 2022 (225200810038).

Data Availability Statement

The data that support the findings of this study are available from the corresponding author upon request.

Conflicts of Interest

Author Jian Wang, Jingyu Hu and Lifang Lou were employed by the company China South-to-North Water Transfer Group Middle Route Co., Ltd., Henan Branch. The remaining authors declare that the research was conducted in the absence of any commercial or financial relationships that could be construed as potential conflicts of interest.

References

  1. Liu, S.K.; Li, B.G. The huge comprehensive benefits of the South-to-North Water Diversion Project. South-North Water Transf. Water Sci. Technol. 2003, S1, 40–42. [Google Scholar]
  2. Qu, Z.G.; Li, Z.P. Causal analysis on water level abnormal fluctuation in aqueduct and improvement measures: Case of Lihe aqueduct in Middle Route of South to North Water Transfer Project. Yangtze River 2022, 53, 189–194. [Google Scholar]
  3. He, J.S.; Xu, X.J. An Empirical Study on the Economic Benefits of Water-Receiving Areas in Hebei Province by the Middle Route Project of the South-to-North Water Diversion Project. China Water Transp. 2022, 22, 39–41. [Google Scholar]
  4. Zhou, S.F.; Fu, Z.P.; Zhang, R.Y.; Lv, J.C. Experimental Study on Vortex Elimination Method of Inverted Siphon With Lateral Inlet. China Rural Water Hydropower 2022, 6, 54–59. [Google Scholar]
  5. Duan, W.G.; Huang, G.B.; Zhang, H.; Li, L. Experimental Research on Vortexes Eliminating of Several Typical Hydraulic Intakes. J. Chang. River Sci. Res. Inst. 2011, 28, 21–27. [Google Scholar]
  6. Shi, J.Y.; Tian, Z.Z. Experimental Study on the Reverse Siphon Hydraulics Model of the Qihe Canal, the Main Canal of the Middle Route of the South-to-North Water Diversion Project. Water Resour. Plan. Des. 2006, 1, 45–48. [Google Scholar]
  7. Li, S.P.; Zhao, Y.L.; He, F.C.; Zhao, X.P.; Wang, J.H.; Yuan, Q. Experimental Study on Optimization of Flow Pattern and Scouring of Xiaozhuanggou Inverted Siphon in the Middle Route of South to North Water Transfer Project. Yellow River 2021, 43, 131–146. [Google Scholar]
  8. Liu, M.X.; Wang, Z.Z.; Zhu, Y.J.; Hu, H.; Wang, P.; Sun, D. Unsteady Flow in Diffusion Section at the Outlet of Large Water Conveyance Tunnel. J. Irrig. Drain. 2023, 42, 107–116. [Google Scholar]
  9. Li, L.Q.; Chen, X.N.; Jiang, L.; Wang, S.T.; Xu, X.Y. Influence of the Tail Pier Lengthening on the Water Level Fluctuation Elimination in the South-to-North Water Diversion Aqueduct. China Rural Water Hydropower 2023, 1, 146–151. [Google Scholar]
  10. Li, J.; Mu, Z.W.; He, Z.Q.; Li, X. Numerical Simulation of Head Loss of Small-trough and Long-distance Inverted Siphon. South-North. Water Transf. Water Sci. Technol. 2013, 11, 70–73. [Google Scholar]
  11. Li, J.; Mu, Z.W.; Qi, S.L.; Li, X. Numerical Simulation of Hydraulic Performance of Filling Process in Long Inverted Siphon of Sangequan. Water Resour. Power 2014, 32, 86–89. [Google Scholar]
  12. Su, H.T.; Shi, D.L.; Yang, Q.Y.; Yan, W.; Chen, Z.B. Numerical simulation of two-phase flow during inverted siphon filling. Yangtze River 2021, 52, 220–227. [Google Scholar]
  13. Zhang, S.K.; Han, L.; Ye, K.H.; Hu, S. Study of Hydraulic Characteristics of Inverted Siphons with Large Flows. Water Resour. Power 2024, 8, 114–118. [Google Scholar]
  14. Jin, T.; Liao, Q. Application of large scale PIV in river surface turbulence measurements and water depth estimation. Flow. Meas. Instrum. 2019, 67, 142–152. [Google Scholar] [CrossRef]
  15. Muste, M.; Fujita, I.; Hauet, A. Large-scale particle image velocimetry for measurements in riverine environments. Water Resour. Res. 2008, 44, W00D19. [Google Scholar] [CrossRef]
  16. Lewis, Q.W.; Rhoads, B.L. Resolving two-dimensional flow structure in rivers using large-scale particle image velocimetry: An example from a stream confluence. Water Resour. Res. 2015, 51, 7977–7994. [Google Scholar] [CrossRef]
  17. Stamhuis, E.; Thielicke, W. PIVlab–towards user-friendly, affordable and accurate digital particle image velocimetry in MATLAB. J. Open Res. Softw. 2014, 2, 30. [Google Scholar]
  18. Thielicke, W.; Sonntag, R. Particle Image Velocimetry for MATLAB: Accuracy and enhanced algorithms in PIVlab. J. Open Res. Softw. 2021, 9, 12. [Google Scholar] [CrossRef]
  19. Cao, Z.Y.; Sun, D.J.; Zhang, Z.X.; Zhang, D.L.; Yong, J. Acoustic Doppler velocimetry technology and equipment. J. Harbin Eng. Univ. 2023, 44, 1914–1926. [Google Scholar]
  20. Deng, K.; Zhang, Z.W.; Yu, J.L.; Lu, S. Development of Acoustic Doppler Current Profiler at Home and Aboard. J. Mar. Inf. Technol. Appl. 2019, 34, 8–11. [Google Scholar]
  21. Xue, Y.Z.; Gu, J.H.; Wei, T.Y. The working principle of the acoustic doppler profiler and its applications in the middle and lower reaches of the Yangtze River. Mar. Sci. 2004, 10, 24–28. [Google Scholar]
  22. Hirsch, C. Numerical Computation of Internal and External Flows: Fundamentals of Computational Fluid Dynamics, 2nd ed.; Butterworth-Heinemann: Oxford, UK, 2007. [Google Scholar]
  23. Versteeg, H.; Malalasekra, W. An Introduction to Computational Fluid Dynamics: The Finite Volume Method, 2nd ed.; Prentice Hall: London, UK, 2007. [Google Scholar]
  24. Moukalled, F.; Mangani, L.; Darwish, M. The Finite Volume Method in Computational Fluid Dynamics: An Advanced Introduction with OpenFOAM and Matlab; Springer: Cham, Switzerland, 2016. [Google Scholar]
  25. Luo, C.; He, Y.; Shang, Y.; Cong, X.; Ding, C.; Cheng, L.; Lei, S. Flow Characteristics and Anti-Vortex in a Pump Station with Laterally Asymmetric Inflow. Processes 2022, 10, 2398. [Google Scholar] [CrossRef]
  26. Cong, G.H.; Wang, F.J. Applicability of turbulence models in numerical simulation of vortex flow in pump sump. Trans. Chin. Soc. Agric. Eng. 2008, 6, 31–35. [Google Scholar]
  27. Cheng, J.R. Turbulence Model and Finite Analysis Method; Shanghai Jiao Tong University Press: Shanghai, China, 1989. [Google Scholar]
  28. He, Z.Q.; Mu, Z.W.; Li, X.; Xu, L.L. Numerical Simulation of 3-D Flow Field of Inverted Siphon Imports and Exports Based on VOF Method. China Rural Water Hydropower 2012, 3, 94–96. [Google Scholar]
  29. Ge, J.J.; Ma, S.Y.; Li, Z.P.; Fan, M.S.; Wang, Y.F. Study on flow optimization in large transmission channel with siphon. China Rural Water Hydropower 2025, 1–20, in press. [Google Scholar]
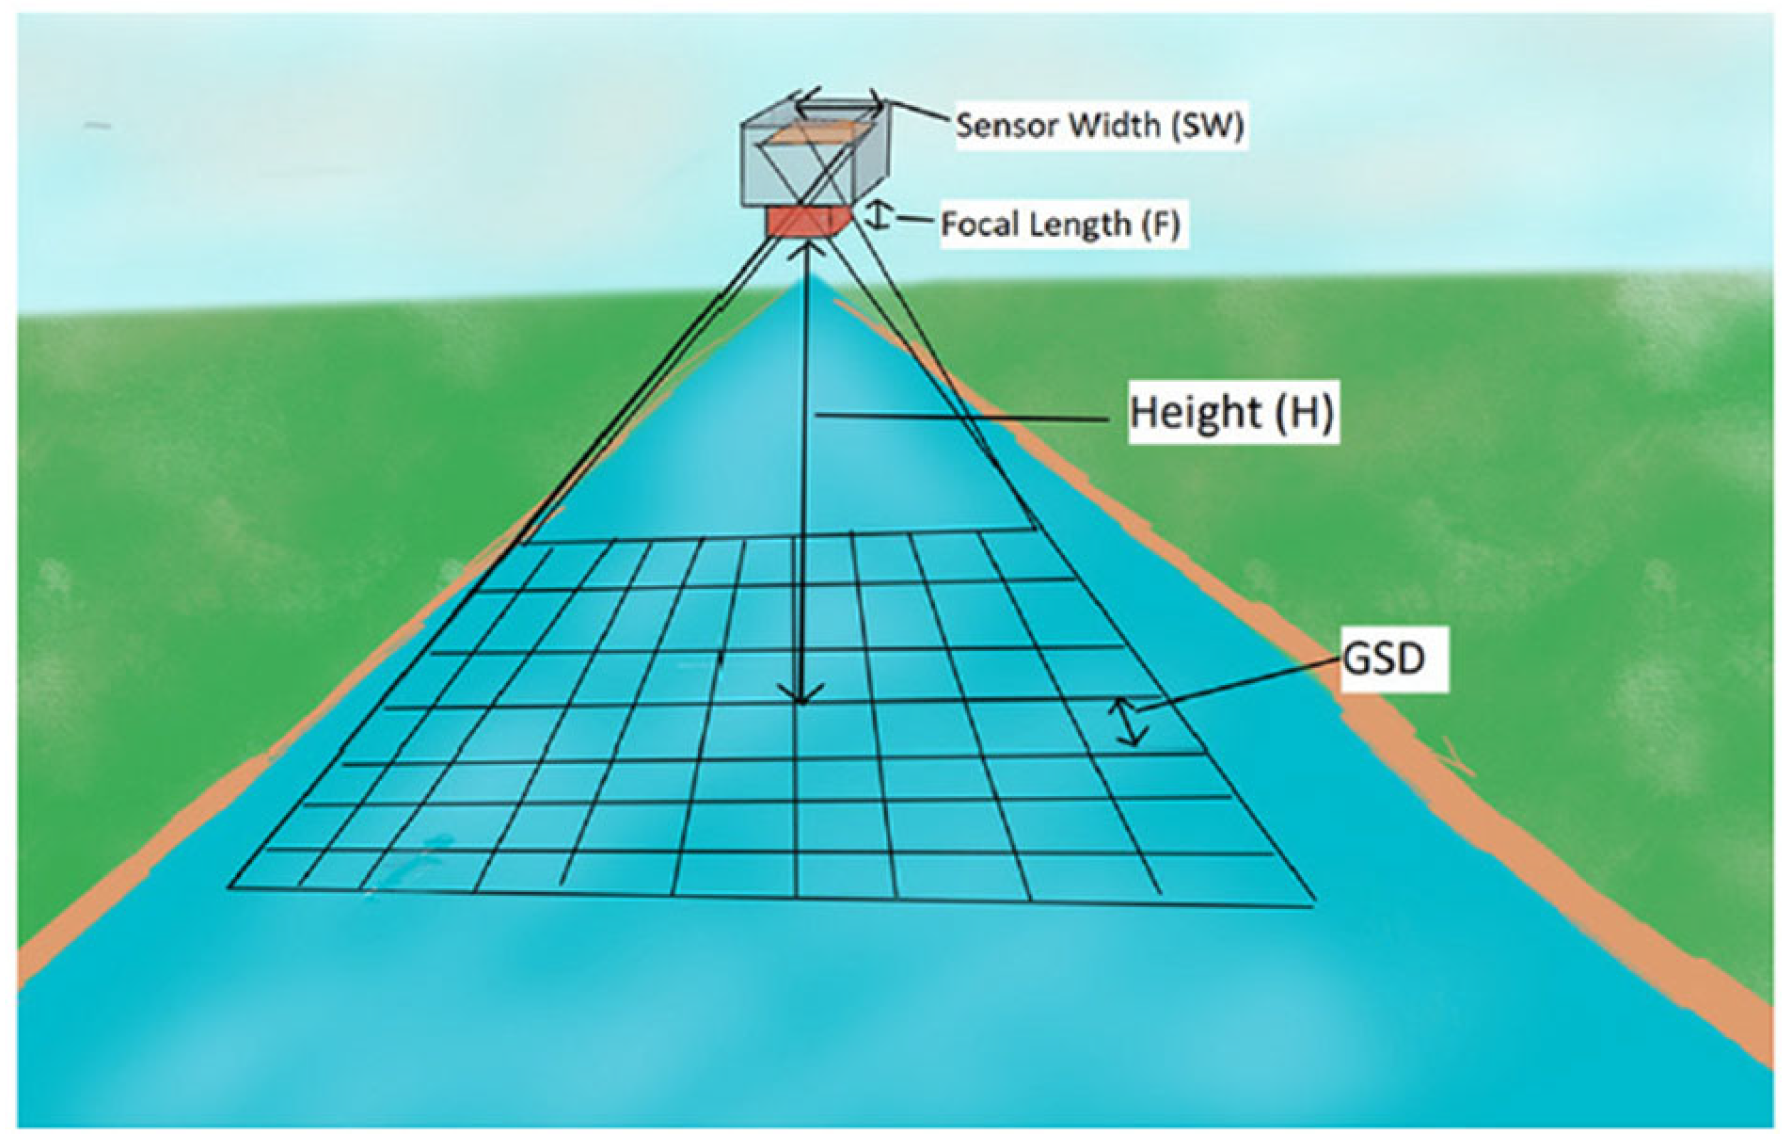
Figure 1. Schematic of the velocity measurement method combining unmanned aerial vehicle (UAV) photography with tracerless surface flow-field measurements.
Water 17 02378 g001
Figure 2. Location and geometric model of the Kuhe inverted siphon. (a) Location of the Kuhe inverted siphon, (b) integral structure of the inverted siphon, and (c) geometric structure of the water outlet side without optimization measures.
Water 17 02378 g002aWater 17 02378 g002b
Figure 3. Grid generation for the Kuhe inverted siphon model. (a) Local grid of the Kuhe inverted siphon and (b) grid division on the water outlet side without optimization measures.
Water 17 02378 g003
Figure 4. Analysis and verification of the cross-sectional velocity 25 m downstream of the outlet pier of the Kuhe inverted siphon.
Water 17 02378 g004
Figure 5. Verification of vorticity results in the surface flow field. (a) Numerical simulation results before the implementation of flow-state optimization measures and (b) on-site test results after the implementation of flow-state optimization measures.
Water 17 02378 g005
Figure 6. Karman vortex street and flow distribution on the outlet side of the inverted siphon (dispatching flow).
Water 17 02378 g006
Figure 7. Karman vortex street and flow distribution on the outlet side of the inverted siphon (design flow).
Water 17 02378 g007
Figure 8. Structural diagram of the diversion piers.
Water 17 02378 g008
Figure 9. Karman vortex street and flow distribution on the outlet side of the inverted siphon (dispatching flow).
Water 17 02378 g009
Figure 10. Karman vortex street and flow distribution on the outlet side of the inverted siphon (design flow).
Water 17 02378 g010
Figure 11. Velocity and vorticity distributions on the surface of the Kuhe inverted siphon under the dispatching flow condition. (a) Distributions of the surface velocity and vorticity before implementation of flow pattern optimization measures and (b) distributions of the surface velocity and vorticity after implementation of flow pattern optimization measures.
Water 17 02378 g011
Figure 12. Comparison of the variation in the suction vorticity along the Kuhe inverted siphon under the dispatching flow condition. (a) Vorticity along the right bank and (b) vorticity along the left bank.
Water 17 02378 g012
Figure 13. The velocity distributions before and after implementation of flow pattern optimization measures for typical sections of the Kuhe inverted siphon. Velocity distributions (a) before implementation of cross-sectional flow pattern optimization measures and (b) after implementation of cross-sectional flow pattern optimization measures. Velocity distributions (c) before implementation of cross-sectional flow pattern optimization measures and (d) after implementation of cross-sectional flow pattern optimization measures.
Water 17 02378 g013
Figure 14. Comparison of the velocity distribution before and after the implementation of flow pattern optimization measures in the section (a) 25 m and (b) 200 m from the Kuhe inverted siphon outlet before and after implementation of flow pattern optimization measures.
Water 17 02378 g014
Table 1. Average water levels (m) at locations 100 m upstream and 200 m downstream of the Kuhe inverted siphon before the implementation of flow pattern optimization measures.
100 m Upstream200 m DownstreamWater Level Difference (cm)
On-site test period 1118.304118.155114.89
On-site test period 2118.2853118.137814.75
On-site test period 3118.2901118.142314.78
On-site test period 4118.2729118.125814.71
On-site test period 5118.2735118.127414.61
On-site test period 6118.2555118.112714.28
Table 2. Average water levels (m) 100 m upstream and 200 m downstream of the Kuhe inverted siphon after the implementation of flow pattern optimization measures.
100 m Upstream200 m DownstreamWater Level Difference (cm)
On-site test period 7118.2179118.080613.73
On-site test period 8118.2179118.080913.7
On-site test period 9118.2169118.081913.9
On-site test period 10118.2189118.083313.56
Disclaimer/Publisher’s Note: The statements, opinions and data contained in all publications are solely those of the individual author(s) and contributor(s) and not of MDPI and/or the editor(s). MDPI and/or the editor(s) disclaim responsibility for any injury to people or property resulting from any ideas, methods, instructions or products referred to in the content.