Abstract
Harnessing the synergistic potential of graphene oxide-doped titanium dioxide (GO-TiO2), this study pioneers an advanced photocatalytic approach by incorporating graphene oxide-doped titanium dioxide (GO-TiO2) as a catalyst to enhance the photocatalytic degradation of levofloxacin (LVX), with optimisation of parameters using response surface methodology (RSM) and artificial neural networks (ANNs). By adjusting key operational parameters such as catalyst dosage, LVX concentration, pH, and percentage dopant in TiO2, the study aimed to maximise degradation efficiency. The RSM statistical model highlighted optimal conditions, i.e., neutral pH, 0.1 g/g dopant, 1.1 g/L catalyst, and 25 ppm LVX concentration, achieving a degradation efficiency close to 80% (R2 = 0.88). An ANN model was also developed, offering a three-layer neural network that accurately predicts LVX degradation under varied conditions, with R2 reaching 0.97. Current modelling techniques frequently fail to strike a balance between practical insights for optimising photocatalytic degradation and predictive accuracy. By combining the parametric insights of RSM with the nonlinear predictive power of ANN, this study closes that gap and develops a sustainable, data-driven framework for effectively breaking down pharmaceutical pollutants and developing environmentally friendly wastewater treatment methods.
1. Introduction
Antibiotics’ ability to effectively inhibit dangerous bacterial species, viruses, and other microorganisms has led to a sharp increase in their use worldwide. A popular fluoroquinolone antibiotic, levofloxacin (LVX), is preferred due to its strong ability to treat bacterial infections. However, aquatic ecosystems and beneficial microorganisms are at risk due to its persistent nature and release into the environment through industrial wastewater, which poses serious toxicological risks [1].
Conventional wastewater treatment methods (physical, chemical, and biological) often fail to remove persistent pharmaceutical pollutants like levofloxacin due to their complex structures and resistance to degradation [2]. This inefficiency underscores the urgent need for sustainable alternatives, such as advanced oxidation-based photocatalytic processes. Among them, TiO2 photocatalysis has shown promise in degrading organic contaminants, yet its reliance on UV light, which constitutes only a small portion of solar radiation, limits practical applications [3,4]. Selecting an optimal light source is crucial for enhancing efficiency while ensuring economic and environmental viability [5,6]. Recently, visible LED light has emerged as a superior alternative, offering greater durability, energy efficiency, and operational safety over conventional UV sources [7]. This study addresses these limitations by exploring graphene oxide-doped TiO2 under visible light, providing a sustainable and effective solution for tackling pharmaceutical pollution in wastewater treatment.
Doping TiO2 significantly enhances its photocatalytic performance by improving light absorption and charge separation compared to pure TiO2, which is primarily active under UV light. This limitation restricts its efficiency in utilising visible light, a major component of natural sunlight [8,9]. Introducing dopants such as metals (Fe, Ag, or Cu) or non-metals (like nitrogen, carbon, or sulphur) alters the electronic structure, allowing the material to absorb visible light more effectively. This expands the photocatalytic activity into the visible spectrum, increasing its potential to degrade pollutants under natural sunlight [10,11]. These modifications reduce the recombination of electron–hole pairs and promote the generation of reactive species, such as hydroxyl radicals, which degrade pollutants effectively under sunlight [12,13].
Metal-doped TiO2 photocatalysts face limitations such as photo corrosion, instability, and poor visible light activity due to the lack of significant bandgap reduction. Metal ions often act as recombination centres, reducing photocatalytic efficiency. Also, thermal instability and the high costs of metal dopants, such as noble metals, hinder their practical applications [14,15].
Non-metal-doped TiO2 offers distinct advantages over their metal-doped counterparts. Non-metal doping narrows the TiO2 bandgap by forming hybrid orbitals above the valence band, enabling visible light absorption. Non-metals also enhance electron–hole pair separation and serves as a conductive network, improving charge transport and reducing recombination rates. Moreover, non-metal-doped TiO2 exhibits more excellent stability and cost-effectiveness, making it ideal for scalable photocatalytic applications [15,16].
Many studies report photocatalytic degradation based on a single parameter, often overlooking the intricate interplay of multiple factors. A systematic approach is essential to understand the combined effects of pH, dopant type, catalyst dosage, and pollutant concentration. Unlike most research limited to 20–25 ppm, we have successfully degraded levofloxacin concentrations up to 100 ppm, addressing real-world industrial challenges where higher pollutant loads demand more effective solutions. Additionally, we emphasise the use of visible light over conventional UV, making the process more cost-effective, environmentally friendly, and safer for long-term application. Our approach also optimises degradation efficiency within just three hours, eliminating the need for prolonged sunlight exposure.
Recently, response surface methodology and artificial neural networks have been shown to provide superior prediction accuracy for nonlinear datasets in diverse domains such as food processing, environmental engineering, and biotechnology [17,18]. To further refine and scale this approach, we employ response surface methodology (RSM) to systematically evaluate and optimise critical operational parameters influencing levofloxacin degradation using GO-TiO2. Coupled with artificial neural network (ANN)-based predictive modelling, this integration provides deeper insights into parameter interactions, ensuring both accuracy and scalability. The findings highlight the enhanced performance of GO-TiO2 under visible light, reinforcing its potential as a sustainable and high-performance solution for pharmaceutical wastewater remediation—an increasingly urgent environmental challenge.
2. Materials and Methods
2.1. Materials
TiO2 material was synthesised through a sol–gel process [19] using titanium tetra isopropoxide (TTIP) (>98%), which was purchased from Spectrochem Pvt. Ltd., Mumbai, India, and isopropanol (IPA) was from Merck Specialities Pvt. Ltd., Mumbai, India. Graphene oxide was obtained from Sigma-Aldrich Chemicals Pvt. Ltd., Bangalore, India, and it was used as a dopant. Ammonia was procured from S D Fine-Chem Limited, Mumbai, India, and was used as a hydrolysis agent. Levofloxacin antibiotic was acquired from Rhombus pharma private limited, Ahmedabad, Gujarat, India. All aqueous solutions were prepared with deionized water.
In our previous study [19], the synthesised graphene oxide (GO)-modified TiO2 photocatalyst was comprehensively characterised to evaluate its structural and optical enhancements. X-ray diffraction (XRD) confirmed the anatase phase formation, with crystallite sizes decreasing from 69.08 nm for pure TiO2 to 51.04 nm for GO-TiO2. Brunauer–Emmett–Teller (BET) surface area analysis revealed a significant increase in surface area for GO-TiO2 (61.3 m2/g) compared to pure TiO2 (15 m2/g), indicating enhanced adsorption capacity. UV–vis spectroscopy showed a bandgap reduction from 3.18 eV to 3.09 eV, promoting better visible light absorption. FTIR spectra exhibited Ti–O–C bonding, confirming successful GO integration. Transmission electron microscopy (TEM) images further revealed a mesoporous structure with uniformly distributed spherical grains. The reaction followed pseudo-first-order kinetics, yielding a rate constant of 0.015 min−1, and it conformed well to the Langmuir–Hinshelwood model.
2.2. Experimental Methods
Levofloxacin (LFX) degradation was evaluated at an initial concentration of 50 ppm using 1 g/L of catalyst under neutral pH and magnetic stirring at 500 rpm, with visible irradiation from a 40 W white LED lamp (peak emission ~455 nm within the visible light range) positioned at a fixed distance of 15 cm from the reaction surface [19]. Bare TiO2 and graphene oxide-modified TiO2 (GO–TiO2) were tested at GO loadings of 0.05, 0.10, and 0.15 g g−1, which corresponded to 1.6%, 2.85%, and 3.1% carbon incorporation, respectively, as confirmed by elemental analysis. After 3 h of irradiation, degradation efficiencies rose from 40% for bare TiO2 to 57%, 86%, and 88% for the 0.05, 0.10, and 0.15 g g−1 GO–TiO2 samples. Degradation (%) and kinetics were calculated via [%] = [(C0 − C)/C0] × 100, where C0 and C are the LFX concentrations (mg L−1) before and after irradiation, as shown in Figure 1, and LFX concentrations were determined against a calibration curve of absorbance versus concentration. To determine the concentration of LFX during the photodegradation experiments, absorbance intensity at λmax of 288 nm was checked using an Agilent Cary 5000i spectrophotometer, Santa Clara, CA, USA.
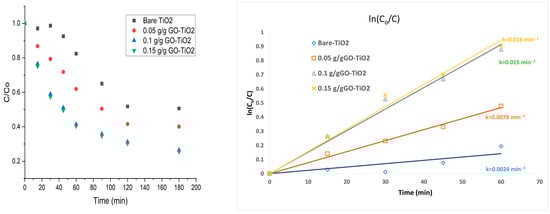
Figure 1.
Degradation of levofloxacin by pseudo-first-order kinetics.
3. Results
3.1. Degradation of LFX
An observation that can be drawn from Figure 1 is that the excessively reduced graphene oxide loading can obstruct the TiO2 component’s ability to capture light, limiting the number of TiO2 sites that reach the excited state, thereby diminishing the catalyst’s photocatalytic efficiency [20]. Hence, after dopant loading of 0.15 g g−1, there is no major change observe compared to 0.1 g g−1. The kinetics of LFX degradation followed a pseudo–first-order Langmuir–Hinshelwood model, which assumes that surface oxidation is rate-determining at full catalyst coverage.
At neutral pH, 0.1 g g−1 graphene oxide-doped TiO2 at about 1g/L, as shown in Figure 2, exhibited enhanced photocatalytic degradation efficiency, primarily due to the adsorption of levofloxacin via the nitrogen atom in its piperazinyl ring, which facilitated ligand-to-metal charge transfer (LMCT). Under basic conditions, LFX tended to adsorb through its carboxylate group, resulting in reduced photocatalytic activity. In acidic environments, the lower degradation performance was attributed to a combined effect of decreased adsorption and the involvement of the ketone–carboxyl functional group of LFX in interacting with the TiO2 surface [1].
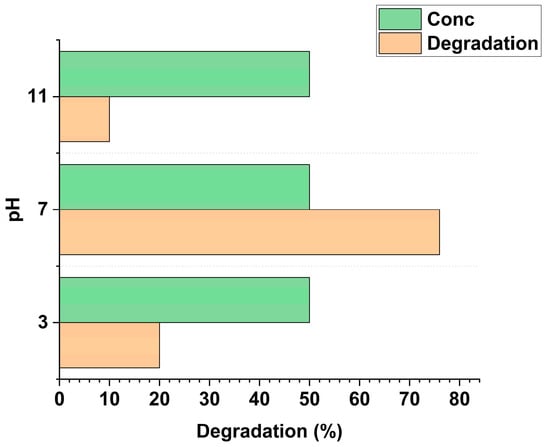
Figure 2.
Degradation of 50 ppm LFX with respect to pH and 0.1 g g−1 graphene oxide-doped TiO2 at 1 g/L catalyst.
GO–TiO2 also exhibited excellent recyclability, as shown in Figure 3, maintaining its activity over three consecutive cycles. The degradation efficiency was recorded as 90%, 86%, 84%, 72%, and 63% from the first to fifth cycle, respectively. The gradual decline in efficiency indicates partial catalyst deactivation, likely due to surface fouling, the adsorption of intermediates, or photocorrosion. The catalytic activities can be regained by using popularly used either thermal or solvent treatment [21]. The enhanced photocatalytic performance is attributed to carbon doping, which increases TiO2’s electrical conductivity and promotes charge transfer from the bulk lattice to the surface.
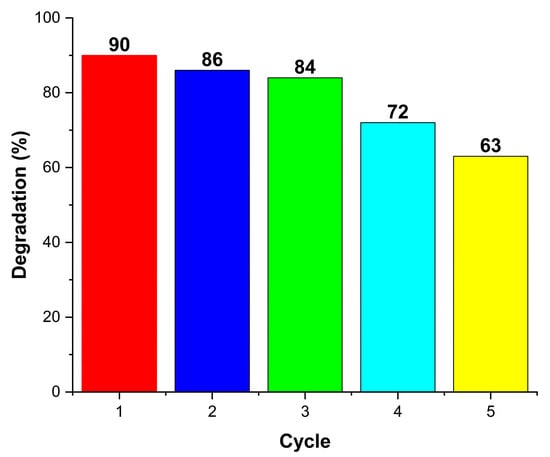
Figure 3.
Recyclability run for five cycles of 0.1 g g−1 graphene oxide-doped TiO2 with respect to 1 g/L catalyst.
A major challenge is to optimise four critical factors, namely pH, dopant type, pollutant concentration, and catalyst dosage. An integrated RSM-ANN framework unlocks a deeper understanding of the nonlinear interactions that drive photocatalytic performance and provides the predictive power needed for reliable scale-up. By systematically exploring each variable with RSM and then refining the parameter space with ANN’s machine learning algorithms, researchers can rapidly identify robust operating conditions while quantifying synergistic effects that traditional designs often miss.
3.2. Response Surface Methodology
The next stage after the single-parameter method is process optimisation. Methodologies like response surface methodology, genetic algorithms, and Taguchi can be used to optimise processes [22,23]. RSM offers a systematic and efficient approach to investigating and optimising the intricate mechanisms of the degradation of persistent pharmaceutical and pesticide compounds [24,25,26,27,28,29,30]. This study aims to delve into the intricacies of the photocatalytic degradation process, shedding light on how RSM can be harnessed to enhance its efficiency and effectiveness [18,24,25,31,32,33].
The selection of an appropriate design approach greatly influences the construction of a response surface and the precision of the predictive model, especially in physicochemical pollutant removal. Key design strategies include full factorial design (FFD), central composite design (CCD), Box–Behnken design (BBD), and Doehlert design (DD) [34,35].
In this study, using Design Expert software (https://www.statease.com/software/design-expert/ (accessed on 6 August 2025)), RSM was used to optimise the degradation of LFX. The four independent parameters chosen for this study were the pH of the solution, the concentration of the solution, catalyst loading, and dopant loading. Central composite design, the most frequently used form of RSM, was employed to evaluate the influence of these four variables across 30 experiments. CCD was selected for its ability to efficiently combine factorial, axial, and centre points, enabling a robust assessment of linear and quadratic effects with fewer experimental runs. Its flexibility in scaling and precise curvature estimation makes CCD particularly suitable for optimising complex processes like LFX degradation [36,37]. The experimental range and levels are as shown in Table 1.

Table 1.
Experimental range and levels of the independent test variable ranges.
3.3. Experimental Results of RSM
Using a cubic composite design approach, RSM was employed to investigate the photocatalytic degradation of LFX using TiO2 particles. The study considered pH, dopant source, catalyst, and pollutant concentration as dependent variables. RSM has been developed for the following models: linear, two-factor interaction (2FI), quadratic, and cubic polynomials to find the best-fitting model. According to these sequential models, the best fit for the developed response is the highest-order polynomial with significant additional terms that was not aliased. Table 2 displays the entire matrix of experimentation results. Table 3 shows model summary statistics based on which we can say that quadratic and cubic fit perfectly, but due to the high level of interaction, quadratic is selected for optimisation.
Table 2.
Experimental CCD for forecasting LFX degradation using GO-TiO2 particles.
Table 3.
Model summary statistics.
Analysis of variance (ANOVA) was applied to evaluate the adequacy of the model [34,36,38]. From the ANOVA of the empirical second-order polynomial model, as shown in Table 4, p-values indicate that the model is highly significant.
Table 4.
Analysis of variance (ANOVA) of the input parameters on degradation efficiency.
In the ANOVA table, the p-value indicates the statistical significance of each factor, interaction, or overall model in influencing the response variable. A p-value less than 0.05 signifies a significant effect, meaning the corresponding term has a meaningful impact on the response. For instance, factors like C-Catalyst (p = 0.0137), D-Pollutant (p = 0.0055), and quadratic terms A2, B2, and C2 (p < 0.05) significantly affect the response. In contrast, others, such as A-pH, B-Dopant, and interactions (e.g., AB, AC), with p-values greater than 0.05, are less influential within the studied range. Additionally, the model’s p-value (<0.0001) confirms that the overall model is statistically significant.
A second-order polynomial (quadratic) equation was used to fit the experimental results of CCD as follows:
where Y represents the response variable (degradation% efficiency), bi, bii, and bij are the regression coefficients for linear and quadratic effects and the coefficients of the interaction parameters, respectively, and xi represents the independent variables studied.
Based on the experiments carried out, a second-order polynomial equation in terms of coded actual factors was found that demonstrates the empirical relationships between the independent variables and the response:
The coded terms A, B, C, and D represent pH, dopant, catalyst dosage, and pollutant concentration. A positive synergic effect indicates a positive impact; a negative antagonistic impact suggests a negative impact [35].
The contour and surface plot, as shown in Figure 4, gives information regarding how the pH varies concerning changes in the dopant source. As we increase the dopant up to 0.1 gm/gm, we can see an increase in degradation under neutral pH conditions. Still, beyond that, we cannot see a significant change in degradation even after varying the pH and dopant. Similarly, a catalyst dosage beyond 1 g/L and neutral pH conditions do not increase degradation significantly. So, from the numerous runs with varying parameters, we can conclude that the optimised dopant and catalyst should be 0.1 g/g and 1 g/L, respectively, to achieve the effective degradation of pollutants.
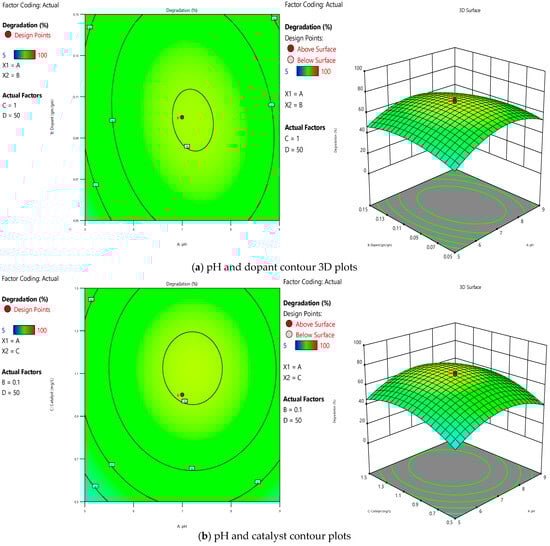
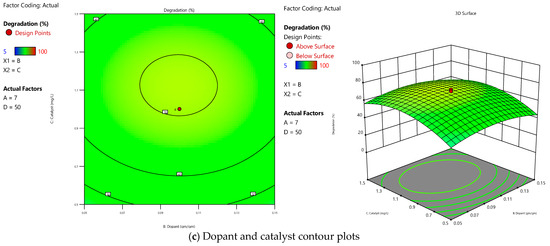
Figure 4.
Response surface 2D and 3D contours for (a) pH and dopant, (b) pH and catalyst, and (c) dopant and catalyst.
As shown in Figure 5, the optimised result can be inferred from the desirability plot, which shows an operating pH around 7, dopant around 0.1 g/g, catalyst dosage near 1.1 g/L, pollutant loading 25 ppm, and degradation achieved close to 80%. After the validation run of the desirability plot, the percentage degradation was 83% based on 288 nm as the maximum wavelength with a shift in peak after 120 min.
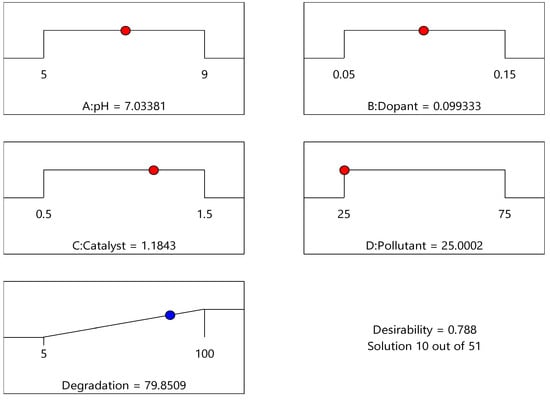
Figure 5.
Desirability plot.
Applying the central composite design approach within RSM provided valuable insights into photocatalytic degradation, identifying critical factors like pH, dopant concentration, catalyst dosage, and pollutant concentration. The quadratic polynomial model, validated through an ANOVA, demonstrated its adequacy in predicting degradation efficiency with high accuracy, as evidenced by the R2 value of 0.8820 and minimal residual errors. The contour and surface plots further clarified the interactions between the key parameters, confirming optimal degradation conditions at pH 7, a dopant concentration of 0.1 g/g, catalyst dosage of 1 g/L, and pollutant concentration of 25 ppm, achieving a predicted degradation near 80%, as per the desirability plot shown in Figure 5.
The RSM results were integrated with an ANN model to enhance the predictive and optimisation capability. This hybrid RSM-ANN approach builds on the robust statistical foundation of RSM while leveraging the flexibility of ANN to capture complex, nonlinear relationships in the system. The following section explores the implementation of the RSM-ANN model, its validation against experimental data, and its scalability for real-world applications in wastewater treatment.
3.4. RSM-ANN Model for Predicting Percentage Degradation
ANNs are powerful for predicting nonlinear and multifaceted models [35,39,40]. Among the various ANN architectures, the multi-layer perceptron (MLP), with its robust feedforward structure, is one of the most widely used for data prediction across numerous fields of science and technology [40,41,42]. The MLP network excels at identifying relationships between dependent and independent variables, even in complex scenarios [43,44,45]. A typical MLP consists of input, hidden, and output layers, as shown in Figure 6. ANN models rely on three key transfer functions, namely exponential sigmoid, tangent sigmoid, and linear functions, which together can form either linear or nonlinear algebraic equations [19,28]. Networks with bias tend to outperform non-biased ones, as bias is applied across all network connections, adding an extra degree of freedom to the system [46].
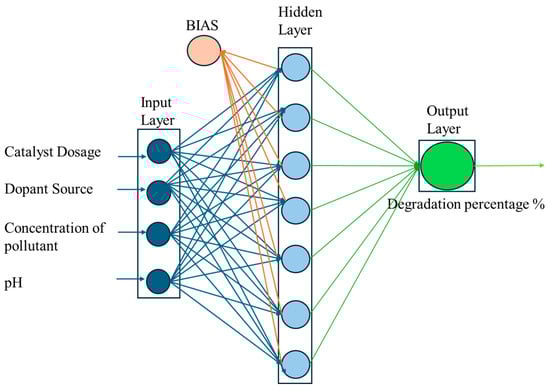
Figure 6.
Multilayer ANN network for the prediction of degradation efficiency with input parameters.
A hybrid RSM-ANN model has been developed to improve the model’s performance based on the data obtained from RSM for optimal degradation forecasting [29,47,48,49]. Data for the ANN model was obtained from photocatalytic experiments designed using the central cubic design based on RSM. In total, 30 experiments were developed through the CCD approach and used as input for fitting the ANN model. The model datasets were split into three parts, namely training (70%), testing (15%), and validation (15%).
The error objectives were set to 0.0001 and Mu at 0.01, employing the Levenberg–Marquardt algorithm. The optimal number of neurons in the hidden layer was determined empirically by evaluating models with 2, 4, 5, 7, 9, 10, 11, 12, 15, and 20 nodes, as illustrated in Figure 7. Among these configurations, the model with 10 neurons in the hidden layer exhibited the best performance in terms of training accuracy and generalisation capability, as assessed by the mean squared error (MSE) and coefficient of determination (R2) metrics. As shown in Figure 8, the ANN model with a 4–10–1 architecture (comprising four input nodes, ten hidden nodes, and one output node) demonstrated superior fitness characteristics.
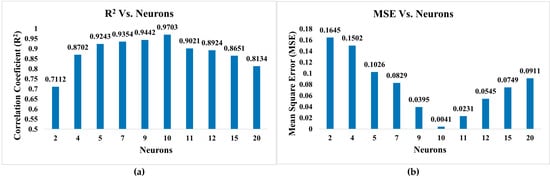
Figure 7.
Comparison of neurons on statistical parameters (a) R2 and (b) MSE.
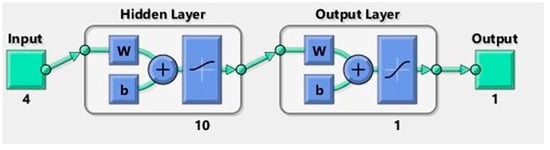
Figure 8.
Network architecture of ANN model.
To further evaluate the model’s performance, we applied k-fold cross-validation with k = 3. The dataset was divided into three equally sized folds, each containing 10 data points. The validation results for each fold are presented in Table 5. These results clearly confirm that the 4–10–1 architecture delivers superior predictive performance. Consequently, this configuration was selected for all subsequent modelling and analysis.
Table 5.
Validation results for each fold with MSE and R2.
Regression analysis was conducted to evaluate the performance of the ANN (4–10–1) architecture by comparing the network outputs with the corresponding targets. The total regression graph, as illustrated in Figure 9, shows the relationship between network outputs and targets. The observed correlation coefficients for training, validation, and testing are 0.9983, 0.9907, and 0.8981, respectively, with a combined correlation coefficient of 0.9704 for all datasets. These high correlation values indicate minimal error in the ANN predictions, demonstrating the model’s accuracy. The close agreement between experimental and predicted values highlights the low prediction error, emphasising the reliability of the ANN in modelling the response.
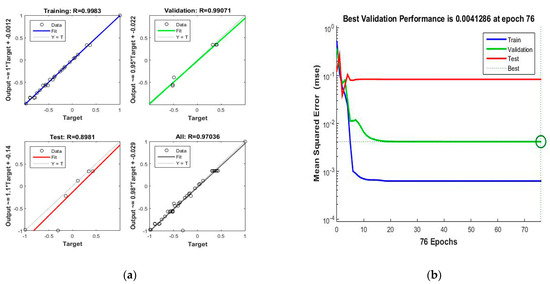
Figure 9.
RSM-ANN model: (a) scatter plots of predicted vs. actual values; (b) MSE plot for training, validation, testing, and all data.
In an ANN, the inputs or features directly influence the behaviour of each neuron through a network of weights and biases. Each input variable, such as pH, catalyst, dopant, and pollutant, is associated with a weight, which reflects the strength and nature of its influence on a given neuron. For instance, as shown in Table 6, the weight associated with pH on neuron N1 is −2.34, while for neuron N2, it is 2.99. This difference in weights indicates that pH has a repressive effect on N1 and an excitatory effect on N2. In other words, a positive weight reflects an excitatory impact, increasing the neuron’s output as the input increases. In contrast, a negative weight indicates a repressive effect, decreasing the neuron’s output as the input increases.
Table 6.
Values of connection weights and biases for the completed neural network model.
Each neuron processes a weighted sum of its inputs. For example, the output of N1 can be calculated as follows:
In this equation, the weights (−2.34, 2.27, 3.37, and −6.28) represent the influence of each respective feature, while the bias term (Bias1) provides additional flexibility, allowing the neuron to adjust its activation threshold. This bias allows the neuron to produce meaningful outputs even when the input value is zero, thus enhancing the network’s capacity to model complex, nonlinear relationships. This step enables the network to model intricate patterns within the data [35].
Biases are often applied at multiple stages within an ANN. In the example above, Bias1 is applied to each neuron individually within a given layer (such as N1 through N10), modifying the neuron’s activation threshold for that specific layer. Additional bias terms like Bias2 may be applied at subsequent or output layers. These biases allow the network to adjust its activation function further, facilitating flexibility and enabling the model to fit the data accurately [23,50].
Ultimately, the neural network leverages these weights and biases to process inputs through multiple layers of neurons, transforming the data and producing a final output. The network optimises these weights and biases through iterative training, learning from the data and capturing the underlying relationships to generalise new data effectively.
4. Conclusions
In summary, the GO-modified TiO2 photocatalyst demonstrated significantly improved photocatalytic activity under visible light, which can be attributed to its enhanced surface area, reduced bandgap, and effective charge separation. These structural and optical improvements, as confirmed in our previous characterisation study [17], contributed to the efficient degradation of levofloxacin and reasonable recyclability across multiple cycles. The findings reinforce the potential of GO–TiO2 as a cost-effective and scalable photocatalyst for wastewater treatment applications.
This study used a combination of single-parameter analysis and RSM based on CCD to successfully determine the ideal conditions for the photocatalytic degradation of LVX. A neutral pH, a pollutant concentration of 25 ppm, a catalyst dosage of 1 g/L, and a dopant source concentration of 0.1 g/g were among the optimised parameters. With an R2 value of 0.88, an adjusted R2 of 0.774, and a significant p-value of 0.0001, a regression model derived from single-parameter experiments was validated by an ANOVA and showed a strong model fit, suggesting a good correlation between the experimental and predicted data. Additionally, the study predicted LVX degradation using a three-layer ANN model, and the outcomes closely matched those from the CCD optimisation. These results highlight the potential of combining ANN and CCD approaches for predictive modelling and optimisation in environmental applications, as well as the efficacy of GO-TiO2 under ideal conditions for pharmaceutical pollutant degradation. This all-encompassing strategy supports the effectiveness of photocatalytic techniques for purifying water and offers a strong foundation for further studies on the degradation of pollutants with cutting edge materials.
Author Contributions
N.G.N. conceptualization, software, formal analysis, writing—original draft; V.G.G. investigation, resources, supervision, fund acquisition, writing—original draft, project administration; S.M. resources, validation, data curation; A.S. visualization, validation, investigation, writing—review and editing; K.J.S. formal analysis, supervision, visualization, writing—review and editing. All authors have read and agreed to the published version of the manuscript.
Funding
This research received no external funding.
Data Availability Statement
The raw data supporting the conclusions of this article will be made available by the authors on request.
Acknowledgments
N.G.N., V.G.G., S.M. and A.S. would like to express their sincere gratitude to Department of Chemical Engineering, Centre of Excellence on Green Technologies and Sustainable Development, Dharmsinh Desai University, Nadiad, Gujarat, India, for their invaluable assistance and direction with our research article. Their admirable commitment to promoting sustainability has substantially enhanced our work. K.J.S. would like to express their gratitude to Nanjing Tech University for their support. The authors thank K.J.S. for sharing their waiver code for this paper.
Conflicts of Interest
The authors declare no conflicts of interest.
References
- Varma, K.S.; Shukla, A.D.; Tayade, R.J.; Mishra, M.K.; Nguyen, V.H.; Gandhi, V. Interaction of Levofloxacin with Reverse Micelle Sol-Gel Synthesized TiO2 Nanoparticles: Revealing Ligand-to-Metal Charge Transfer (LMCT) Mechanism Enhances Photodegradation of Antibiotics under Visible Light. Mater. Lett. 2022, 309, 131304. [Google Scholar] [CrossRef]
- Ghime, D.; Ghosh, P. Advanced Oxidation Processes: A Powerful Treatment Option for the Removal of Recalcitrant Organic Compounds. In Advanced Oxidation Processes—Applications, Trends, and Prospects; IntechOpen: London, UK, 2020; pp. 1–12. [Google Scholar]
- Vaez, M.; Zarringhalam Moghaddam, A.; Alijani, S. Optimization and Modeling of Photocatalytic Degradation of Azo Dye Using a Response Surface Methodology (RSM) Based on the Central Composite Design with Immobilized Titania Nanoparticles. Ind. Eng. Chem. Res. 2012, 51, 4199–4207. [Google Scholar] [CrossRef]
- Emzhina, V.; Kuzin, E.; Babusenko, E.; Krutchinina, N. Photodegradation of Tetracycline in Presence of H2O2 and Metal Oxide Based Catalysts. J. Water Process Eng. 2021, 39, 101696. [Google Scholar] [CrossRef]
- Chauke, N.M.; Mohlala, R.L.; Ngqoloda, S.; Raphulu, M.C. Harnessing Visible Light: Enhancing TiO2 Photocatalysis with Photosensitizers for Sustainable and Efficient Environmental Solutions. Front. Chem. Eng. 2024, 6, 1356021. [Google Scholar] [CrossRef]
- Kutuzova, A.; Dontsova, T.; Kwapinski, W. Application of TiO2-Based Photocatalysts to Antibiotics Degradation: Cases of Sulfamethoxazole, Trimethoprim and Ciprofloxacin. Catalysts 2021, 11, 728. [Google Scholar] [CrossRef]
- Roulová, N.; Hrdá, K.; Kašpar, M.; Peroutková, P.; Josefová, D.; Palarčík, J. Removal of Chloroacetanilide Herbicides from Water Using Heterogeneous Photocatalysis with TiO2/UV-A. Catalysts 2022, 12, 597. [Google Scholar] [CrossRef]
- Varma, K.S.; Shukla, A.D.; Tayade, R.J.; Joshi, P.A.; Das, A.K.; Modi, K.B.; Gandhi, V.G. Photocatalytic Performance and Interaction Mechanism of Reverse Micelle Synthesized Cu-TiO2 Nanomaterials towards Levofloxacin under Visible LED Light. Photochem. Photobiol. Sci. 2022, 21, 77–89. [Google Scholar] [CrossRef]
- Areerachakul, N.; Sakulkhaemaruethai, S.; Johir, M.A.H.; Kandasamy, J.; Vigneswaran, S. Photocatalytic Degradation of Organic Pollutants from Wastewater Using Aluminium Doped Titanium Dioxide. J. Water Process Eng. 2019, 27, 177–184. [Google Scholar] [CrossRef]
- Kislik, V.S. Examples of Application of Solvent Extraction Techniques in Chemical, Radiochemical, Biochemical, Pharmaceutical, Analytical Separations, and Wastewater Treatment. In Solvent Extraction Classical and Novel Approaches; Elsevier: Amsterdam, The Netherlands, 2012; ISBN 9780444537782. [Google Scholar]
- Awfa, D.; Ateia, M.; Fujii, M.; Yoshimura, C. Novel Magnetic Carbon Nanotube-TiO2 Composites for Solar Light Photocatalytic Degradation of Pharmaceuticals in the Presence of Natural Organic Matter. J. Water Process Eng. 2019, 31, 100836. [Google Scholar] [CrossRef]
- Nair, N.; Gandhi, V.; Shukla, A.; Ghotekar, S.; Nguyen, V.H.; Varma, K. Mechanisms in the Photocatalytic Breakdown of Persistent Pharmaceutical and Pesticide Molecules over TiO2-Based Photocatalysts: A Review. J. Phys. Condens. Matter 2024, 36, 413003. [Google Scholar] [CrossRef]
- Rekhate, C.V.; Srivastava, J.K. Recent Advances in Ozone-Based Advanced Oxidation Processes for Treatment of Wastewater—A Review. Chem. Eng. J. Adv. 2020, 3, 100031. [Google Scholar] [CrossRef]
- Hua, L.; Yin, Z.; Cao, S. Recent Advances in Synthesis and Applications of Carbon-Doped TiO2 Nanomaterials. Catalysts 2020, 10, 1431. [Google Scholar] [CrossRef]
- Basavarajappa, P.S.; Patil, S.B.; Ganganagappa, N.; Reddy, K.R.; Raghu, A.V.; Reddy, C.V. Recent Progress in Metal-Doped TiO2, Non-Metal Doped/Codoped TiO2 and TiO2 Nanostructured Hybrids for Enhanced Photocatalysis. Int. J. Hydrogen Energy 2020, 45, 7764–7778. [Google Scholar] [CrossRef]
- Marschall, R.; Wang, L. Non-Metal Doping of Transition Metal Oxides for Visible-Light Photocatalysis. Catal. Today 2014, 225, 111–135. [Google Scholar] [CrossRef]
- Ciric, A.; Krajnc, B.; Heath, D.; Ogrinc, N. Response Surface Methodology and Artificial Neural Network Approach for the Optimization of Ultrasound-Assisted Extraction of Polyphenols from Garlic. Food Chem. Toxicol. 2020, 135, 110976. [Google Scholar] [CrossRef]
- Desai, N.N.; Soraganvi, V.S.; Madabhavi, V.K. Solar Photocatalytic Degradation of Organic Contaminants in Landfill Leachate Using TiO2 Nanoparticles by RSM and ANN. Nat. Environ. Pollut. Technol. 2020, 19, 651–662. [Google Scholar] [CrossRef]
- Nair, N.G.; Gandhi, V.G.; Modi, K.; Shukla, A. Photocatalytic Degradation of Levofloxacin by GO-TiO2 under Visible Light. Mater. Today Proc. 2024, in press. [Google Scholar] [CrossRef]
- Yu, L.; Xu, W.; Liu, H.; Bao, Y. Titanium Dioxide—Reduced Graphene Oxide Composites for Photocatalytic Degradation of Dyes in Water. Catalysts 2022, 12, 1340. [Google Scholar] [CrossRef]
- Gandhi, V.G.; Mishra, M.K.; Joshi, P.A. A Study on Deactivation and Regeneration of Titanium Dioxide during Photocatalytic Degradation of Phthalic Acid. J. Ind. Eng. Chem. 2012, 18, 1902–1907. [Google Scholar] [CrossRef]
- Sandhu, Z.A.; Raza, M.A.; Farwa, U.; Nasr, S.; Yahia, I.S.; Fatima, S.; Munawar, M.; Hadayet, Y.; Ashraf, S.; Ashraf, H. Response Surface Methodology: A Powerful Tool for Optimizing the Synthesis of Metal Sulfide Nanoparticles for Dye Degradation. Mater. Adv. 2023, 4, 5094–5125. [Google Scholar] [CrossRef]
- Joshi, S.; Bajpai, S.; Jana, S. Application of ANN and RSM on Fluoride Removal Using Chemically Activated D. Sissoo Sawdust. Environ. Sci. Pollut. Res. 2020, 27, 17717–17729. [Google Scholar] [CrossRef] [PubMed]
- Galedari, M.; Ghazi, M.M.; Mirmasoomi, S.R. Photocatalytic Process for the Tetracycline Removal under Visible Light: Presenting a Degradation Model and Optimization Using Response Surface Methodology (RSM). Chem. Eng. Res. Des. 2019, 145, 323–333. [Google Scholar] [CrossRef]
- Jawad, A.H.; Alkarkhi, A.F.M.; Mubarak, N.S.A. Photocatalytic Decolorization of Methylene Blue by an Immobilized TiO2 Film under Visible Light Irradiation: Optimization Using Response Surface Methodology (RSM). Desalin. Water Treat. 2015, 56, 161–172. [Google Scholar] [CrossRef]
- Norouzi, M.; Fazeli, A.; Tavakoli, O. Phenol Contaminated Water Treatment by Photocatalytic Degradation on Electrospun Ag/TiO2 Nanofibers: Optimization by the Response Surface Method. J. Water Process Eng. 2020, 37, 101489. [Google Scholar] [CrossRef]
- Rafaely, R.X.; Sabatini, C.A.; Zaiat, M.; Azevedo, E.B. Perfluorooctane Sulfonic Acid (PFOS) Degradation by Optimized Heterogeneous Photocatalysis (TiO2/UV) Using the Response Surface Methodology (RSM). J. Water Process Eng. 2021, 41, 101986. [Google Scholar] [CrossRef]
- Soltani-nezhad, F.; Saljooqi, A.; Shamspur, T.; Mostafavi, A. Photocatalytic Degradation of Imidacloprid Using GO/Fe3O4/TiO2-NiO under Visible Radiation: Optimization by Response Level Method. Polyhedron 2019, 165, 188–196. [Google Scholar] [CrossRef]
- Kassahun, S.K.; Kiflie, Z.; Kim, H.; Baye, A.F. Process Optimization and Kinetics Analysis for Photocatalytic Degradation of Emerging Contaminant Using N-Doped TiO2-SiO2 Nanoparticle: Artificial Neural Network and Surface Response Methodology Approach. Environ. Technol. Innov. 2021, 23, 101761. [Google Scholar] [CrossRef]
- Modi, S.; Rao, M.S.; Gupta, T.C.S.M.; Yang, M. Uncertainty Modeling of a Chemical System with a Flexible Node by Mapping the Fault Tree into the Response Surface Method. Ind. Eng. Chem. Res. 2023, 62, 3206–3220. [Google Scholar] [CrossRef]
- Chandrika, K.C.; Prabhu, T.N.; Kiran, R.R.S.; Krishna, R.H. Applications of Artificial Neural Network and Box-Behnken Design for Modelling Malachite Green Dye Degradation from Textile Effluents Using TiO2 Photocatalyst. Environ. Eng. Res. 2022, 27, 200553. [Google Scholar]
- Marizcal-Barba, A.; Sanchez-Burgos, J.A.; Zamora-Gasga, V.; Perez Larios, A. Study of the Response Surface in the Photocatalytic Degradation of Acetaminophen Using TiO2. Photochem 2022, 2, 225–236. [Google Scholar] [CrossRef]
- Zulfiqar, M.; Samsudin, M.F.R.; Sufian, S. Modelling and Optimization of Photocatalytic Degradation of Phenol via TiO2 Nanoparticles: An Insight into Response Surface Methodology and Artificial Neural Network. J. Photochem. Photobiol. A Chem. 2019, 384, 112039. [Google Scholar] [CrossRef]
- Gadore, V.; Singh, A.K.; Mishra, S.R. OPEN RSM Approach for Process Optimization of the Photodegradation of Congo Red by a Novel NiCo2S4/Chitosan Photocatalyst. Sci. Rep. 2024, 14, 1118. [Google Scholar] [CrossRef] [PubMed]
- Vishnuganth, M.A.; Remya, N.; Kumar, M.; Selvaraju, N. Carbofuran Removal in Continuous-Photocatalytic Reactor: Reactor Optimization, Rate-Constant Determination and Carbofu ran Degradation Pathway Analysis. J. Environ. Sci. Health-Part B Pestic. Food Contam. Agric. Wastes 2017, 52, 353–360. [Google Scholar] [CrossRef]
- Maiti, M.; Srivastava, V.K.; Shewale, S.; Jasra, R.V.; Chavda, A.; Modi, S. Process Parameter Optimization through Design of Experiments in Synthesis of High Cis-Polybutadiene Rubber. Chem. Eng. Sci. 2014, 107, 256–265. [Google Scholar] [CrossRef]
- Modi, S.; Tiwari, A.K.; Rao, M.S.; Snigdha, T.; Saritha, T.; Gupta, T.C.S.M.; Kumar, A. A Practical Approach for Kinetic Analysis of Hydrogenation of Complex Mineral Base Oil. Korean J. Chem. Eng. 2023, 40, 1804–1814. [Google Scholar] [CrossRef]
- Rufina, R.D.J.; Uthayakumar, H.; Thangavelu, P. Prediction of the Size of Green Synthesized Silver Nanoparticles Using RSM-ANN-LM Hybrid Modeling Approach. Chem. Phys. Impact 2023, 6, 100231. [Google Scholar] [CrossRef]
- Giwa, A.; Yusuf, A.; Balogun, H.A.; Sambudi, N.S.; Bilad, M.R.; Adeyemi, I.; Chakraborty, S.; Curcio, S. Recent Advances in Advanced Oxidation Processes for Removal of Contaminants from Water: A Comprehensive Review. Process Saf. Environ. Prot. 2021, 146, 220–256. [Google Scholar] [CrossRef]
- Das, S.; Moon, S.; Kaur, R.; Sharma, G.; Kumar, P.; Lavrenčič Štangar, U. Artificial Neural Network Modeling of Photocatalytic Degradation of Pollutants: A Review of Photocatalyst, Optimum Parameters and Model Topology. Catal. Rev.-Sci. Eng. 2024, 67, 544–578. [Google Scholar] [CrossRef]
- Patel, T.; Rao, M.S.; Gandhi, D.; Purohit, J.L.; Shah, V.A. Machine Learning-Based Fault Estimation of Nonlinear Descriptor Systems. Int. J. Autom. Control 2023, 18, 1–29. [Google Scholar] [CrossRef]
- Gandhi, D.; Srinivasarao, M. Fault Estimation for Multi-Rate Descriptor Systems Using Bi-Directional Long Short-Term Memory Neural Network. Can. J. Chem. Eng. 2024, 103, 3247–3269. [Google Scholar] [CrossRef]
- Gandhi, D.; Srinivasarao, M. Fault Detection and Diagnosis for Multi-Rate Descriptor Systems Using a Combination of Extended Kalman Filter and Support Vector Machines. J. Taiwan Inst. Chem. Eng. 2025, 174, 106227. [Google Scholar] [CrossRef]
- Wu, Y.; Feng, J. Development and Application of Artificial Neural Network. Wirel. Pers. Commun. 2018, 102, 1645–1656. [Google Scholar] [CrossRef]
- Zou, J.; Han, Y.; So, S.-S. Overview of Artificial Neural Networks. In Artificial Neural Networks Methods and Applications; Humana Press: Totowa, NJ, USA, 2009; pp. 14–22. [Google Scholar]
- Rekhate, C.V.; Shrivastava, J.K. Decolorization of Azo Dye Solution by Ozone Based Advanced Oxidation Processes: Optimization Using Response Surface Methodology and Neural Network. Ozone Sci. Eng. 2020, 42, 492–506. [Google Scholar] [CrossRef]
- Rosenblatt, F. The Perceptron: A Probabilistic Model for Information Storage and Organization in the Brain. Psychol. Rev. 1958, 65, 386–408. [Google Scholar] [CrossRef]
- Schossler, R.T.; Ojo, S.; Jiang, Z.; Hu, J.; Yu, X. A Novel Interpretable Machine Learning Model Approach for the Prediction of TiO2 Photocatalytic Degradation of Air Contaminants. Sci. Rep. 2024, 14, 13070. [Google Scholar] [CrossRef]
- Hosseini, O.; Zare-Shahabad, V.; Ghaedi, M.; Ahmadi Azqhandi, M.H. Experimental Design, RSM and ANN Modeling of Tetracycline Photocatalytic Degradation Using LDH@CN. J. Environ. Chem. Eng. 2022, 10, 108345. [Google Scholar] [CrossRef]
- Ayodele, B.V. Backpropagation Neural Networks Modelling of Photocatalytic Degradation of Organic Pollutants Using TiO2-Based Photocatalysts. J. Chem. Technol. Biotechnol. 2020, 95, 2739–2749. [Google Scholar] [CrossRef]
Disclaimer/Publisher’s Note: The statements, opinions and data contained in all publications are solely those of the individual author(s) and contributor(s) and not of MDPI and/or the editor(s). MDPI and/or the editor(s) disclaim responsibility for any injury to people or property resulting from any ideas, methods, instructions or products referred to in the content. |
© 2025 by the authors. Licensee MDPI, Basel, Switzerland. This article is an open access article distributed under the terms and conditions of the Creative Commons Attribution (CC BY) license (https://creativecommons.org/licenses/by/4.0/).