Abstract
In river-connected lake regions, both land use and hydrological regime changes may affect the ecosystem services; however, few studies have attempted to elucidate their complex influences. In this study, the spatiotemporal dynamics of eight ecosystem services (crop production, aquatic production, water yield, soil retention, flood regulation, water purification, net primary productivity, and habitat quality) were investigated through remote-sensing images and the InVEST model in the Dongting Lake Region during 2000–2020. Results revealed that crop and aquatic production increased significantly from 2000 to 2020, particularly in the northwestern and central regions, while soil retention and net primary productivity also improved. However, flood regulation, water purification, and habitat quality decreased, with the fastest decline in habitat quality occurring at the periphery of the Dongting Lake. Land-use types accounted for 63.3%, 53.8%, and 40.3% of spatial heterogeneity in habitat quality, flood regulation, and water purification, respectively. Land-use changes, particularly the expansion of construction land and the conversion of water bodies to cropland, led to a sharp decline in soil retention, flood regulation, water purification, net primary productivity, and habitat quality. In addition, crop production and aquatic production were higher in cultivated land and residential land, while the accompanying degradation of flood regulation, water purification, and habitat quality formed a “production-pollution-degradation” spatial coupling pattern. Furthermore, hydrological fluctuations further complicated these dynamics; wet years amplified agricultural outputs but intensified ecological degradation through spatial spillover effects. These findings underscore the need for integrated land-use and hydrological management strategies that balance human livelihoods with ecosystem resilience.
1. Introduction
Ecosystem services refer to the direct and indirect benefits provided by natural ecosystems [1], encompassing functions such as food supply, water purification, flood regulation, and soil retention [2]. These services constitute the foundation for human survival and development [3]. With the intensification of global warming and anthropogenic activities, the pressure on ecosystems continues to escalate, leading to the degradation of over 50% of global ecosystem services [4]. Consequently, sustainable utilization of these services has emerged as a critical global challenge [5].
Land-use change serves as a critical indicator of ecosystem disturbance by anthropogenic activities [6]. With the growth in the global population and expansion of economic activities, overexploitation of land resources has substantially damaged regional ecosystems [7]. Land-use change severely affects the structure, function, and spatial distribution of ecosystems, thereby altering their ability to provide services [8,9]. For example, urbanization and agricultural expansion cause the fragmentation and loss of natural habitats, undermining key ecosystem services, such as water conservation, soil conservation, and habitat quality [10]. Additionally, increased agricultural or construction land reduces vegetation cover, which in turn reduces the carbon storage capacity of ecosystems [11]. These changes not only affect immediate ecosystem services but may also have profound implications for long-term ecological security and human well-being [12]. Therefore, analyzing the spatiotemporal relationships between land-use change and ecosystem services is essential for enhancing ecosystem service functions and maintaining ecosystem health.
In addition to land-use change, the hydrological regime is also a key factor that affects the structure, function, and services of large lake regions, particularly those naturally connected to rivers [13]. The hydrological regime includes water level fluctuations, flow variations, and hydrological connectivity [14]. The hydrological regimes of river-connected lakes have changed owing to climate warming and upstream hydraulic projects, affecting the ecosystem services of regions [15]. For example, the implementation and operation of the Three Gorges Dam in the upper reaches of the Yangtze River reduced the flow into the lake and affected the water storage capacity of downstream lakes [16]. Furthermore, hydrological fluctuations may change the nutrient dynamics and material circulation in lakes, exacerbate the risk of eutrophication, and affect the self-purification capacity of water bodies [17]. Most previous studies focused on the impact of the hydrological regime on the vegetation pattern, soil characteristics, and water quality of lake wetlands. However, relatively few studies have examined how hydrological alteration affects the ecosystem service function of river-connected lake regions, especially in the context of land-use change.
Dongting Lake is the second-largest freshwater lake in China, and the basin is crucial for flood control, food supply, and ecological security [18]. Owing to long-term socio-economic development and population pressure, the Dongting Lake Region has experienced serious ecological and environmental problems [19]. For example, agricultural reclamation, rapid urbanization, and the increase in construction land in the Dongting Lake region have caused the fragmentation and loss of natural habitats [20]. Long-term wetland reclamation has led to wetland area shrinkage and ecosystem function degradation [21]. Furthermore, the hydrological regime of Dongting Lake has substantially changed since the operation of the Three Gorges Dam in 2003. The annual highest and mean water levels declined, and the water body area decreased [14], leading to changes in the water environment and flood regulation capacity [22]. Nevertheless, few studies have attempted to quantify the combined influence of land use and hydrological regimes on ecosystem services in large lake regions.
In this study, we analyzed the impacts of land use and hydrological regimes on eight ecosystem services (crop production, aquatic production, water yield, soil conservation, flood regulation, water purification, net primary productivity (NPP), and habitat quality) in the Dongting Lake Region from 2000 to 2020. Specifically, this study aimed to (1) clarify the temporal dynamics and spatial distribution of the ecosystem services in the Dongting Lake region, and (2) explore the impact of land-use changes on ecosystem services, and detect whether hydrological changes amplify or mitigate the impact of land-use changes on ecosystem services. This study aimed to provide a scientific basis for the ecological security and sustainable development of ecosystems in river-connected lake regions.
2. Materials and Methods
2.1. Study Area
The Dongting Lake Region (DTR) is located in the middle reach of the Yangtze River, which is affiliated with Hunan Province, China (28°39′–30°05′ N, 109°50′–114°15′ E; Figure 1).
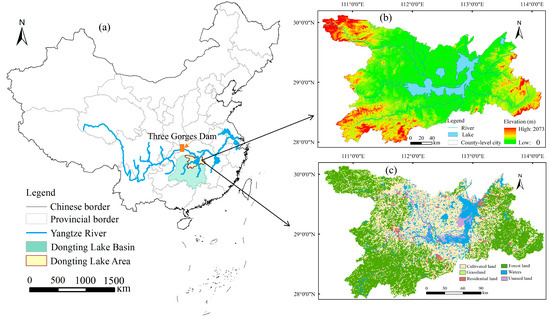
Figure 1.
Location and topography of the Dongting Lake Region, China. (a) Location of the study area; (b) spatial distribution of the elevation; (c) land-use classification in 2020.
The region has a total area of 45,175 km2 and a subtropical humid monsoon climate. The average annual temperature is approximately 16.5–17.0 °C, with four distinct seasons and simultaneous rain and heat. The annual rainfall is 1200–1450 mm, with precipitation concentrated in spring and summer [23]. As wetlands of international importance, Dongting Lake supports rich biodiversity, provides habitats for several endangered species, and regulates the flooding of the Yangtze River Basin. Furthermore, the DTR is an important commercial grain base and inland fishing center in China, providing the surrounding area with indispensable water resources to support agricultural, industrial, and domestic water needs.
2.2. Data Collection and Processing
The digital elevation model (DEM) of Dongting Lake Region was obtained from the Shuttle Radar Topography Mission digital elevation dataset provided by the Geospatial Data Cloud (http://www.gscloud.cn/, accessed on 18 June 2025). The spatial resolution was 90 m. Soil features were obtained from the Harmonized World Soil Database (HWSD) with a spatial resolution of 1 km, including soil type, root depth, and soil physical and chemical properties (https://www.isric.org/explore/wise-databases, accessed on 18 June 2025). Land-use data were derived from geometric correction, image fusion splicing, and human-visual interpretation of Landsat satellite data through the Google Earth Engine (https://earthengine.google.com/, accessed on 18 June 2025), with a spatial resolution of 30 m.
Daily precipitation and surface runoff data were derived from the ERA5-Land dataset. The annual rainfall of each pixel was obtained by summing the precipitation data of each pixel, the daily precipitation of which was >50 mm. Daily water level data (8:00 AM) were obtained from the Hydrology and Water Resources Survey Bureau of Hunan Province (https://slt.hunan.gov.cn/hnsw/, accessed on 18 June 2025). Hydrological frequency analysis was used to classify water levels in Dongting Lake from 2000 to 2020. The 25th and 75th percentiles of water level were selected as thresholds to classify wet (p ≤ 25%), normal (25% < p < 75%), and dry (p ≥ 75%) years.
The crop and aquatic productions of each county in the DTR in 2000, 2010, and 2020 were obtained from the Yueyang Statistical Yearbook, Yiyang Statistical Yearbook, Changde Statistical Yearbook, and EPS data platform (https://www.epsnet.com.cn/index.html#/Index, accessed on 18 June 2025). The surface area of Dongting Lake in 2000, 2010, and 2020 was obtained from the Ministry of Water Resources of the People’s Republic of China (http://www.mwr.gov.cn/, accessed on 18 June 2025). The NPP of vegetation was obtained from the MOD17A1 dataset provided by the United States Geological Survey with a spatial resolution of 500 m (https://www.usgs.gov/, accessed on 18 June 2025).
2.3. Methods
2.3.1. Quantification of Ecosystem Services
The Dongting Lake region, connected to the Yangtze River, has developed a range of vital ecosystem services—including robust flood regulation, food supply, and rich biodiversity—shaped by its unique geographical location and geological origins. Based on these features, and balancing data availability with the spatio-temporal resolution required for robust quantification, we selected eight specific services to capture the region’s key ecological functions: crop production, aquatic production, water yield, soil retention, flood regulation, water purification, net primary productivity (NPP), and habitat quality. The general framework for assessing the ecosystem services in the Dongting Lake region from 2000 to 2020 is shown in Figure 2.
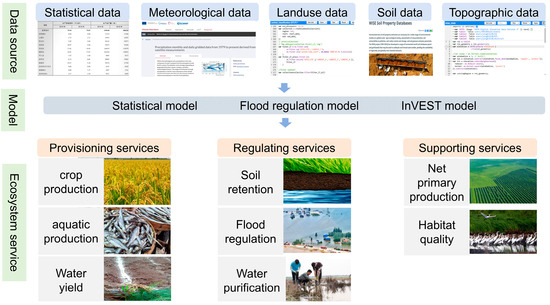
Figure 2.
Schematic diagram for assessing ecosystem services.
Crop production (CP) efficiency was used to measure CP services and was calculated by dividing the CP of each county by its area. CP was estimated using the final grain harvest of cultivated land during the calendar year, including rice, wheat, corn, soybeans, and potatoes.
Aquatic production (AP) efficiency was used as an indicator of AP services and was calculated by dividing the AP of each county by its area. AP was assessed based on the final catch of farmed and non-farmed aquatic products, comprising fish, crustaceans (shrimp and crabs), shellfish, cephalopods, and algae, in the freshwater area.
Water yield (WY) was estimated using the annual WY module of InVEST. The input data for the module included precipitation, soil depth, land use, potential evapotranspiration, and vegetation available water content.
Soil retention (SR) was estimated using the sediment delivery ratio module of InVEST. The input data for the module included DEM, precipitation, land use, soil texture, and soil and water conservation measures.
The lake flood regulation (FR) service was estimated based on the quantitative relationship between water storage and the DTR. The vegetation flood storage was evaluated using the quantitative relationship between rainstorm precipitation and surface runoff.
where FR1 is the FR capacity of the lake, A is the area of the lake during the flood period, FR2 is the FR capacity of vegetation, Pri is the storm precipitation in vegetation type i, Rri is the storm runoff in vegetation type i, and Ai is the area of vegetation type i.
Water purification (WP) was estimated using the InVEST nutrient delivery ratio module. The input data for the module included DEM, land use, precipitation, nutrient load, threshold flow accumulation, and the Borselli K parameter. The default value of the Borselli K parameter was 2.
Net primary production (NPP) is the mass of organic matter remaining after subtracting the portion consumed by respiration from the total amount of organic matter produced by the plant through photosynthesis over a given period. NPP is an important measure of the carbon sequestration capacity of Earth’s vegetation.
The habitat quality (HQ) was estimated using the InVEST HQ module. The input data for the module included land-use change, land-use type, ecological processes, and external threats.
2.3.2. Post-Classification Comparison
Post-classification comparison is a method used for analyzing and evaluating classification results, and is usually applied in fields such as remote sensing image processing, Geographic Information System data analysis, and text classification [24,25]. In this study, post-classification comparison was used to evaluate significant differences in ecosystem services among the different land-use types. First, the single-period land-use classification map (e.g., 2020) was integrated with the spatial distribution data of ecosystem service values (e.g., NPP, WY, and SR) for the same period. Using the Zonal Statistics of Geographic Information System (GIS), the spatial superposition of land-use type and service value was applied to extract the mean value of service indicators (e.g., the average NPP of cultivated land and average WY of forest land) of each type in the corresponding region. Subsequently, ANOVA was used to test the significance of the mean differences among multiple groups (such as cropland, forest land, and watershed). If the data did not satisfy the assumptions of normality or chi-squared, the Kruskal–Wallis H nonparametric test was used to quantitatively reveal the regulatory effects of different land-use types on ecosystem services.
In addition, post-classification comparison was used to evaluate significant differences in ecosystem services in different hydrological years of the same land-use type. First, land-use classification maps of different hydrological years and spatial data of ecosystem services in the corresponding years were integrated. The service values of specific land-use types in different hydrological years were extracted through a geospatial overlay analysis to form paired datasets (e.g., WP of forestland in wet years and that in normal years). Subsequently, data normality was verified using the Shapiro–Wilk test. If the normal distribution was satisfied (p > 0.05), a paired t-test was used to analyze the mean difference. Otherwise, the Wilcoxon signed-rank test was used for nonparametric analysis.
2.3.3. Geographical Detectors
The extent to which land use and hydrological year explained the spatial variability in ecosystem service functions was explored using a geographic detector. First, land-use classification maps (such as cultivated land and forest land) were converted into discrete spatial layers (coded 1–6). Water level thresholds were divided into wet, normal, and dry years to generate discrete temporal stratification data. The ecosystem service values (NPP, FR, and WP) for each year were extracted as continuous variables. Next, based on the discrete independent and continuous dependent variables, the geographic detector model was used to calculate the factor contribution. The specific formula was as follows:
where q is the degree of factor explanation, with larger values indicating a stronger contribution of the factor to the spatial variation in the ecosystem service. L denotes the factor stratification numbers, and Nh and σh2 are the sample number and variance of layer h, respectively [26].
2.3.4. Interaction Effect Model
The interaction effect model was used to quantify how hydrological changes moderate the land use–ecosystem service relationship. First, we constructed a difference-in-differences framework by dividing the study period into distinct hydrological phases, with land-use change (LUC = 1 if converted between 2000 and 2020, 0 otherwise) as the treatment variable. To mitigate covariate imbalances (e.g., topography, soil) between LUC groups, we applied 1:1 nearest-neighbor propensity score matching (caliper = 0.02), ensuring post-matching absolute standardized mean differences <0.10. Then, interaction effect regression was performed on the balanced sample. The specific formula was as follows:
where ∆ESi is the ecological services variation of pixel i. Luci denotes land-use change, Hi denotes hydrological conditions, xi is the control variables, including the slope, soil type, population density, and altitude of pixel i. β3 is the coefficient of the interaction term. β3 captures the moderating effect of hydrology year (β3 > 0: amplification, β3 < 0: mitigation). All continuous covariates were standardized by z-score, and the standard errors were estimated using HC3 robust estimation. ui denotes the spatial interdependence of variables. The specific formula was as follows:
where ρ is the spatial autoregressive coefficient, and W denotes the spatial weight matrix.
2.4. Model Validation
The simulation results of eight ecosystem services were evaluated for accuracy using three methods: “comparison of field observation data”, “reference of results from similar studies”, and “independent remote sensing inversion and multi-source cross-validation” (Table 1).

Table 1.
Validation results of ecosystem services simulation.
The verification results revealed that CP showed moderate agreement with Landsat-8 NDVI inversion results (R2 = 0.72, RMSE = 0.61 t/km2). Aquatic production achieved 68% accuracy in aquaculture area extraction with 13% bias via Sentinel-2 data. Water yield demonstrated reliable runoff simulation using hydrological station data (NSE = 0.70, R2 = 0.75). Soil retention and HQ showed 70% spatial overlap and a Kappa coefficient of 0.75, respectively, compared to previous studies. Flood regulation and WP met field validation requirements with ≤15% flood storage relative error and ±10% TP concentration deviation. NPP showed strong consistency with Landsat-8 CASA model results (R2 = 0.80, RMSE = 45 gC/m2). Overall, the simulation accuracy of the eight ecosystem services varied, meeting basic ecological modeling standards.
3. Results
3.1. Variations in Land Use and Hydrology
The major land-use types in the DTR were forest land, cultivated land, and water bodies (Figure 3).
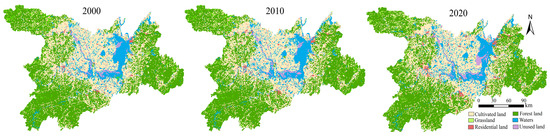
Figure 3.
Land-use distribution of Dongting Lake Region in 2000, 2010, and 2020.
During 2000–2020, cultivated land areas declined the most, followed by water bodies and grasslands (Table 2). Cultivated land was mainly converted into forest land (3540 km2) and water bodies (1086 km2). Water bodies were predominantly transformed into cultivated land (1205 km2), and grasslands were predominantly transformed into forest land (335 km2). In addition, from 2000 to 2020, the residential land area increased the most, followed by unused and forest land (Table 2).
Table 2.
Land-use transfer matrix from 2000 to 2020 in the Dongting Lake Region (unit: km2).
Residential land was predominantly converted from cultivated land (781 km2), unused land was mainly transformed from water (444 km2), and forested land was predominantly converted from cultivated land (3540 km2). Overall, the study area underwent a large-scale transformation between forest land, cultivated land, and water, exhibiting a decrease in farmland and water bodies and an increase in forest and construction land.
The water level of Dongting Lake fluctuated during 2000–2020, ranging from 23.61 to 26.44 m. Dry years were 2006, 2007, 2009, 2011, and 2018, and wet years were 2002, 2005, 2012, 2016, and 2020 (Figure 4a). Furthermore, water level differed significantly among the different hydrological years (p < 0.05), with average levels of 24.22, 25.18, and 25.87 m in dry, normal, and wet years, respectively (Figure 4b).
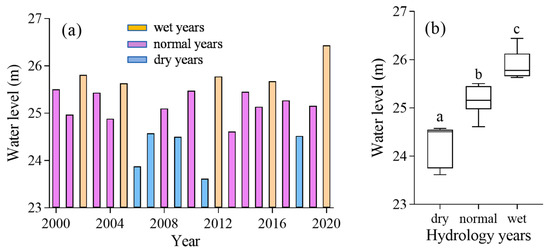
Figure 4.
(a) Water level variations in Dongting Lake during 2000–2020. (b) Comparison of different hydrological years. Different letters indicate significant differences at the 0.05 significance level.
3.2. Changes to Ecosystem Services
In the DTR, the spatial distribution of AP was similar to that of CP, with higher values in the central region and lower values in the western and eastern regions. Water yield increased in the south, decreased in the north, and decreased from south to north. The spatial distribution of SR was similar to that of NPP, with lower values in the central region and higher values in the northwest, southwest, and southeast regions. Higher FR areas were predominantly located in Dongting and its sub-lake. Lower FR areas were predominantly in the west. The WP capacity of DTR was evaluated by estimating the phosphorus outputs. Areas with high WP capacity and low HQ were predominantly in the areas surrounding Dongting Lake. High HQ areas were mainly located in the northwest, southwest, and southeast corners of Dongting Lake (Figure 5).
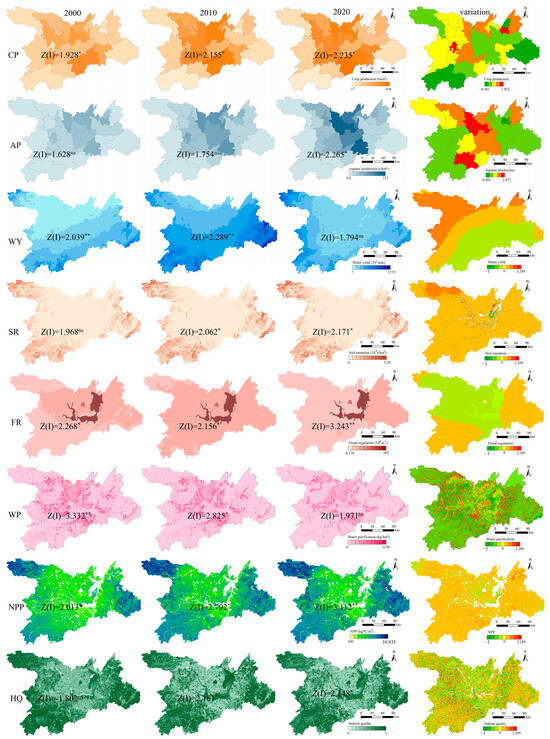
Figure 5.
Spatiotemporal distribution and variations in ecosystem services in Dongting Lake Region from 2000 to 2020. Z(I) was used to measure the significance of spatial autocorrelation. Significance levels: ns p > 0.05, * p < 0.05, ** p < 0.01.
From 2000 to 2020, average CP increased from 173.25 to 222.33 t/km2, and average AP increased from 19.79 to 40.74 t/km2. CP and AP increased in the northwestern and central regions, respectively. The average WY increased from 367.49 in 2000 to 433.93 mm in 2020, increasing in the north and decreasing in the south. SR and NPP generally increased over time. Average FR decreased from 2000 to 2020, predominantly decreasing in the northwest and increasing in the southwest and east of Dongting Lake. The average WP capacity and HQ decreased during 2000–2020, with HQ decreasing predominantly in areas surrounding Dongting Lake. Conversely, the WP capacity in areas surrounding Dongting Lake increased.
3.3. Relationship Between Ecosystem Services and Land Use and Hydrological Factors
Significant differences in ecosystem services were detected across land-use types (Figure 6). CP and AP were lower in forestland and grassland and higher in cultivated land, water, residential land, and unused land. Conversely, WY, SR, and NPP were higher in forestland and grassland and lower in cultivated land, water bodies, residential land, and unused land. FR was higher in water and unused land and lower in other land-use types. WP was higher in cultivated land and lower in other land-use types. HQ was lower in cultivated and residential land, however, higher in forestland, grassland, water, and unused land. Furthermore, land-use type could explain 63.3%, 53.8%, and 40.3% of the spatial variability in HQ, FR, and WP, respectively, and >30% of that in AP, NPP, SR, and CP (Figure 6).
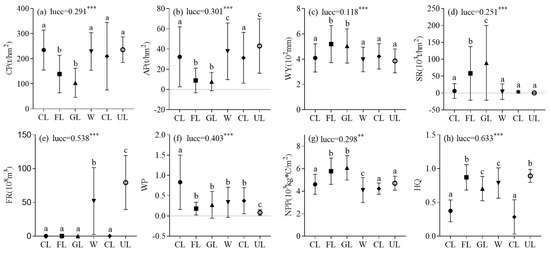
Figure 6.
Comparison of ecosystem services under the different land-use types. Different letters indicate significant differences at the 0.05 significance level; lucc is the degree of explanation of spatial heterogeneity of ecosystem services by land-use type in the Dongting Lake Region. CL, cultivated land; FL, forest land; GL, grassland; W, waters; RL, residential land; UL, unused land. Significance levels: ** p < 0.01, and *** p < 0.001.
Cropland-to-woodland conversion typically decreased the growth rates of CP, AP, and WP, while increasing the NPP growth rate and transitioning FR and HQ from decreasing to increasing (Figure 7).
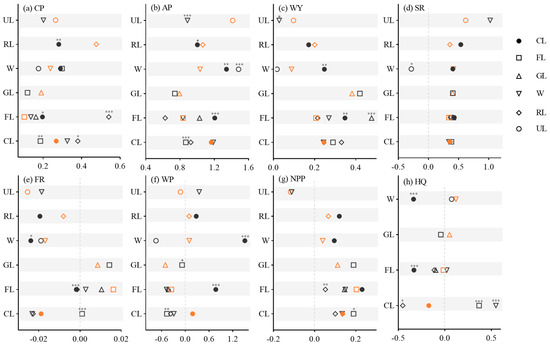
Figure 7.
Change rate of ecosystem services under land-use type changes from 2000 to 2020. The vertical axis is the land-use type in 2000. The symbols denote the land-use type in 2020. The orange markers represent the change rate of ecosystem services with the same land-use type from 2000 to 2020, which serves as a baseline. The asterisks indicate that the rate of change of the ecosystem services is significantly different from that of the baseline. Significance levels: * p < 0.05, ** p < 0.01, and *** p < 0.001.
The rates of increase in CP and decline in HQ both accelerated when cropland was transformed into construction land (Figure 7a,h). The rates of increase in CP, AP, and WY increased after the conversion of woodland to cropland, whereas FR and HQ transitioned from increasing to decreasing. The conversion of forest land to construction land accelerated the CP increase rate, whereas the NPP increase rate decelerated (Figure 7a,g). The conversion of water to cropland rapidly increased the AP, WY, and WP, rapidly decreased FR, and caused HQ to transition from increasing to decreasing. The conversion of water into construction land increased the AP growth rate, whereas SR shifted from increasing to decreasing (Figure 7b,d). The transformation of unused land into water slowed the rate of increase in AP and WY (Figure 7b,c).
The direct effects of the interaction term coefficients (LUC × H) were positive and statistically significant at the 10% level (Table 3). This indicated that hydrological conditions (i.e., the shift from normal to wet years) significantly amplified the ecological service responses induced by land-use changes. The spatial lag terms were significant for WY (ρ = 0.18, p = 0.03) and NPP (ρ = 0.22, p = 0.02), indicating that changes in ecosystem services in adjacent pixels (e.g., upstream runoff) could affect local outcomes. Additionally, the lagged interaction terms were positive for SR (θ3 = 15.32, p = 0.08) and WY (θ3 = 8.74, p = 0.09), indicating that the hydrological amplification effect has a cross-spatial scale impact.
Table 3.
Results of the interaction effect model.
Significant differences in ecosystem services were detected across hydrological years for the same land-use type (Figure 8).
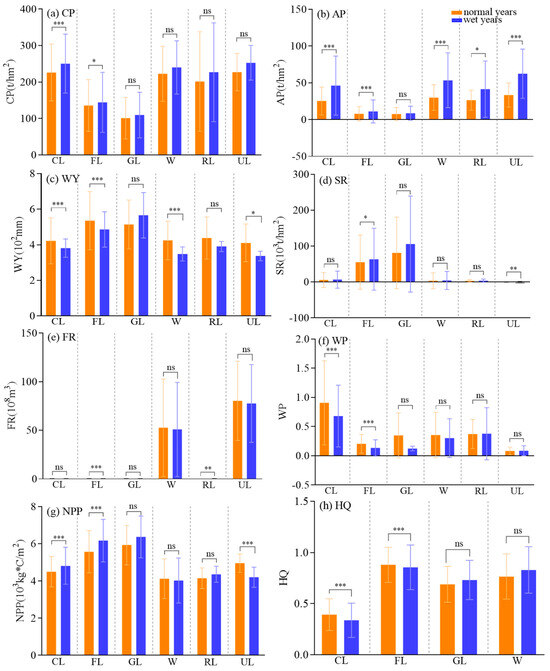
Figure 8.
Comparison of ecosystem services for two hydrological years under the same land-use type. CL, cultivated land; FL, forest land; GL, grassland; W, waters; RL, residential land; UL, unused land. Significance levels: ns p > 0.05, * p < 0.05, ** p < 0.01, and *** p < 0.001.
CP and NPP in croplands and woodlands were higher in wet years than in normal years, whereas WP and HQ exhibited the opposite trend (Figure 8a,f–h). AP was significantly higher in wet years than in normal years for all land types except grassland (Figure 8b). SR in forest and unused land was significantly higher in wet years than in normal years (Figure 8d). WY was significantly higher in normal years than in wet years for cropland, forest land, watersheds, and unused land (Figure 8c). FR was higher in normal years than in wet years in forested and residential land (Figure 8e).
4. Discussion
4.1. Spatiotemporal Heterogeneity of Ecosystem Services
This study revealed the significant spatial heterogeneity of ecosystem services in the DTR (Figure 5). The observed “high in the middle and low in the periphery” pattern of CP and AP may be related to the continuous distribution of cultivated land and the intensive agricultural model in the central region [28,29]. The synergistic enhancement in SR and NPP in marginal areas may be attributed to the high proportion of ecological land distribution (such as forest land and grassland) in the northwestern, southwestern, and southeastern corners. This was consistent with the findings of the study by Zhang et al. [30], who revealed that vegetation coverage is positively correlated with ecological functions. In addition, the lake-center agglomeration feature of FR confirmed the core role of wetland ecosystems in FR [31].
Crop production and AP increased from 2000 to 2020 (Figure 5), consistent with regional agricultural trends driven by technological advances and policy support in similar lake basins [32,33]. The concentrated increase in AP in the central region of Dongting Lake aligns with the findings of Yuan et al. (2024) and Ma et al. (2023), whose studies indicate that river-connected lakes exhibit higher AP owing to their ability to maintain natural hydrological connectivity [21,34]. Our result showed that the areas of increasing phosphorus loss and HQ degradation overlapped significantly and were distributed around Dongting Lake, which coincides with the intensive agricultural zones. This indicated a potential spatial coupling between agricultural intensification and ecological degradation. Yang et al. (2020) [14] used remote sensing and field surveys to determine that the flood regulation in Dongting Lake decreased significantly over the past four decades. This is consistent with the results of our study. Previous studies indicated that this phenomenon may be attributed to sediment deposition, lake reclamation for agriculture, and altered hydrological interactions between the Yangtze River and Dongting Lake.
4.2. Ecological Service Responses to Land-Use Change
Cultivated and residential lands exhibited higher CP and AP but also saw increases in WP and declines in HQ (Figure 6a,b,f,h), aligning with the “production—pollution—degradation” cycle hypothesis [35,36,37]. In contrast, woodlands and grasslands had higher SR and NPP, underscoring their vital role in soil and water conservation and carbon sequestration [35]. Water bodies and unused land displayed notable FR advantages, consistent with the established importance of natural surface hydrological processes [38]. The lake’s strong FR is associated with synergies between physical holding capacity (e.g., volume) and ecological buffering (e.g., wetland vegetation slowing runoff)—a mechanism documented in freshwater systems [39]. Similarly, unused land like beaches may enhance temporary flood storage via high permeability and low flow resistance, as noted in hydrological studies [40].
Land cover transition caused significant changes in ecosystem services (Figure 7). The observed pattern, cropland-to-forest conversion decelerating CP and AP growth while increasing NPP and HQ, reflected a typical trade-off between agricultural production and ecological conservation. This dynamic is widely documented in land-use transition studies [41]. Therefore, it is necessary to balance the interests of multiple stakeholders through ecological compensation mechanisms [42]. The conversion of water bodies to cropland was associated with sharp declines in FR, deteriorated HQ, and surges in WP (Figure 7e,f,h). This aligns with documented risks of wetland encroachment: such conversions threaten flood control safety, disrupt lake ecological integrity, and exacerbate phosphorus loss by agricultural non-point source pollution [43]. The expansion of construction land showed negative associations with SR, NPP, and HQ (Figure 7d,g,h), consistent with the “hardened surface—habitat fragmentation—biodiversity loss” chain reaction identified in urban ecology studies [44,45]. Meanwhile, the conversion of forest land to cropland increased crop yield but decreased vegetation coverage and infiltration capacity, weakening FR [46,47]. In addition, land-use types had the highest interpretations of HQ, FR, and WP, indicating that these services were the most sensitive to land-cover change and could be core indicators for regional ecological control.
4.3. Modulation Effects of Hydrological Fluctuations on Ecosystem Services
The hydrological regime regulated the supply capacity of ecosystem services (Figure 8). The significant increase in CP in cropland and forest and AP across most land types (except grassland) in wet years (Figure 8a,b) highlighted the substantial role of hydrological conditions on ecosystem services. Similarly, Xue (2025) [48] found that food production capacity increases in wet years owing to adequate water supply, which facilitates photosynthesis and nutrient inputs from watersheds. The WY in water and cultivated land was higher in normal years (Figure 8c), which is consistent with the findings of Song et al. (2017) [43] and Yang et al. (2019) [49]. They suggested that vegetation evapotranspiration enhancement and saturated soil storage limit runoff production in wet years [50,51]. The observed divergence in SR and FR of forest land between wet and dry years reflected hydrological–vegetation feedback under water surplus conditions. Previous studies have shown that forest SR increases in wet years owing to enhanced vegetation interception and litter buffering, which reduce runoff velocity and promote sediment deposition [36,52]. Conversely, the decreased FR in wet years likely results from the “saturation switch effect”: once rainfall exceeds canopy retention limits, rapid runoff ensues, overwhelming soil infiltration and reducing FR compared to normal years [52]. The FR of residential land was higher in normal years than in wet years, consistent with Berton et al. (2024) [53]. They found that conventional drainage networks effectively convey runoff, maintaining FR at a natural capacity during normal years. However, extreme rainfall events exceed infrastructure design limits, leading to system overload and a reduction in FR.
The wet years amplified land-use impacts on ecosystem services (Table 3). This effect varied by service type: NPP and SR exhibited the strongest amplification, consistent with their “water dependency” [54]; in contrast, FR and HQ showed weaker effects, constrained by both land-use structure and hydrological extremes [40]. The spatial lag coefficients of WY and NPP were significantly positive, confirming that the upstream regulatory capacity or vegetation productivity could directly affect the downstream through strong hydrological connectivity. The interaction spatial spillover term of SR and WY was positive, indicating that in wet years, changes in upstream land use further enhance the downstream ecological service response, achieving cross-scale amplification. For specific conversions, wet years exacerbated HQ decline from cropland-to-construction land conversion and FR degradation from woodland-to-cropland conversion, highlighting the need to strengthen control over such conversions in wet years to avoid the “cumulative degradation” of ecosystem services.
4.4. Implications for Lake Region Management
The results of this study revealed that the CP and AP were high in the middle and low in the east and west, while the SR and HQ were low in the middle and high in the periphery. Central regions are key grain bases dominated by cultivated land. Field surveys (Yuanjiang, Hanshou, China) showed a multiple-cropping index >1.8 and >35% of Hunan’s grain output. Peripheral areas had over 65% forest coverage and a soil erosion modulus below 500 t/(km2·a). Moreover, previous studies showed that central weak areas (e.g., the East Dongting floodplain) have lost 12% of wetlands to reclamation since 2000 [55]. Therefore, spatial zoning control should be adopted. Industries should focus on efficiency in the high-yield central area, protection red lines should be set in the peripheral areas, and ecological restoration should be conducted in the weak central areas. In addition, forest land and grassland had obvious advantages regarding WY, SR, and NPP. Water bodies and unused land were of great significance to FR. Specifically, forest NPP is 1.8×, grassland SR 2.3×, and water-body FR 3.2× higher than that of cropland. Meanwhile, previous studies in East Dongting Lake have shown that the “returning farmland to lakes” project implemented since 1998 has increased the flood storage capacity [56]. Therefore, land-use optimization strategies should be adopted to enhance ecological services, such as promoting the return of farmland to grassland and lakes. Furthermore, in wet years, food yield increased, but so did flood risk. Therefore, hydrological adaptability management should be adopted. In wet years, the embankments should be strengthened, and flood-tolerant breeding varieties should be selected. In normal years, water areas were ecologically restored, such as through the removal of 1300 aquaculture cages, which improved hydrological connectivity and wetland functions. Ultimately, a “spatial zoning control–land use optimization–hydrology adaptability management” framework was formed.
5. Conclusions
Our results showed that FR, WP, and HQ declined during 2000–2020, and water body conversion to cropland further degraded these supporting and regulating services. Ecological buffer zones should be demarcated around water areas to avoid excessive reclamation and to protect aquatic ecosystems. In addition, construction land expansion led to a decline in SR, NPP, and HQ. Furthermore, wet years increased water yields but posed ecological risks to forests and croplands. Therefore, construction land layout should be optimized, the construction and maintenance of flood control facilities should be strengthened, and the negative impact of construction land expansion and wet years on the ecosystem should be alleviated. These findings provide a scientific basis for enhancing the ecosystem services of river-connected lake regions in the context of anthropogenic and hydrological changes.
However, this study had limitations that require further exploration in future work. First, some parameters in the ecosystem service assessment models mainly refer to literature values from regions with similar environmental conditions. Although the parameters have been validated in previous studies, the overall model lacks validation owing to a scarcity of observational data. Second, the InVEST model used in this study is a static model. Although the use of flood-season data mitigated some limitations, it inadequately simulated continuous ecological dynamics. Future research should integrate dynamic models such as SWAT to quantify the real-time interactive effects between hydrology and land use through comparative validation.
Author Contributions
Y.H.: conceptualization, methodology, and writing—original draft. X.C.: methodology and writing—review and editing. Y.Z.: data curation. L.Z.: investigation and data collection. All authors have read and agreed to the published version of the manuscript.
Funding
This work was supported by the Hunan Province Social Science Fund Project (23YBQ092), the Scientific Research Project of the Hunan Provincial Department of Education (23B0641), the National Natural Science Foundation of China (32471657), and the Hunan Province Natural Science Fund Project (2024JJ6214).
Data Availability Statement
The raw data supporting the conclusions of this article will be made available by the authors on request.
Conflicts of Interest
The authors declare that they have no known competing financial interests or personal relationships that could have appeared to influence the work reported in this paper.
References
- Bennett, E.M.; Peterson, G.D.; Gordon, L.J. Understanding relationships among multiple ecosystem services. Ecol. Lett. 2009, 12, 1394–1404. [Google Scholar] [CrossRef]
- Sterner, R.W.; Keeler, B.; Polasky, S.; Poudel, R.; Rhude, K.; Rogers, M. Ecosystem services of Earth’s largest freshwater lakes. Ecosyst. Serv. 2020, 41, 101046. [Google Scholar] [CrossRef]
- Chaplin-Kramer, R.; Sharp, R.P.; Weil, C.; Bennett, E.M.; Pascual, U.; Arkema, K.K.; Brauman, K.A.; Bryant, B.P.; Guerry, A.D.; Haddad, N.M.; et al. Global modeling of nature’s contributions to people. Science 2019, 366, 255–258. [Google Scholar] [CrossRef] [PubMed]
- MA (Millennium Ecosystem Assessment). Ecosystems and their services. In Ecosystems and Human Well-Being: A Framework for Assessment; Island Press: Washington, DC, USA, 2003. [Google Scholar]
- Zhang, J.; Wang, M.; Liu, K.; Chen, S.; Zhao, Z. Social-ecological system sustainability in China from the perspective of supply-demand balance for ecosystem services. J. Clean. Prod. 2025, 27, 145039. [Google Scholar] [CrossRef]
- Feng, Z.; Jin, X.; Chen, T.; Wu, J. Understanding trade-offs and synergies of ecosystem services to support the decision-making in the Beijing-Tianjin-Hebei region. Land Use Policy 2021, 106, 105446. [Google Scholar] [CrossRef]
- Dai, X.; Wang, L.; Huang, C.; Fang, L.; Wang, S.; Wang, L. Spatio-temporal variations of ecosystem services in the urban agglomerations in the middle reaches of the Yangtze River, China. Ecol. Indicat. 2020, 115, 106394. [Google Scholar] [CrossRef]
- Lawler, J.J.; Lewis, D.J.; Nelson, E.; Plantinga, A.J.; Polasky, S.; Withey, J.C.; Helmers, D.P.; Martinuzzi, S.; Pennington, D.; Radeloff, V.C. Projected land-use change impacts on ecosystem services in the United States. Proc. Natl. Acad. Sci. USA 2014, 111, 7492–7497. [Google Scholar] [CrossRef]
- Qin, J.; Ye, H.; Lin, K.; Qi, S.; Hu, B.; Luo, J. Assessment of water-related ecosystem services based on multi-scenario land use changes: Focusing on the Poyang Lake Basin of southern China. Ecol. Indic. 2024, 158, 111549. [Google Scholar] [CrossRef]
- Liu, W.; Zhan, J.; Zhao, F.; Yan, H.; Zhang, F.; Wei, X. Impacts of urbanization-induced land-use changes on ecosystem services: A case study of the Pearl River Delta Metropolitan Region, China. Ecol. Indic. 2019, 98, 228–238. [Google Scholar] [CrossRef]
- Jin, T.; Zhang, P.; Zhou, N.; Li, S. Unveiling the spatiotemporal heterogeneity and driving mechanisms of carbon storage changes in response to land use/land cover changes under different future scenarios: Insights from the GMOP-SEM model. J. Clean. Prod. 2025, 487, 144622. [Google Scholar] [CrossRef]
- Huang, C.; Huang, X.; Peng, C.; Zhou, Z.; Teng, M.; Wang, P. Land use/cover change in the Three Gorges Reservoir area, China: Reconciling the land use conflicts between development and protection. Catena 2019, 175, 388–399. [Google Scholar] [CrossRef]
- Li, B.; Yang, G.; Wan, R.R.; Lai, X.J.; Wagner, P.D. Impacts of hydrological alteration on ecosystem services changes of a large river-connected lake (Poyang Lake), China. J. Environ. Manage. 2022, 310, 114750. [Google Scholar] [CrossRef] [PubMed]
- Yang, L.; Wang, L.; Yu, D.; Yao, R.; Lia, C.; He, Q. Four decades of wetland changes in Dongting Lake using Landsat observations during 1978–2018. J. Hydrol. 2020, 587, 124954. [Google Scholar] [CrossRef]
- Vilbaste, S.; Jarvalt, A.; Kalpus, K.; Noges, T.; Pall, P.; Piirsoo, K.; Tuvikene, L.; Noges, P. Ecosystem services of Lake Vortsjarv under multiple stress: A case study. Hydrobiologia 2016, 780, 145–159. [Google Scholar] [CrossRef]
- Peng, H.; Tang, Z.; Chen, Z.; Wu, Y.; Yuan, Y.; Shi, Q.; Li, L.; Chen, H. Geospatial perspective for monitoring SDG 6.6.1 based on spatial and temporal analysis of lake water storage variations in Dongting Lake, China. J. Hydrol.-Reg. Stud. 2025, 57, 102175. [Google Scholar] [CrossRef]
- Li, B.; Wan, R.; Yang, G.; Wang, S.; Wagner, P.D. Exploring the spatiotemporal water quality variations and their influencing factors in a large floodplain lake in China. Ecol. Indicat. 2020, 115, 106454. [Google Scholar] [CrossRef]
- Deng, C.; Shen, X.; Liu, C.; Liu, Y. Spatiotemporal characteristics and socio-ecological drivers of ecosystem service interactions in the Dongting Lake Ecological Economic Zone. Ecol. Indicat. 2024, 167, 112734. [Google Scholar] [CrossRef]
- Huang, Y.; Chen, X.; Zhu, L. Exploring Trade-Offs/Synergies and Drivers of Ecosystem Services in the Dongting Lake Area, China. Sustainability 2025, 17, 1650. [Google Scholar] [CrossRef]
- Zhang, J.; Yang, F.; Duan, N.; Zheng, B.; Xiong, S.; Xu, Y. Spatial transition and obstacle factor diagnosis based on the evaluation of the quality of arable land use in plain Lake Areas: A case study of the Dongting Lake region. Ecol. Indic. 2024, 169, 112881. [Google Scholar] [CrossRef]
- Yuan, L.; Geng, M.; Li, F.; Xie, Y.; Tian, T.; Chen, Q. Spatiotemporal characteristics and drivers of ecosystem service interactions in the Dongting Lake Basin. Sci. Total Environ. 2024, 926, 172012. [Google Scholar] [CrossRef]
- Geng, M.; Qian, Z.; Jiang, H.; Huang, B.; Huang, S.; Deng, B. Assessing the impact of water-sediment factors on water quality to guide river-connected lake water environment improvement. Sci. Total Environ. 2024, 912, 168866. [Google Scholar] [CrossRef]
- Xie, Y.H.; Chen, X.S. Effects of three-gorge project on succession of wetland vegetation in Dongting Lake. Res. Agric. Mod. 2008, 29, 684–687, (In Chinese with English abstract). [Google Scholar]
- Liu, H.; Zhou, Q. Accuracy analysis of remote sensing change detection by rule-based rationality evaluation with post-classification comparison. Int. J. Remote Sens. 2004, 25, 1037–1050. [Google Scholar] [CrossRef]
- Huiping, Z.; Hong, J.; Qinghua, H. Landscape and Water Quality Change Detection in Urban Wetland: A Post-classification Comparison Method with IKONOS Data. Procedia Environ. Sci. 2011, 10, 1726–1731. [Google Scholar] [CrossRef]
- Wang, J.; Zhang, T.; Fu, B. A measure of spatial stratified heterogeneity. Ecol. Indic. 2016, 67, 250–256. [Google Scholar] [CrossRef]
- Zhang, P.; Zhang, S.; Zou, Y.; Wu, T.; Li, F.; Deng, Z.; Zhang, H.; Song, Y.; Xie, Y. Integrating suitable habitat dynamics under typical hydrological regimes as guides for the conservation and restoration of different waterbird groups. J. Environ. Manag. 2023, 345, 118451. [Google Scholar] [CrossRef] [PubMed]
- Loiselle, A.; Proulx, R.; Larocque, M.; Pellerin, S. Synergies and trade-offs among ecosystems functions and services for three types of lake-edge wetlands. Ecol. Indic. 2023, 154, 110547. [Google Scholar] [CrossRef]
- Huang, Y.; Chen, X.S.; Zhu, L.L. Differential responses of ecosystem stability to climatic and anthropogenic factors in connected and isolated lake basins on the Yangtze River. J. Environ. Manag. 2024, 359, 121014. [Google Scholar] [CrossRef]
- Zhang, M.; Fan, S.; Li, X.; Li, Y.; Li, K.; Xu, Y.; Dong, L. Supporting function of vegetation in urban riparian ecological corridors for ground-dwelling faunal diversity in Beijing, China. Sci. Total Environ. 2024, 921, 171150. [Google Scholar] [CrossRef]
- Fentaw, G.; Beneberu, G.; Wondie, A.; Eneyew, B.G. Ecosystem services of wetlands in the upper Abbay River basin, Ethiopia. Ecol. Indic. 2025, 171, 113142. [Google Scholar] [CrossRef]
- Dai, E.; Zhao, Z.; Jia, L.; Jiang, X. Contribution of ecosystem services improvement on achieving Sustainable development Goals under ecological engineering projects on the Qinghai-Tibet Plateau. Ecol. Eng. 2024, 199, 107146. [Google Scholar] [CrossRef]
- Zhu, Y.; Zhou, M. Optimization of land use structure integrating ecosystem service function and economic development—A case study in Dongting Lake Ecological and Economic Zone, China. Environ. Sustain. Indic. 2025, 26, 100604. [Google Scholar] [CrossRef]
- Ma, J.; Chen, W.; Chen, M.; Zhong, K.; Yao, N. Water level fluctuations associated with hydrological connectivity consolidate the food web stability of the largest Chinese freshwater lake via mediating trophodynamics and trophic structure. Ecol. Indic. 2023, 153, 110372. [Google Scholar] [CrossRef]
- Li, D.; Ning, Z.; Chen, G.; Li, Y.; Cui, B.; Wang, Q.; Xie, T. The effect of land use and land cover on soil carbon storage in the Yellow River Delta, China: Implications for wetland restoration and adaptive management. J. Environ. Manag. 2024, 367, 122097. [Google Scholar] [CrossRef]
- Li, W.; Chen, X.; Zheng, J.; Zhang, F.; Yan, Y.; Hai, W. Effectiveness and driving mechanisms of ecological conservation and restoration in Sichuan Province, China. Ecol. Indic. 2025, 172, 113238. [Google Scholar] [CrossRef]
- Benabderrazik, K.; Kopainsky, B.; Tazi, L.; Joerin, J.; Six, J. Agricultural intensification can no longer ignore water conservation-Asystemic modelling approach to the case of tomato producers in Morocco. Agric. Water Manag. 2021, 256, 107082. [Google Scholar] [CrossRef]
- Kok, S.; Clec’h, S.; Penning, W.E.; Buijse, A.D.; Hein, L. Trade-offs in ecosystem services under various river management strategies of the Rhine Branches. Ecosyst. Serv. 2025, 72, 101692. [Google Scholar] [CrossRef]
- Li, B.; Yang, G.; Wan, R.; Hamilton, D.P.; Wang, X. Unravelling the spatiotemporal trade-offs and synergies among hydrological ecosystem services in a large floodplain lake. Ecol. Indic. 2025, 172, 113255. [Google Scholar] [CrossRef]
- Hopkins, K.G.; Welles, J.S.; Pindilli, E.J.; Noe, G.B.; Claggett, P.R.; Ahmed, L.; Metes, M.J. Societal benefits of floodplains in the Chesapeake Bay and Delaware River watersheds: Sediment, nutrient, and flood regulation ecosystem services. J. Environ. Manag. 2023, 345, 118747. [Google Scholar] [CrossRef]
- Yue, C.; Xu, M.; Ciais, P.; Tao, S.; Shen, H.; Chang, J.; Li, W.; Deng, L.; He, J.; Leng, Y.; et al. Contributions of ecological restoration policies to China’s land carbon balance. Nat. Commun. 2024, 15, 9708. [Google Scholar] [CrossRef]
- Perez-Mendez, N.; Alcaraz, C.; Catala-Forner, M. Ecological restoration of field margins enhances biodiversity and multiple ecosystem services in rice agroecosystems. Agric. Ecosyst. Environ. 2025, 382, 109484. [Google Scholar] [CrossRef]
- Song, W.; Deng, X. Land-use/land-cover change and ecosystem service provision in China. Sci. Total Environ. 2017, 576, 705–719. [Google Scholar] [CrossRef] [PubMed]
- Hasan, S.S.; Zhen, L. Impact of land use change on ecosystem services: A review. Environ. Dev. 2020, 34, 100527. [Google Scholar] [CrossRef]
- Feng, X.; Li, Y.; Wang, X.; Yang, J.; Yu, J.; Wang, S.; Wu, N.; Xiao, F. Impacts of land use transitions on ecosystem services: A research framework coupled with structure, function, and dynamics. Sci. Total Environ. 2023, 901, 166366. [Google Scholar] [CrossRef] [PubMed]
- Li, Y.; Luo, Y.; Liu, G.; Ouyang, Z.; Zheng, H. Effects of land use change on ecosystem services: A case study in Miyun reservoir watershed. Acta Ecol. Sin. 2013, 33, 726–736. [Google Scholar] [CrossRef]
- Xie, C.; Wang, K.; Chen, H.; Zhang, M. Effects of land use change on the ecosystem services value in the Dongting Lake Area. Resour. Environ. Yangtze Basin 2006, 15, 191–195, (In Chinese with English abstract). [Google Scholar]
- Xue, Y.; Kong, X.; Mao, Z.; Zhang, C.; Xue, B.; Shi, X.; Gu, X. Hydrological variation drives changes in food web structure and ecosystem function with potential hysteresis in a large temperate shallow lake. J. Hydrol. 2025, 650, 132463. [Google Scholar] [CrossRef]
- Yang, Y.; Roderick, M.; Zhang, S.; McVicar, T.; Donohue, R.J. Hydrologic implications of vegetation response to elevated CO2 in climate projections. Nat. Clim. Change 2019, 9, 44–48. [Google Scholar] [CrossRef]
- Zhou, S.; Yu, B.; Lintner, B.R.; Findell, K.L.; Zhang, Y. Projected increase in global runoff dominated by land surface changes. Nat. Clim. Change 2023, 13, 442–449. [Google Scholar] [CrossRef]
- Wang, X.; Liu, H.; Jia, Y.; Wang, J.; Wei, X.; Wang, Y.; Wang, X.; Ji, Y.; Dang, L.; Hu, P. A technical framework for determining water consumption thresholds in the semi-arid Xiliao River Plain based on terrestrial water balance. J. Hydrol. Reg. Stud. 2025, 58, 102261. [Google Scholar] [CrossRef]
- Xiao, L.; Robinson, M.; O’Connor, M. Woodland’s role in natural flood management: Evidence from catchment studies in Britain and Ireland. Sci. Total Environ. 2022, 813, 151877. [Google Scholar] [CrossRef]
- Berton, R.; Rahmani, V. Partial Duration Series of Wet and Dry Years Can Improve Flood Estimates in the Context of a Nonstationary Climate and Anthropogenic Disturbances. Hydroecol. Eng. 2024, 1, 1004. [Google Scholar] [CrossRef]
- Mashizi, A.K.; Sharafatmandrad, M. Management of soil-related ecosystem services in semi-arid regions of Iran using key environmental drivers. J. Environ. Manag. 2025, 381, 125181. [Google Scholar] [CrossRef]
- Gao, Y.; Xie, Y.; Zou, D. Hydrological regime change and its ecological responses in East Dongting Lake, China. Ecohydrol. Hydrobiol. 2019, 20, 142–150. [Google Scholar] [CrossRef]
- Peng, Y.; He, G.; Wang, G.Z.; Cao, H.J. Surface Water Changes in Dongting Lake from 1975 to 2019 Based on Multisource Remote-Sensing Images. Remote Sens. 2021, 13, 1827. [Google Scholar] [CrossRef]
Disclaimer/Publisher’s Note: The statements, opinions and data contained in all publications are solely those of the individual author(s) and contributor(s) and not of MDPI and/or the editor(s). MDPI and/or the editor(s) disclaim responsibility for any injury to people or property resulting from any ideas, methods, instructions or products referred to in the content. |
© 2025 by the authors. Licensee MDPI, Basel, Switzerland. This article is an open access article distributed under the terms and conditions of the Creative Commons Attribution (CC BY) license (https://creativecommons.org/licenses/by/4.0/).