1. Introduction
Although irrigation supports only around 20% of the world’s cultivated land, it is responsible for producing nearly 40% of global food output [
1]. This highlights its critical role in global food security. However, mounting challenges such as rapid population growth, urban expansion, and climate change are placing increased pressure on already scarce water resources, especially in arid and semi-arid regions (ASARs). These areas frequently suffer from chronic water scarcity and inefficient water resource management [
2]. Without proactive planning and the adoption of alternative water sources, it is projected that by 2050 over 50% of the global population will face severe water shortages and drought conditions [
3].
ASARs cover over 50 million square kilometres of the Earth’s surface, and they are characterised by low, erratic, and unreliable rainfall [
4]. In many parts of the world, the combination of climate change, rising temperatures, inefficient water allocation, and poor governance continues to exacerbate droughts and reduce water availability effects that are especially pronounced in economically disadvantaged and underdeveloped regions [
5].
Water scarcity is a pressing global issue that affects both developing nations and developed economies. Its consequences are particularly acute in the agricultural sector, where limited water availability directly threatens crop yields and food security [
6]. This challenge is compounded by the escalating impact of climate change. Scientific projections indicate a possible temperature increase of up to 5 °C in the coming decades with increasingly frequent and extreme weather events such as droughts, heatwaves, and floods already being observed [
7].
These environmental changes have led to widespread water shortages and declining agricultural productivity, particularly in regions with limited adaptive capacity [
8]. In the Middle East, and especially in countries like Iraq, water scarcity has emerged as a critical threat that has been accelerated by climate change. The repercussions are extensive, impeding economic growth, undermining social stability, and deepening existing vulnerabilities across all levels of society [
9]. In such regions, food production is shaped by a complex interplay of natural resources, climatic stresses, and socioeconomic constraints. Addressing these challenges demands the adoption of innovative technologies and a strong commitment to sustainable agricultural practices. Enhancing the resilience and adaptability of farming systems is essential to achieving long-term food security and promoting sustainable development [
10].
Rainwater harvesting (RWH) is a time-tested and sustainable practice that involves the collection and storage of precipitation from surfaces such as rooftops or natural catchments. While classification systems vary by region, the central goal is consistent: to capture and store rainfall for future agricultural and domestic use. RWH includes a variety of techniques aimed at maximising the utility of rainwater runoff [
11]. Oweis [
12] defines RWH as the redirection and concentration of rainfall into smaller, manageable areas for effective use. Altaiee et al. [
13] describe it as the “collection, storage, and utilization of rainwater for small-scale productive activities.” The World Overview of Conservation Approaches and Technologies (WOCAT) offers a broader definition, encompassing the collection and regulation of rainwater or floodwater to enhance water availability for domestic needs, farming, and ecosystem protection [
14].
Around the world, numerous countries have successfully implemented RWH techniques to alleviate water scarcity and build agricultural resilience. In Latin America, Southeast Asia, Africa, and the Middle East, regionally tailored RWH practices have proven effective in improving rainwater collection and enhancing water use efficiency for farming [
15].
Although irrigation is applied to only around 20% of the world’s cultivated land, it contributes nearly 40% of global food production. However, this critical agricultural practice faces mounting challenges due to rapid population growth, urban expansion, and climate change factors that are placing increasing strain on already limited water resources. These pressures are particularly acute in arid and semi-arid regions (ASARs), where water scarcity and inefficient water resource management are persistent issues [
16].
In developing countries such as Iraq, food production and security are influenced by a complex interplay of factors including natural resources like water and soil, the impacts of climate change, and socioeconomic conditions [
17].
Effective water resource management has become increasingly critical in the context of climate change. Ensuring a reliable water supply for agriculture and irrigation is vital to support food security and increase productivity for an ever-growing global population [
18]. One promising and sustainable strategy to address water scarcity especially in arid and semi-arid zones is rainwater harvesting for sustainable agriculture (RWHSA) [
19].
RWH encompasses a diverse range of techniques aimed at efficiently capturing and utilising rainwater runoff [
20]. As described by [
12]. RWH refers to the redirection and concentration of rainwater into smaller, more manageable areas for productive use. The World Overview of Conservation Approaches and Technologies (WOCAT) offers a broader definition, describing RWH as the collection and regulation of rainwater or floodwater to increase water availability for domestic needs, farming, and ecosystem preservation [
21].
Identifying suitable catchment zones for rainwater harvesting (RWH) in semi-arid regions is essential for sustaining water availability and improving land productivity. The selection of appropriate sites demands a comprehensive evaluation of multiple interrelated factors, including local climatic conditions, hydrological behaviour, topography, soil properties, land cover and land use (LCLU), existing agroforestry systems, and socioeconomic considerations. A thorough understanding of these parameters ensures the development of effective and context-specific RWH strategies tailored to the unique challenges of semi-arid environments [
22].
The performance and reliability of RWH systems depend heavily on fluctuations in both rainfall amounts and runoff quality during precipitation events [
11]. Achieving sustainable rainwater harvesting for agricultural purposes (RWHSA) requires a systematic and well-structured approach. This process begins with the identification of key criteria, followed by their evaluation and classification, and culminates in the selection of optimal sites to generate a comprehensive suitability map [
23].
The success and long-term viability of rainwater harvesting for sustainable agriculture (RWHSA) are highly dependent on the methodology employed for site selection and the precision in identifying suitable catchment zones [
24]. While a range of techniques has been developed to locate optimal RWH sites, the integration of Remote Sensing (RS) and Geographic Information Systems (GIS) has proven especially effective. These advanced geospatial technologies have significantly enhanced hydrological modelling by enabling high-resolution, large-scale analysis and more accurate identification of areas with strong potential for rainwater collection [
25]. As a result, RS and GIS have become indispensable tools for supporting evidence-based planning and sustainable water resource management in diverse agroecological settings.
Geographic Information Systems (GIS) and Remote Sensing (RS) offer powerful and versatile tools for evaluating multiple spatial variables and synthesising complex environmental datasets, making them essential for identifying suitable rainwater harvesting (RWH) sites. One of the most widely applied approaches in this context is Multi-Criteria Decision Analysis (MCDA), which enables the systematic integration of diverse data layers with expert knowledge to guide informed decision-making in site selection [
26]. Within the MCDA framework, the Analytical Hierarchy Process (AHP) is particularly noteworthy for its structured methodology. By combining expert judgment with mathematical rigor, AHP assigns relative weights to multiple criteria, supporting a transparent and comprehensive evaluation of site suitability for RWH [
27].
While numerous studies have successfully utilised the integration of AHP, Remote Sensing (RS), and Geographic Information Systems (GIS) to identify optimal rainwater harvesting (RWH) sites, these methodologies continue to undergo refinement. Ongoing advancements aim to enhance their accuracy, scalability, and adaptability to a wide range of geographic, environmental, and socioeconomic contexts. This continuous evolution underscores the growing importance of these tools in advancing sustainable water resource management and supporting climate-resilient agricultural planning.
For example, Nabit et al. [
28] employed GIS and RS techniques to identify potential RWH locations in Diyala, located in the northeastern region of Iraq. Similarly, Hassan et al. [
22] applied a multi-criteria analysis (MCA) framework in the Kerbela desert, utilising GIS and RS to determine suitable sites for harvesting rainwater. In another study, Ibrahim et al. [
29] focused on the Dohuk Governorate, situated in northern Iraq, a region classified as semi-arid. Their findings confirm that the integration of multi-criteria evaluation with GIS and RS is a highly effective approach for long-term water resource planning in arid and semi-arid regions. Given the growing urgency of water scarcity across the semi-arid landscapes of the Middle East, there is a pressing need for further research that integrates Geographic Information Systems (GIS), Remote Sensing (RS), and Multi-Criteria Decision Analysis (MCDA) to identify effective rainwater harvesting (RWH) strategies. This study addresses that gap by employing an integrated methodological framework to identify optimal RWH sites in northern Iraq an increasingly water-stressed semi-arid region. The primary objective is to enhance water resource management and support sustainable agricultural development by establishing a reliable and data-driven approach for locating suitable RWH zones. This study does not include socioeconomic factors, which can be incorporated in the near future. This framework has the potential to inform decision-making among policymakers, local authorities, and stakeholders, contributing to regional food security and the long-term sustainability of agricultural systems.
3. Methodology
In this study, a range of spatial and environmental datasets were acquired and processed to support the identification of suitable rainwater harvesting sites. Key data sources included the Digital Elevation Model (DEM), soil texture maps, land use/land cover (LULC), and long-term rainfall records. These datasets were integrated and analysed using ArcGIS 10.8.2 software to generate a comprehensive spatial framework for the research.
The DEM data were obtained from the Shuttle Radar Topography Mission (SRTM)(C-band and X-band Synthetic Aperture Radar (SAR). Operated By: NASA, NGA (U.S. National Geospatial-Intelligence Agency)) via the United States Geological Survey (USGS) at a spatial resolution of 30 m. This dataset was essential for delineating watersheds and stream orders across the Kirkuk province. For land cover analysis, the most recent high-resolution imagery (10 m), available from the Environmental Systems Research Institute (ESRI)(United States, Headquarters: Redlands, CA, USA) platform, was downloaded in TIF format. The imagery was pre-processed, reclassified, and tailored to the Kirkuk study area within the ArcGIS environment.
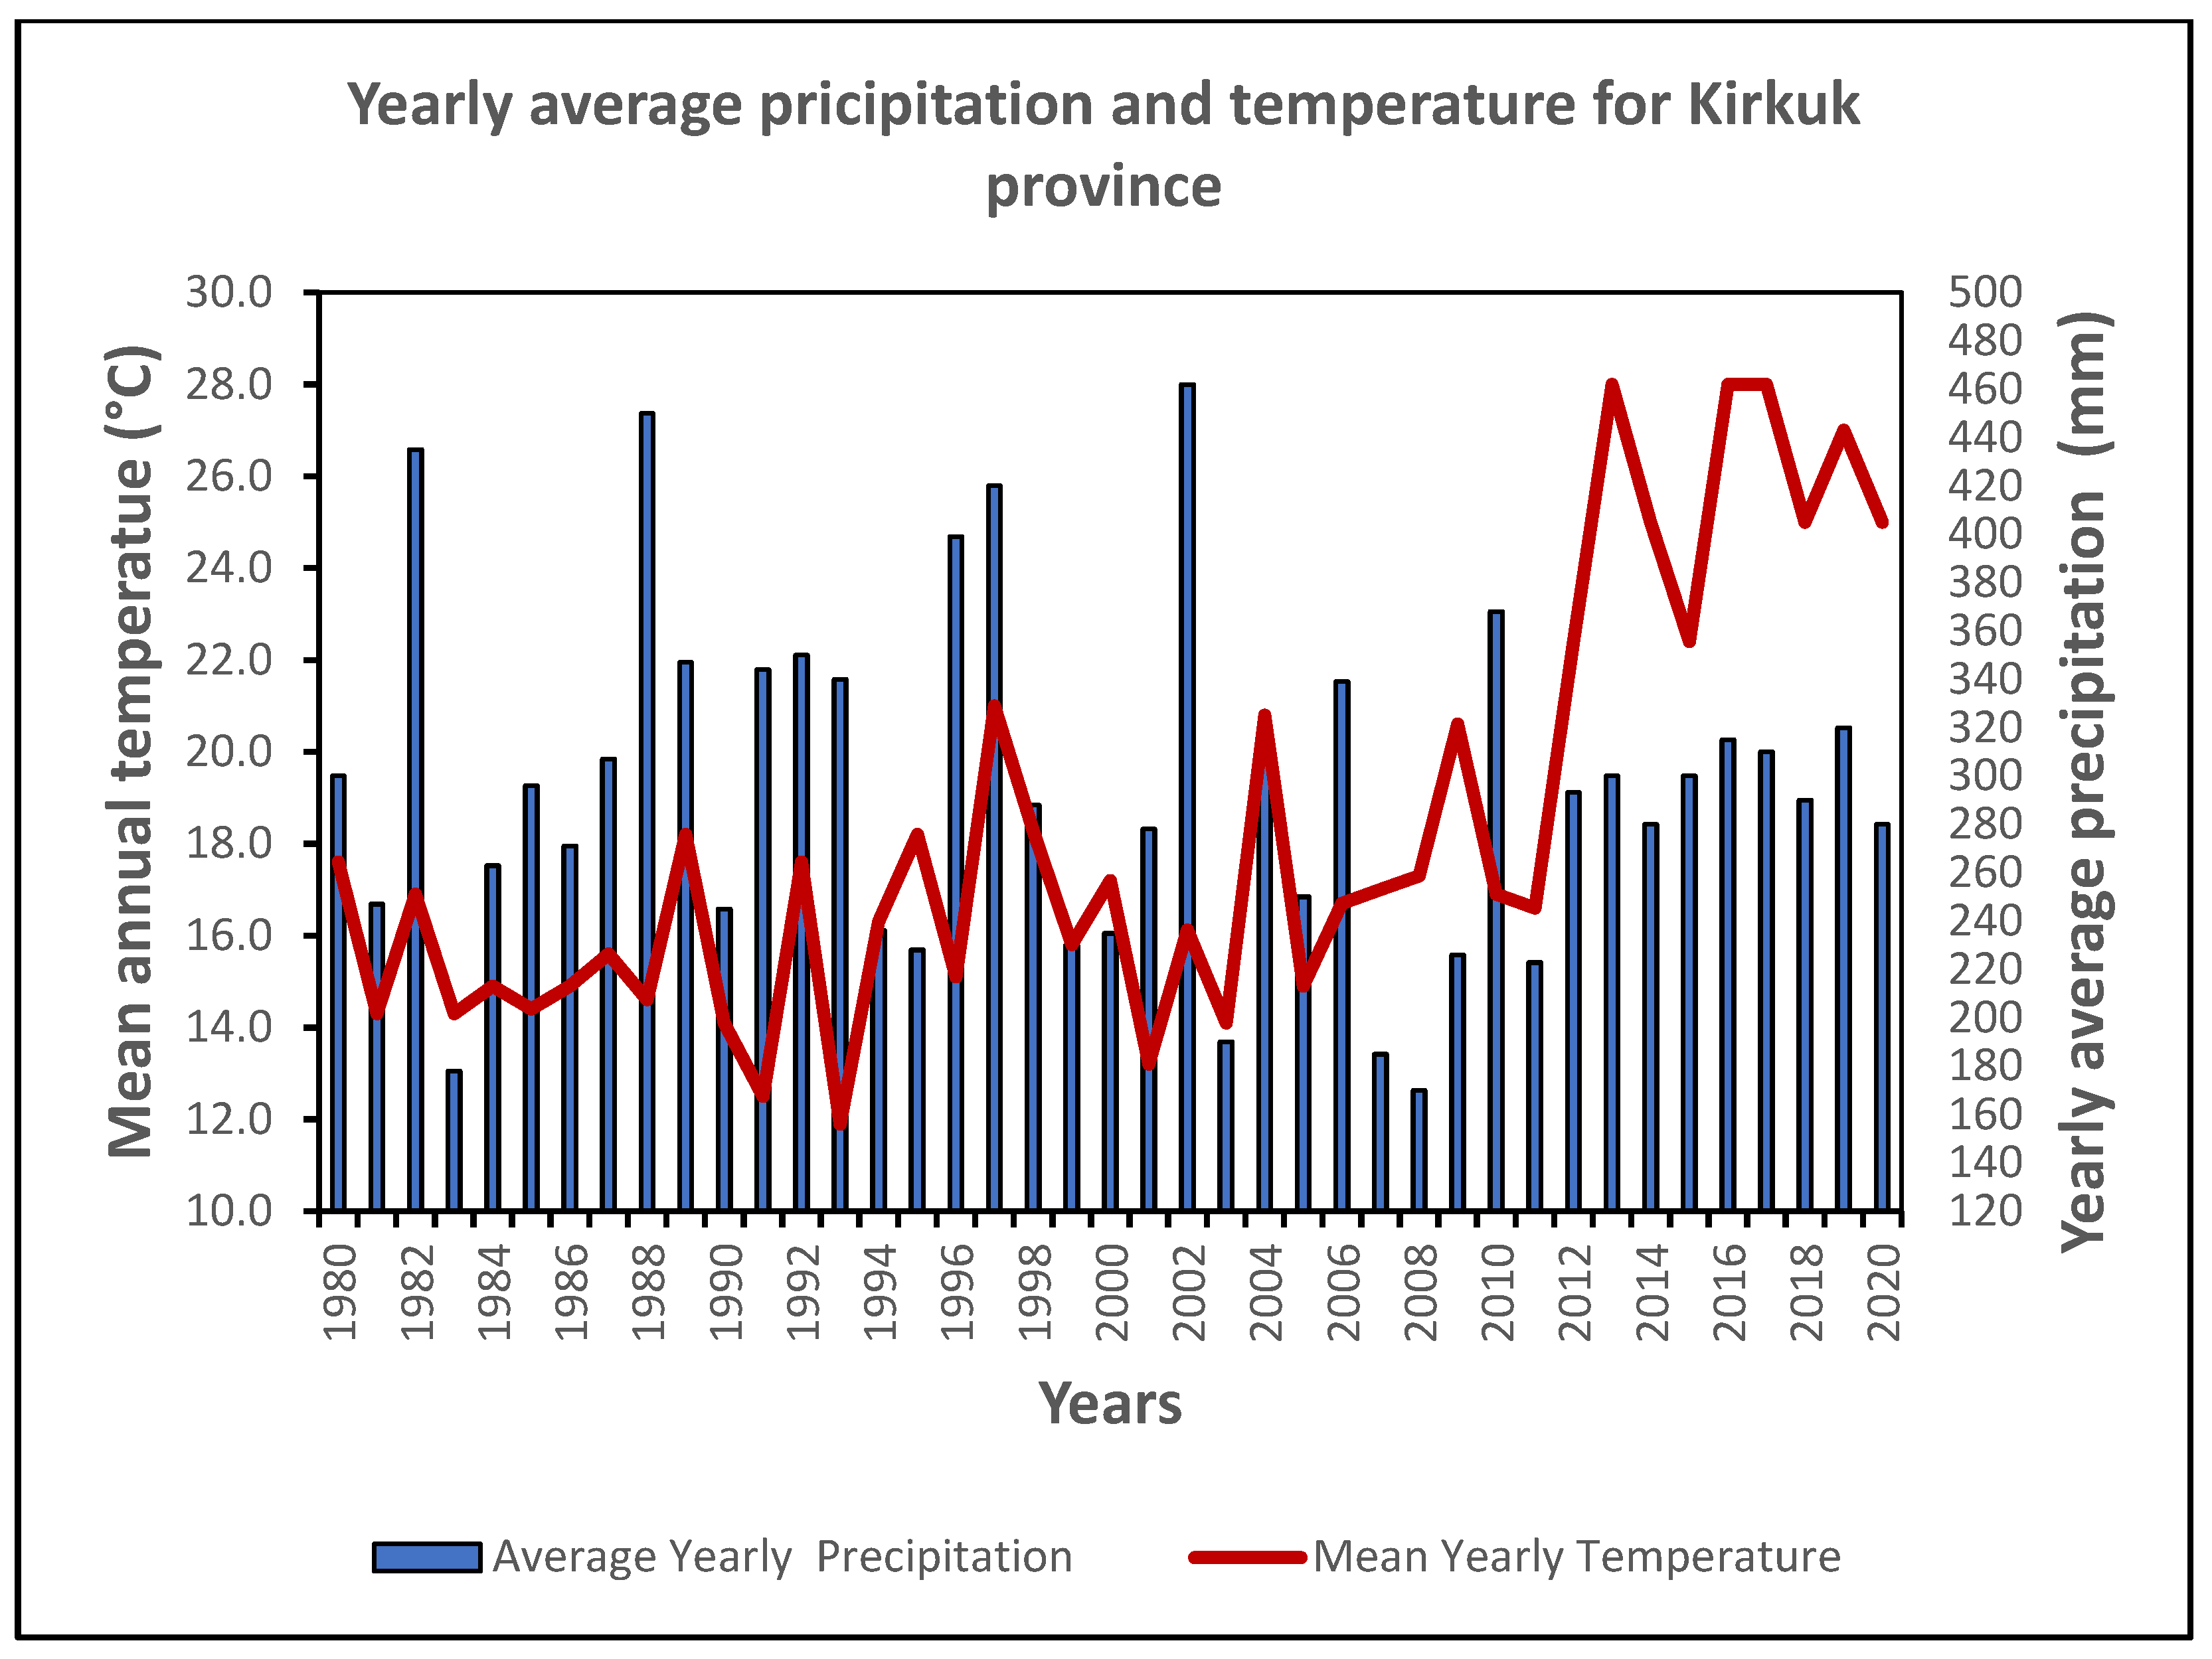
Rainfall data, spanning a 40-year period (1980–2020), were sourced from the Iraqi Meteorological Organization and Seismology Department, providing a robust temporal dataset for hydrological analysis. To develop the soil texture map, data were extracted from the Food and Agriculture Organization (FAO) database and cross-verified with historical soil maps provided by the Iraqi Ministry of Agriculture.
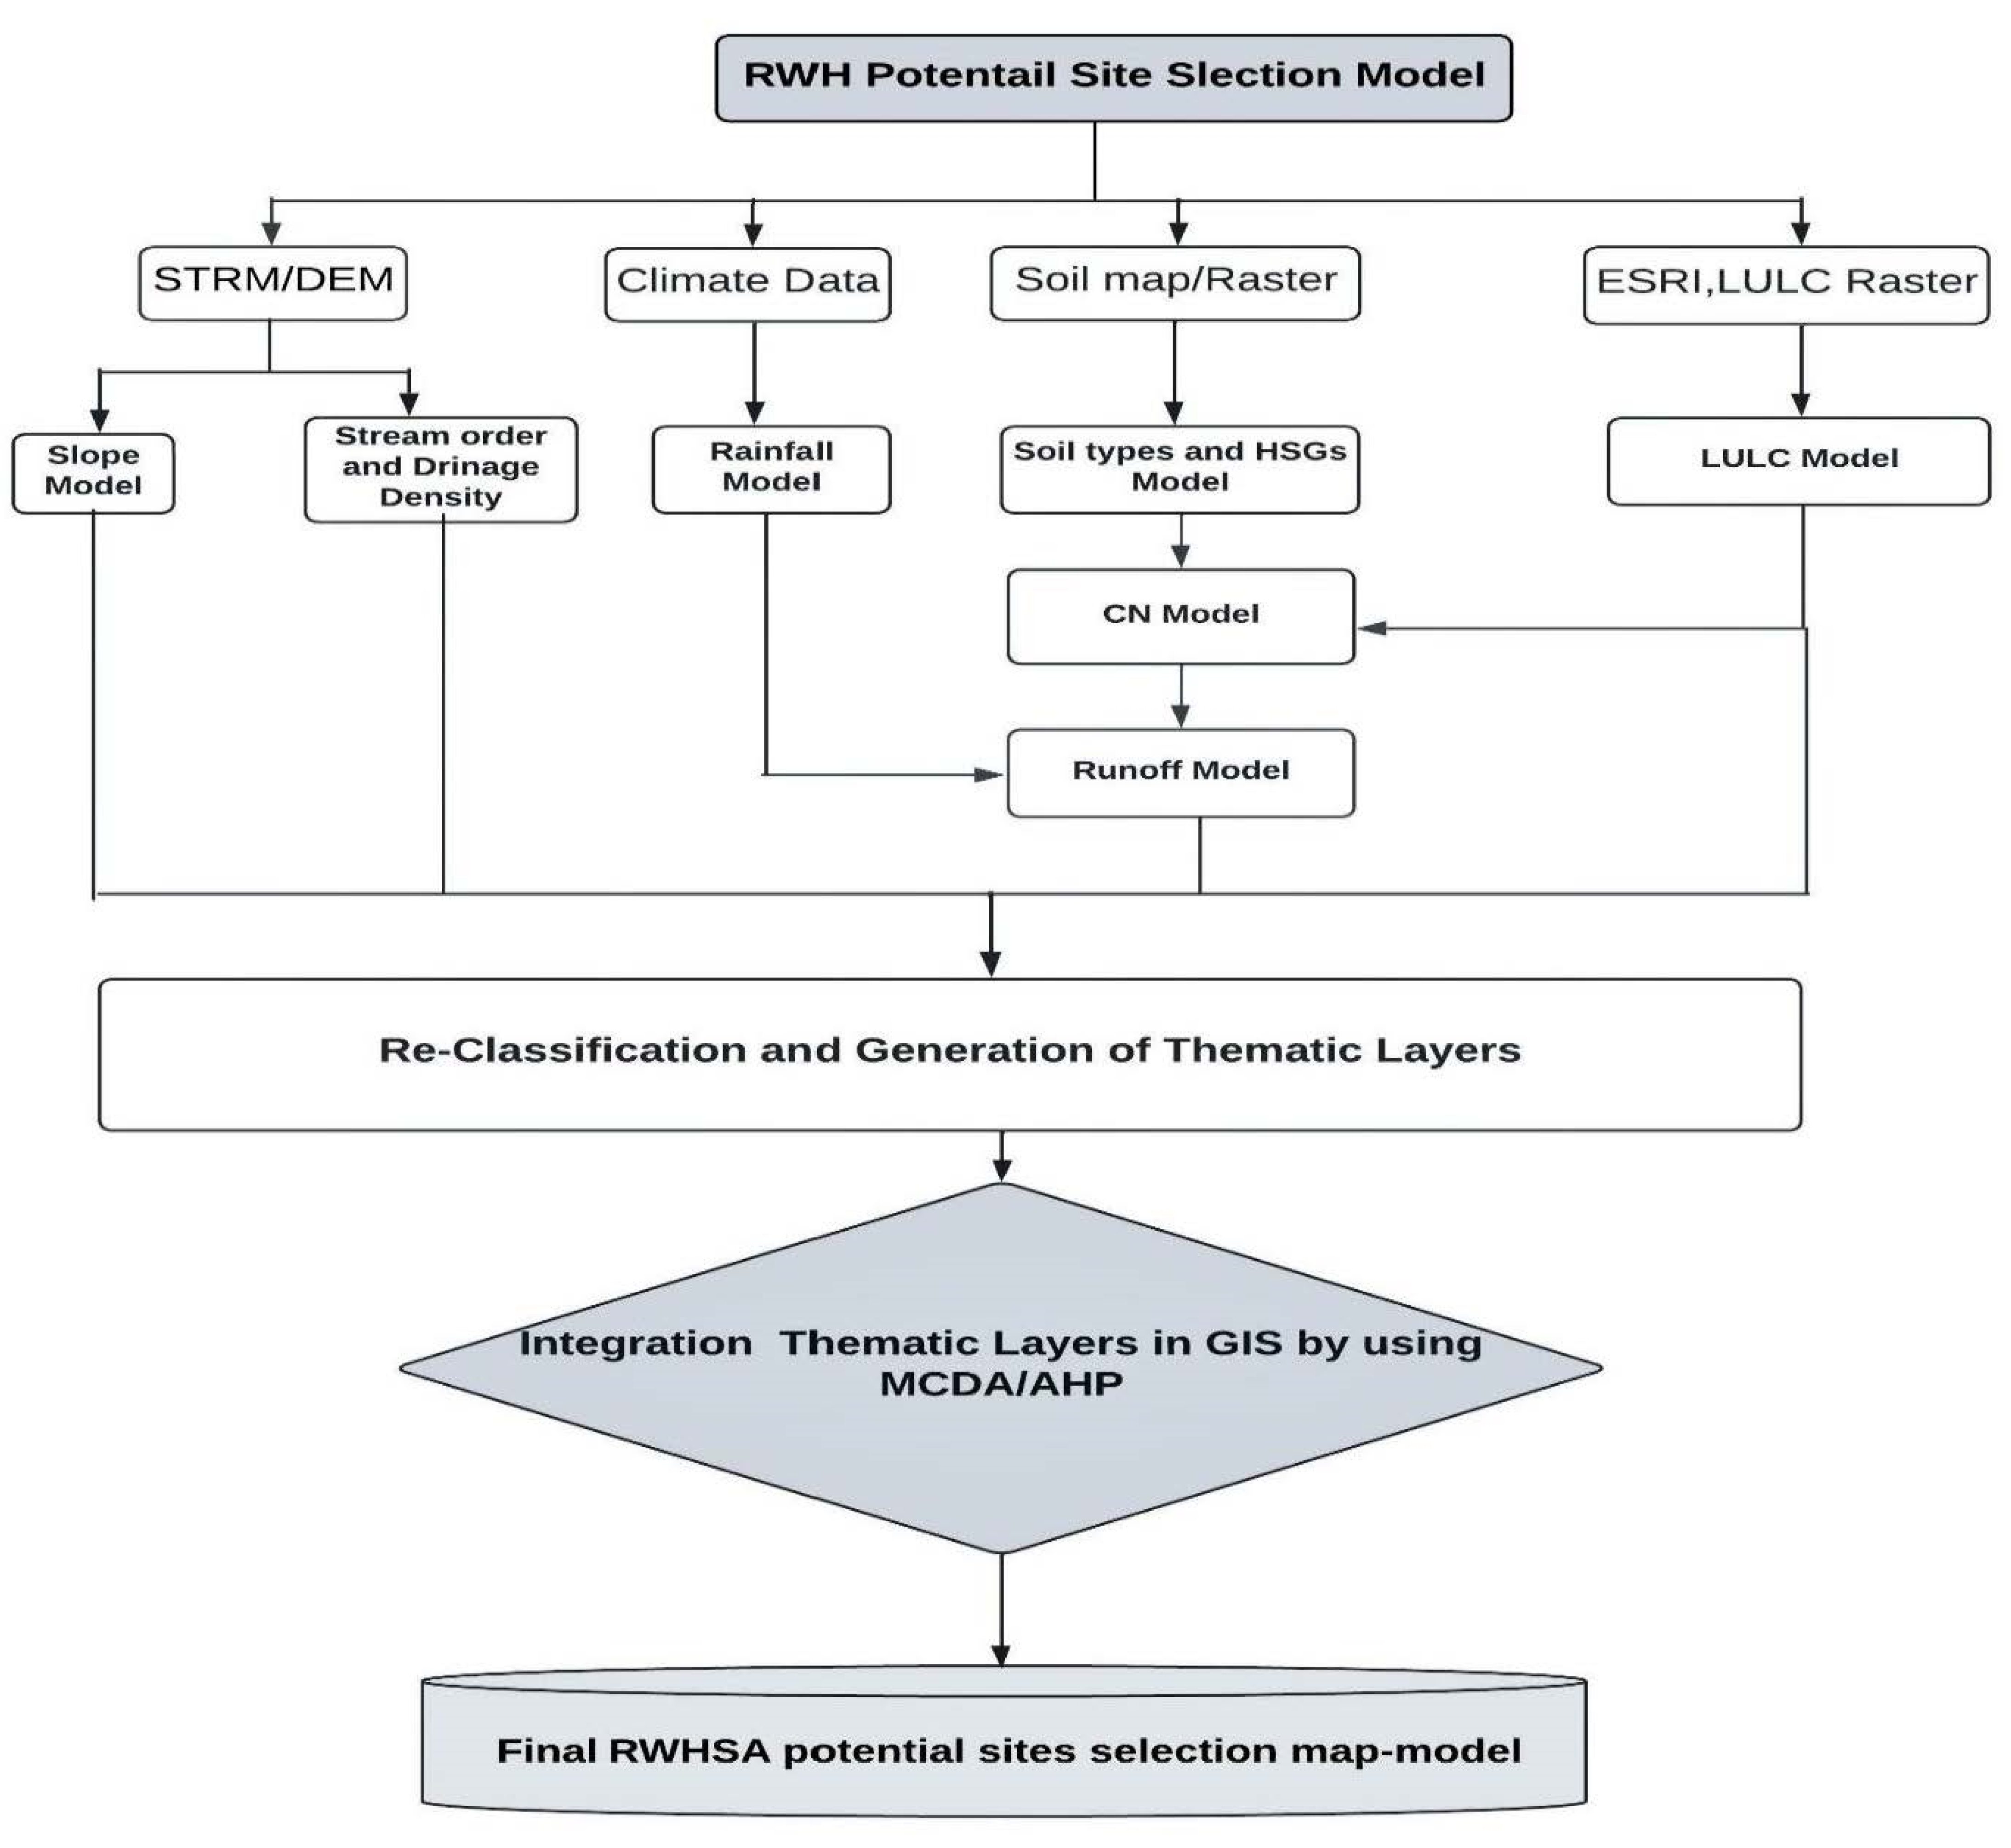
The methodological approach is summarised in the workflow diagram presented in
Figure 3, which outlines the sequential steps involved in generating the final suitability map for rainwater harvesting in sustainable agriculture (RWHSA). This study employed an integrated methodology that combined Multi-Criteria Decision Analysis (MCDA) and the Analytic Hierarchy Process (AHP) with Remote Sensing (RS) and GIS tools. This interactive framework ensured a systematic and data-driven evaluation of the most viable RWH sites within the semi-arid context of Kirkuk province.
3.1. The Criteria Selection
According to the Food and Agriculture Organization (FAO), six essential factors should be considered when evaluating and selecting sites for soil and water conservation efforts. These include climatic conditions, water systems and flow patterns, landscape and topography, agricultural potential, soil characteristics, and socioeconomic conditions [
33]. Drawing on insights from the existing literature, expert judgment, and available geospatial data, this study incorporated five of these criteria as thematic layers to identify potential rainwater harvesting (RWH) sites.
Guided by the FAO framework, this study utilised the following parameters: rainfall–runoff as the climatic indicator; stream order as the hydrological criterion; slope as the topographic factor; land use/land cover as the agronomic indicator; and soil type as the key soil-related parameter. Socioeconomic factors, while important, were deliberately excluded from the current analysis due to data limitations and the technical focus of this study, and they can be considered in the near future.
The selection of criteria was informed by a review of the relevant literature on similar regional studies and further validated through consultations with local university professors and domain experts familiar with the study area. Each of the selected criteria was reclassified using a standardised scoring scale ranging from 1 to 9, as outlined in
Table 2. This classification was based on a literature review, previous studies in similar contexts, the specific characteristics of the Kirkuk region, and the availability of reliable datasets. This structured approach facilitated the prioritisation of suitable RWH zones and provided a robust framework for evaluating and ranking site suitability.
3.2. Data Processing
3.2.1. Digital Elevation Model (DEM)
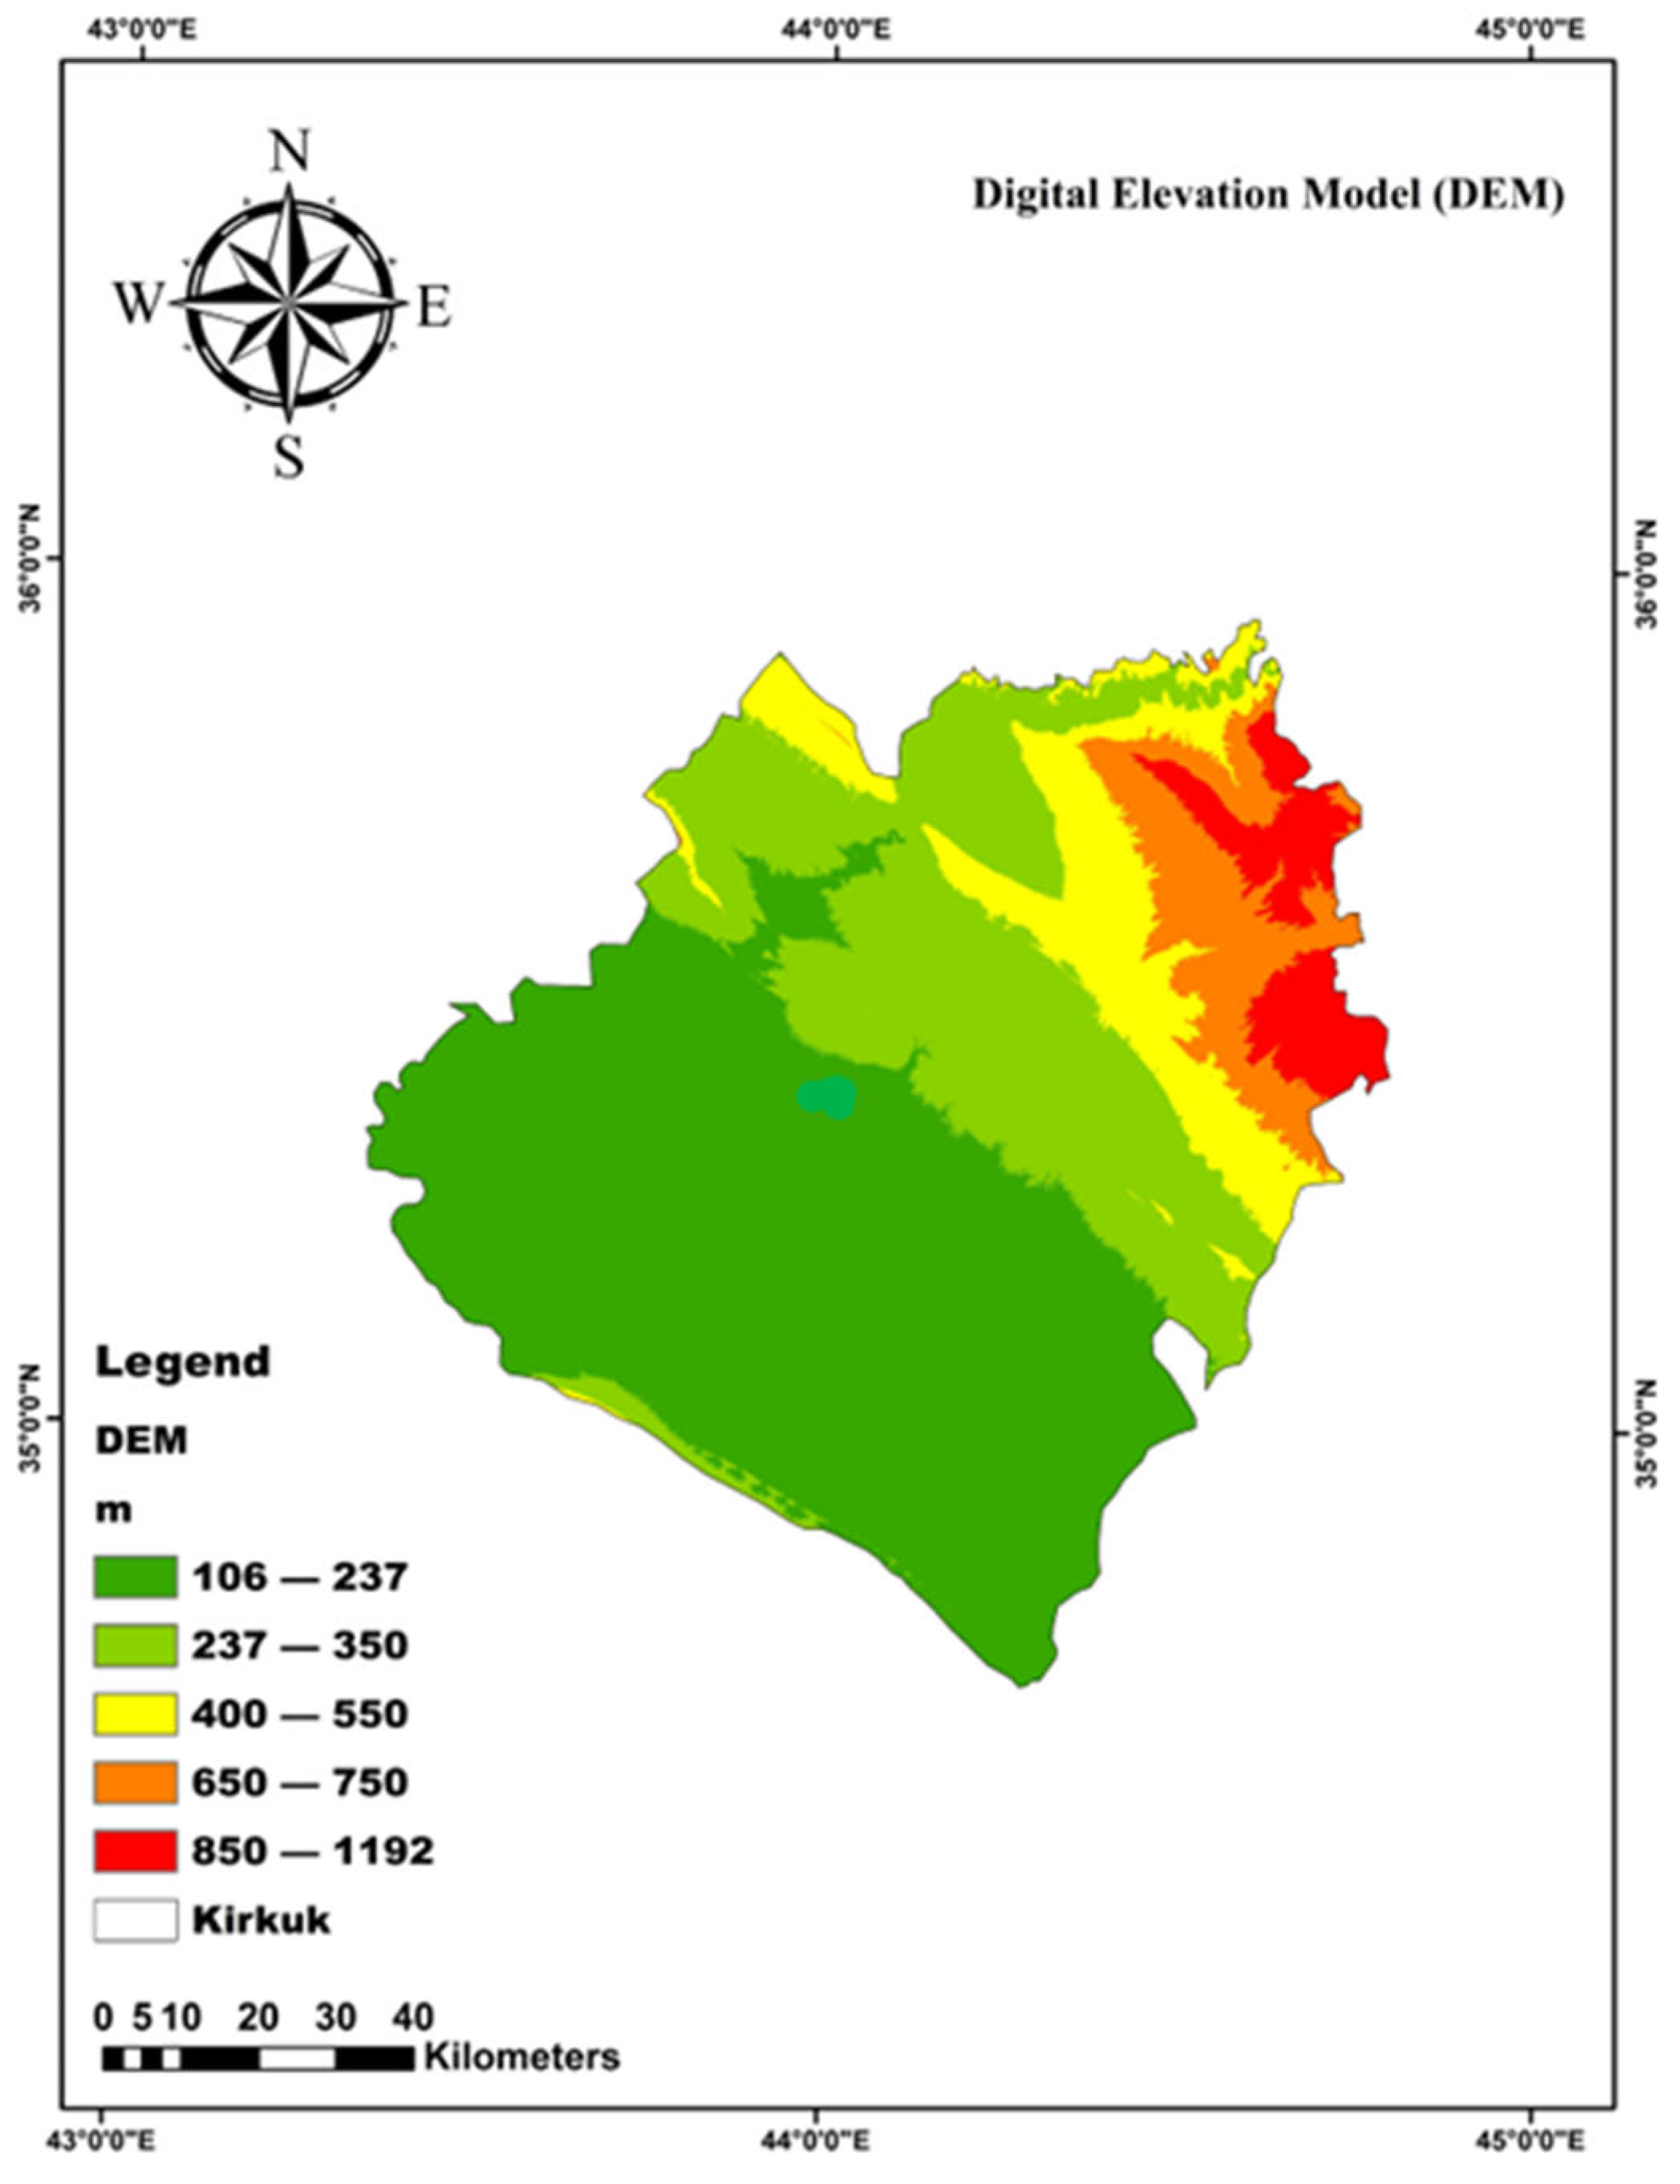
A Digital Elevation Model (DEM) is a two-dimensional representation of the Earth’s surface topography and is widely utilised in geospatial and hydrological analyses. DEMs are typically derived from systematically collected elevation data through aerial surveys, satellite missions, or topographic maps [
40]. In this study, elevation data were sourced from the NASA Shuttle Radar Topography Mission (SRTM), offering a spatial resolution of 30 m. The DEM provides essential insights into key terrain characteristics, including slope, flow direction, flow accumulation, hill shade, and stream order within the study watershed. These parameters are foundational for conducting accurate topographical and hydrological modelling. The processed DEM of the study area illustrated in
Figure 4 was generated using specialised algorithms within Geographic Information System (GIS) software (ArcMap, 10.8.2. version). This visual model enhances the understanding of the regional landscape and serves as a critical input for analysing surface water dynamics and identifying potential rainwater harvesting zones.
3.2.2. Slope Model
The slope is a key topographic parameter that significantly influences surface runoff generation and has important implications for both hydrological modelling and engineering applications. The gradient of the terrain directly affects water flow velocity, sediment transport, and the design and stability of infrastructure, such as rainwater harvesting systems and dams [
35]. For effective rainwater harvesting (RWH), it is generally recommended that target areas have slopes of 5% or less. Steeper gradients are more prone to erosion and often require substantial modifications to manage unpredictable runoff patterns [
42].
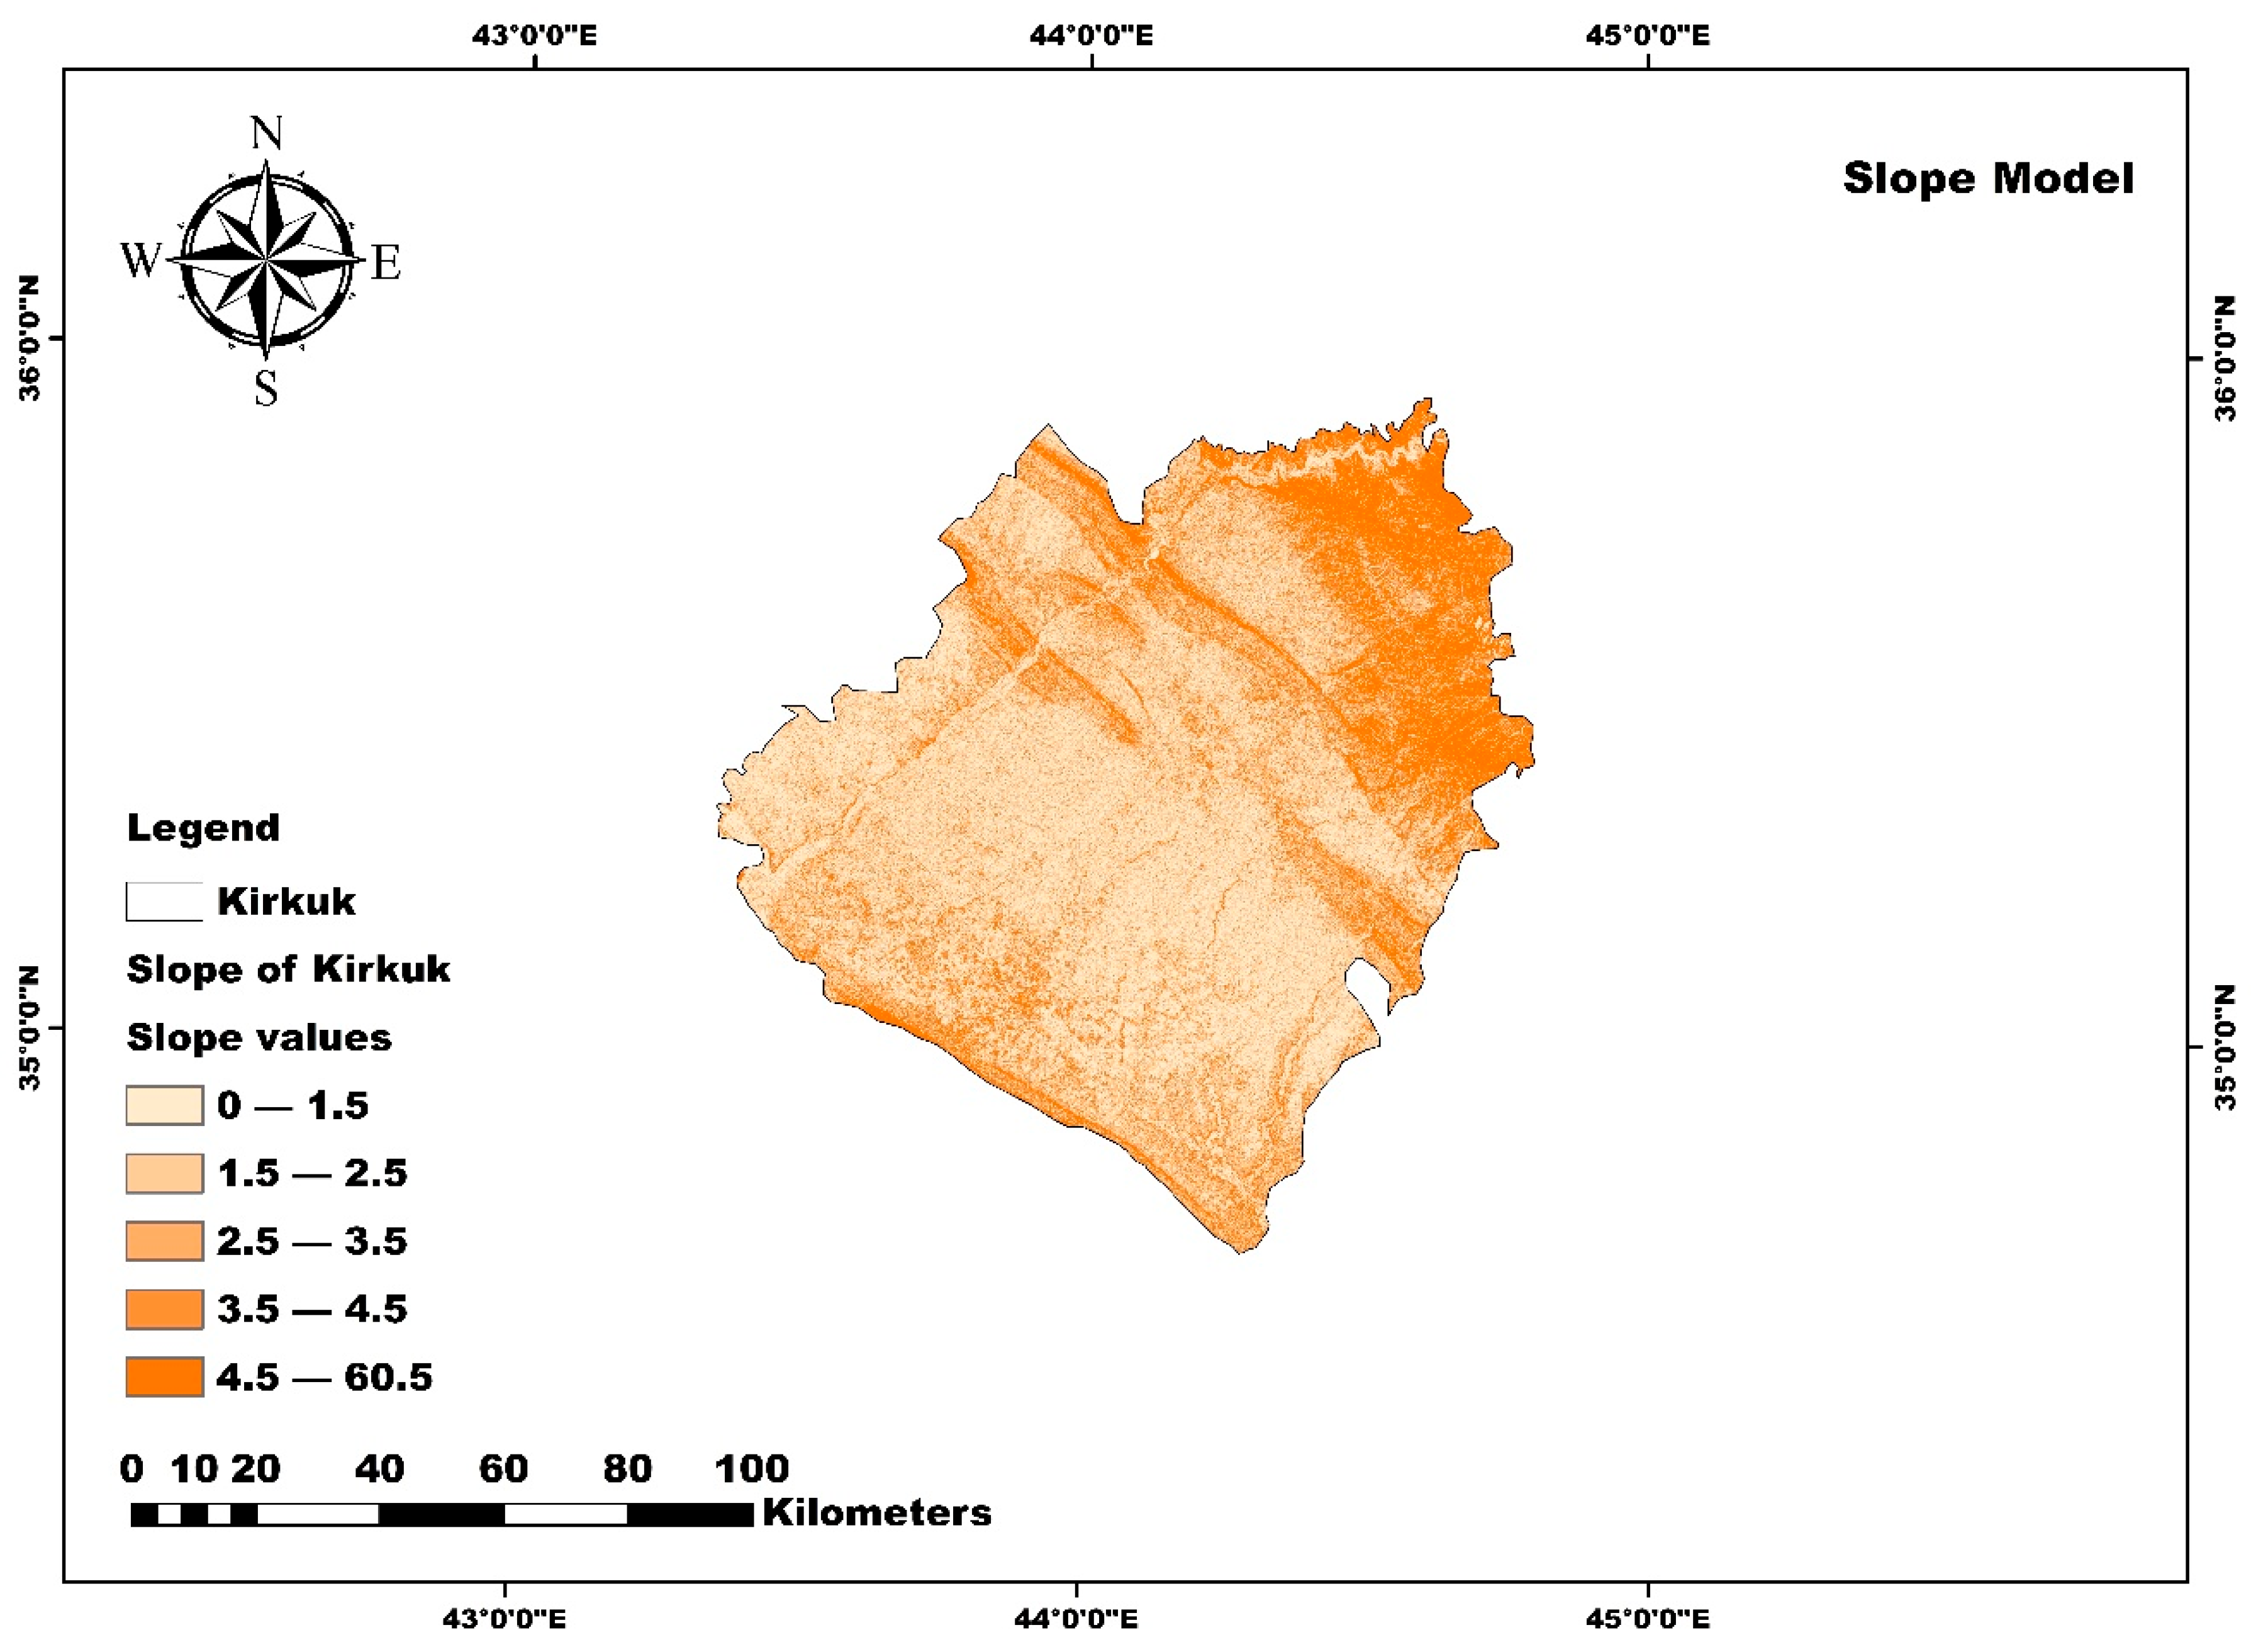
In this study, slope analysis was conducted using a Digital Elevation Model (DEM) with a spatial resolution of 30 m, obtained from the United States Geological Survey (USGS). The slope surface was derived using the Spatial Analyst extension in ArcGIS version 10.8.2. A detailed slope map of the study area was created and then reclassified into five slope categories to enhance interpretation and modelling. These categories represent elevation gradients from flat terrain up to a maximum slope of 60.5 m, providing a clearer understanding of land suitability for RWH interventions.
3.2.3. Drainage Density and Stream Order Models
Assessing drainage density and stream order is crucial for evaluating the suitability of areas for rainwater harvesting (RWH) systems. These factors provide important insights into surface hydrology, particularly how terrain characteristics influence water infiltration. Generally, lower stream orders are associated with higher permeability and better infiltration capacity, making them more favourable for RWH systems. In contrast, higher stream orders typically indicate reduced infiltration and increased surface runoff, which may limit the effectiveness of water harvesting interventions.
Drainage density is quantitatively defined as the total length of all streams and rivers within a watershed divided by the total area of that watershed, as shown in Equation (1) [
43]. This metric is a key indicator of runoff potential and terrain permeability.
Figure 5 illustrates the extraction of stream order from a Digital Elevation Model (DEM) and outlines the procedural workflow for delineating stream networks and assigning hierarchical orders to water courses based on their hydrological connectivity.
L implies the stream length in kilometres, n signifies the count of streams, A implies the drainage area in square kilometres, and DD represents the drainage density.
3.2.4. Soil-Type Model
Soil texture is essential in determining infiltration rates and surface runoff, which directly impact the effectiveness of rainwater harvesting (RWH) systems. Soil texture is classified based on the relative proportions of sand, silt, and clay, with each component affecting the soil’s permeability and water retention capacity. Medium- and fine-textured soils, such as loams and clays, are generally preferred for RWH applications because they have a greater water-holding capacity [
36]. Clay soils are particularly beneficial for water storage due to their low porosity, which allows them to retain moisture for extended periods [
44].
Therefore, the suitability of a location for RWH depends significantly on soil texture, especially when the harvested water is intended for agricultural, livestock, or domestic use [
45]. To further evaluate the infiltration potential, soils in the study area were classified into Hydrologic Soil Groups (HSGs) using data from the United States Department of Agriculture (USDA). These groups, A, B, C, and D, categorise soils based on their infiltration capacity and internal drainage characteristics [
45].
Table 3 summarises the USDA classification of HSGs, providing a framework for incorporating soil data into RWH site selection.
3.2.5. Land Use/Land Cover Model
The volume of runoff generated from individual rainfall events is strongly influenced by the type and density of land cover within a region. Areas with dense vegetation typically promote greater rainfall interception and infiltration, thereby minimising surface runoff [
33].
For the purposes of this study, a land cover raster dataset for the year 2021 was sourced from the ESRI platform. This dataset, featuring a spatial resolution of 10 m, was classified using the maximum likelihood algorithm as a statistical approach that considers the mean, variance, and covariance of pixel values for accurate categorisation using representative sample polygons for each class. Training data were created by selecting representative sample sites for each land use/land cover (LULC) class. These training samples were manually digitised using high-resolution satellite imagery along with existing ancillary data, from ESRI. To specify the exact tools and modules used within ArcGIS 10.8.2, the analysis included reclassification, overlay analysis, and Spatial Analyst tools.
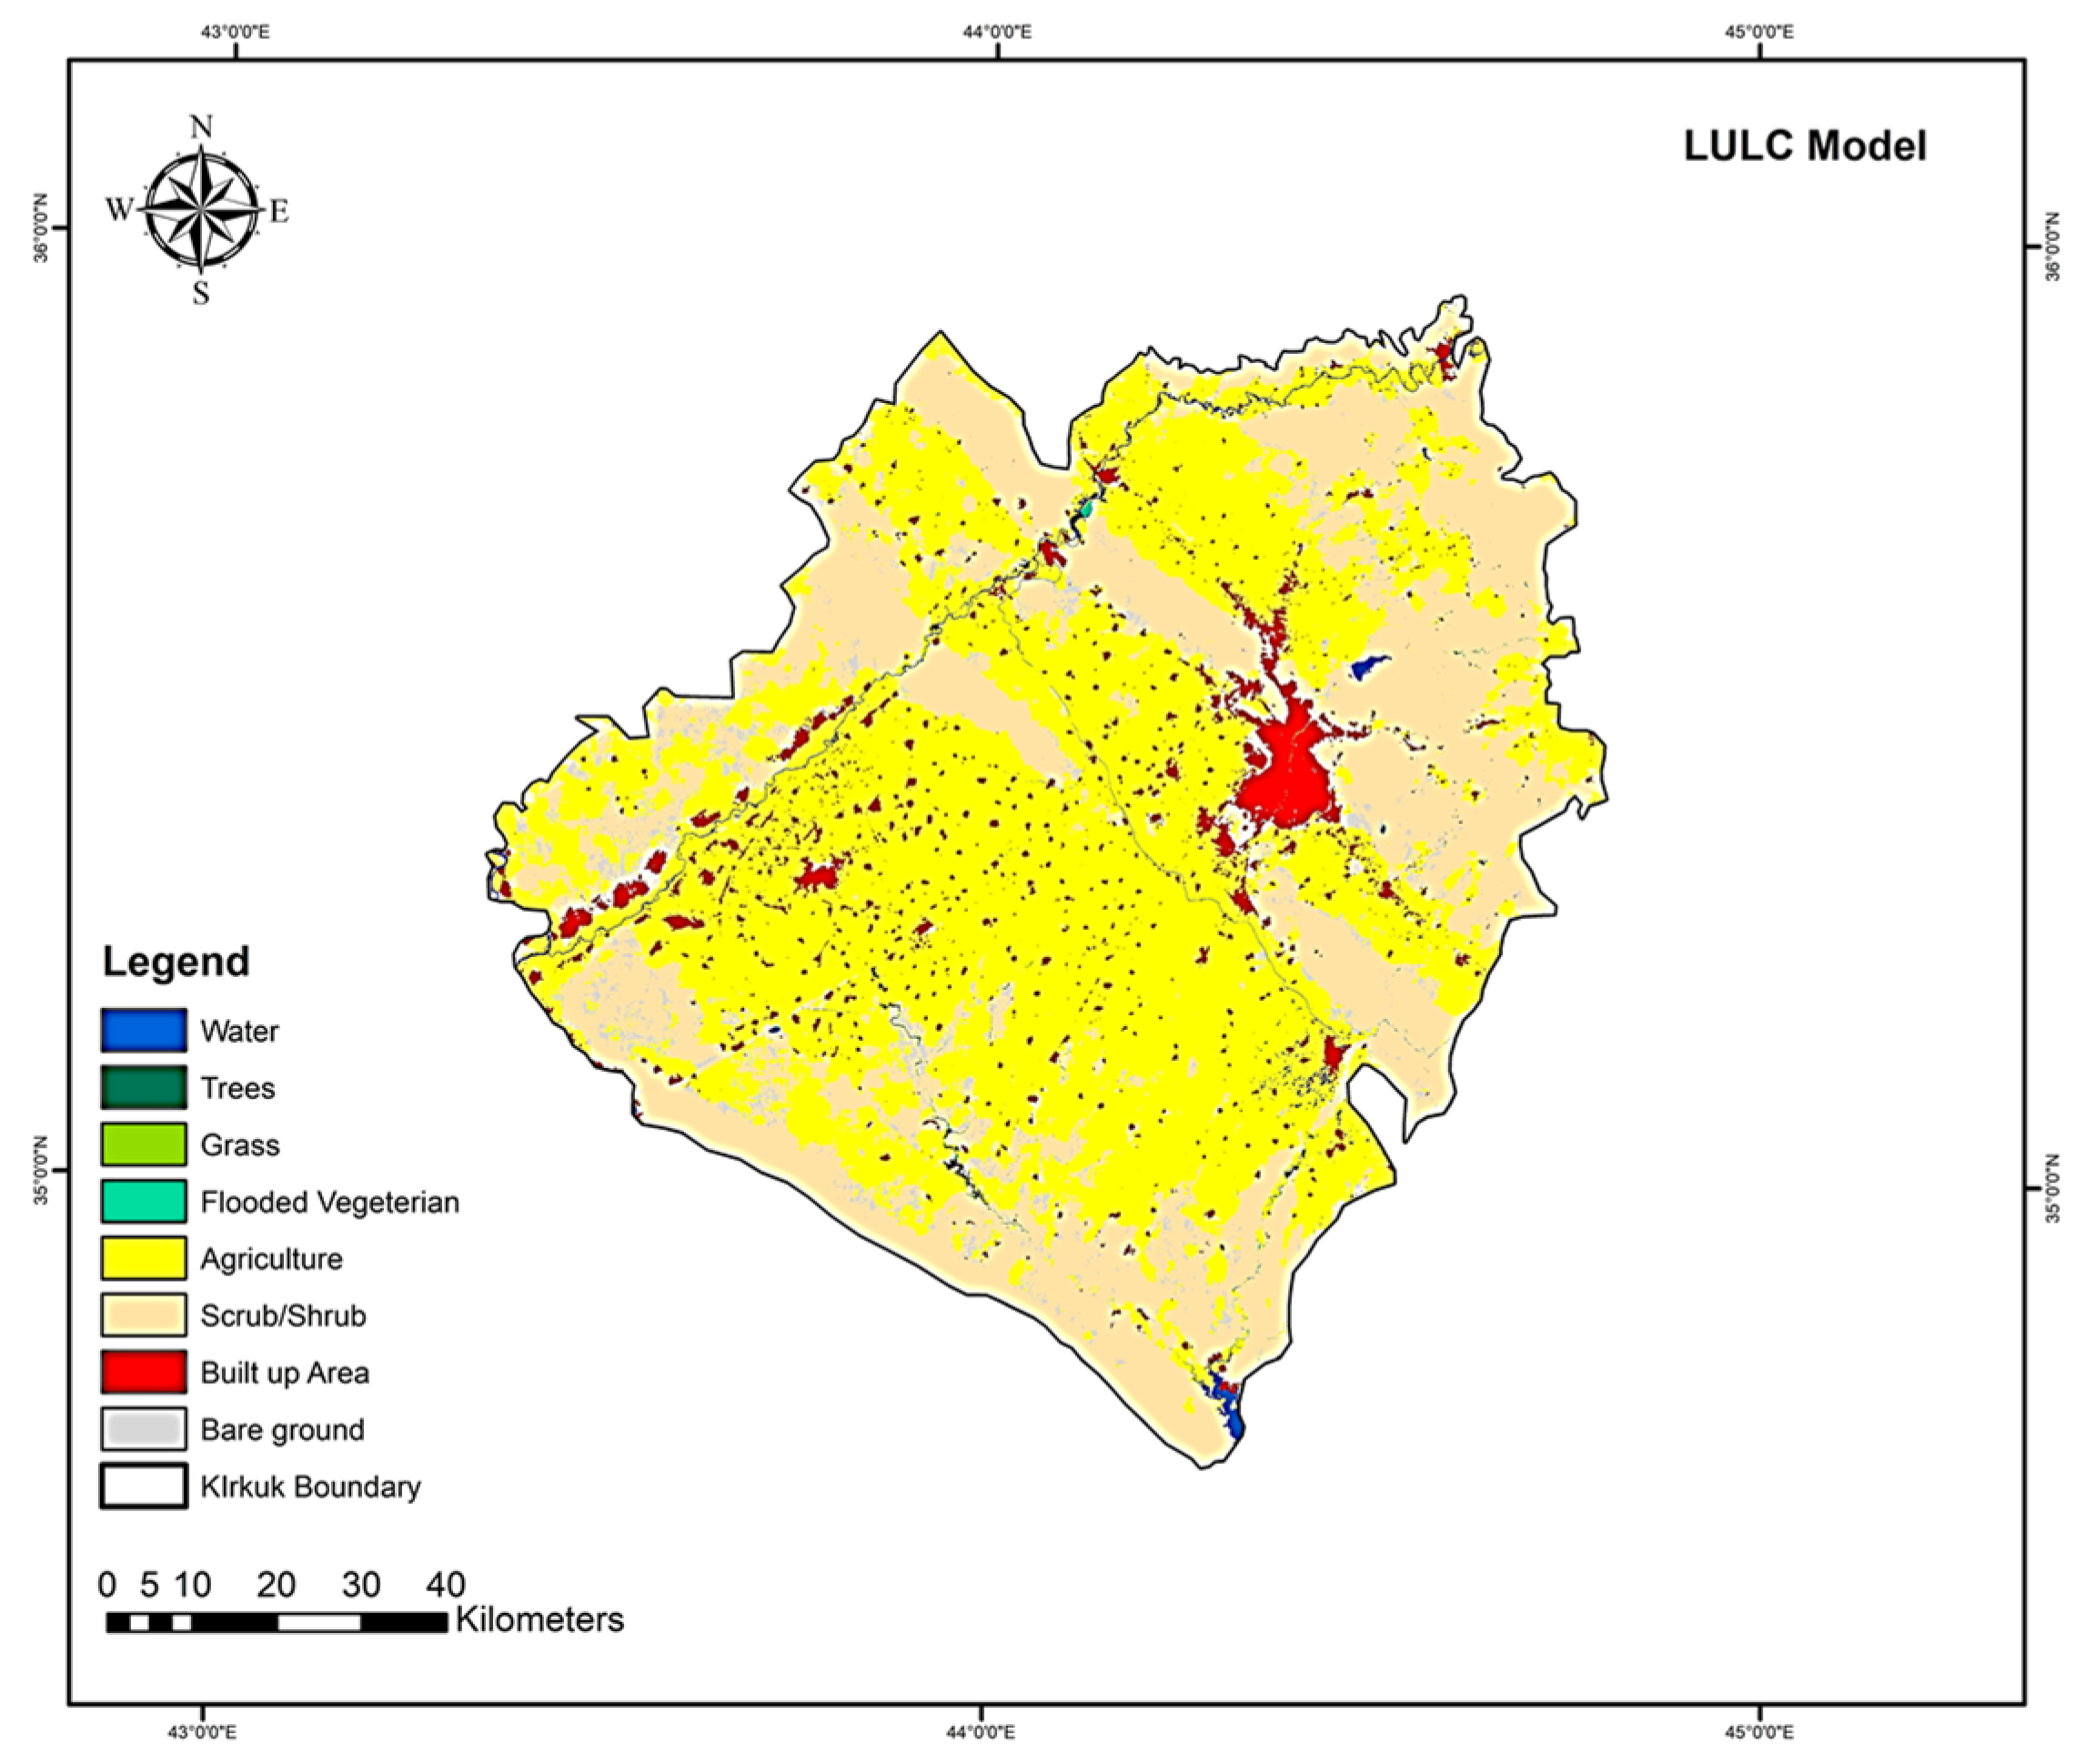
The classification process identified eight distinct land cover types across the study area: water bodies, forested or tree-covered areas, grasslands, flooded vegetation, agricultural land, scrub/shrub zones, urban or built-up areas, and barren land. This categorisation was essential for evaluating the hydrological behaviour of the region, particularly the influence of different land covers on surface runoff dynamics.
Table 4 illustrates each study area with the percentage for each classification.
3.2.6. Rainfall
Rainfall is a crucial factor in determining runoff volumes, as highlighted by the Food and Agriculture Organization (FAO). For rainwater harvesting (RWH) to be effective in arid and semi-arid regions, it is generally recommended that the annual average rainfall falls between 300 and 600 mm [
46,
47]. In this study, we collected rainfall data from several authoritative sources, including the Iraqi Ministry of Agriculture, the Iraqi Meteorological Department, and the Agriculture Consultant Bureau at Kirkuk University. To ensure the accuracy and comprehensiveness of our data, we cross-referenced it with a 40-year dataset (1980–2020) from NASA’s meteorological archives.
We conducted a spatial analysis of rainfall distribution using the Inverse Distance Weighting (IDW) interpolation technique, which is a widely accepted geostatistical method for estimating values in unsampled areas. The Inverse Distance Weighting (IDW) method was selected for its simplicity, computational efficiency, and effectiveness in processing meteorological station data that is relatively evenly spaced in semi-arid regions. Although methods such as Kriging and Spline offer more advanced geostatistical modelling, IDW was considered more appropriate for this study’s goal of generating rainfall surfaces without assuming spatial autocorrelation. Previous studies back up this selection [
46]. Furthermore, we refined and categorised this dataset using reclassification tools in ArcMap to enhance its usability [
48,
49]. The final analysis indicated that the long-term average annual rainfall in the study area is approximately 360 mm.
3.2.7. Depth of Runoff Potential Model
Identifying optimal sites for rainwater harvesting (RWH) relies heavily on evaluating runoff depth, as it directly influences the estimation of potential water yield during precipitation events. To estimate runoff depth, the Soil Conservation Service Curve Number (
SCS-CN) method developed by the U.S. Department of Agriculture (USDA) is widely adopted for its reliability and applicability in hydrological modelling [
50].
The predictive strength of the Curve Number (
CN) method arises from its ability to integrate multiple factors, particularly soil characteristics and land cover types, which together shape rainfall infiltration and surface runoff dynamics [
51].
In this study, CN values were calculated for each raster cell across the study area by combining land use/land cover classifications with soil texture groups. The Curve Number (CN) values for various land use and land cover (LULC) types were derived using the standard guidelines from the USDA Natural Resources Conservation Service (NRCS) hydrological handbook. To assign these CN values, we intersected classified LULC types with Hydrologic Soil Groups (HSGs), categorised as C and D, which were obtained from USDA soil data. The CN lookup values were referenced from the USDA TR-55 table.
For this study, we selected Antecedent Moisture Condition (AMC) II, which reflects average soil moisture conditions and is commonly used as the standard baseline in
SCS-CN modelling [
52]. This choice is justified by the semi-arid climate of the study area, characterised by long dry periods followed by seasonal rainfall, which aligns with the assumptions of AMC II. These spatial inputs served as the basis for applying the
SCS-CN runoff equation, which quantifies runoff depth as outlined in Equation (2).
In the runoff estimation equation, Q represents the runoff depth (measured in mm),
P denotes the total precipitation (also in mm),
S refers to the potential maximum retention after runoff begins (in mm), and
Ia indicates the initial abstraction (in mm). Initial abstraction accounts for early losses such as infiltration, surface storage, evaporation, and vegetation interception that occur before runoff starts [
53]. Empirical studies on various small agricultural catchments indicate that
Ia typically accounts for approximately 20% of
S, which can be expressed as
Ia = 0.2 S [
54]. Therefore, incorporating this relationship into the runoff equation results in a modified form, as shown in Equation (3):
The calculated Curve Number (
CN) enables the estimation of the potential maximum retention capacity (
S) through the application of Equation (4), which is defined as follows:
The Curve Number (
CN) values used for estimating runoff were obtained from the standardised guidelines provided by the United States Department of Agriculture (USDA) Natural Resources Conservation Service (NRCS), specifically from the Technical Release 55 (TR-55) manual. These
CN values were determined by overlaying classified Lc/Lu data by using ArcMap 10.8.2 spatial analysis tools. Curve Numbers (
CNs) are dimensionless values that range from 1 to 100, indicating the runoff potential of a specific area. A
CN value of 100 represents minimal infiltration and maximum runoff, meaning that almost all precipitation becomes surface flow. In contrast, a
CN value close to 1 indicates excellent infiltration capacity with very little runoff. Generally, higher
CN values suggest that a significant portion of rainfall is likely to be converted into surface runoff [
52].
Table 5 illustrates the estimation values of
CNs for each type of hydrological soil group in the study area.
3.2.8. RWHSA Potential Sites Selection Map Model
Geographic Information Systems (GIS) and Remote Sensing (RS) are widely recognised as essential tools for identifying optimal sites for rainwater harvesting (RWH) [
32]. This study employed a comprehensive approach that integrated Multi-Criteria Decision Analysis (MCDA) with GIS, RS, and the Soil Conservation Service Curve Number (
SCS-CN) method to assess and select potential RWH sites within the research area.
To create the RWH potential map model, various thematic layers were integrated using ArcMap’s spatial analysis tools. These layers included slope, runoff, land use/land cover, soil texture, rainfall, and drainage density. Each thematic layer was evaluated for its capacity to retain rainwater based on its specific characteristics.
To assign appropriate weights to each layer, we applied the Analytic Hierarchy Process (AHP) developed by Saaty [
54]. A pairwise comparison matrix was constructed to determine the relative importance of each thematic layer and its attributes. These weights were then standardised using the eigenvector method to ensure consistency and accuracy in the weighting process. The comparative weight matrix values, which aided in identifying the most suitable locations for RWH, are presented in
Table 6 and
Table 7, respectively.
The most influential factors in site selection were found to be rainfall–runoff depth (RD), followed by slope (SL), soil texture (ST), stream order (SO), and land use/cover (LC). The weightings for these layers were derived using Saaty’s AHP pairwise comparison method [
28]. According to the Food and Agriculture Organization (FAO), key factors influencing site evaluation and selection for soil and water conservation include climatic, hydrological, topographic, agronomic, soil, and socioeconomic considerations. The consistency ratio was calculated using Equation (5) as outlined by Saaty [
54].
In this context,
CI represents the consistency index, while
RCI denotes the random consistency index. The consistency index is calculated using the formula provided in Equation (6), which is outlined as follows:
The layers were developed using Saaty’s Analytic Hierarchy Process (AHP) pairwise comparison method [
27]. According to the Food and Agriculture Organization (FAO), the key factors that influence site evaluation and selection for soil and water conservation include climatic, hydrological, topographic, agronomic, and soil factors. The consistency ratio was calculated using Equation (5), as described by Saaty [
54].
4. Results
4.1. Rainfall Analysis
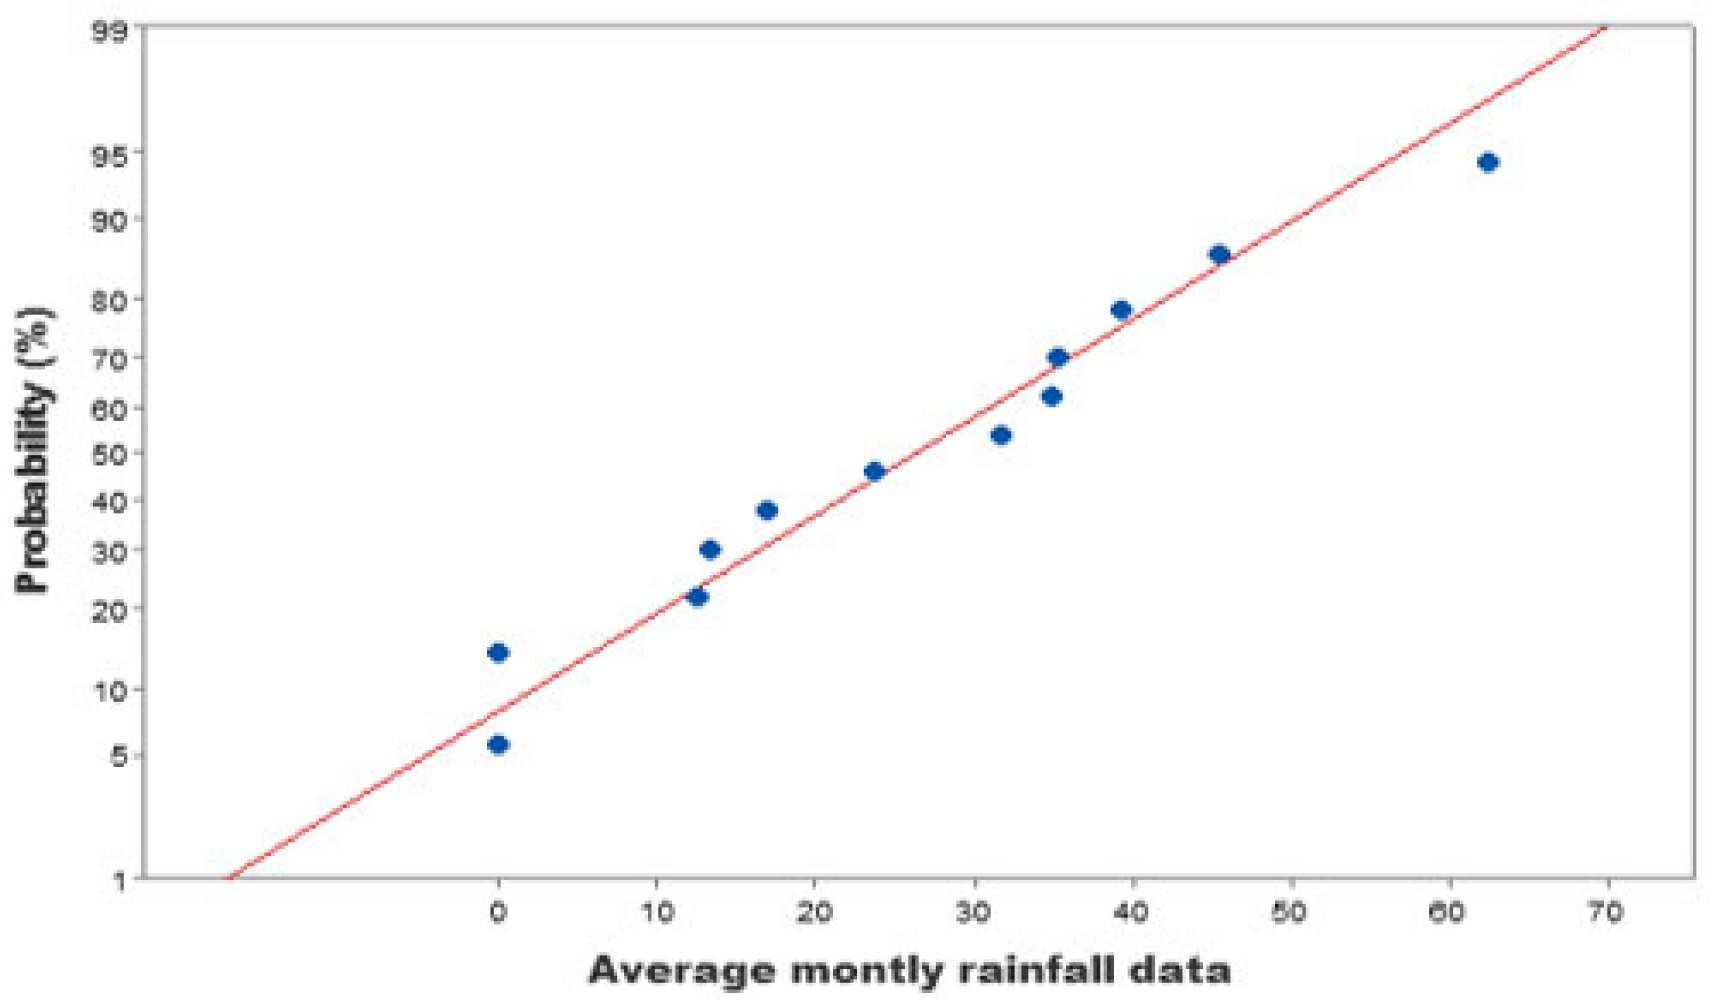
Rainfall data is inherently uncertain, and this uncertainty is formally quantified using probability distributions. To minimise errors and ensure consistency, the rainfall statistics were cross-verified with data from the NASA Power Project and the Iraqi Ministry of Agriculture. As illustrated in
Figure 6, the mean monthly rainfall data underwent a probability distribution test, specifically the Anderson–Darling test, to address these uncertainties. The results from the Kirkuk station show some skewness and variations in the spatial rainfall patterns. This probability-based approach is valuable for research on agricultural sustainability, as input uncertainty directly affects the uncertainty of the output. For this study, a probability threshold of 65% was selected for fitting the data.
Using ArcMap 10.8.2 and the Inverse Distance Weighting (IDW) method, we created a map showing the 40-year average annual precipitation across the study area. The analysis of the precipitation distribution revealed a distinct spatial pattern: the northeastern region experiences lower precipitation levels, while the central and western regions receive significantly more rainfall.
Figure 7 illustrates this distribution, indicating that the highest recorded precipitation is 490 mm, while the lowest is 200 mm.
4.2. Land Use/Land Cover Model
The land use and land cover model for the Kirkuk province study area underwent reclassification, resulting in eight distinct categories: water bodies, grass, flooded vegetation, built-up areas, scrub/shrub, and bare ground, as illustrated in
Figure 8. The predominant land types in the study area are agronomic lands, which cover approximately 60%, and built-up/shrub areas, which account for about 35%. Built-up areas make up roughly 5% of the total study area and are considered unsuitable for rainwater catchment systems. The remaining land types, including bare ground, grass, trees, and flooded vegetation, collectively comprise approximately 17% of the total agricultural systems. However, the most suitable locations for collecting rainfall runoff are the agricultural and scrub/shrub regions.
4.3. Slope Model
The slope model map was created using elevation data from a Digital Elevation Model (DEM) with a resolution of 30 m by 30 m. A filtering technique was applied to determine the slope values within a specified parameter range. After this, a classification process was conducted to identify areas suitable for rainwater harvesting (RWH). The slope model was divided into five distinct categories: 0–1.5% as low, 1.5–2.5% as mild, 2.5–3.5% as moderate, 3.5–4.5% as sharp, and 4.5–60% as very sharp. Among these categories, the “low” and “mild” slope classes are particularly favourable for RWH, covering a significant portion of the study area.
Figure 9 visually represents the slope model across Kirkuk province.
4.4. Stream Order Model
The stream order map was generated through a series of hydrological pre-processing steps followed by digitisation and classification of the drainage network using ArcGIS 10.8.2. Initially, a hydrologically corrected Digital Elevation Model (DEM) was employed to derive flow direction and flow accumulation rasters using tools available in the Spatial Analyst Toolbox. A flow accumulation threshold was applied to delineate the stream network, which was then processed using the Stream Order tool to assign hierarchical stream orders.
The resulting stream order layer classifies streams into six categories, ranging from first-order, small headwater channels to sixth-order, major trunk streams, as illustrated in
Figure 10. This hierarchical structure provides critical insight into the spatial organisation of the catchment’s hydrological network. According to Ammar, Riksen, Ouessar, and Ritsema [
34], the higher-order streams, typically orders 4 and above, are generally more favourable for rainwater harvesting (RWH) interventions. These areas are characterised by greater drainage convergence, higher runoff volumes, and more stable channel forms, making them more reliable for capturing and storing surface water. The stream order classification thus serves as a key decision support layer in identifying priority zones for sustainable water management practices within the watershed.
4.5. Hydrologic Soil Groups (HSGs)
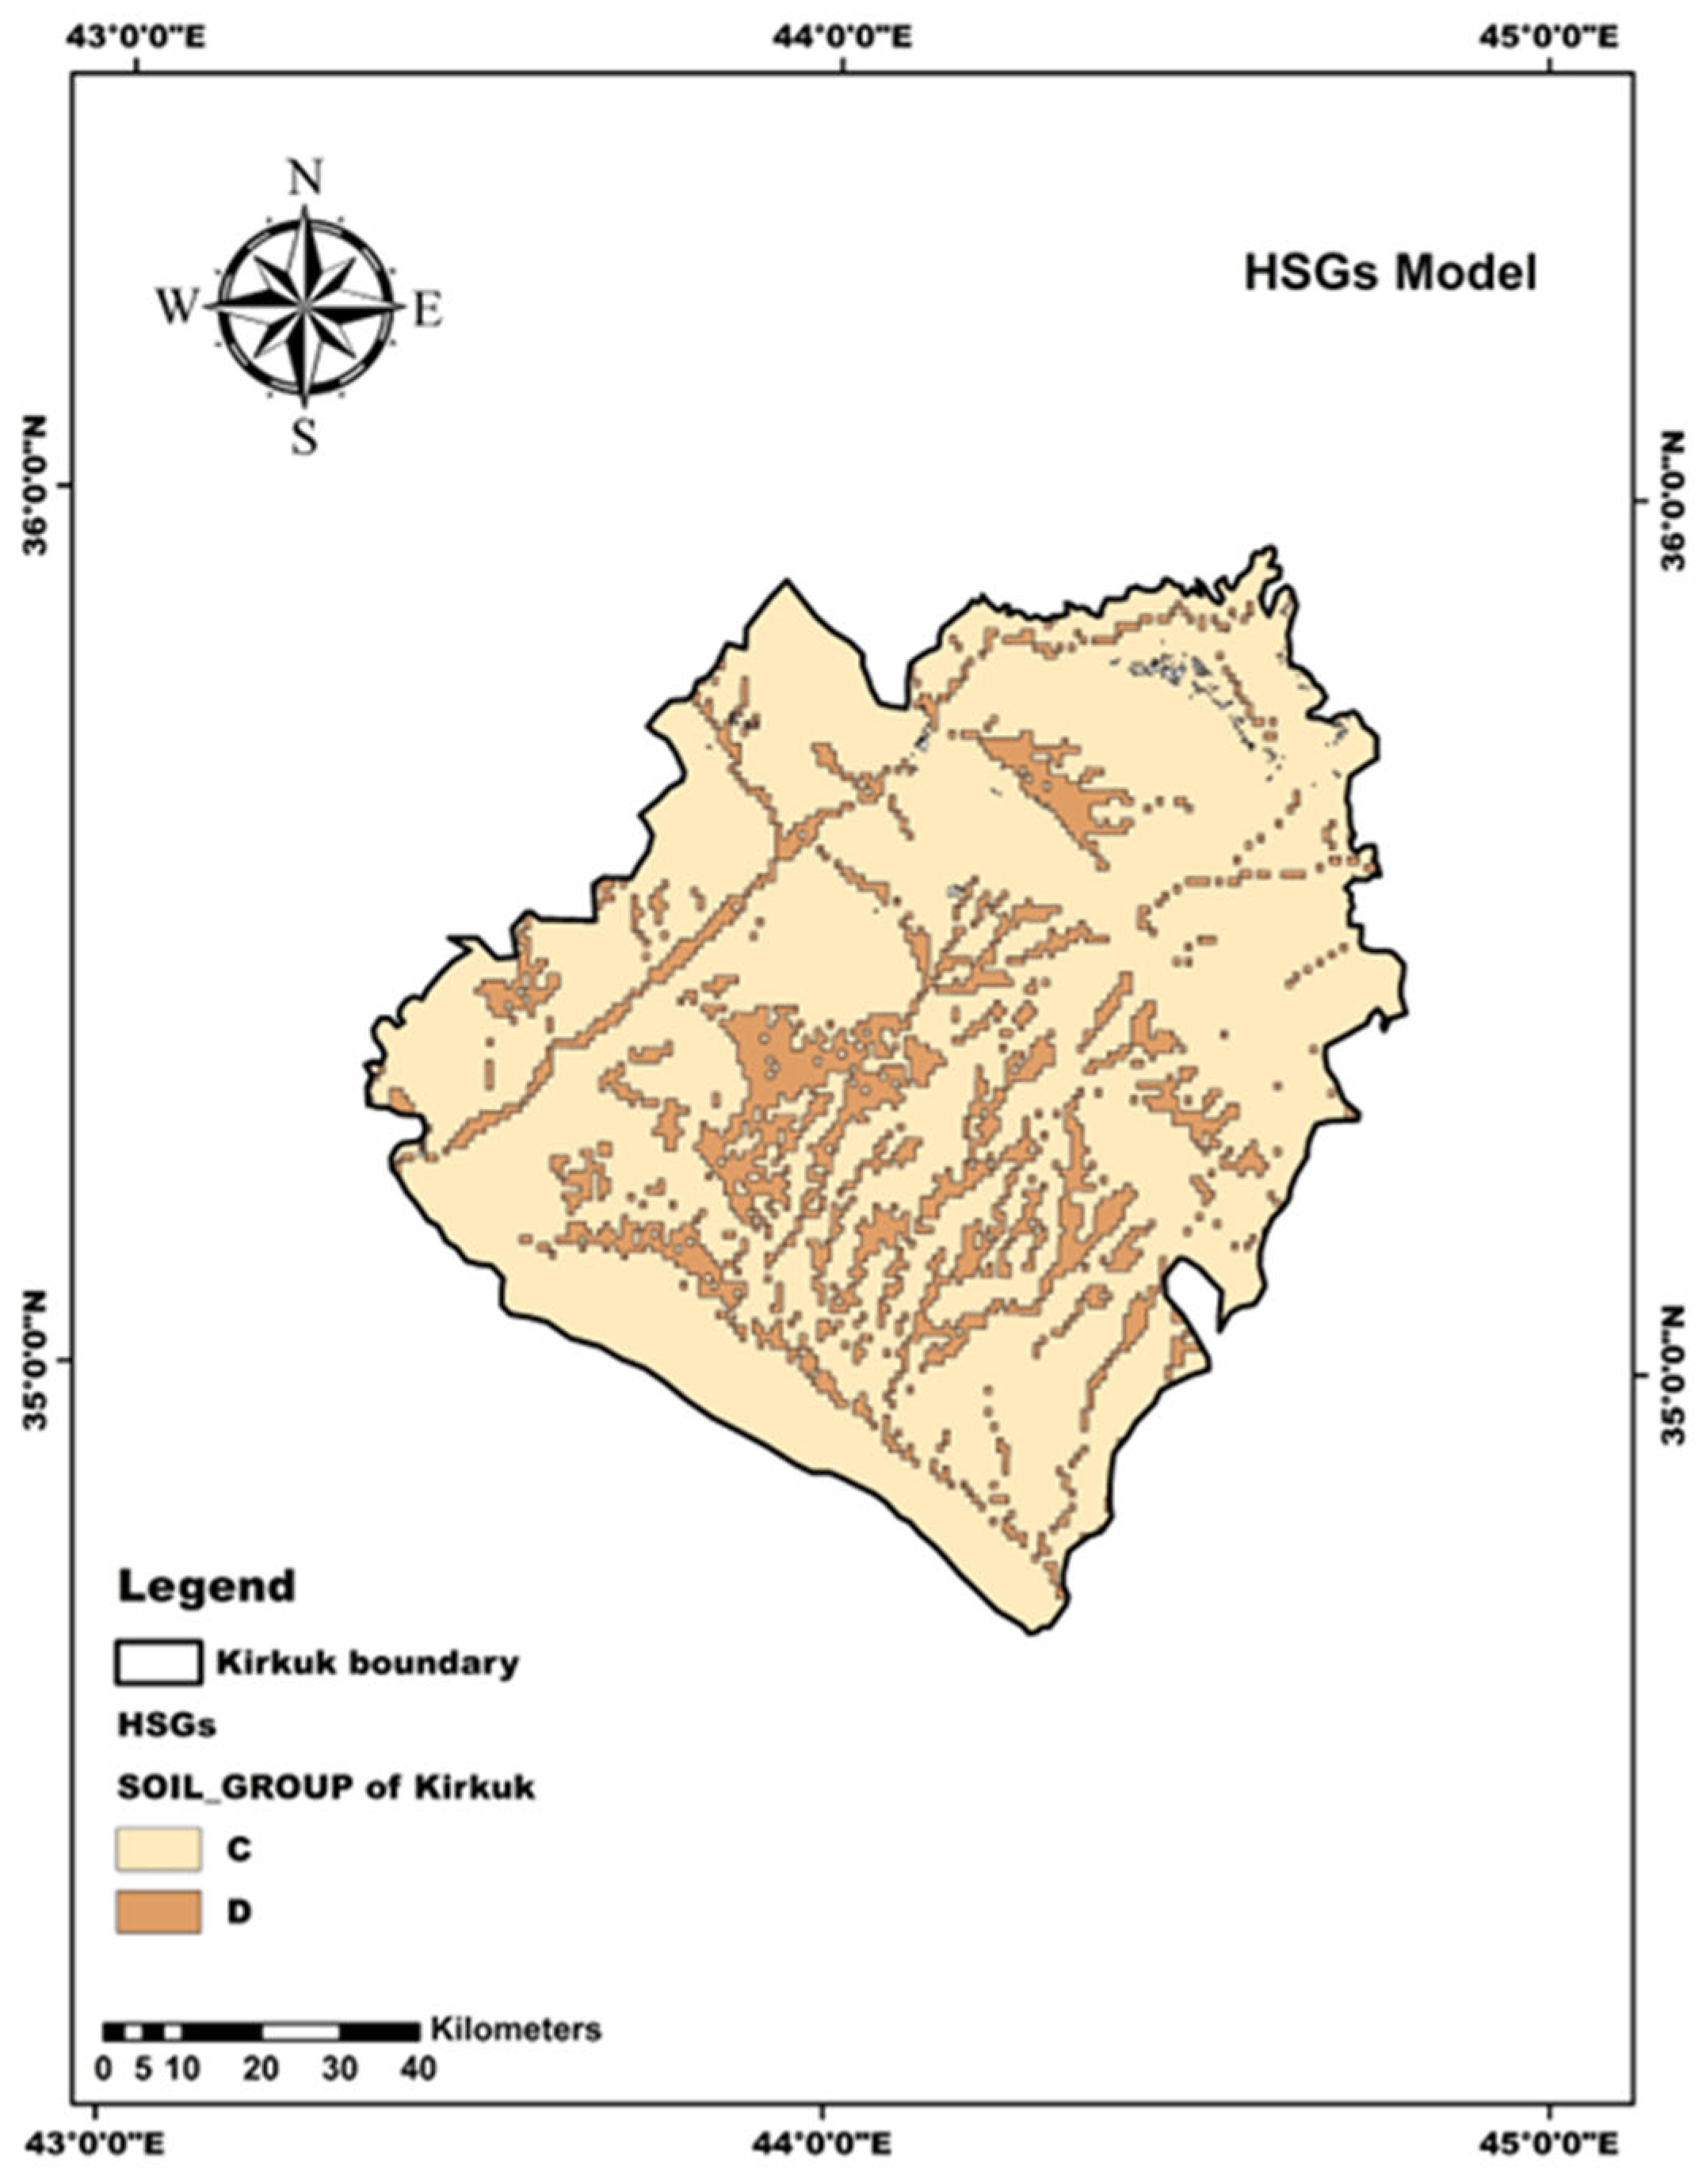
In Kirkuk province, the soil texture has been categorised into two predominant types: clay loam and clay, which correspond to Hydrologic Soil Groups (HSGs) C and D, respectively, as delineated in the soil classification map (
Figure 11). This classification is based on the physical properties of the soils in the study area, particularly their infiltration capacity and runoff potential. Spatial Analyst tools were used to re-classify HSG by employing ArcGIS 10.8.2 software.
HSG C soils, which exhibit low infiltration rates when thoroughly wet due to moderately fine textures, are the dominant group, covering a substantial portion of the region. These soils are typically associated with moderate runoff potential and are widely distributed across both agricultural and undeveloped lands. In contrast, HSG D soils, characterised by very low infiltration rates due to their fine texture and high clay content, are more localised, appearing in scattered patches throughout the province. These areas are more prone to surface runoff under rainfall events. The spatial distribution and characteristics of these soil groups have significant implications for rainwater harvesting (RWH) potential site selection.
4.6. Drainage Density Model
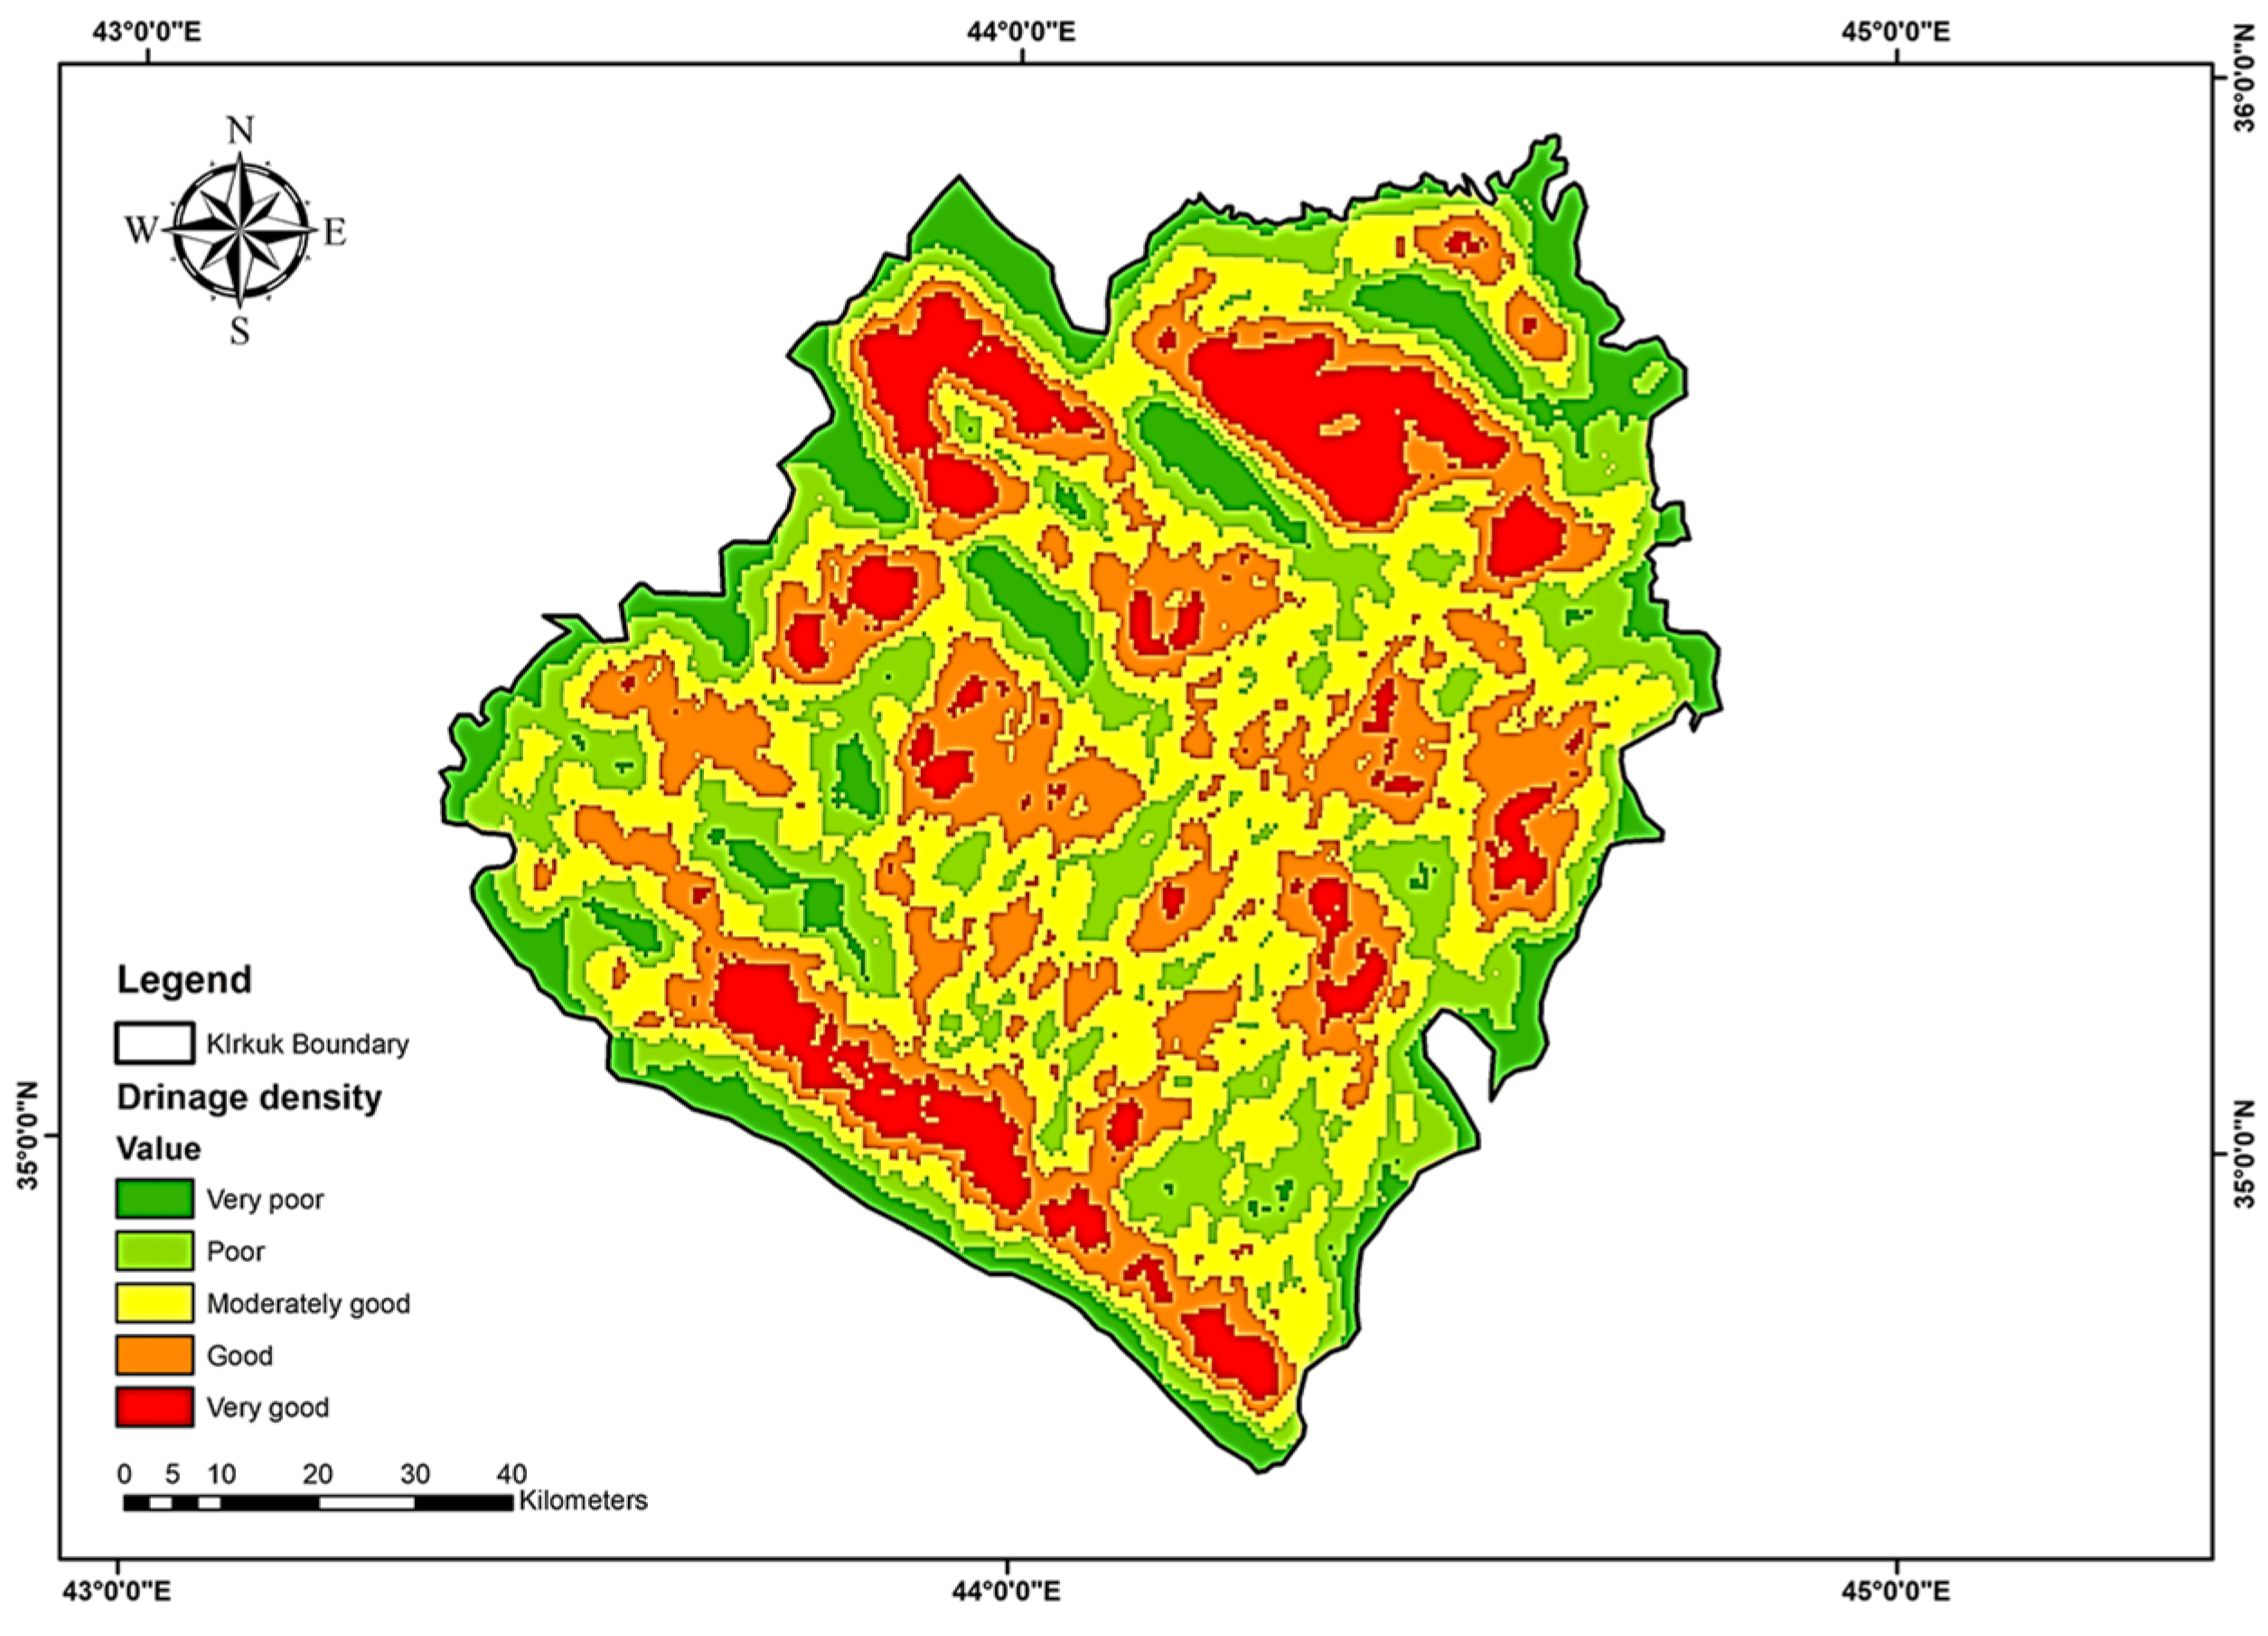
The drainage density within the study area has been classified into five distinct categories: “very poor” (5.34 km
2), “poor” (8.79 km
2), “moderately good” (12.71 km
2), “good” (10.03 km
2), and “very good” (4.75 km
2). These classifications reflect the relative concentration of drainage channels per unit area and are visualised spatially in
Figure 12.
The “moderately good” and “good” drainage density classes dominate the landscape, representing the most extensive zones within the study region. These areas typically feature a balanced drainage network, facilitating moderate runoff while still allowing for some infiltration, which is favourable for rainwater harvesting (RWH) and sustainable watershed management.
The “very good” drainage density class, while present, is more spatially restricted, occupying relatively smaller, isolated zones. This classification indicates areas with a high concentration of stream channels, often associated with steep slopes or impermeable surfaces, resulting in rapid runoff and reduced water retention.
Conversely, the “very poor” drainage density class is primarily concentrated along the outer peripheries of the study area, where fewer natural channels exist. These zones may correspond to flatter terrains or areas with more permeable soils, allowing greater infiltration and less surface flow. The “poor” category shows a transitional distribution, extending from the margins toward central parts of the study area, reflecting zones with lower but not minimal drainage development.
Understanding this spatial variability in drainage density is essential for identifying suitable zones for hydrological interventions, including RWH structures. Areas with moderate drainage densities often represent optimal conditions, as they balance runoff generation with the potential for storage and infiltration, making them strategic targets for integrated water resource management.
4.7. Runoff Depth Potential Model
Using ArcGIS software, we processed and analysed all thematic layers related to Hydrologic Soil Groups (HSGs) and land use/cover, resulting in the creation of a Curve Number (
CN) model. This model assigns standardised values to each land use/cover category, along with the corresponding
CN values based on HSG types. The
CN grid values for the Kirkuk study area were generated through this process, as shown in
Figure 13. These values ranged from a minimum of 70 to a maximum of 100. A higher
CN value indicates lower infiltration potential and higher runoff, while a lower
CN suggests higher infiltration and lower runoff. These calculations and visualisations were conducted using ArcMap tools. By integrating the
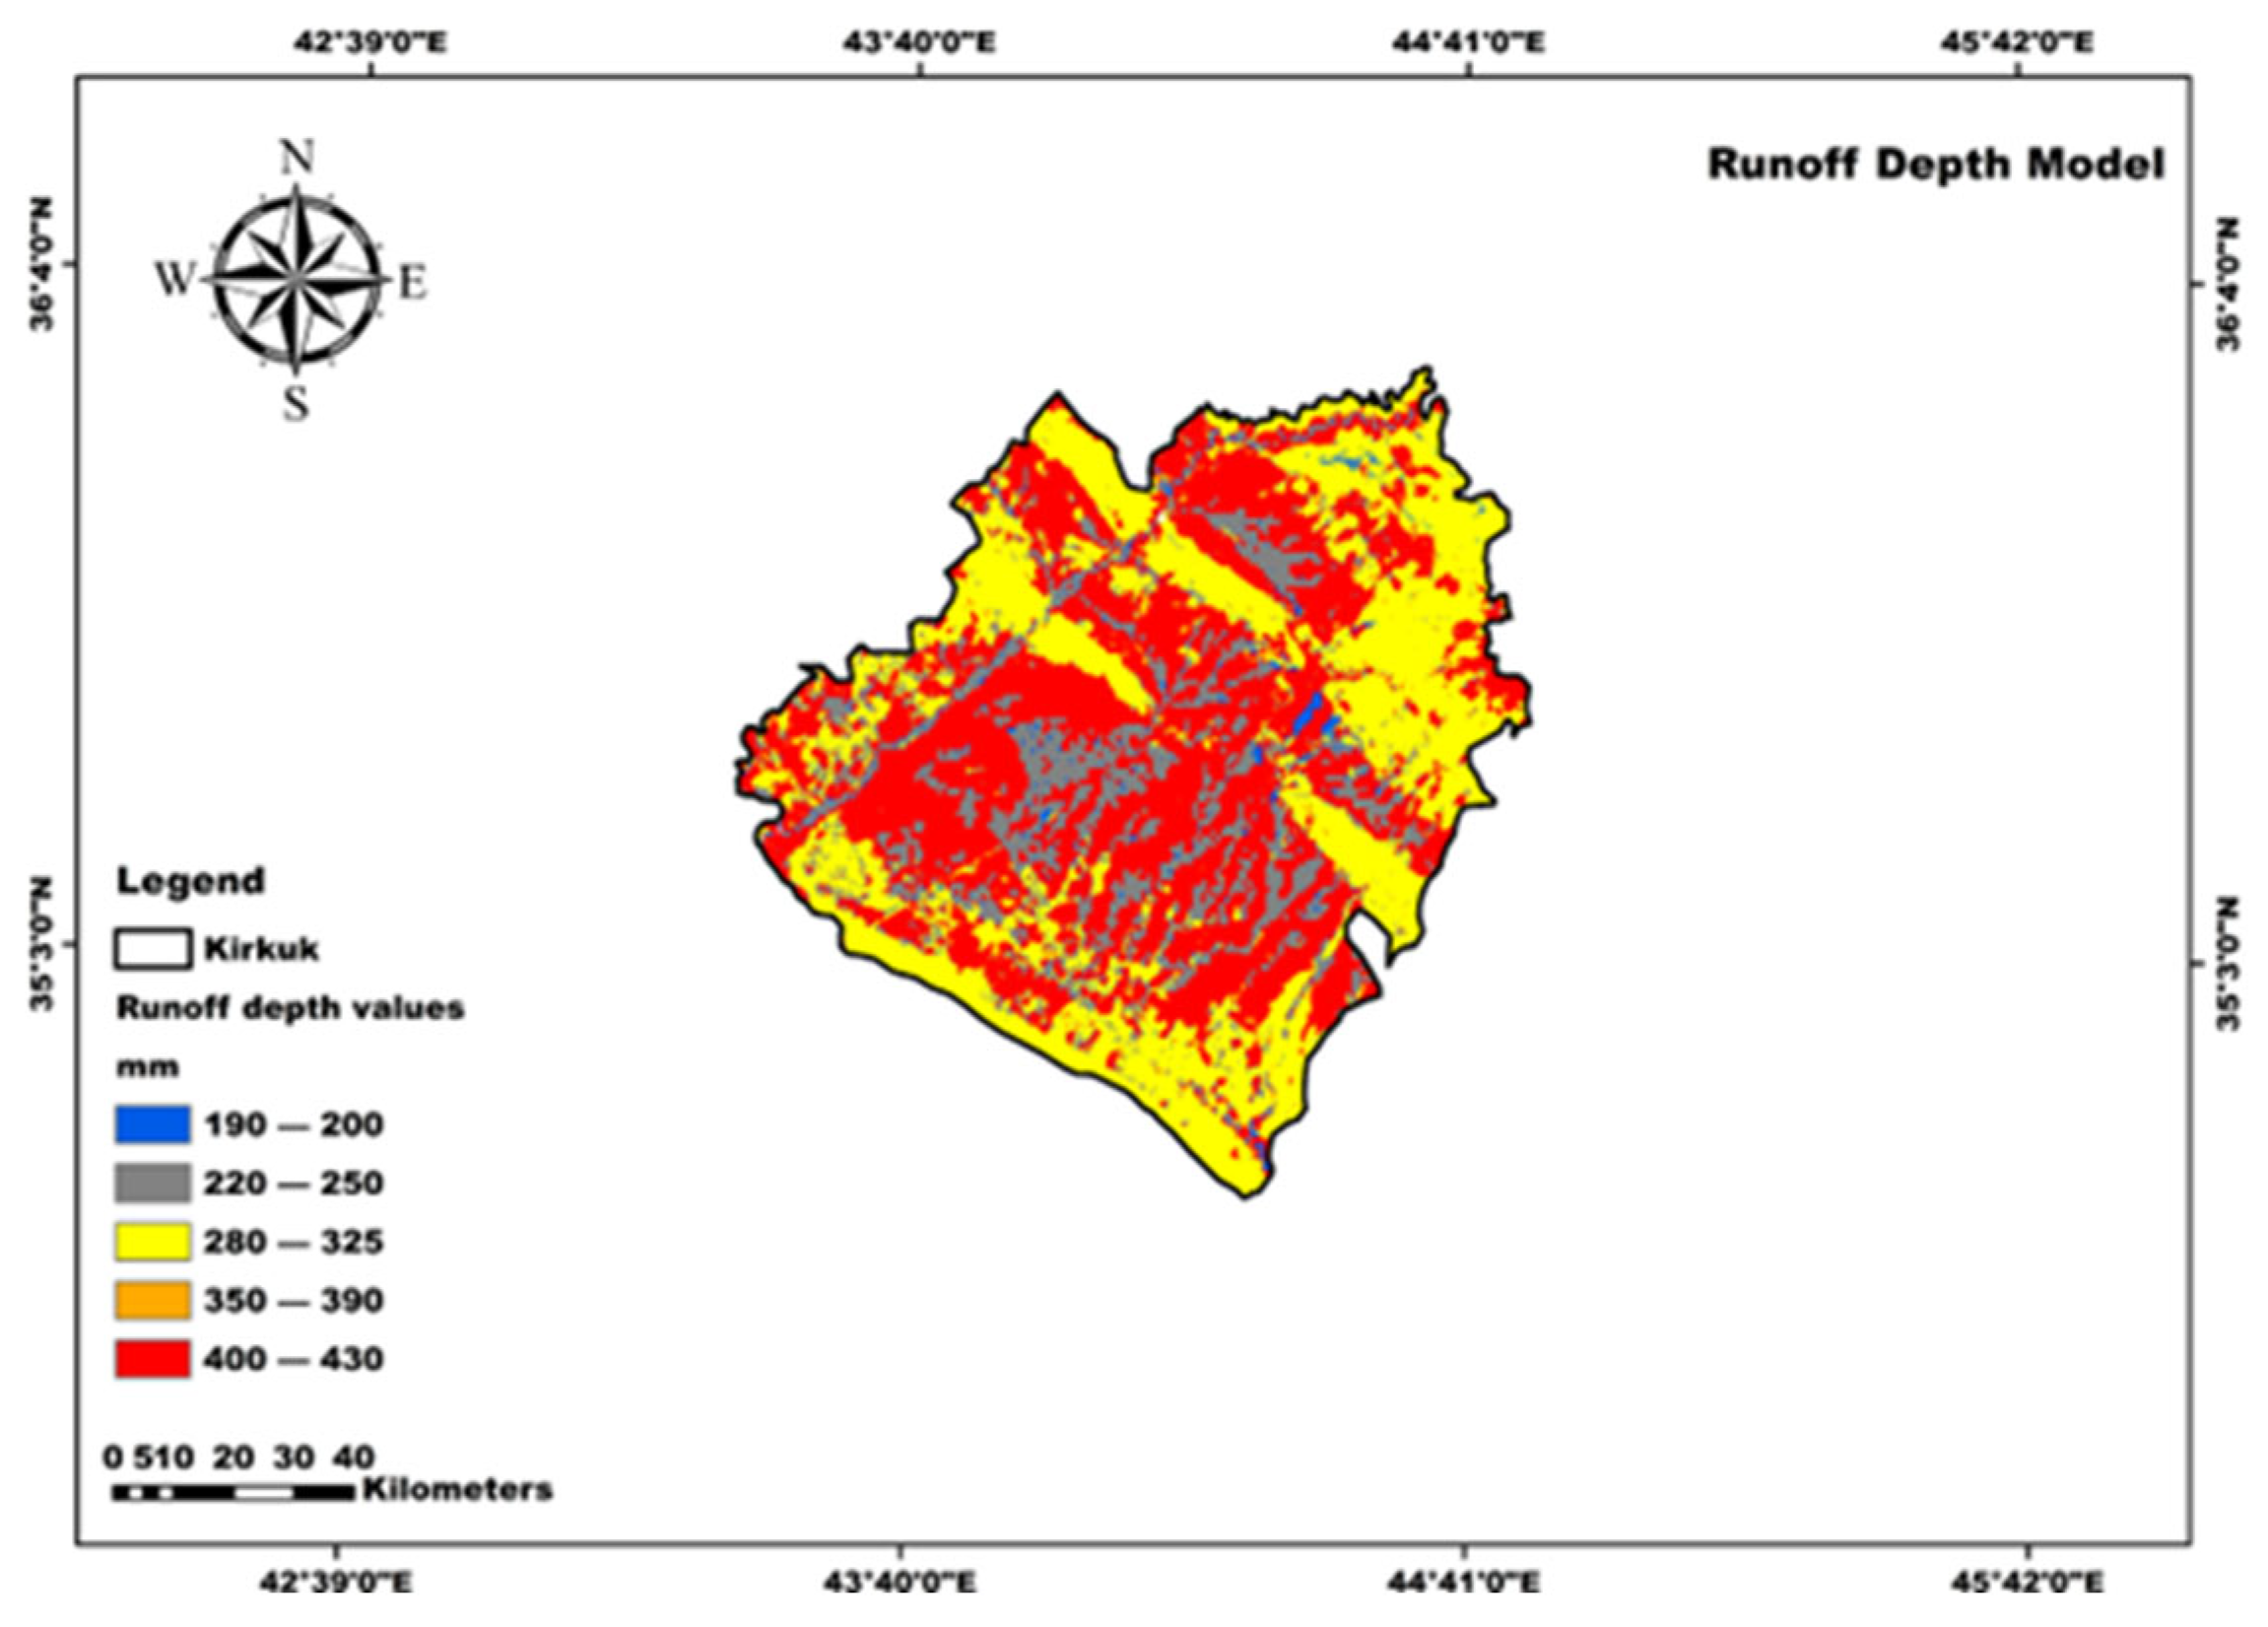
CN grid values with the corresponding land use/cover for each polygon, we applied pixel values to generate the rainwater harvesting (RWH) potential map. This step was crucial for calculating runoff, which was integral to building the model. A classification system was established to categorise runoff depth into five levels: “very poor” (190 mm), “poor” (200–250 mm), “moderate” (290–340 mm), “good” (350–400 mm), and “very good” (>400 mm). Most of the watershed areas displayed locations with “very good” to “moderate” runoff potential. This distribution is clearly illustrated in
Figure 14, which shows the yearly runoff depth values in millimetres for Kirkuk province. Additionally,
Figure 15 highlights the correlation between rainfall and runoff in the study area.
CN estimated values of Kirkuk province are illustrated in
Table 8 for each type of Lc/Lu with percentage area.
4.8. Sensitivity Analysis
The literature provides extensive coverage of various methodologies for conducting sensitivity analysis within Geographic Information Systems–Multi-Criteria Decision Analysis (GIS-MCDA) [
55,
56]. A key technique in this domain involves the reassignment of criterion values, which has been utilised in this study.
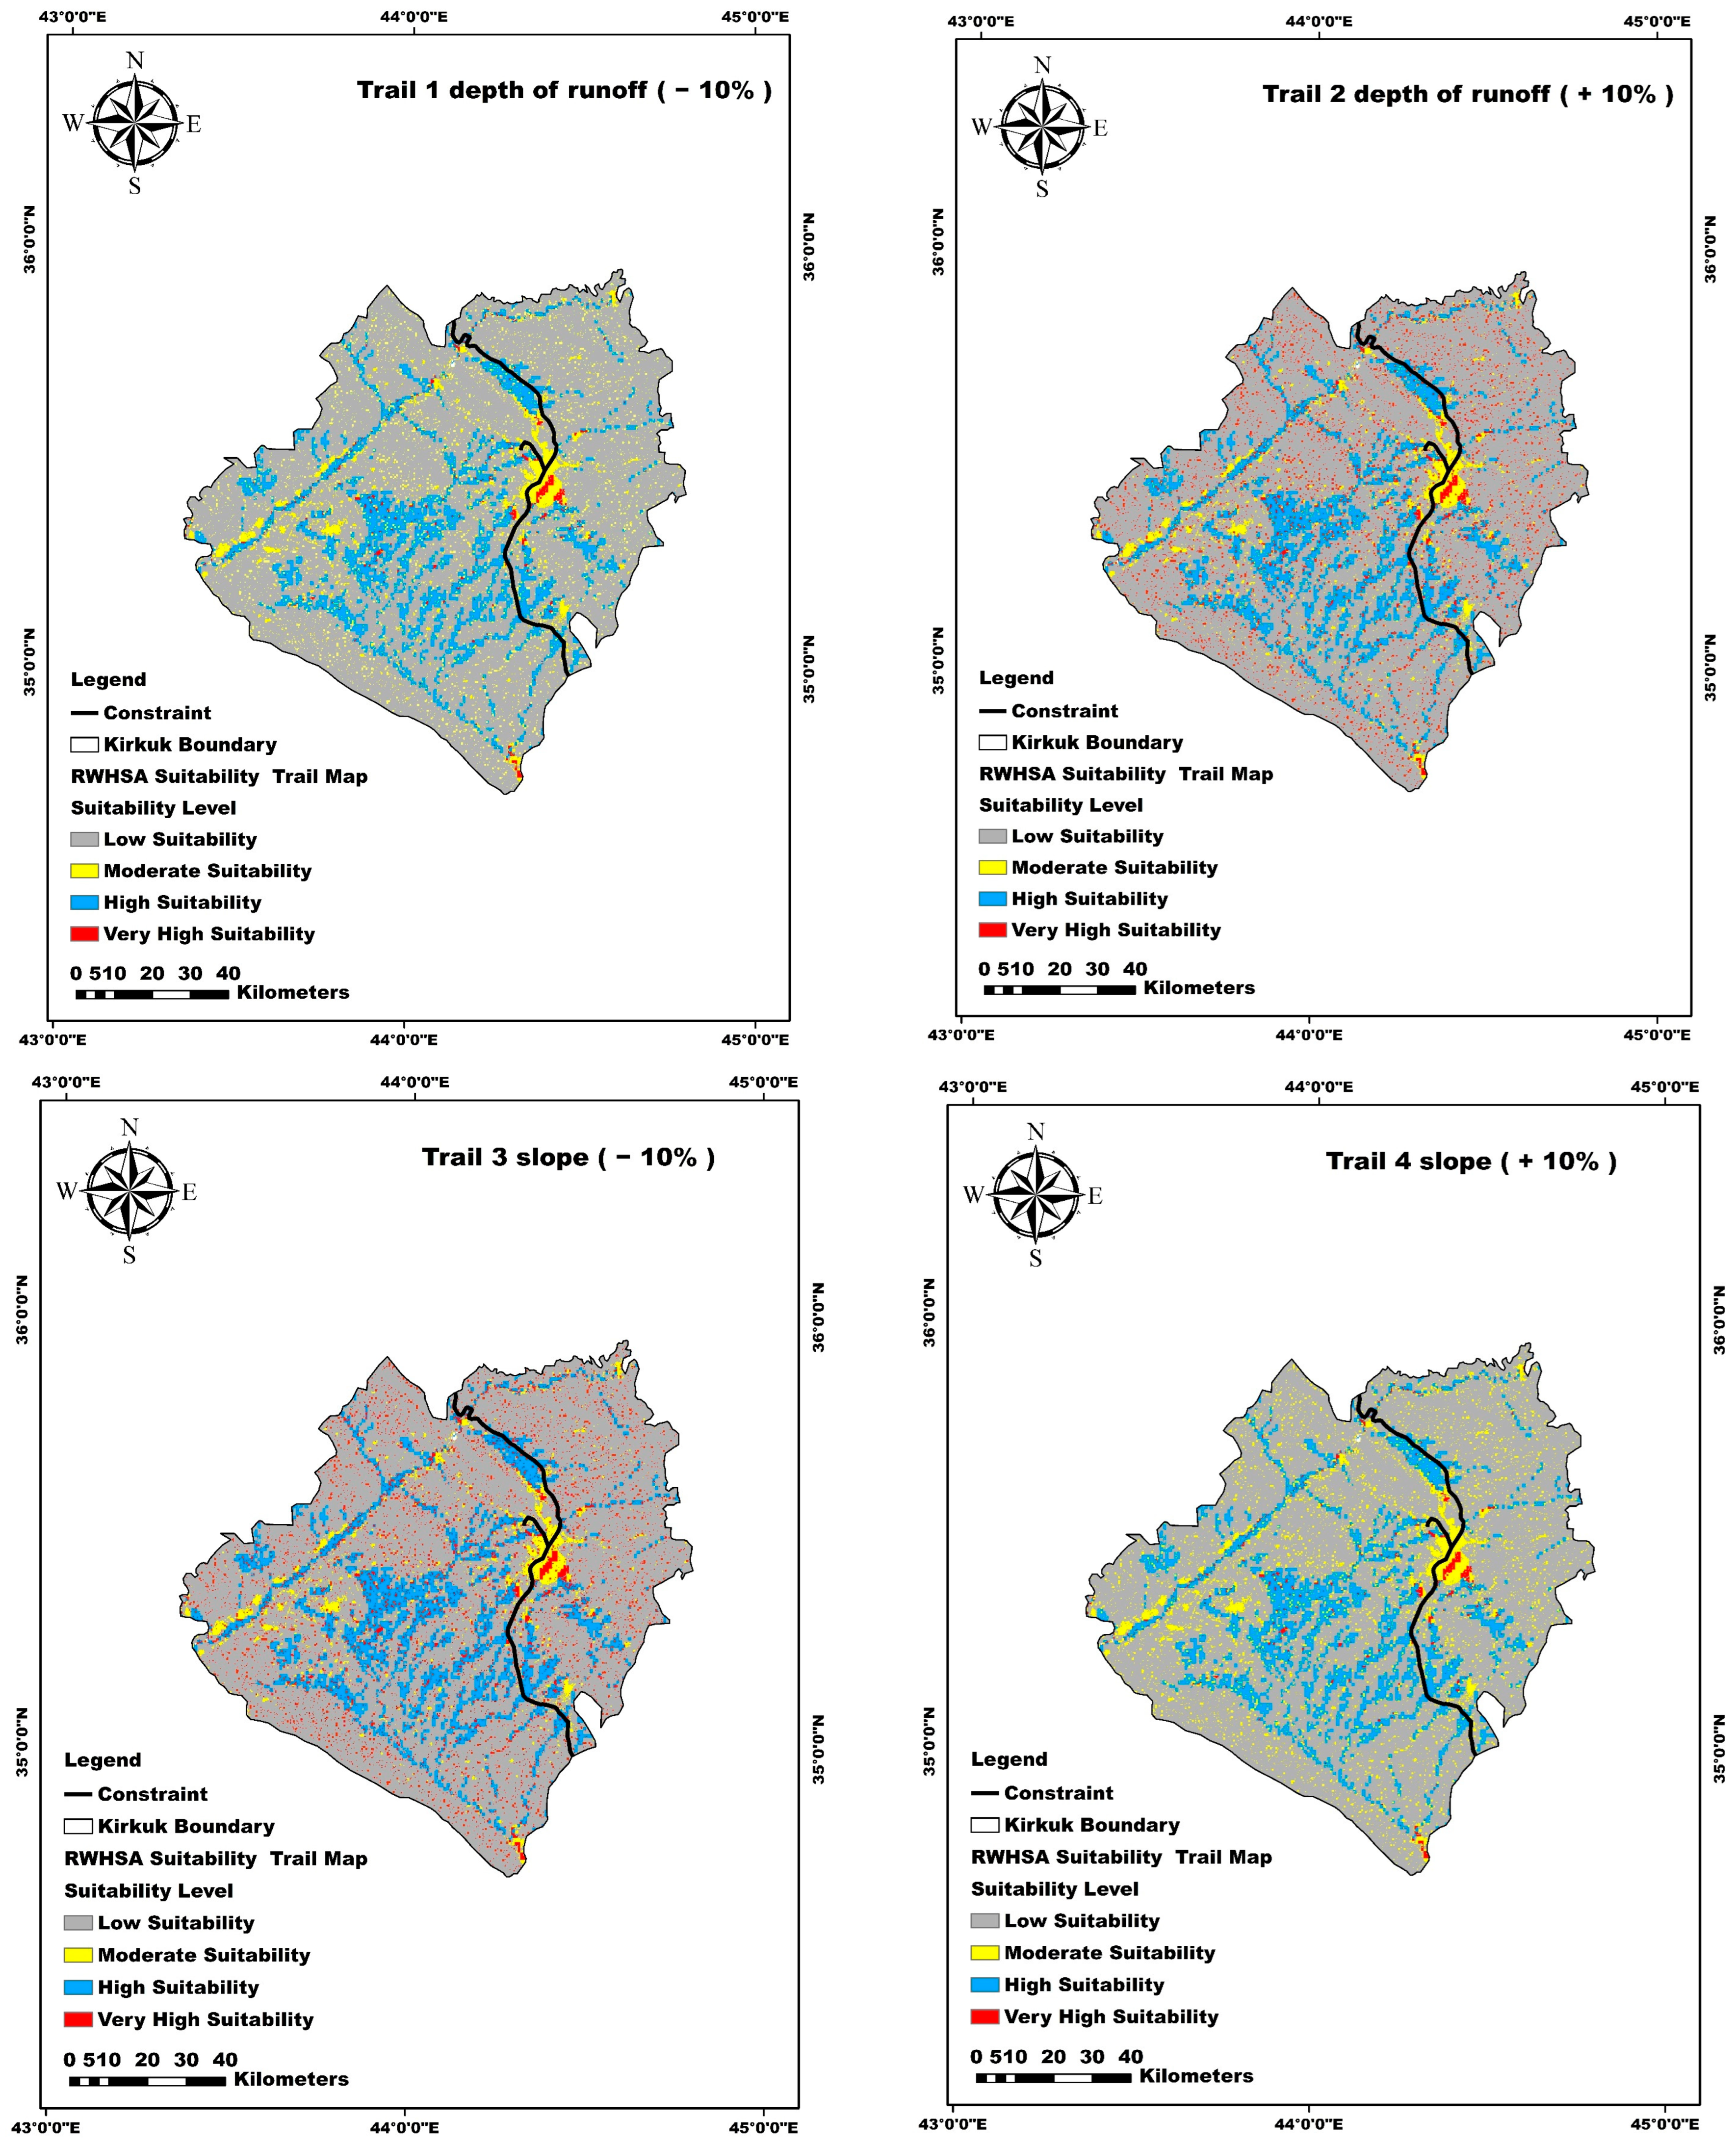
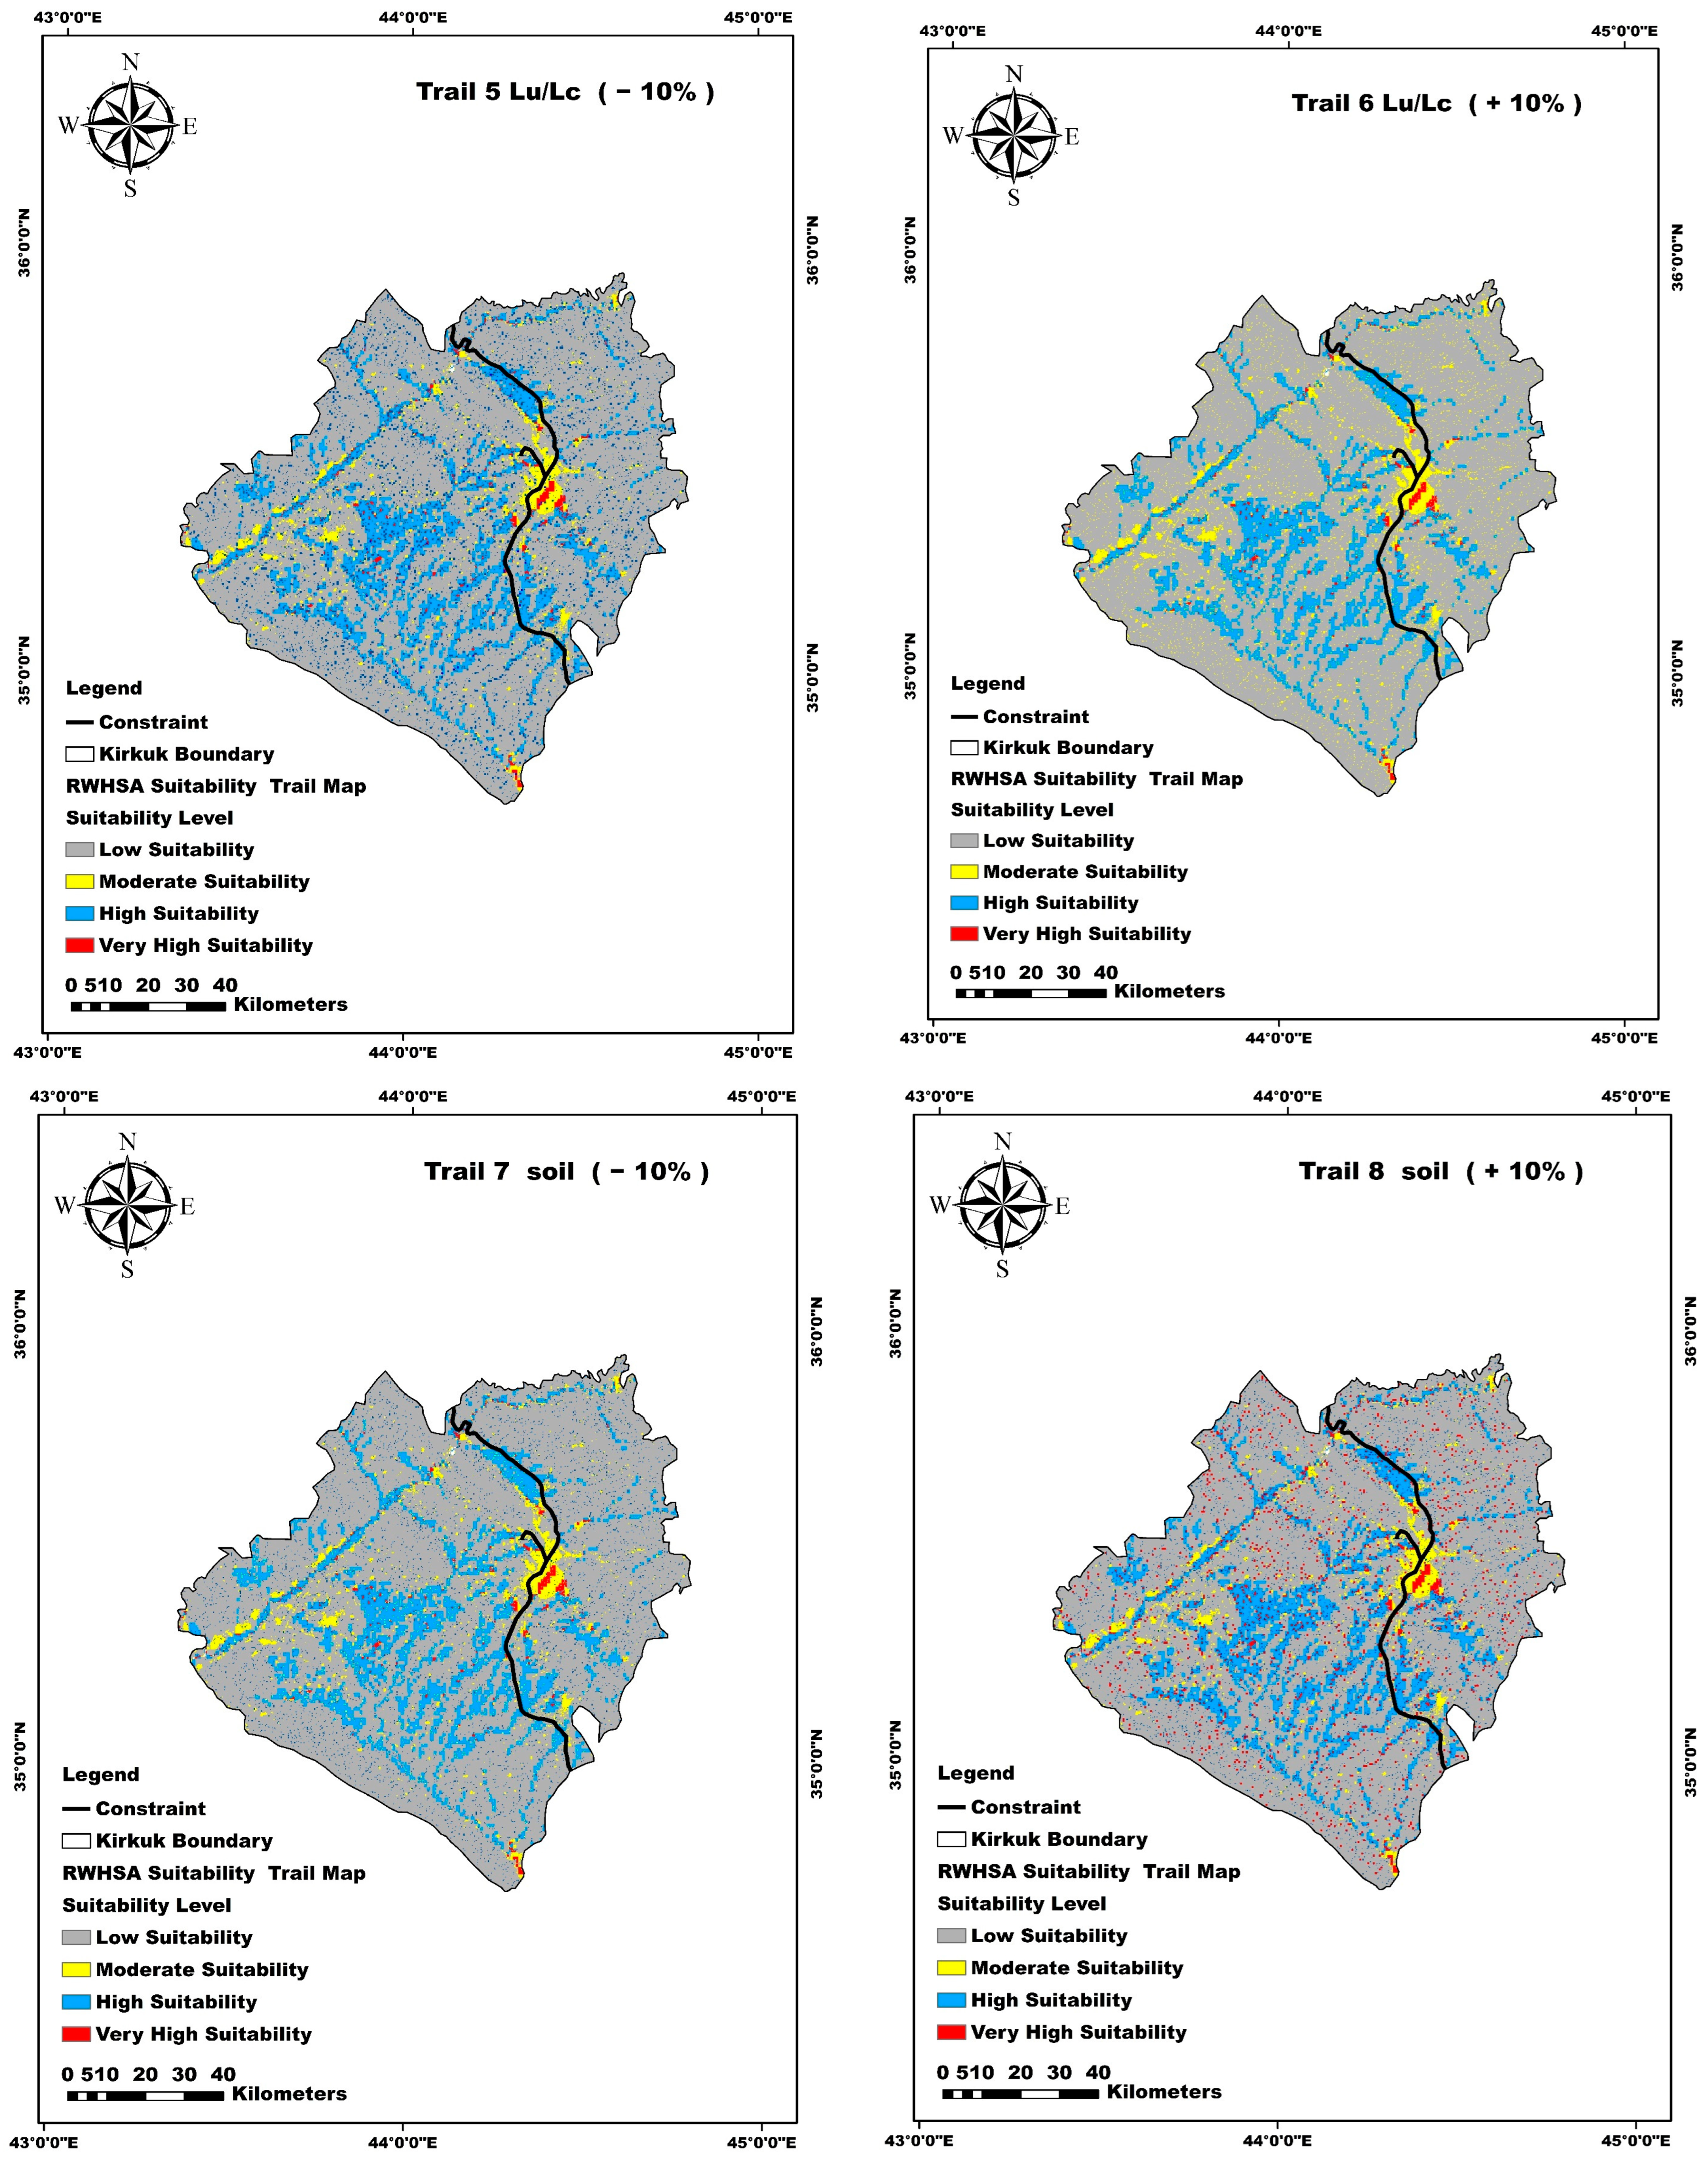
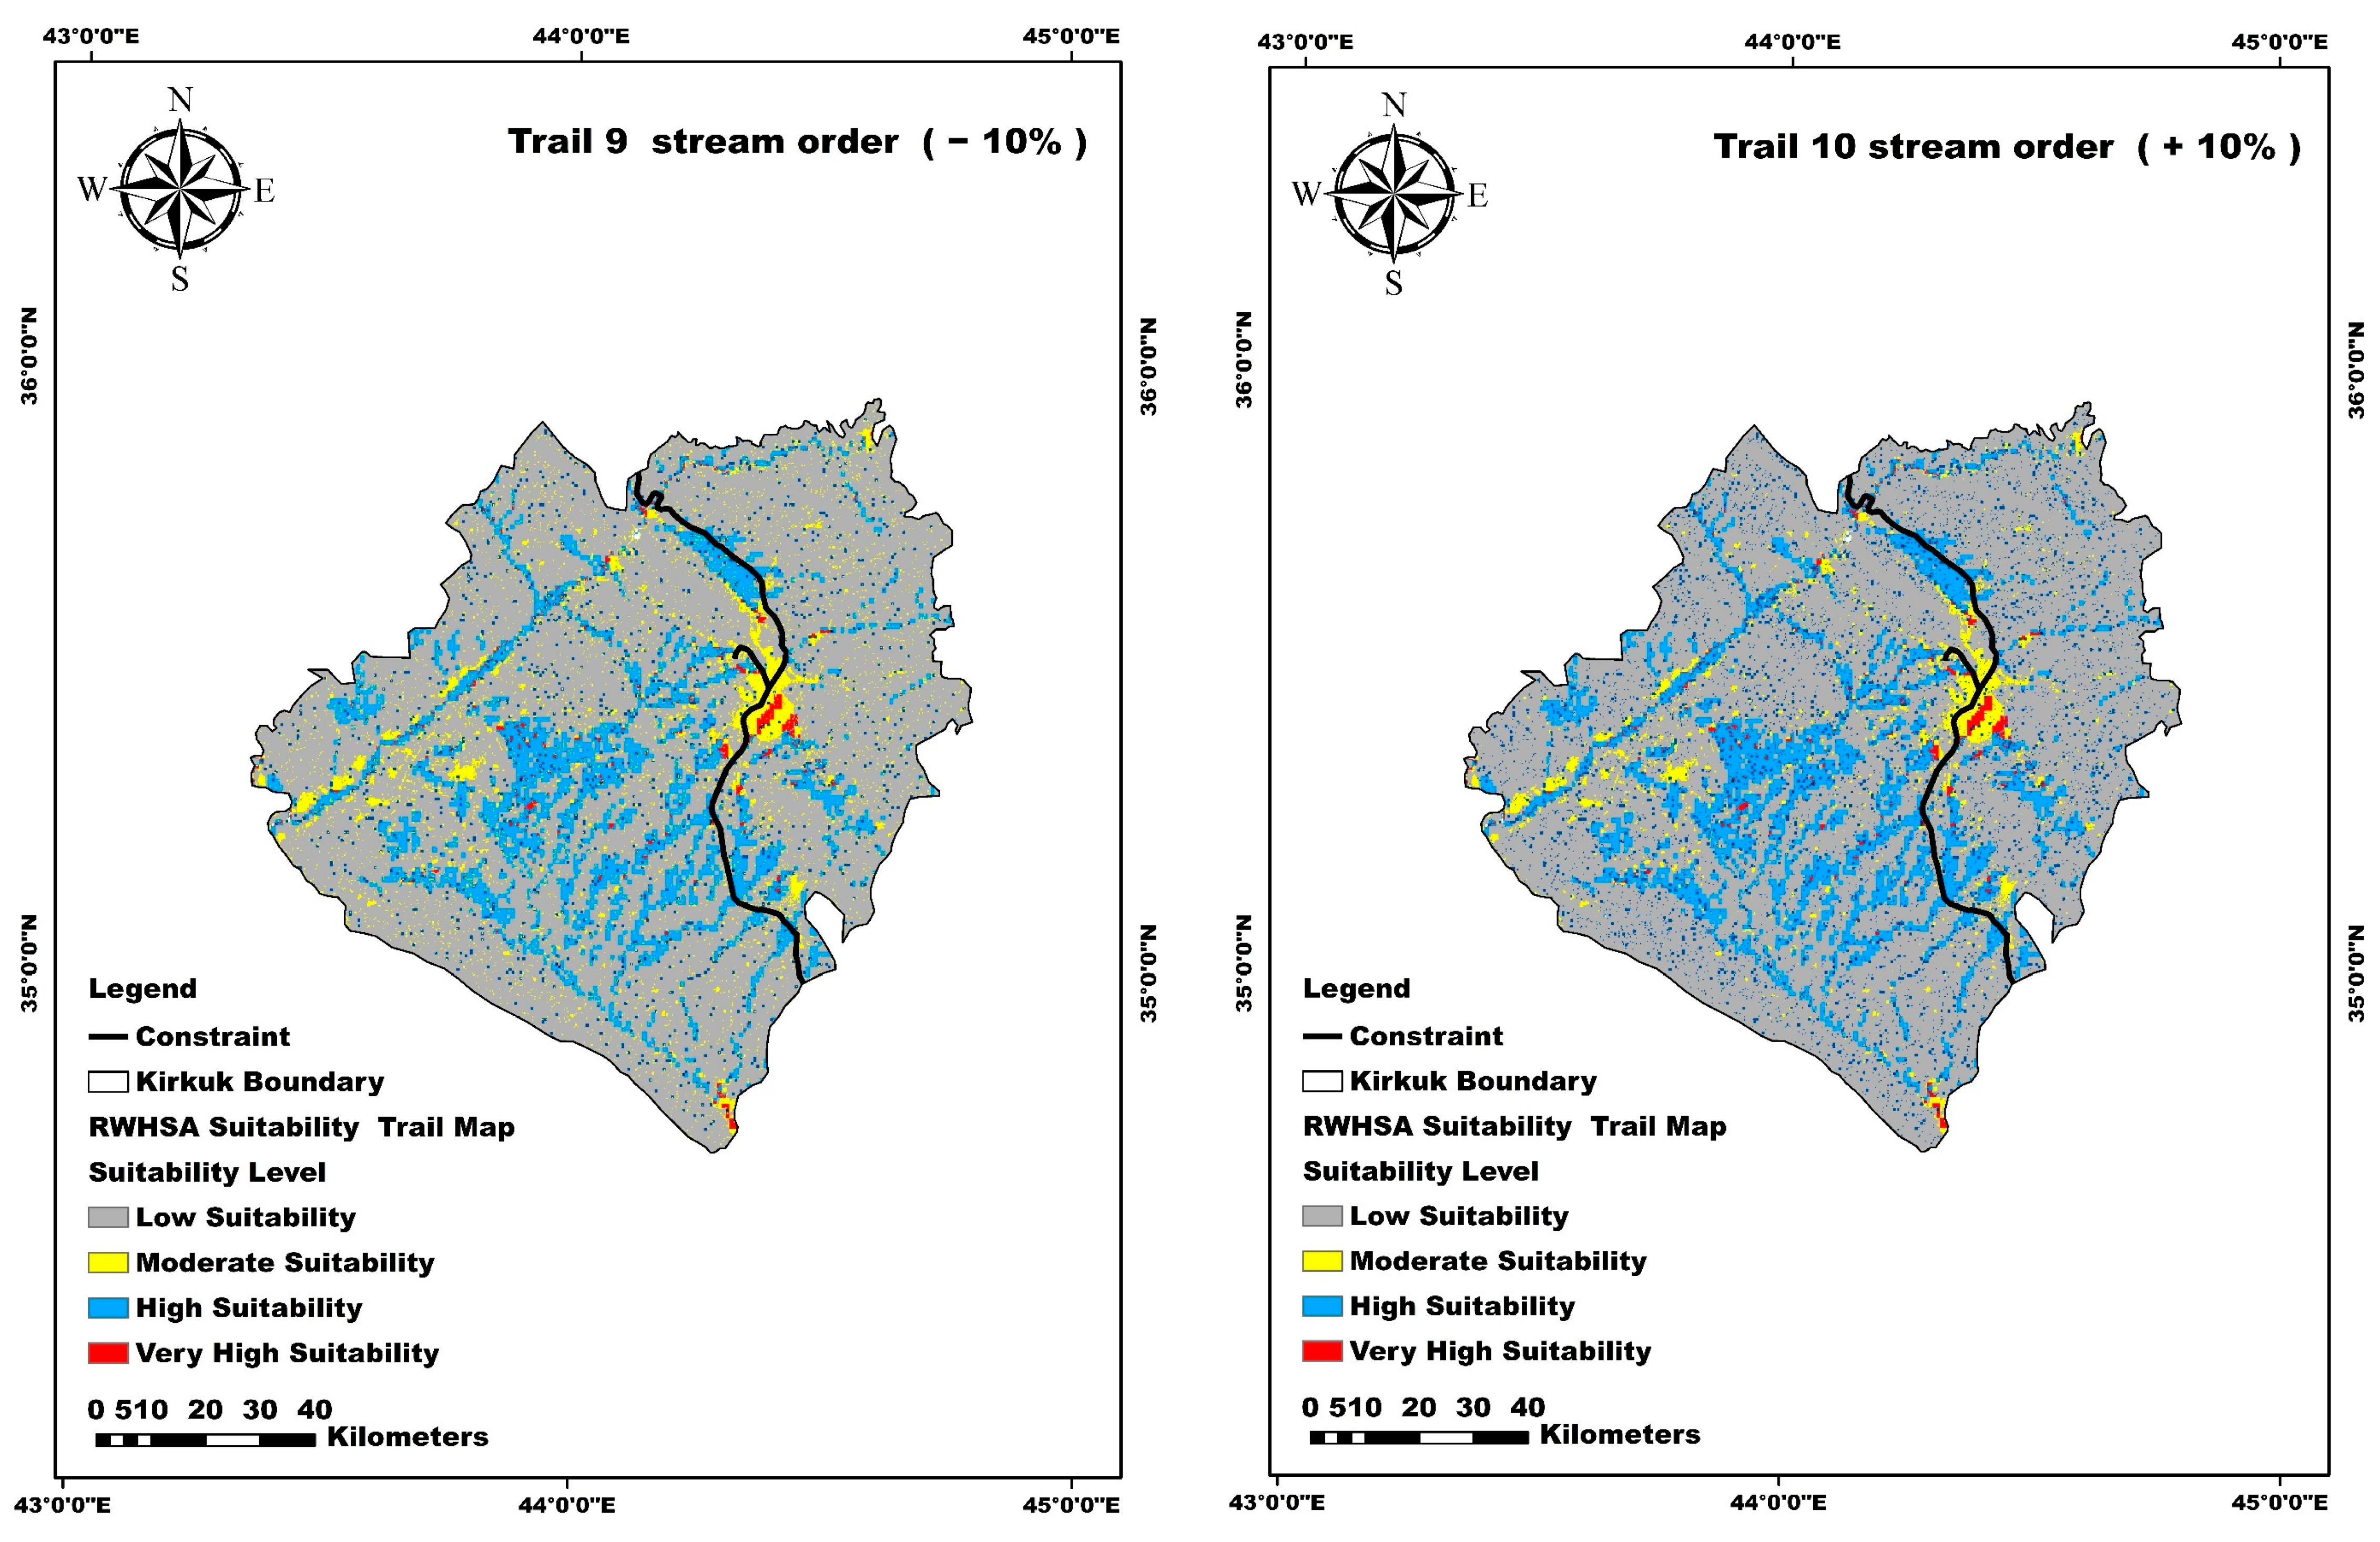
In this approach, we systematically modify the weights of the criteria, testing variations by increasing and decreasing the values by 10%. This controlled adjustment allows us to examine the effects on the interrelationships among the selected criteria. Through this sensitivity analysis, we gain deeper insights into the robustness of our decision-making framework, understanding how changes in criterion weights impact the overall results of the GIS-MCDA process. To update the equations for suitability analysis, we methodically adjust the weights assigned to each of the five criteria involved in our methodology. In one trial, the weight of each parameter is increased by 10%, while in another, it is decreased by 10%, ensuring that the sum of all weights remains fixed at 100. After each trial, the suitability analysis model is recalculated, enabling us to assess the individual influence of each criterion on the model outcomes. This iterative process focuses on the weights as the primary variable in the analysis, treating them as the main source of uncertainty. The analysis is structured as a one-dimensional sensitivity assessment, emphasising how significant variations in weights can influence the model’s overall results. The outcomes of this sensitivity analysis are visually represented in
Figure 16, which displays the maps generated during these trials. These maps provide a detailed overview of how adjusting criterion weights affects both the spatial distribution and overall outcomes of the suitability analysis. This approach enhances our understanding of how sensitive the model is to changes in the weightings of the criteria.
The sensitivity maps in
Figure 16 reveal several key insights into which criteria most strongly influence site suitability. Runoff depth stands out as the dominant factor, with slope and stream order also exerting considerable influence. In contrast, soil texture shows the least sensitivity, followed by land cover/land use (LCLU), indicating these factors have a relatively minor effect on the model’s outcomes. To confirm these results, we performed additional spatial sensitivity analyses, comparing each perturbed suitability map to the original. The analyses show only slight shifts in suitability classifications when less sensitive criteria (soil and LCLU) are adjusted, underscoring their limited impact. By contrast, modifications to runoff depth, slope, or stream parameters produce more pronounced changes in the final suitability map, highlighting their critical role in defining optimal rainwater harvesting locations.
4.9. Constraint Layer
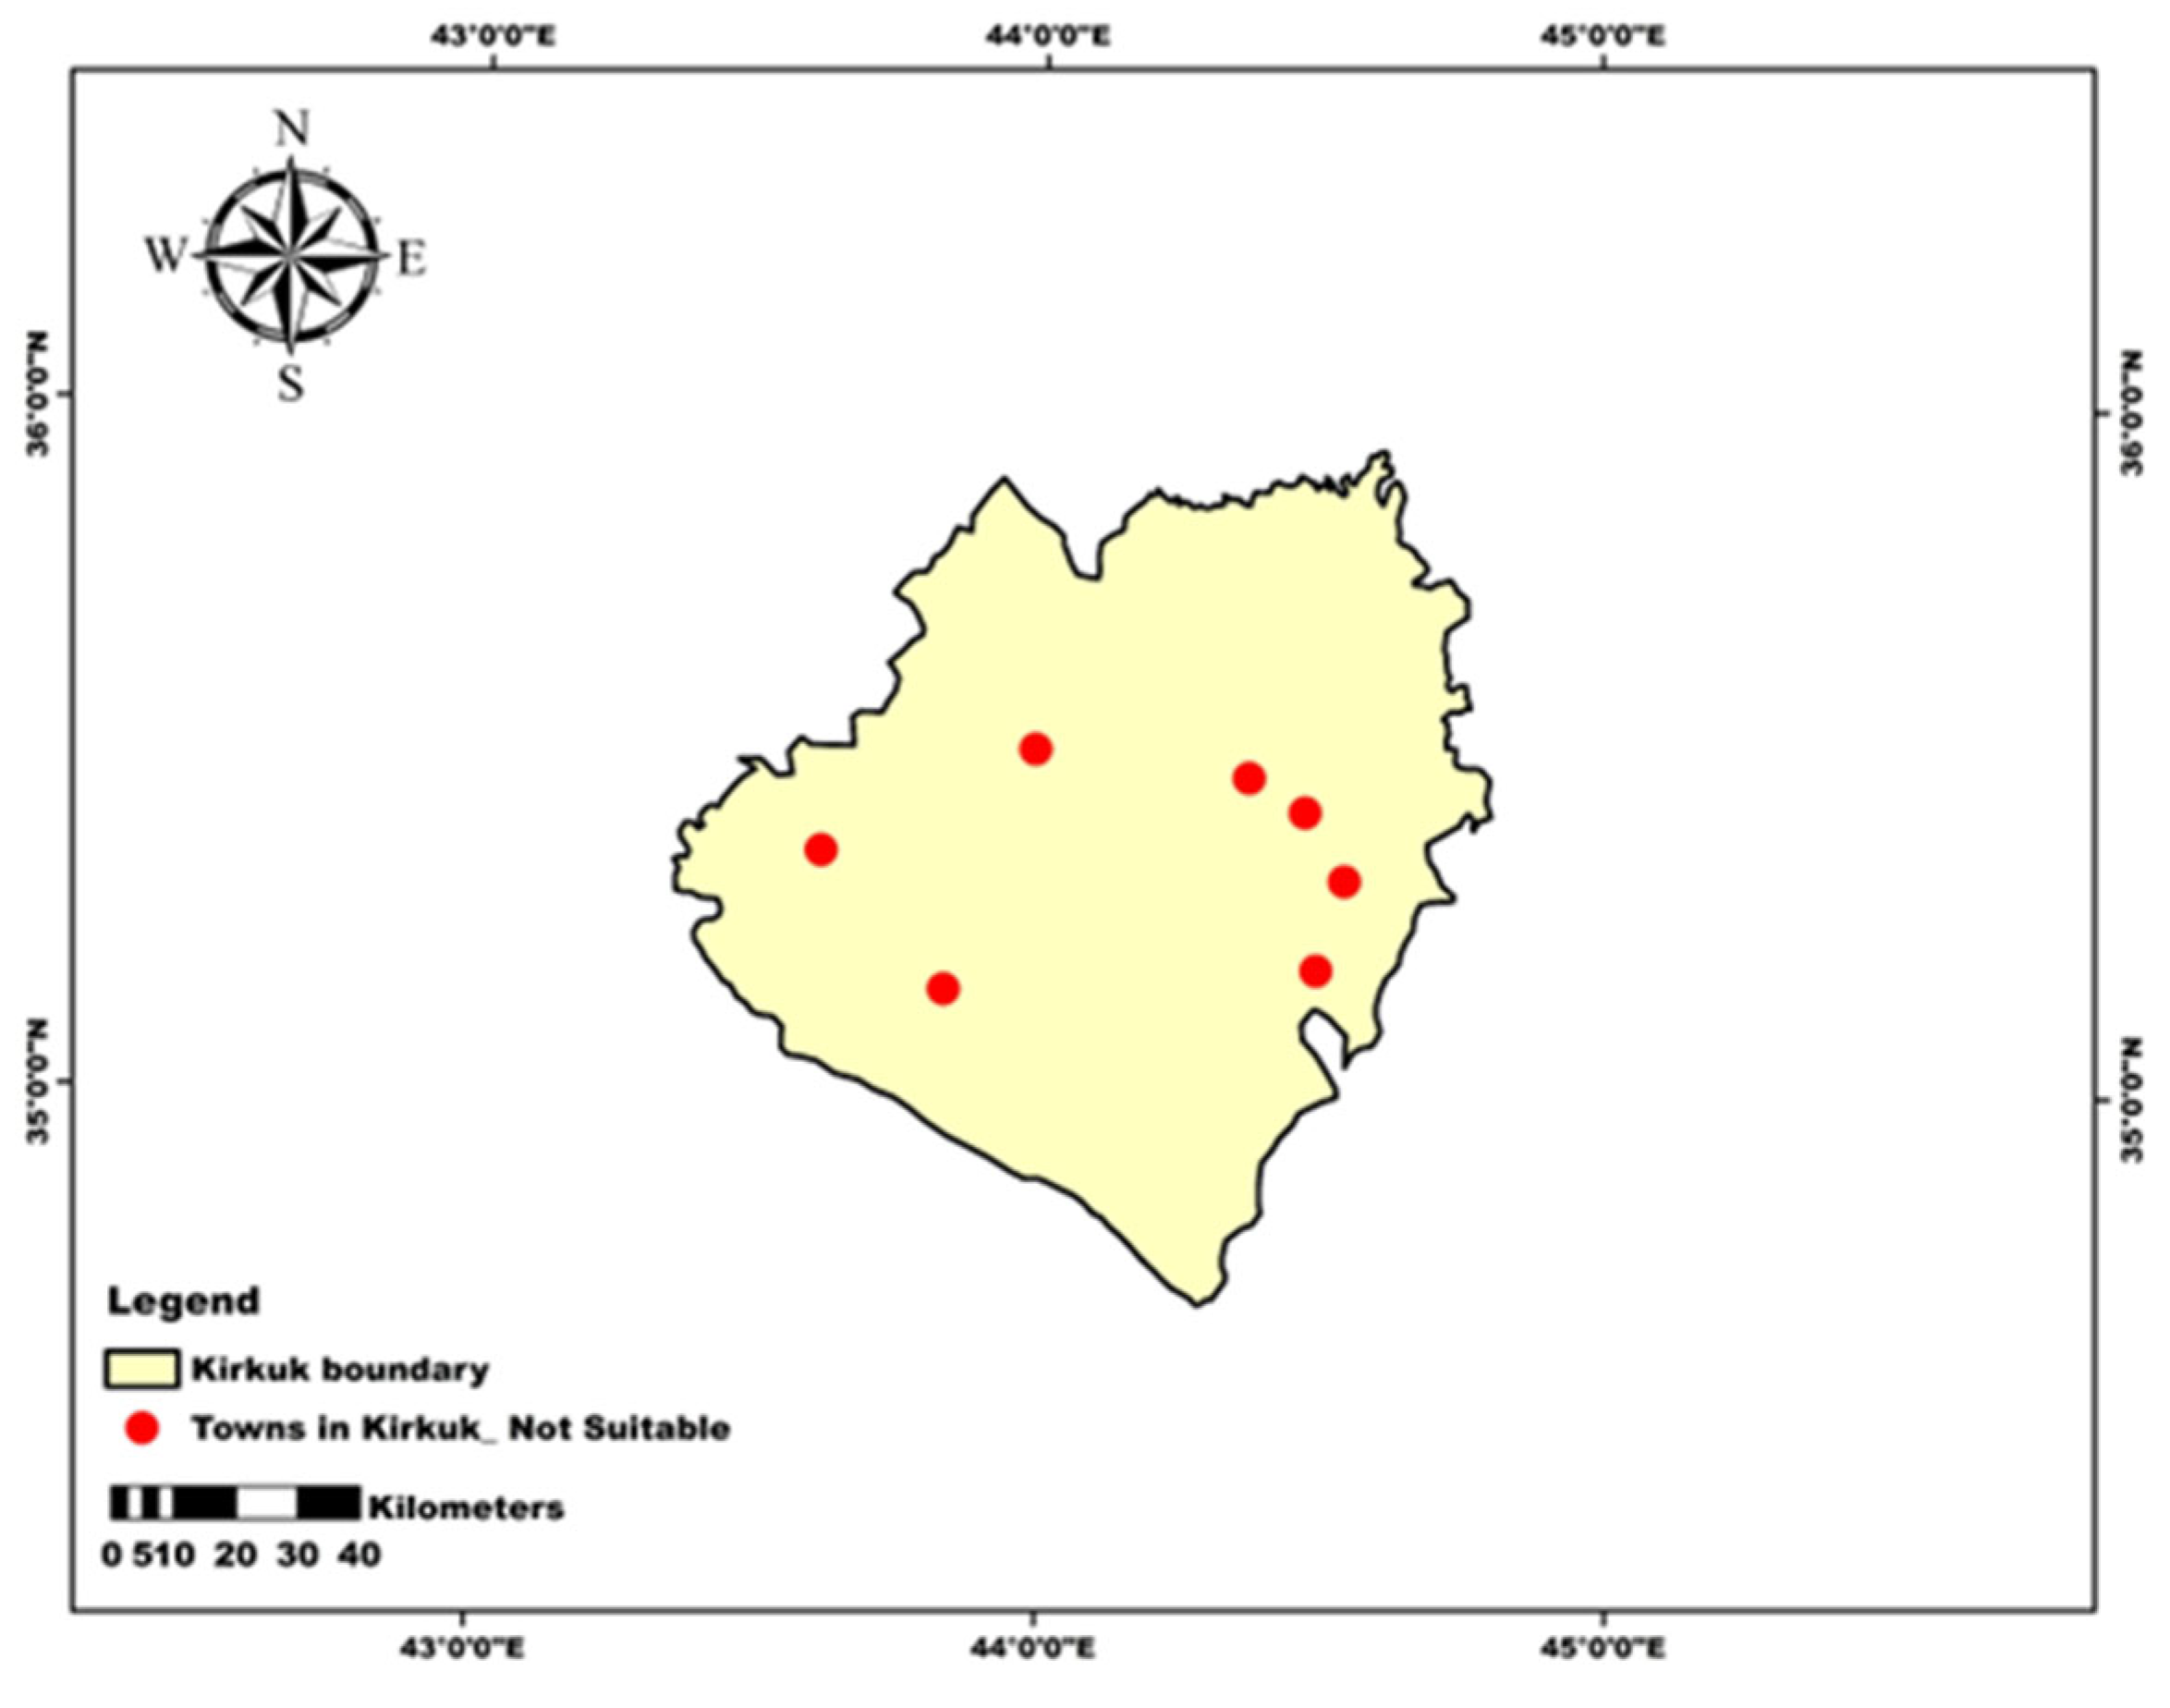
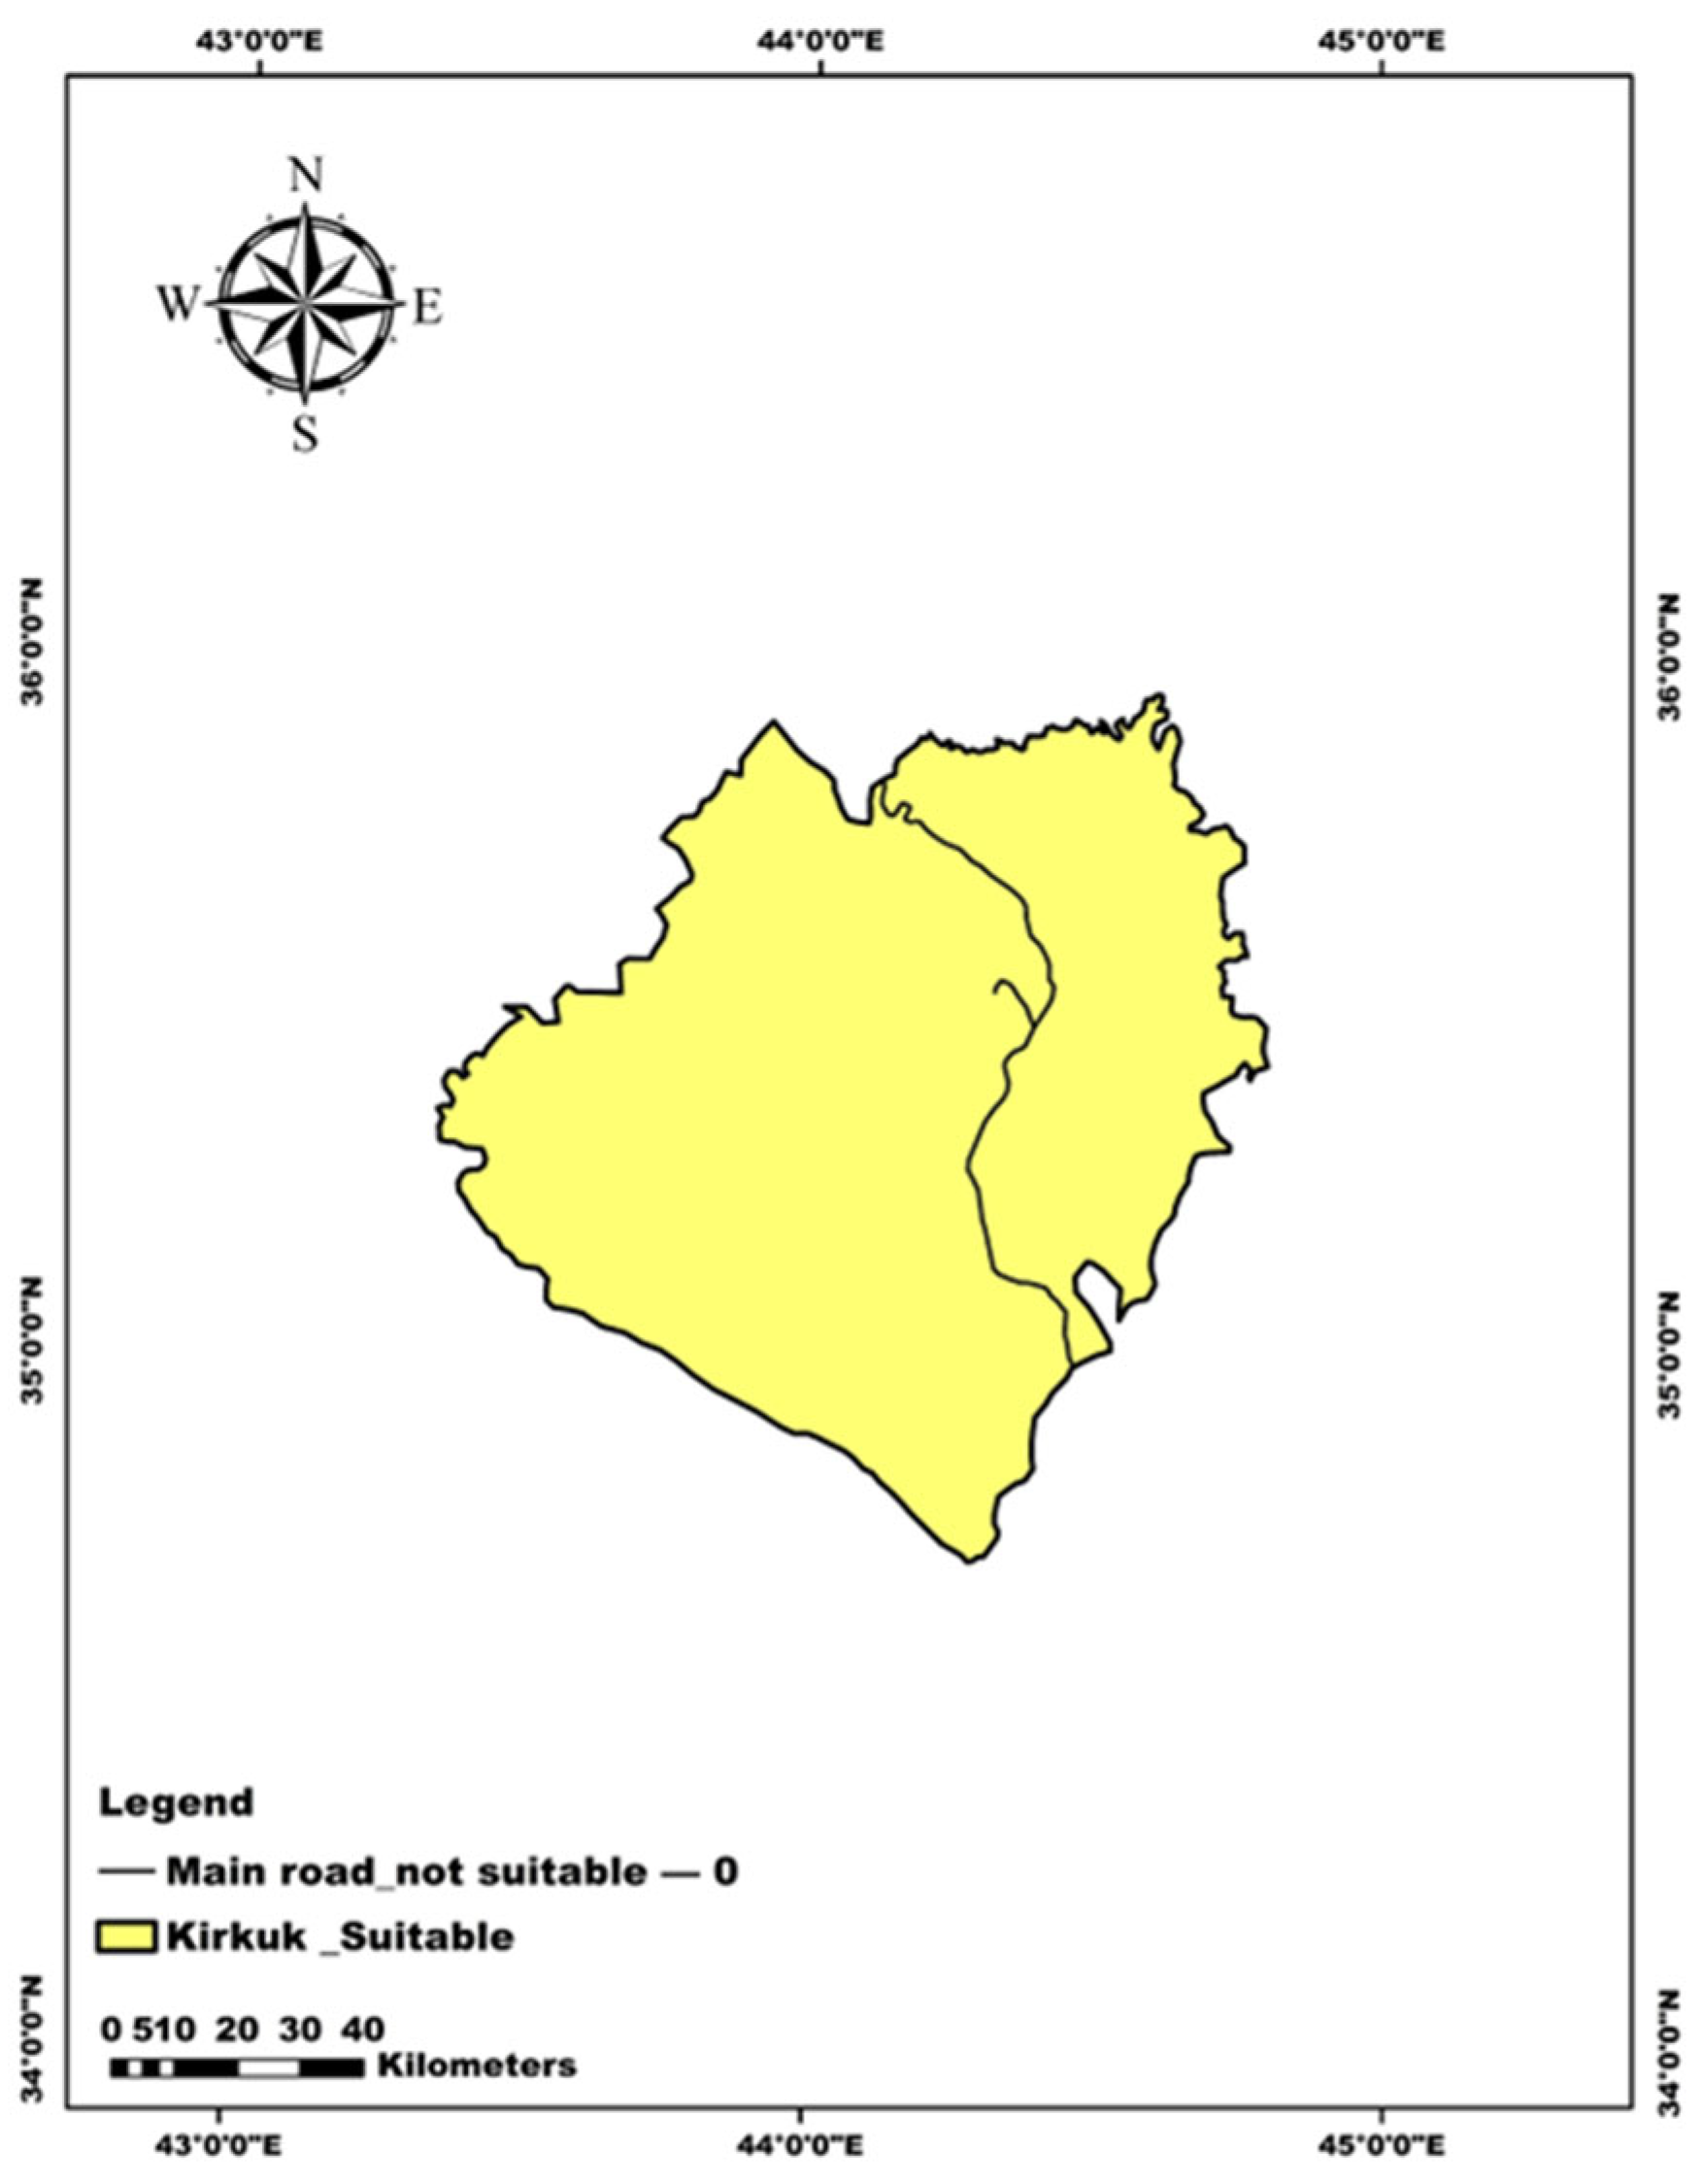
The constraint layer map indicates the areas that should be avoided when selecting a suitable site for harvesting rainwater in [
39]. It highlights the main roads, towns, and built-up areas that are deemed unsuitable for agricultural rainwater harvesting.
Figure 17 and
Figure 18 illustrate the restricted areas in Kirkuk province, with
Figure 17 showing the main towns and built-up regions that are not appropriate for agricultural use, while
Figure 18 details the locations restricted for rainwater harvesting due to the presence of a main road.
4.10. RWHSA Potential Sites Map Model
The potential map for the Rainwater Harvesting Site Suitability Analysis (RWHSA) in the study area was created by integrating several thematic layers, including drainage density, rainfall, soil texture, land use/cover, slope, and runoff. This integration was performed using ArcMap tools, as shown in
Figure 19. Each thematic layer was assessed based on its ability to effectively capture rainfall. Subsequently, the weights for each layer, along with their key characteristics, were determined using Saaty’s Analytic Hierarchy Process (AHP) [
54].
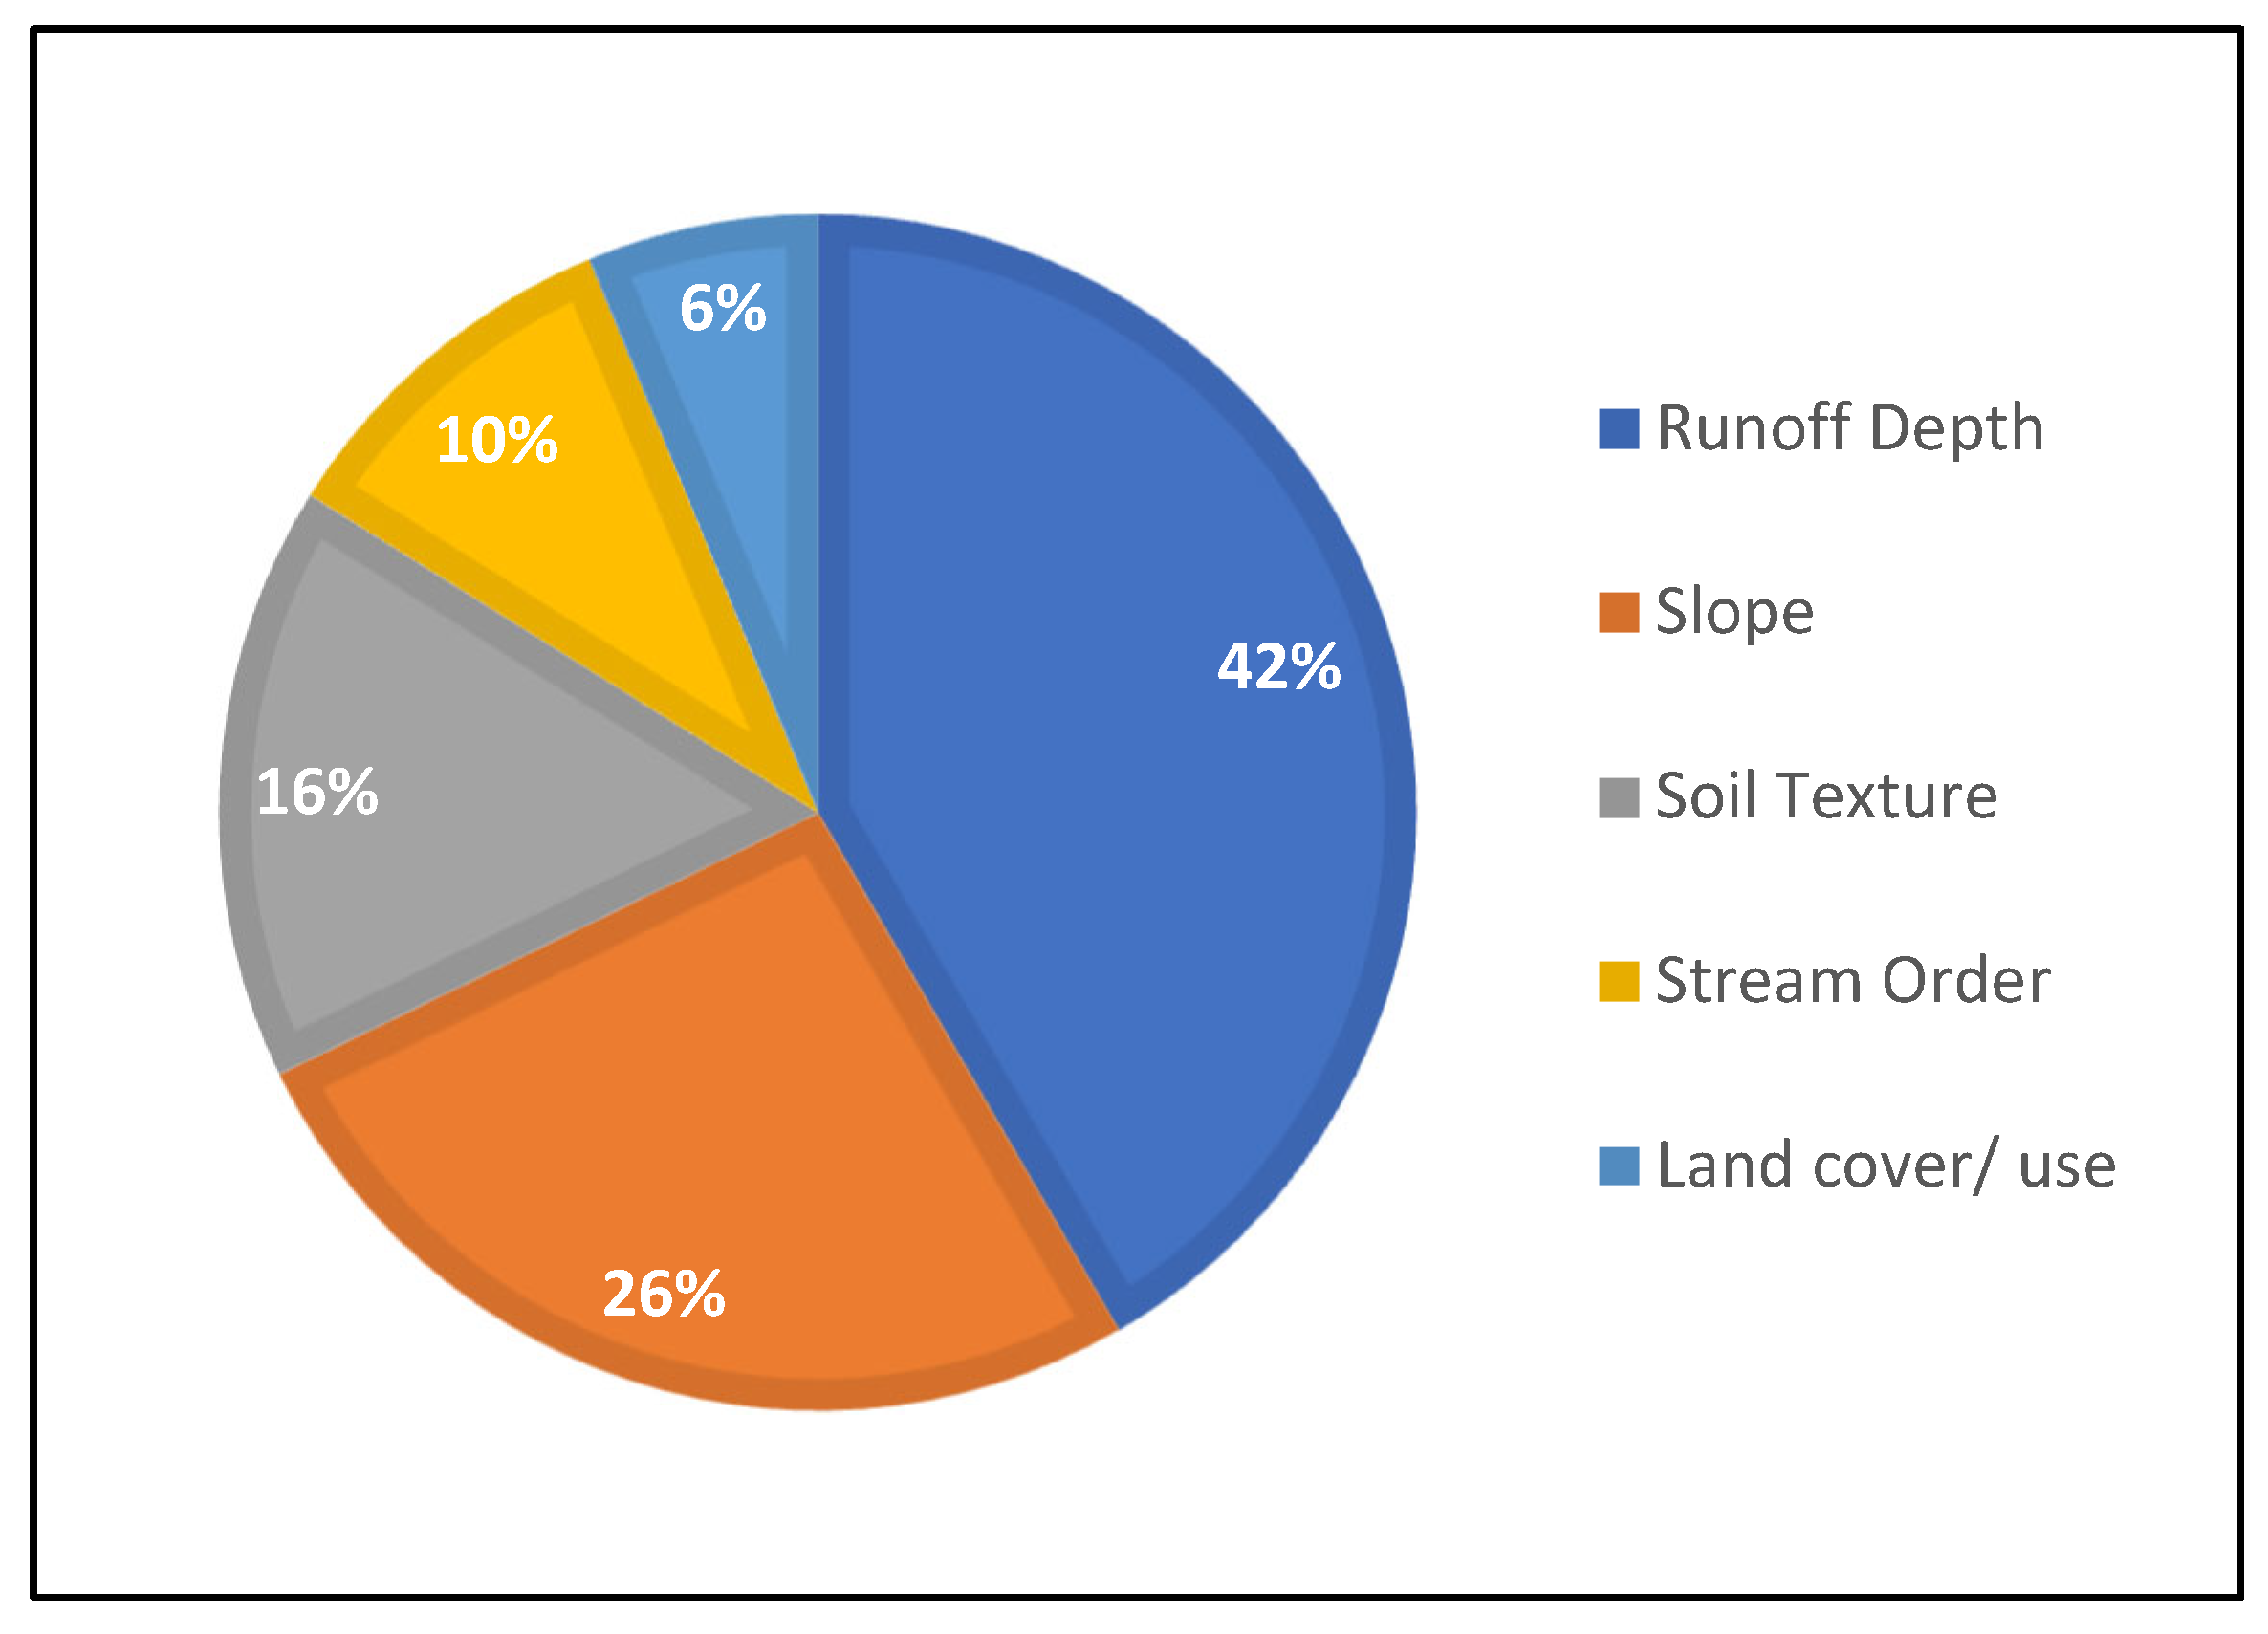
Pairwise comparison matrices were used, and the weights were normalised using the eigenvector technique to ensure a consistent distribution of weights across the layers. Consistency ratios were evaluated using Equation (5). The results indicated that runoff depth had the most significant impact on the model, contributing 42% of the total weight. Slope followed with an influence of approximately 26%, while soil texture accounted for 16%. Stream order and land cover/use contributed 10% and 6%, respectively.
Figure 16 illustrates the weight distribution of each thematic layer, clearly representing how these factors contribute to the final suitability map. Additionally,
Figure 19 visually presents the percentage distribution of weights assigned to each thematic layer.
Based on the RWHSA potential map, the study area can be categorised into four distinct suitability regions: (a) Low Suitability, which covers approximately 31.8% of the area and is predominantly composed of C soil texture, located throughout the entire area. (b) Moderate Suitability, covering about 37.4%, is situated in the northeast and parts of the northwest and features a mixture of both hydrological soil types C and D. (c) High Suitability encompasses roughly 22.6% of the area and is primarily found in the centre and northeast, and expands more to the south where the slope is low and the predominant hydrological soil texture is type D, which is highly suitable for rainwater harvesting. (d) Very High Suitability, covering approximately 8.2%, is a small area located in the northeast and extends into the central part of the study area, characterised by small catchments as illustrated in
Figure 20. For the validation of RWH site selection suitability, data on the existing functional RWH structures were collected. The four check dams were all located within areas classified as highly suitable in the study region of Kirkuk.
Table 9 shows the coordinates of each constructed structure.
5. Discussion
This study aimed to identify optimal sites for rainwater harvesting (RWH) to support sustainable agriculture in semi-arid regions. A comprehensive geospatial approach was adopted to determine the most suitable areas for rainwater harvesting for sustainable agriculture (RWHSA). Within the study region, annual precipitation varied between 200 mm and 490 mm. Due to this variability, steps were taken to reduce uncertainty and improve data reliability. A normality test was applied to the rainfall data, and only datasets exhibiting over 65% normal distribution were included to minimise errors arising from spatial and temporal inconsistencies in rainfall patterns. Additionally, a rainfall–runoff correlation analysis revealed a strong positive relationship (R2 = 0.9542), highlighting the crucial role of precipitation in influencing surface runoff and, consequently, the importance of accurate rainfall data in assessing RWH potential.
The Analytic Hierarchy Process (AHP) was employed to assign weights to multiple thematic layers, offering a structured framework for Multi-Criteria Decision Analysis. This method enabled flexibility in weight allocation and incorporated consistency checks to validate the reliability of the criteria selection. Among the evaluated factors, runoff depth was determined to be the most significant, receiving the highest weight (42%) due to its direct impact on RWH potential. Slope followed with a weight of 26%, reflecting its influence on runoff velocity and erosion risk. Soil texture, especially Hydrologic Soil Groups (HSGs) C and D, which are associated with moderate to high runoff and limited infiltration, contributed 16%. Land cover/use and stream order were also considered, accounting for 10% and 6%, respectively.
The spatial analysis classified the study area into four suitability zones: Very High Suitability (8.2%), concentrated in the northwest and central parts of the region and characterised by low slope gradients and the predominance of HSG D soils. High Suitability (22.6%), spread across central, northwestern, and southeastern zones, with a mix of HSG C and D soils and favourable terrain conditions. Moderate Suitability (37.4%), primarily located in the northeastern sector and associated with HSG C soils. Low Suitability (31.8%), predominantly found in the northernmost parts of the area, where steep slopes significantly reduce RWH feasibility.
By integrating AHP with GIS and Remote Sensing technologies, this study presents a robust and replicable framework for RWH site selection. The results offer valuable insights into water resource planning and agricultural development in water-scarce environments. Ultimately, the findings can contribute to improved agricultural productivity, water conservation, and resilience against the impacts of climate change, particularly in vulnerable semi-arid regions. More investigation can be applied regarding rainfall uncertainty by applying different methods in the near future such as Monte Carlo simulations and exploring the application of Fuzzy AHP analysis.
6. Conclusions
Rainwater harvesting (RWH) has proven to be an efficient and cost-effective solution to address the persistent water scarcity challenges faced by regions like the Middle East, particularly Iraq. Over the past decade, Iraq has experienced significant water shortages, and this research seeks to enhance water resource management and sustainability by developing methodologies that facilitate the implementation of rainwater harvesting for sustainable agriculture (RWHSA) systems. Recent advancements have leveraged Geographic Information Systems (GIS) and Multi-Criteria Decision Analysis (MCDA) to tackle water scarcity, with a focus on establishing a sustainable and efficient framework for identifying RWHSA sites in semi-arid regions, using Iraq as a case study.
By integrating multi-criteria evaluation with the Analytic Hierarchy Process (AHP) within the GIS framework, driven by well-defined evaluation criteria, this research provides a cost-effective and invaluable tool for identifying optimal sites for RWHSA. This study thoroughly examines several critical parameters, such as slope, stream order, soil types, drainage density, and land cover/land use, to determine the suitability of various sites for RWHSA. Socioeconomic factors were not considered through this study, but they can be considered with more field validation and investigation in the near future. The results highlight promising opportunities for the implementation of RWH systems, with approximately 26.6% of the assessed sites classified as highly suitable and 10.2% as very highly suitable for RWHSA. Furthermore, 40.4% of sites are considered of medium suitability, while 22.8% fall into the low suitability category. The sensitivity analysis showed that runoff depth is identified as the most influential factor, while slope and stream order also have significant roles in shaping the results. In contrast, soil texture has the least impact, followed closely by land cover and land use (LCLU). This indicates that these latter variables have a comparatively smaller effect on the overall outcomes of the model.
These findings have significant implications for water resource management experts and policymakers in the region. They provide valuable insights for making informed decisions on the allocation and management of scarce water resources amid climate change challenges that are affecting rainwater and water resources, specifically in a semi-arid region. The success of identifying suitable RWHSA sites is largely attributed to the adoption of the Soil Conservation Service Curve Number (SCS-CN) method, in combination with GIS, Remote Sensing (RS), and other tools.
This integrated approach not only addresses agro-climatic and hydrological gaps but also serves as a model that can be applied in various global settings, particularly in low-income countries facing similar water scarcity issues.

