Article

Seasonal Variation in Energy Balance, Evapotranspiration and Net Ecosystem Production in a Desert Ecosystem of Dengkou, Inner Mongolia, China

1
School of Soil and Water Conservation, Beijing Forestry University, Beijing 100083, China
2
Department of Agronomy, Bahauddin Zakariya University, Multan 60800, Pakistan
3
Faculty of Forestry, University of Agriculture and Forestry, Hue University, Hue 530000, Vietnam
4
Department of Environmental Science and Engineering, Guangdong Technion-Israel Institute of Technology, Shantou 515063, China
*
Author to whom correspondence should be addressed.
Water 2025, 17(15), 2307; https://doi.org/10.3390/w17152307
Submission received: 2 June 2025 / Revised: 26 July 2025 / Accepted: 1 August 2025 / Published: 3 August 2025
(This article belongs to the Special Issue The Observation and Modeling of Surface Air Hydrological Factors)

Abstract

This study investigates the seasonal dynamics of energy balance, evapotranspiration (ET), and Net Ecosystem Production (NEP) in the Dengkou desert ecosystem of Inner Mongolia, China. Using eddy covariance and meteorological data from 2019 to 2022, the research focuses on understanding how these processes interact in one of the world’s most water-limited environments. This arid research area received an average of 109.35 mm per annum precipitation over the studied period, classifying the region as a typical arid ecosystem. Seasonal patterns were observed in daily air temperature, with extremes ranging from −20.6 °C to 29.6 °C. Temporal variations in sensible heat flux (H), latent heat flux (LE), and net radiation (Rn) peaked during summer season. The average ground heat flux (G) was mostly positive throughout the observation period, indicating heat transmission from atmosphere to soil, but showed negative values during the winter season. The energy balance ratio for the studied period was in the range of 0.61 to 0.80, indicating challenges in achieving energy closure and ecological shifts. ET exhibited two annual peaks influenced by vegetation growth and climate change, with annual ET exceeding annual precipitation, except in 2021. Net ecosystem production (NEP) from 2019 to 2020 revealed that the Dengkou desert were a net source of carbon, indicating the carbon loss from the ecosystem. In 2021, the Dengkou ecosystem shifted to become a net carbon sink, effectively sequestrating carbon. However, this was sharply reversed in 2022, resulting in a significant net release of carbon. The study findings highlight the complex interactions between energy balance components, ET, and NEP in desert ecosystems, providing insights into sustainable water management and carbon neutrality strategies in arid regions under climate change effect.

Graphical Abstract

1. Introduction

Sunlight absorbed by the Earth’s surface significantly impacts climate by altering energy balance and regulating temperature. Energy balance is a balance between incoming solar radiation into the system and outgoing energy fluxes including reflected radiation, latent heat, sensible heat, and ground heat flux. According to the energy conservation principle, this basic energy input is redistributed between the atmosphere and the surface. Solar radiation is mostly reflected back to the atmosphere as sensible and latent heat, with the exception of a small amount that is utilized for soil heating, crop internal heat storage, and plant photosynthesis [1]. The exchange process of energy and matter between the atmosphere and the ground is described by the surface energy balance and surface radiation [2]. Several theories have been proposed earlier to explain energy non-closure. According to Leuning et al. [3], high-frequency covariance can be lost due to an incorrect instrument setup. According to some scholars, most studies have neglected or assumed that heat storage and inaccurate estimates of energy storage between the atmosphere and surface are insignificant [4,5]. Energy balance closure remains a major concern in the study of surface–atmosphere exchange, despite the number of studies on this topic. However, the reasons for energy non-closure remain unclear, and the current explanations are not accurate [6]. Many studies used flux towers to examine the closure of energy flux, distribution, and properties of various ecosystems [7,8,9,10]. Distributing energy can encourage the exchange of materials, and the impact of water exchange is significant because it shows up as an increase in H, which promotes the water cycle. Understanding the energy and water vapor transport processes within the outer layer is important for understanding the water cycle and local climate.
Deserts are the most extensive terrestrial environment on Earth, covering >21% of the planet’s geographical area. These regions exhibit unique attributes, such as arid climates and enhanced surface albedo. These attributes influence the distinct responses of deserts to climate change, including warming, cooling, wetting or drying [11]. China has >60% of its land covered by drylands and deserts [12]. Recent years have seen sustained focus and investment in numerous aspects of desert environments, leading to advancements in research on desert land surface processes. The surface energy exchange properties of desert surface layers differ totally from those of other locations, where sensible heat flux (H) predominates as the primary mode of energy exchange in deserts and serves as the principal energy source driving local atmospheric circulation [13]. Deserts hold considerable potential and, if effectively utilized, their resources could yield substantial benefits to the globe. An essential biological role of the oasis–desert ecotone is to act as a shelterbelt and windbreak, shielding oases from desertification and wind damage [14,15].
Evapotranspiration (ET) is one of the most important hydrological processes in the terrestrial water cycle [16]. It is also closely related to the formation and change in atmospheric circulation, and can play a role in regulating climate [17]. An accurate estimation of ET can provide theoretical support for the sensible distribution and management of local water supplies, particularly for the scientific allocation of water for desert ecosystem. ET is characterized by LE and is closely associated with energy transfer between air and land in the ecosystem [18]. Net Ecosystem Production (NEP) illustrates the distinction between carbon fixation through photosynthesis and carbon release through respiration in ecosystems. The desert ecosystem is known for its low carbon generation because of its harsh environmental conditions. In general, NEP represents the net gain or loss of carbon dioxide by the ecosystem, which is pivotal in the context of carbon cycling and climate change [19]. Deserts are often classified as having less NEP or acting as a low carbon sink, due to less vegetation and to environmental factors [20]. Precipitation is an important factor influencing NEP in desert ecosystems. Increased precipitation can enhance NEP by promoting vegetation growth and carbon sequestration [21].
At present, the most useful methodology for directly monitoring the material cycle and energy at the soil-vegetation-atmospheric interface is the eddy covariance (EC) method. It has been widely adopted in many ecosystems and is now the accepted method for researching ground-air interactions [22]. Calculating energy balance, surface water-heat exchange, and comprehending associated methods depend heavily on the accuracy of the data [23]. The results obtained can be used to calculate the average surface-atmosphere exchange rate for a given region [24]. To determine the latent heat flux (LE) and soil heat flux, the EC method calculated these surface fluxes directly by determining the covariance between temperature, vertical wind velocity and water vapor mixing ratio during a certain average time. Atmospheric stability, upwind surface characteristics, and observation height have been linked to the spatial depiction of EC fluxes [25]. The eddy covariance method is a unique type of high-frequency observation technology for ET, developed in recent years [5,26]. It is difficult to measure ET directly in dry and semi-arid locations because of a number of characteristics, including sparse vegetation, diverse land surfaces, and significant variations in atmospheric stability [27]. Numerous studies have carried out detailed analyses of different elements influencing the movement of heat and water between ecosystems and the atmosphere [22,28,29], and the findings show that environmental and vegetation growth parameters have the greatest impact on variations in energy distribution.
Current studies on desert energy closure are confined to short-term data collection, such as datasets spanning a single year or two years, and lack comprehensive multi-parameter analyses, such as combining energy balance with carbon flux measurements [6,30,31]. The current study provides detailed understanding of desert’s water cycle, energy closure, evapotranspiration and Net Ecosystem Production. We explored how abiotic factors such as temperature, precipitation, and soil properties influence the energy balance, ET and NEP. Our study aims to (1) quantify seasonal and interannual variations in energy balance closure, (2) reveal the drivers of ET-precipitation decoupling, and (3) assess carbon sink/source dynamics under extreme aridic environments. Herein, our multi-year data reveal how hydrothermal thresholds flip desert ecosystems between carbon sink and source states, under extreme arid conditions. These findings will enhance predictive models of desert ecosystem responses to climate change and inform sustainable plants and water management in arid regions.

2. Materials and Methods

2.1. Site Description

The trial site is situated in the northeast of the desert of Ulan Buh in Dengkou County, Bayannur City, Inner Mongolia, China (Figure 1). Dengkou desert is selected as the study area due to its sparse vegetation, arid climate, and limited representation in global flux networks. Compared to more commonly studied ecosystems (e.g., forests and wetlands), Dengkou provides a unique site to investigate energy distribution, carbon, and water dynamics under extreme drought conditions, offering insights into desert-specific ecological resilience mechanisms [6]. Field measurements were taken at a thorough observation station in the desert (1050 m above sea level) at 40°24′ N, 106°43′ E, at the second experimental field of the Desert Forestry Experimental Center of the Chinese Academy of Forestry, as illustrated in Figure 1c. The average annual temperature in the area is 7.8 °C, and there is approximately 145 mm of precipitation, indicating a moderate continental desert climate. June through September saw the most precipitation, accounting for 70% to 80% of the annual total rainfall. The soil type in the research region is wind–sand soil, and the annual evaporation is approximately 2.327 mm. The predominant plant at the research site was Nitraria tantutorum. The Nitraria population is represented by Nitraria nebkhas, which are diameter, of 6–10 m and with a height of 1–3 m. A total of 10–20% of the community is covered by the primary associated dominating plants, including Agriophyllum squarrosum, Psammochloa villosa, Artemisia sphaerocephala, and Artemisia ordosica.

2.2. Measurements of Meteorology and Energy Flux

An EC system (Figure 1e) and an auxiliary meteorological element gradient monitoring system (Figure 1f) were used to simultaneously measure the fluxes and meteorological data in the desert oasis transition zone, at the same time. A closed-path CO2/H2O analytical device (EC155, Campbell Scientific Inc., Logan, UT, USA), an ultrasonic anemometer in three dimensions (CSAT-3, Campbell Scientific Inc., Logan, UT, USA), and Campbell Scientific Inc.’s CR3000 data recorder (Logan, UT, USA) made up the EC system, which was equipped with a complete observation station in the desert (Figure 1d).
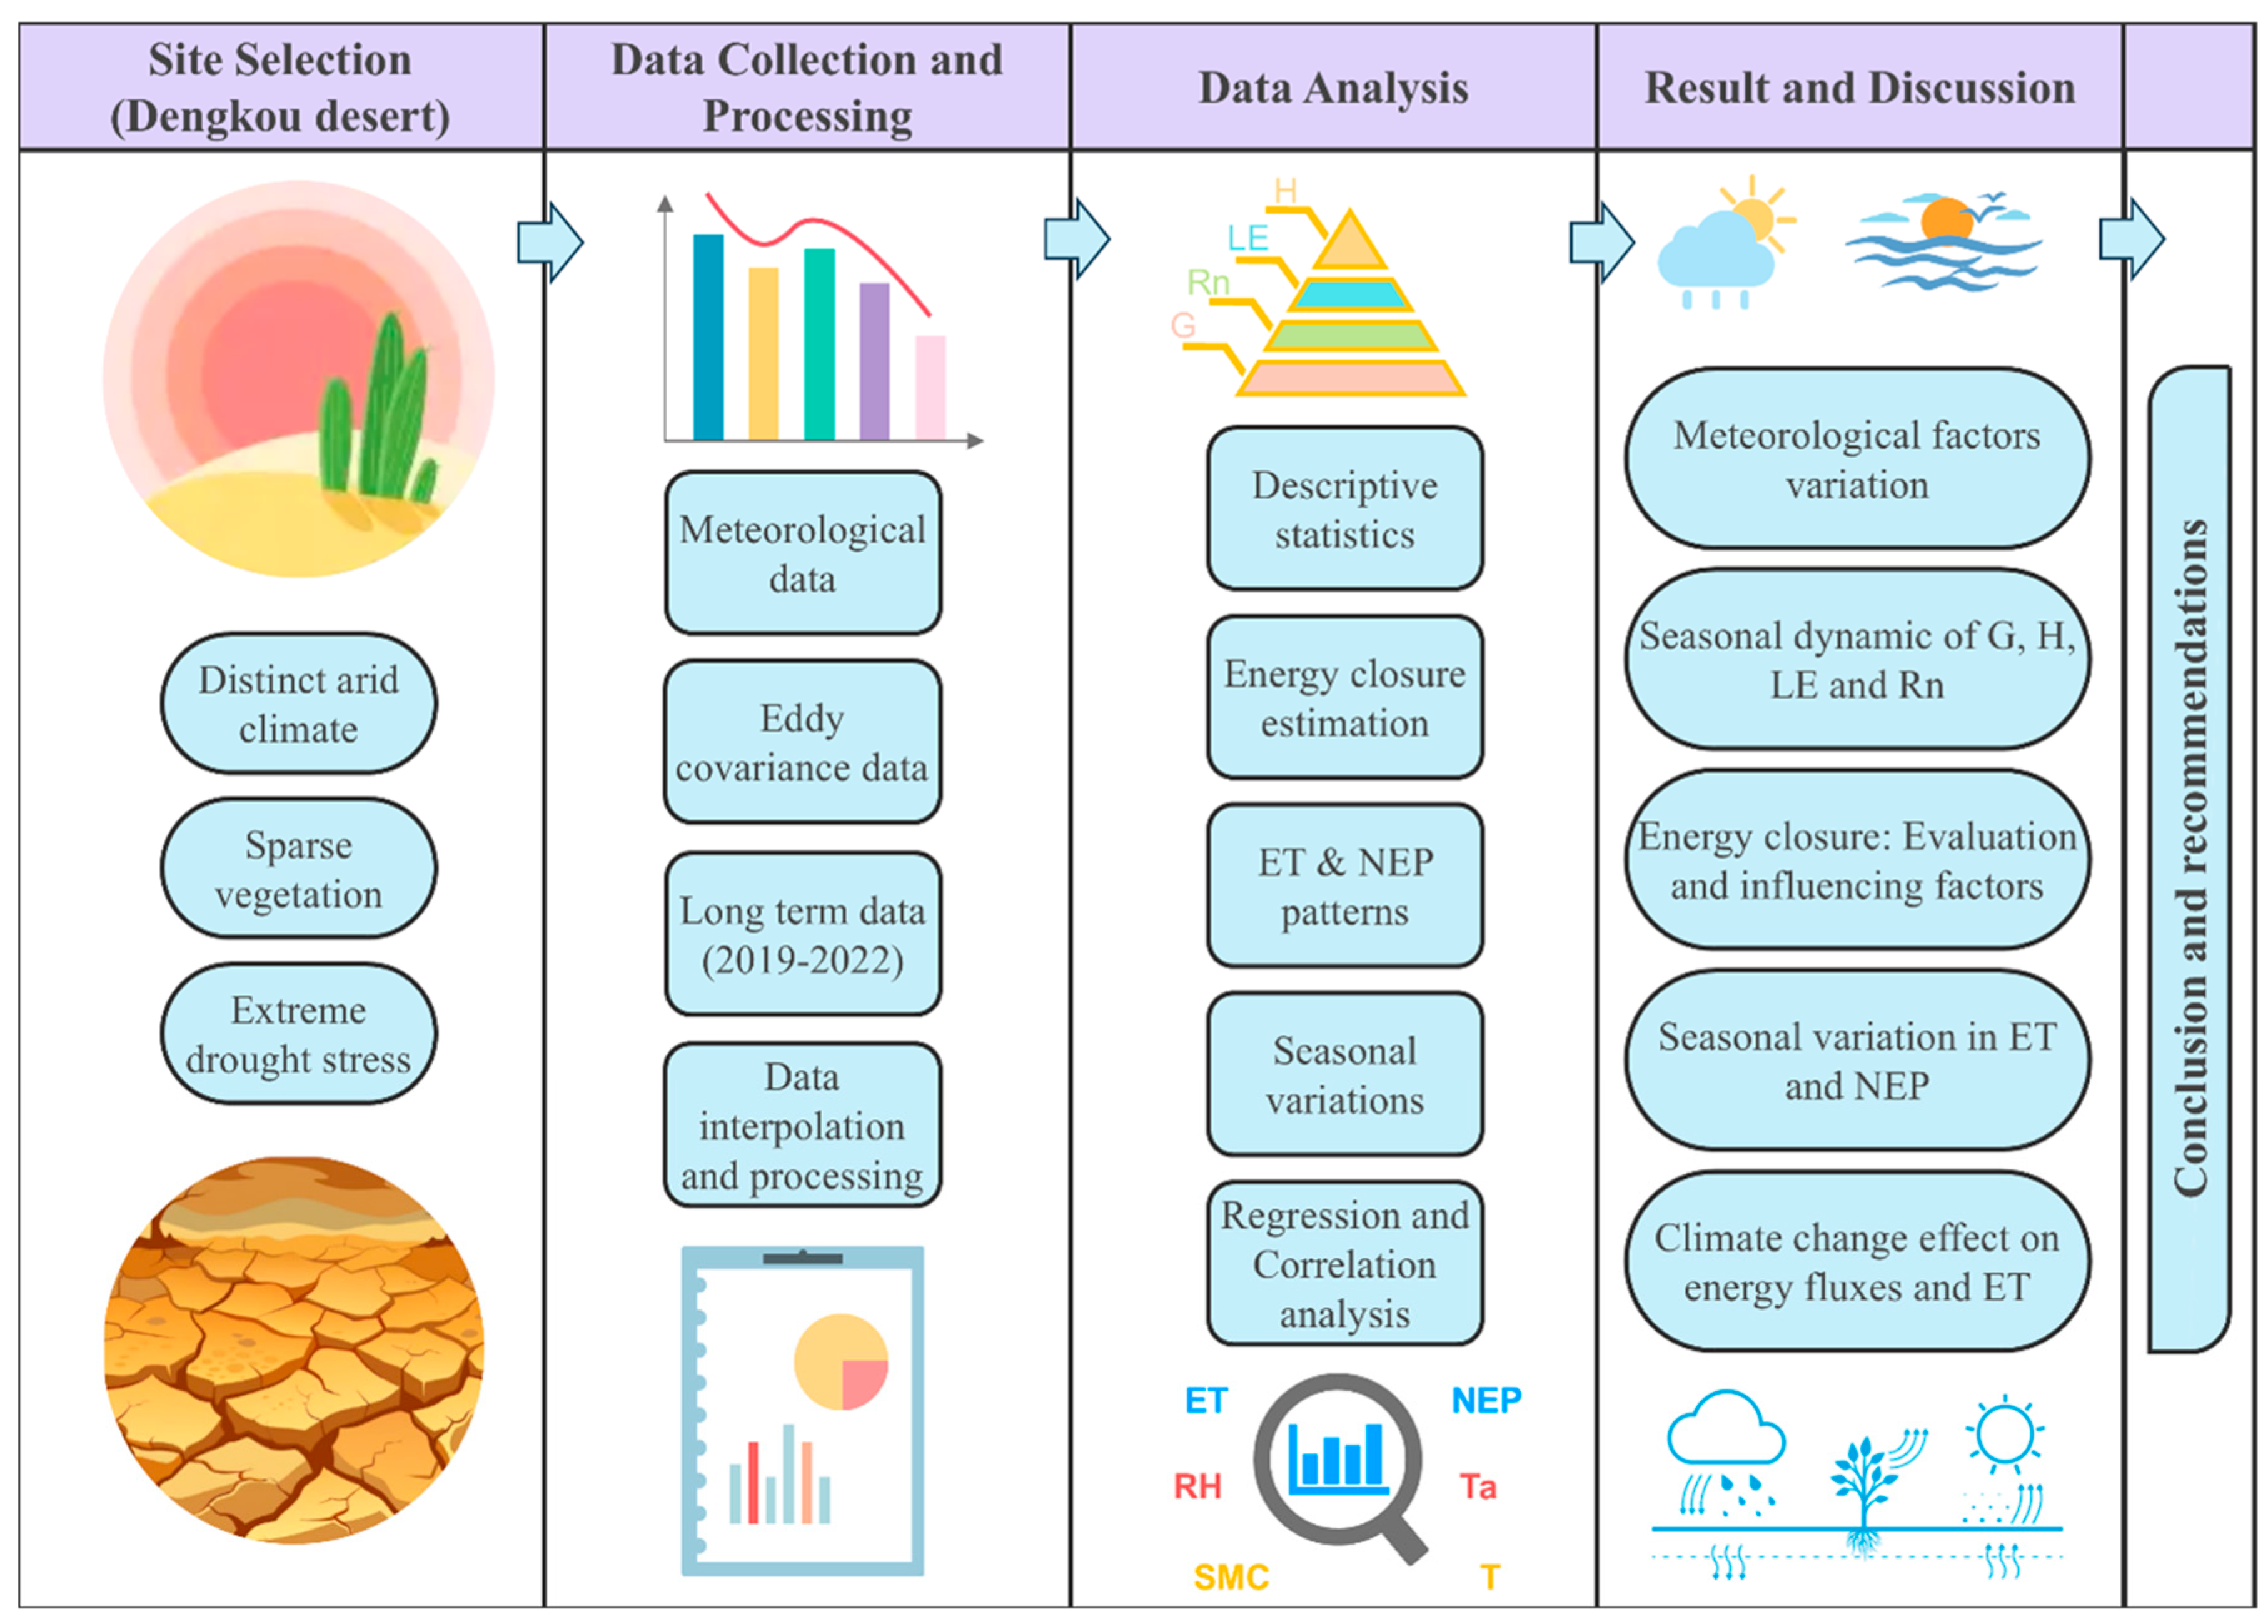
This researched area experiences mostly northwest winds, and the fetch length is thought to be sufficient for EC observations. Measurements of the mean and high-frequency turbulent flows were included in the observations. The gradient monitoring system consisted of a temperature and humidity sensor (HMP45C, Vaisala Inc., Vantaa, Finland), soil temperature sensor (CS616, Campbell Scientific Inc., Logan, UT, USA), and four-component radiation sensor (NR-LITE, Kipp & Zonen, Delft, The Netherlands). To track surface radiation fluxes, it is placed two meters above the ground. Vaisala Inc., Vantaa Finland’s HMP45C temperature and humidity sensor, is mounted at two heights: 2.0 m and 1.5 m, to measure the air temperature and relative humidity. A soil heat flux plate was buried to quantify the soil heat flux (Hukseflux, 4xHFP01, Delft, The Netherlands) at a depth of −0.1 m. Furthermore, soil temperature and humidity were measured at various depths of 0.02, 0.05, 0.1, 0.15, and 0.2 m, using a soil temperature sensor (Campbell Scientific Inc., CS616, Logan, UT, USA). A Campbell Scientific Inc. (Logan, UT, USA) CR3000 data logger that gathers and saves observational data for analysis is attached to each of these pieces of equipment. Sensor configurations are specified (e.g., “NR-LITE radiometer installed horizontally at 2 m height with 10 Hz sampling frequency”). The details and the specifications of the experimental instruments are provided in Appendix A Table A1. The measurements used in this investigation were performed between 2019 and 2022. The adopted research methodology followed a systematic approach, as illustrated in the flowchart diagram (Figure 2).

2.3. Analyzing Data and Calculating Parameters

2.3.1. Data Processing

The upwind surface feature, atmospheric stability and observation height were linked to the spatial representation of EC fluxes [25]. The following Equation (1) was used to calculate H and LE [32]:
H   =   ρ C p w   T ;   L E   =   ρ λ w q
where ρ is air density (kg·m−3), CP is air heat capacity (J·kg−1 °C−1), w′ is vertical wind speed (m·s−1), T′ is air temperature (°C), λ is the latent heat of evaporation (J·kg−1), and q′ is specific humidity. The LI-COR company’s Eddy Pro software was used to preprocess the initial turbulent data with a sample frequency of 10 Hz. The EC system’s initial observational data was first rotated twice for 30 min, after which H and LE underwent an ultrasonic virtual temperature adjustment and a WPL correction, respectively.
Due to observation instrument error and the impact of certain environmental circumstances, certain data were identified as irregular, while some data were missing. After the initial data collection, the datasets with at least 75% of the available data were considered valid for further analysis. Those with more than 25% of missing data were excluded and treated as insufficient or invalid. The completeness and continuity of the dataset were checked by two levels of quality control using the interpolation method, before being used [33]. For gaps smaller than 2 h, a linear interpolation method was employed to maintain temporal continuity, and for longer gaps exceeding 2 h, a diurnal variation method was used to compensate for the missing values by using typical temporal dynamics. The meteorological data from 2019 to 2022 contained less than 5% of missing data and were therefore considered valid. For the seasonal variation analysis of energy balance, and ET, we used the dataset from June 2021 to May 2022, which was complete and showed no significant gaps or extensive missing data during that period.

2.3.2. Closure Problem of Energy Balance

The first thermodynamic law demonstrates that energy in the environment undergoes only a change in form rather than creation or disappearance. Campos et al. [31] state that the total amount of energy that is available is made up of biomass, net radiation (Rn), ground heat flux (G), heat storage (S) in the soil and air beneath the tower. The energy balance relationship is satisfied by the available energy and the turbulent flux (LE, H) under ideal conditions, when there are no errors or losses in the monitoring system:
RnGSQ = LE + H
In the Equation (2), Rn is the surface net radiation flux (W·m−2), G is the soil heat flux (W·m−2), S represents the vegetation canopy’s heat storage, Q is the total of all other energy sources and sinks, LE is the latent heat flux (W·m−2), and H is the sensible heat flux (W·m−2). The above fluxes are collectively referred to as the components of the energy balance. Research shows that when the canopy height is greater than 8 m, the heat storage of the vegetation canopy has a significant impact on the energy balance closure. For desert ecosystems, the S and Q terms are small, and therefore usually ignored [34].
One recognized problem that has not been fixed is the absence of closure of surface energy balance (SEB) fluxes observed by EC systems [35], and this appears in terms of differences between the energy that was available (Rn − G) and the turbulent heat fluxes (H + LE). In this study, the energy balance ratio was utilized to estimate the degree of energy balance closure. The following Equation (3) was used for estimating the EBR:
E B R = Σ ( L E + H ) Σ ( R n G )
The SEB was perfectly closed when the EBR value was 1. Using 30 min averaged observations has the benefit of reducing higher frequency fluctuations and random errors, but it can also cause an overestimation of daytime and night-time upward/downward fluxes [36].

2.3.3. Estimation of Evapotranspiration and Net Ecosystem Production

ET is a combined process of both plant transpiration and water evaporation from soil and other surfaces. It is an essential component of the hydrological cycle and influences water availability, climate regulation, and agricultural practices. Understanding ET dynamics is essential for effective water resource management and ecosystem sustainability. Equation (4) was used to calculate the daily surface ET (mm day−1) [37]:
E T =   L E λ ρ w
where LE is the latent heat flux (MJ m−2 day−1), λ is the latent heat of water vaporization (2.45 kJ g−1), and ρw is the density of water (1 g cm−3).
Ecosystem carbon sink strength is mostly measured by net ecosystem exchange (NEE), which is the net exchange of carbon per unit ground area of the atmosphere and an ecosystem [38]. The NEE is typically calculated by adding the CO2 storage change (Fs) and eddy CO2 flux (Fc) in the airspace beneath the height of the flux measurement. In this study, the canopy height was less than one meter, so the Fs term was ignored for the NEE calculation. In the current study, we used Fc, which indicates NEE [39]. NEP has the opposite sign from NEE, but is equivalent to it [40]. The ecosystem’s uptake of CO2 is indicated by a negative NEE or positive NEP, as shown in Equation (5).
NEP = −NEE

2.3.4. Data Analysis

All monitored data were arranged using Excel 2021. Python (version 3.10) software was used to calculate the parameters, and Origin 2024b (Origin Lab Corporation, Northampton, MA, USA) was used to fit curves and compare various data subsets. The meteorological factors were quantitatively characterized using descriptive statistics and ANOVA. The energy balance was assessed using linear regression analysis. ET, NEP, and the energy fluxes at the inter- and intra-annual scales were investigated from annual and seasonal contrasts. A monthly comparison was conducted between ET and precipitation. The relationship between ET, energy fluxes, and the environmental factors were examined using Pearson’s correlation analysis.

3. Results

3.1. Temperature, Precipitation, Relative Humidity and Wind Speed Variation in Dengkou

On July 13th, 2021, during the summer, the highest daily temperature reached 29.6 °C. Conversely, the lowest recorded daily temperature was −20.6 °C, observed on 6 January 2021, highlighting the intensity of the winter cold extreme (Table 1).
The mean annual temperatures from 2019 to 2022 were 8.73 °C, 8.31 °C, 9.63 °C and 8.32 °C, respectively, with corresponding coefficient variance (CV%) values of 152.51%, 159.00%, 142.74%, and 159.01%. However, these high CV% values indicate substantial temporal variability in daily temperature across all four years, particularly in 2020 and 2022. Similarly, the average relative humidity values ranged from 40.29% to 44.94% over the study period, with CV% values of 38.18%, 45.87%, 38.31% and 45.86% from 2019 to 2022, respectively. These values indicate moderate variability in atmospheric moisture levels, with higher fluctuations observed in 2020 and 2022. The study area is classified by an arid climate, because it receives relatively low precipitation throughout the year. The mean annual precipitation over the four-year study period was 109.35 mm, indicating persistently dry conditions. Typically, the majority of the annual precipitation occurs between May and September, with 71.6% and 97.2% of the total annual precipitation recorded during these months, respectively. Furthermore, there was an unequal distribution of precipitation in terms of both time and quantity. The mean wind speed for each year was 3.09 m/s, 2.97 m/s, 3.45 m/s, and 3.03 m/s for the years 2019–2022, respectively. Annual comparisons by ANOVA revealed significant differences in relative humidity (F = 3.02, p = 0.03), driven by lower values in 2021 compared to 2020 and 2022. Temperature showed no inter-annual variation (F = 0.32, p = 0.81). Precipitation (F = 2.15, p = 0.09) and wind speed (F = 2.51, p = 0.06) exhibited marginal trends, but did not reach statistical significance.
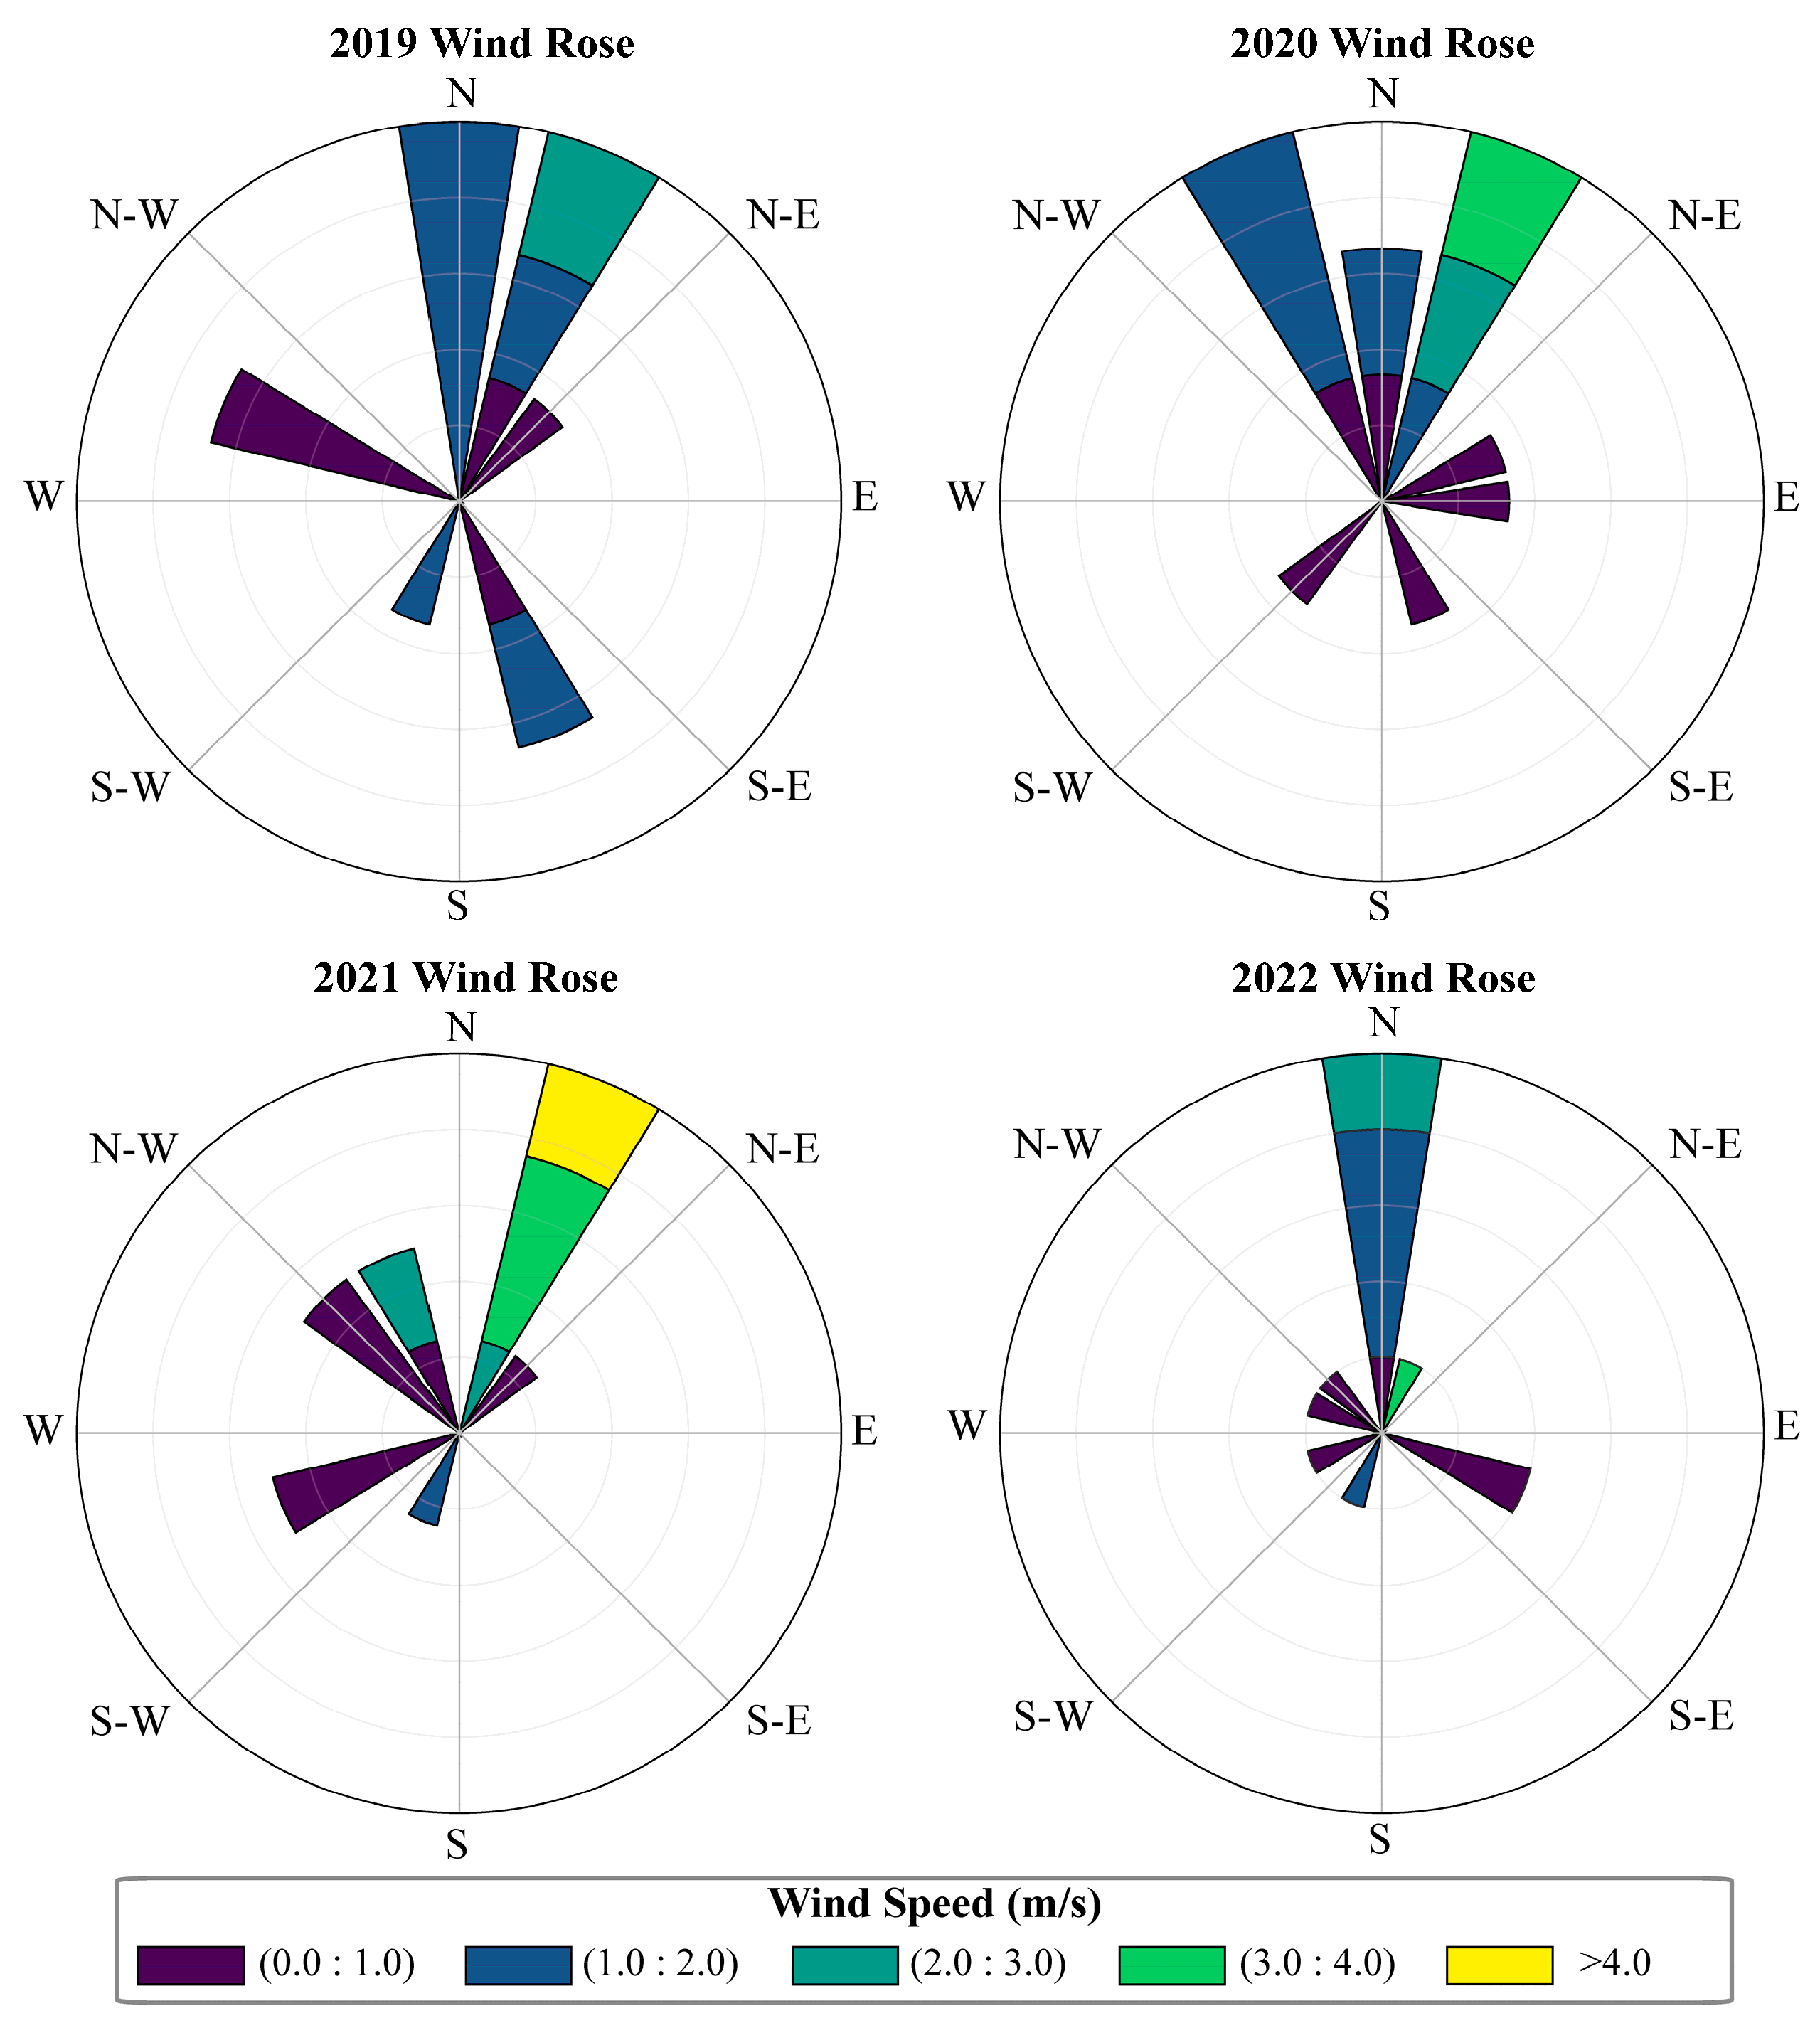
The wind rose diagrams for 2019–2022 (Figure 3) show that the dominant wind direction was from the west–north-west (N-W) in 2019, with wind speeds peaking at 7.9 m/s. Low wind speeds (0.0–1.0 m/s) were most common from the west and south-west, while stronger winds occurred mainly in the north-west.
In 2020, wind patterns were similar, but with a broader distribution of moderate wind speeds (1.0–2.0 m/s), particularly in the south-east, and a higher frequency of calm periods (0.0–1.0 m/s). The maximum wind speed was 8.3 m/s. In 2021, wind speeds slightly increased, with the maximum reaching 8.4 m/s, as provided in Table 1. In 2021, wind speeds exceeding 4 m/s were observed, which was not seen in 2019, 2020, or 2022, indicating an increase in stronger winds during that year. Lower wind speeds (0.0–1.0 m/s) increased, especially from the north-east, indicating calmer conditions in that direction. The pattern remained consistent with prior years, but wind speeds were generally more variable. In 2022, the north-east sector became more dominant, with a maximum wind speed of 8.0 m/s. Winds were more concentrated in the north-east and north-west directions, with moderate wind speeds (1.0–2.0 m/s) most common. Over the studied period, wind speeds were generally stronger in the first half of the year, especially during spring and early summer, showing typical seasonal variation. The coefficient of variation (CV) for wind speed indicated higher inter-annual variability in 2019 and 2022, suggesting more fluctuating conditions in these years.

3.2. Seasonal Dynamic of Ground Heat, Sensible Heat, Latent Heat, and Net Radiation

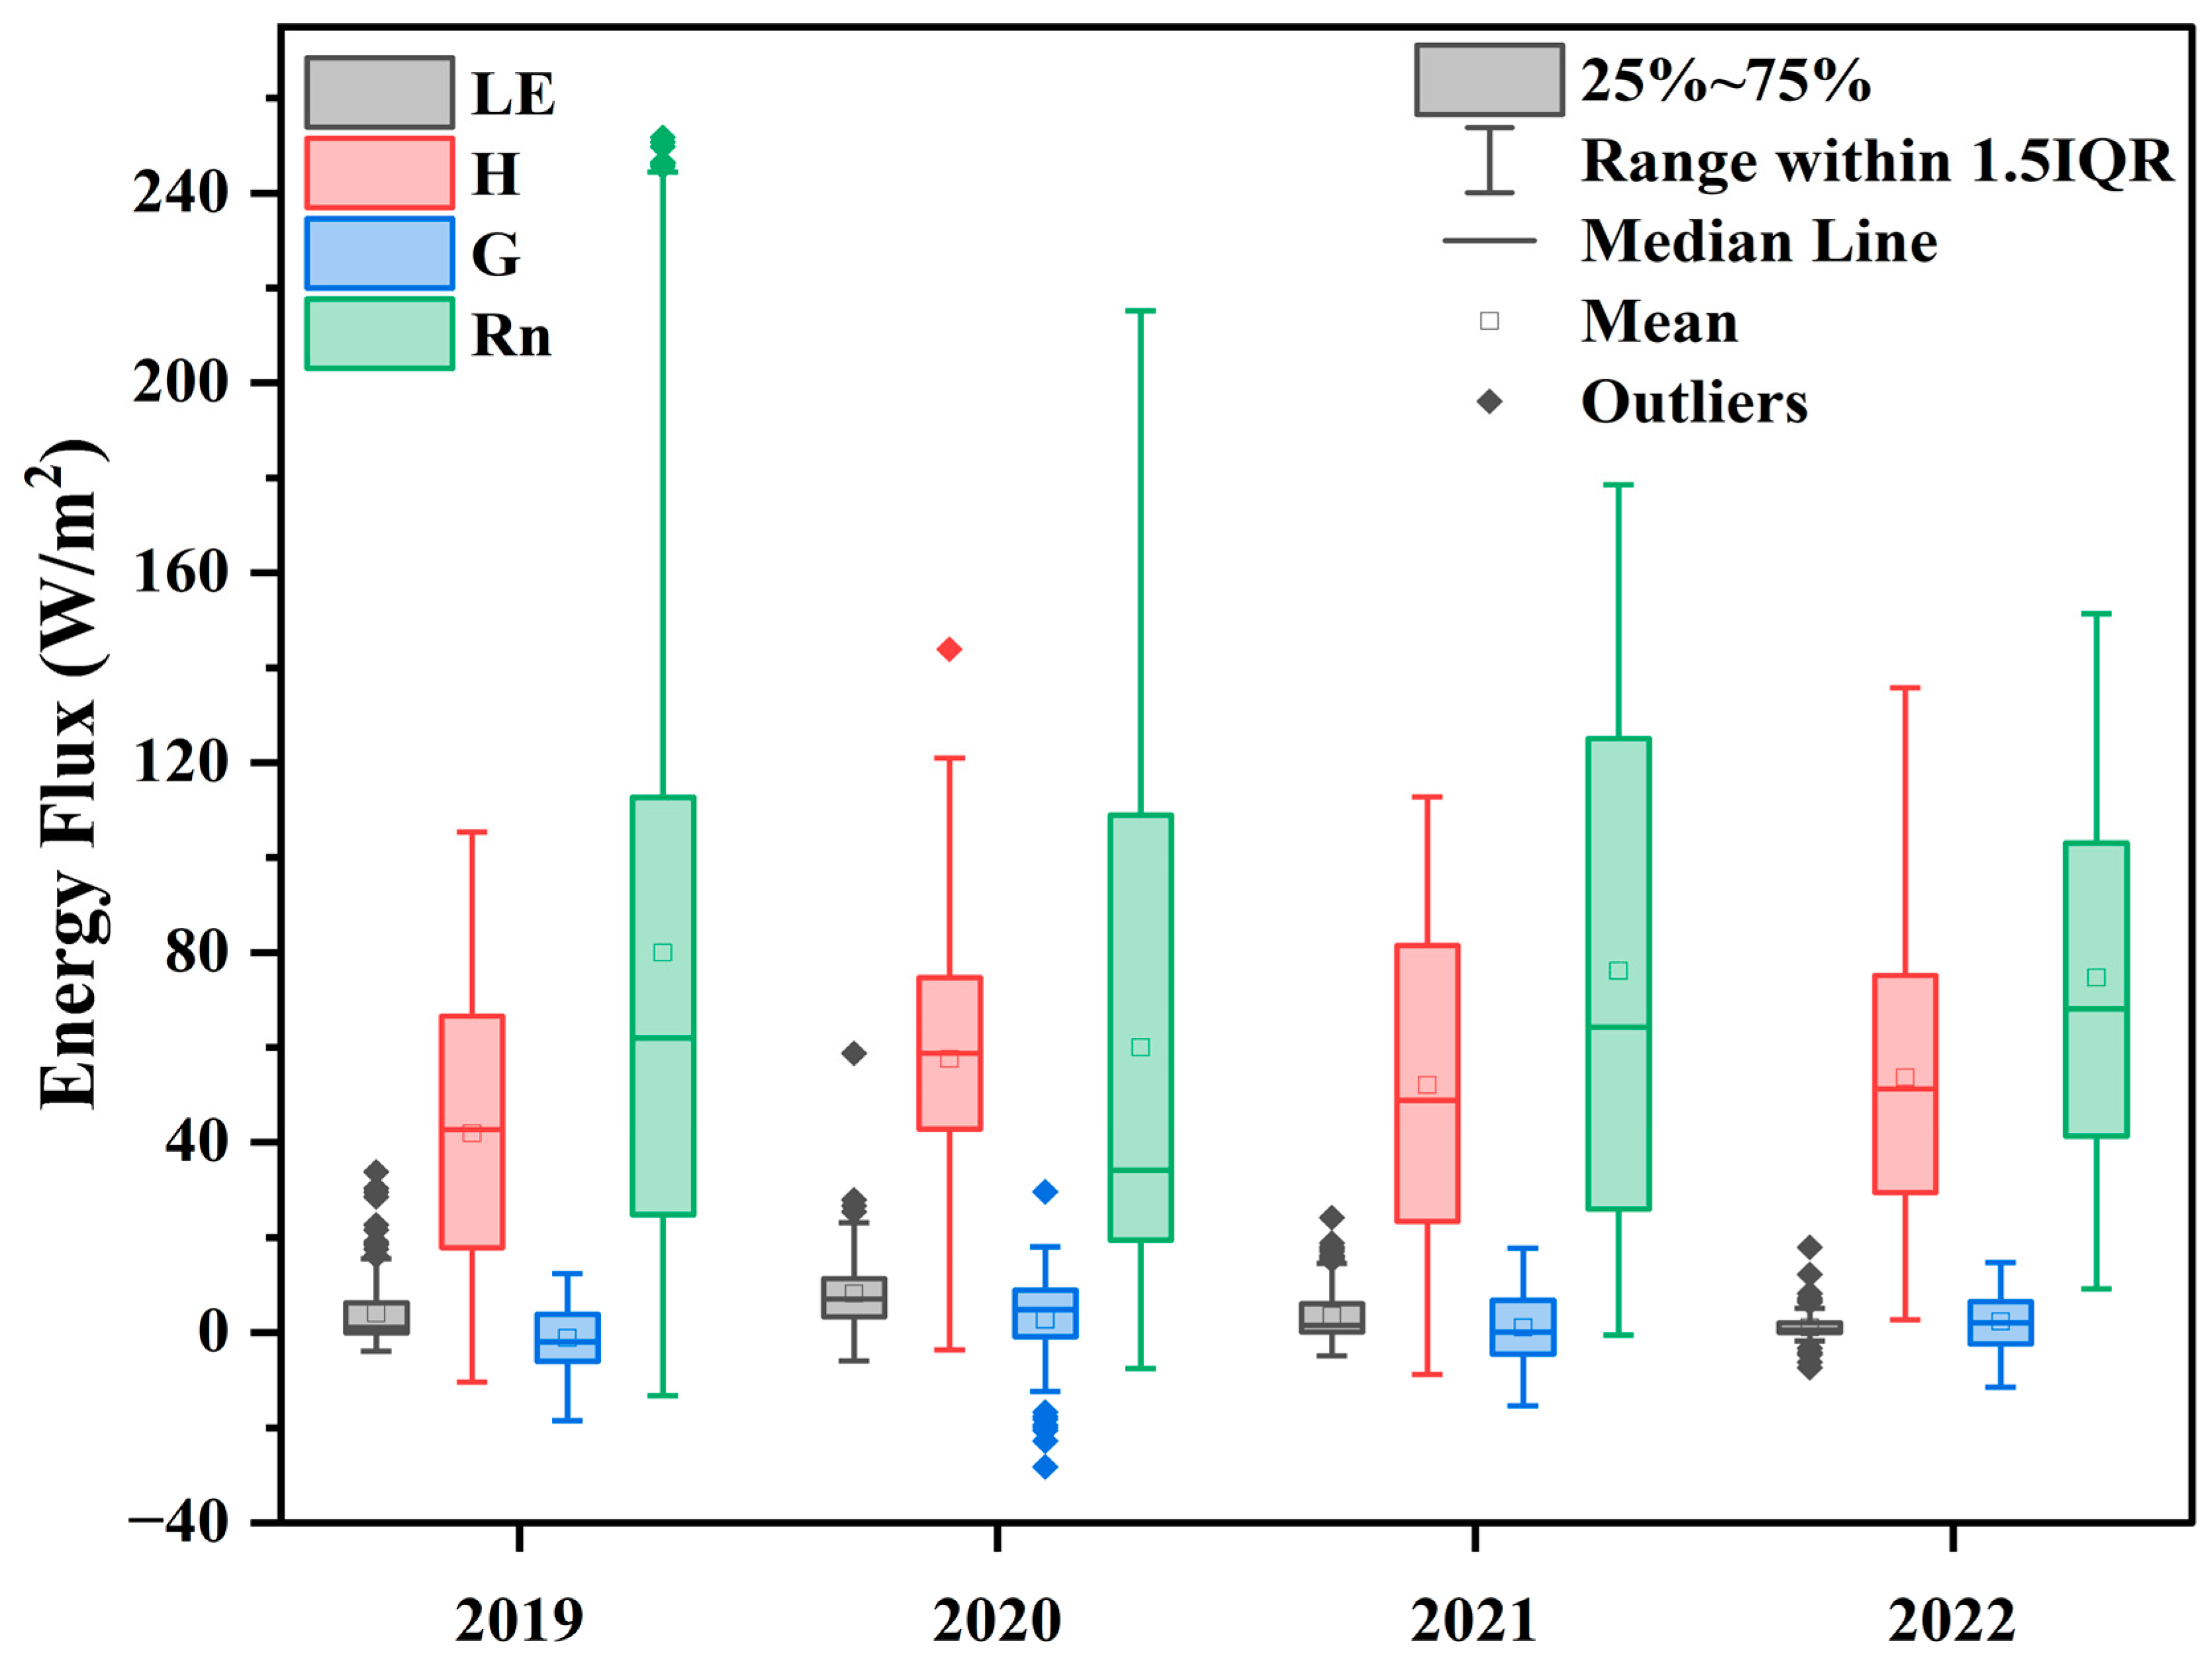
The half-hour energy flux daily averages of LE, H, G, and Rn are crucial components of the surface energy balance. These components exhibit seasonal fluctuations over the years 2019 to 2022. LE values were low during the studied period, reflecting surface drought and low vegetation cover, as depicted in Figure 4. However, LE followed a seasonal pattern similar to Rn, indicating the influence of precipitation. The mean LE values for 2019, 2020, 2021, and 2022 were 4.06, 8.24, 3.57, and 1.10 W·m−2, respectively, with significant variation during the rainy season, peaking during wetter periods.
H showed clear seasonal variation, increasing from the beginning of the year and slightly decreasing later. The mean H values were 41.94, 57.60, 52.05, and 53.64 W·m−2 for 2019, 2020, 2021, and 2022, respectively, and a gradual decrease towards the end of the year. G remained positive across all years, indicating heat transfer from the atmosphere to the soil, with mean values of 5.93, 2.84, 1.07, and 2.32 W·m−2 for the years 2019 to 2022. Fluctuations in G were evident, with both negative and positive variations observed during seasonal transitions. Rn exhibited a clear seasonal pattern, peaking during the warmer months. The mean Rn values for 2019, 2020, 2021, and 2022 were 79.99, 60.04, 76.11, and 74.68 W·m−2, respectively, as provided in Figure 4. Rn ranged from 5.88 W·m−2 in November 2019 to 251.73 W·m−2 in July 2019, showing a distinct seasonality in energy input, with the highest fluxes occurring during the growing season. From 2019 to 2022, G remained positive in 2019, except in November and December. In 2020, 2021, and 2022, G became negative from September to February, indicating heat transfer from the soil to the atmosphere.
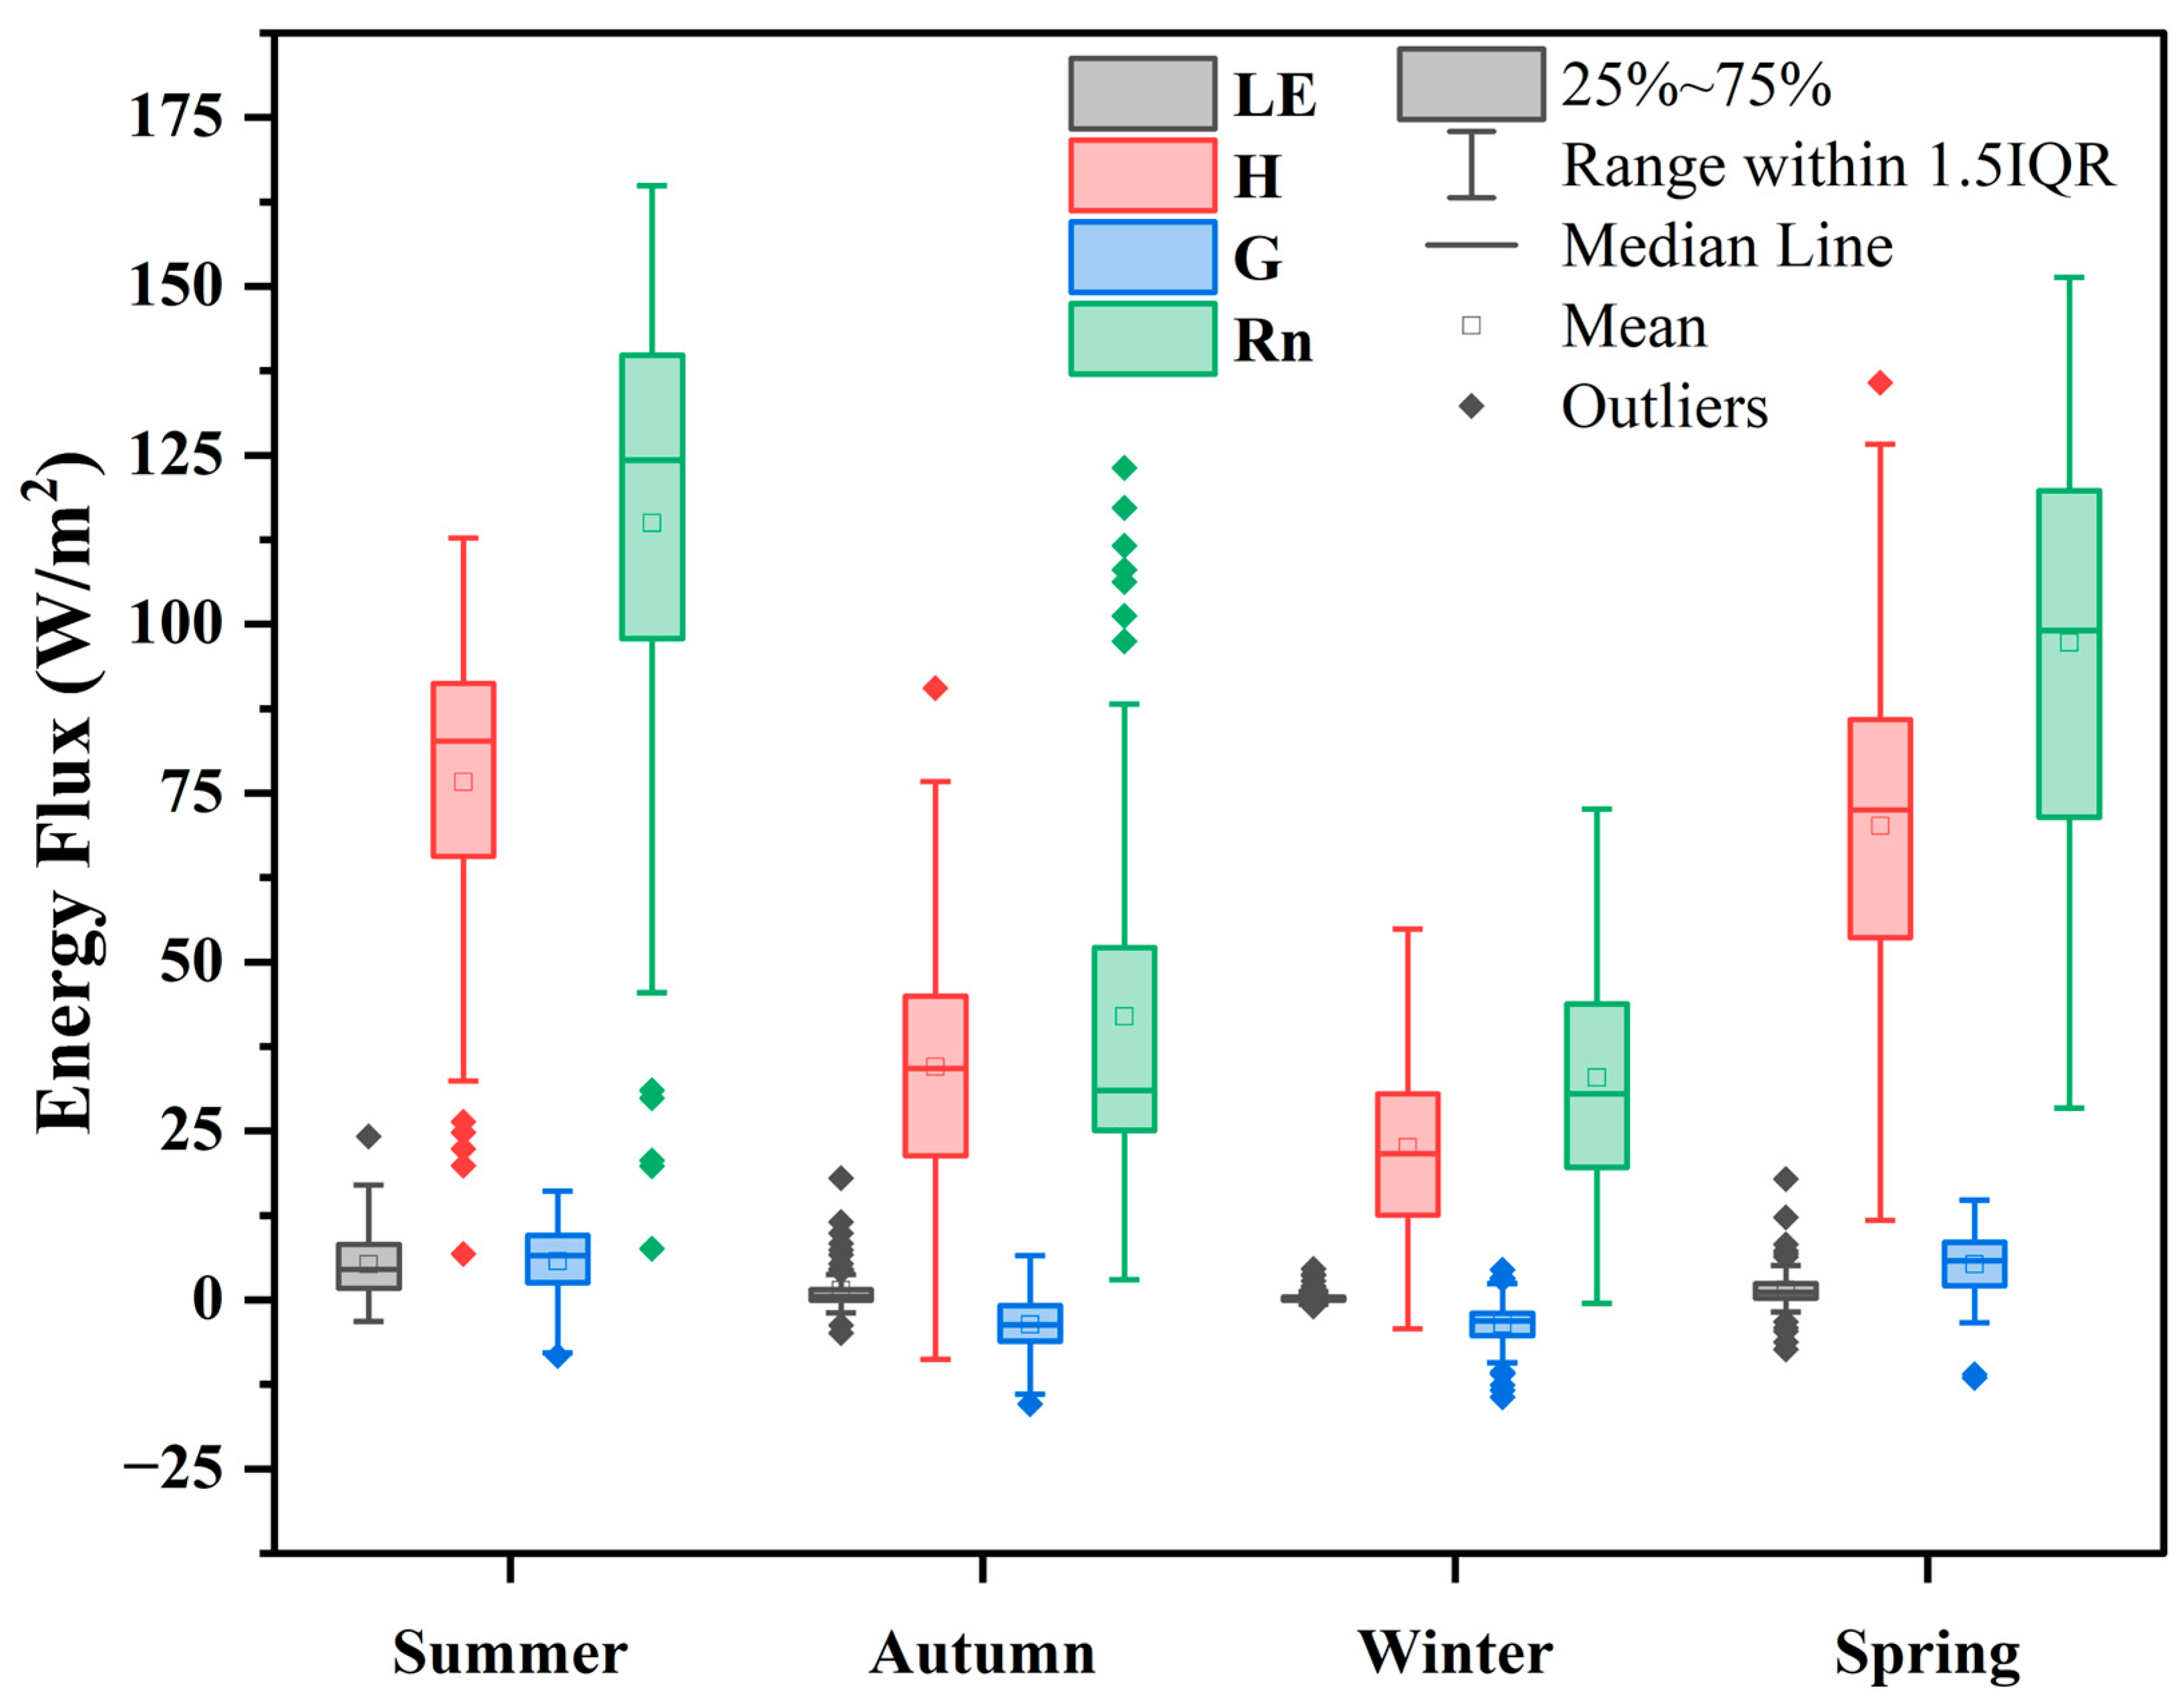
Figure 5 shows the seasonal variation of LE, H, G, and Rn across summer, autumn, winter, and spring during June 2021 to May 2022. LE was lowest in winter (5.27 W·m−2) and autumn (5.73 W·m−2), reflecting dry conditions and low vegetation activity, and increased in spring (1.55 W·m−2) and summer (5.27 W·m−2), with more energy exchange due to higher temperatures. H was highest in summer (76.66 W·m−2) and spring (70.17 W·m−2), driven by atmospheric warming, and lowest in winter (1.49 W·m−2), due to minimal heating from low temperatures.
G remained low across all seasons, with small negative values in winter (−3.58 W·m−2) and autumn (−3.60 W·m−2), indicating heat transfer from the soil to the atmosphere during colder months. Positive values of G were observed in summer (22.62 W·m−2) and spring (5.31 W·m−2), showing heat transfer from the atmosphere to the soil. Rn peaked in summer (114.96 W·m−2) and spring (97.27 W·m−2), reflecting the energy input during warmer months, while the lowest values were recorded in autumn (41.93 W·m−2) and winter (22.62 W·m−2), coinciding with reduced sunlight and lower temperatures. The seasonal variations in LE, H, G, and Rn are influenced by factors such as vegetation cover, soil moisture, and environmental conditions [29]. During spring and summer, increased vegetation activity and higher temperatures enhance the energy exchange processes, leading to higher LE and H values. In contrast, winter and autumn are characterized by reduced vegetation activity and lower temperatures, resulting in lower LE and H values [26,41]. G exhibits seasonal variability, with negative values indicating heat transfer from the soil to the atmosphere during colder months and positive values indicating heat transfer from the atmosphere to the soil during warmer months. Rn is a critical component of the surface energy balance, with its seasonal variations reflecting changes in solar radiation, atmospheric conditions, and surface properties [42].

3.3. Energy Closure: Evaluation, Variability, and Influencing Factors

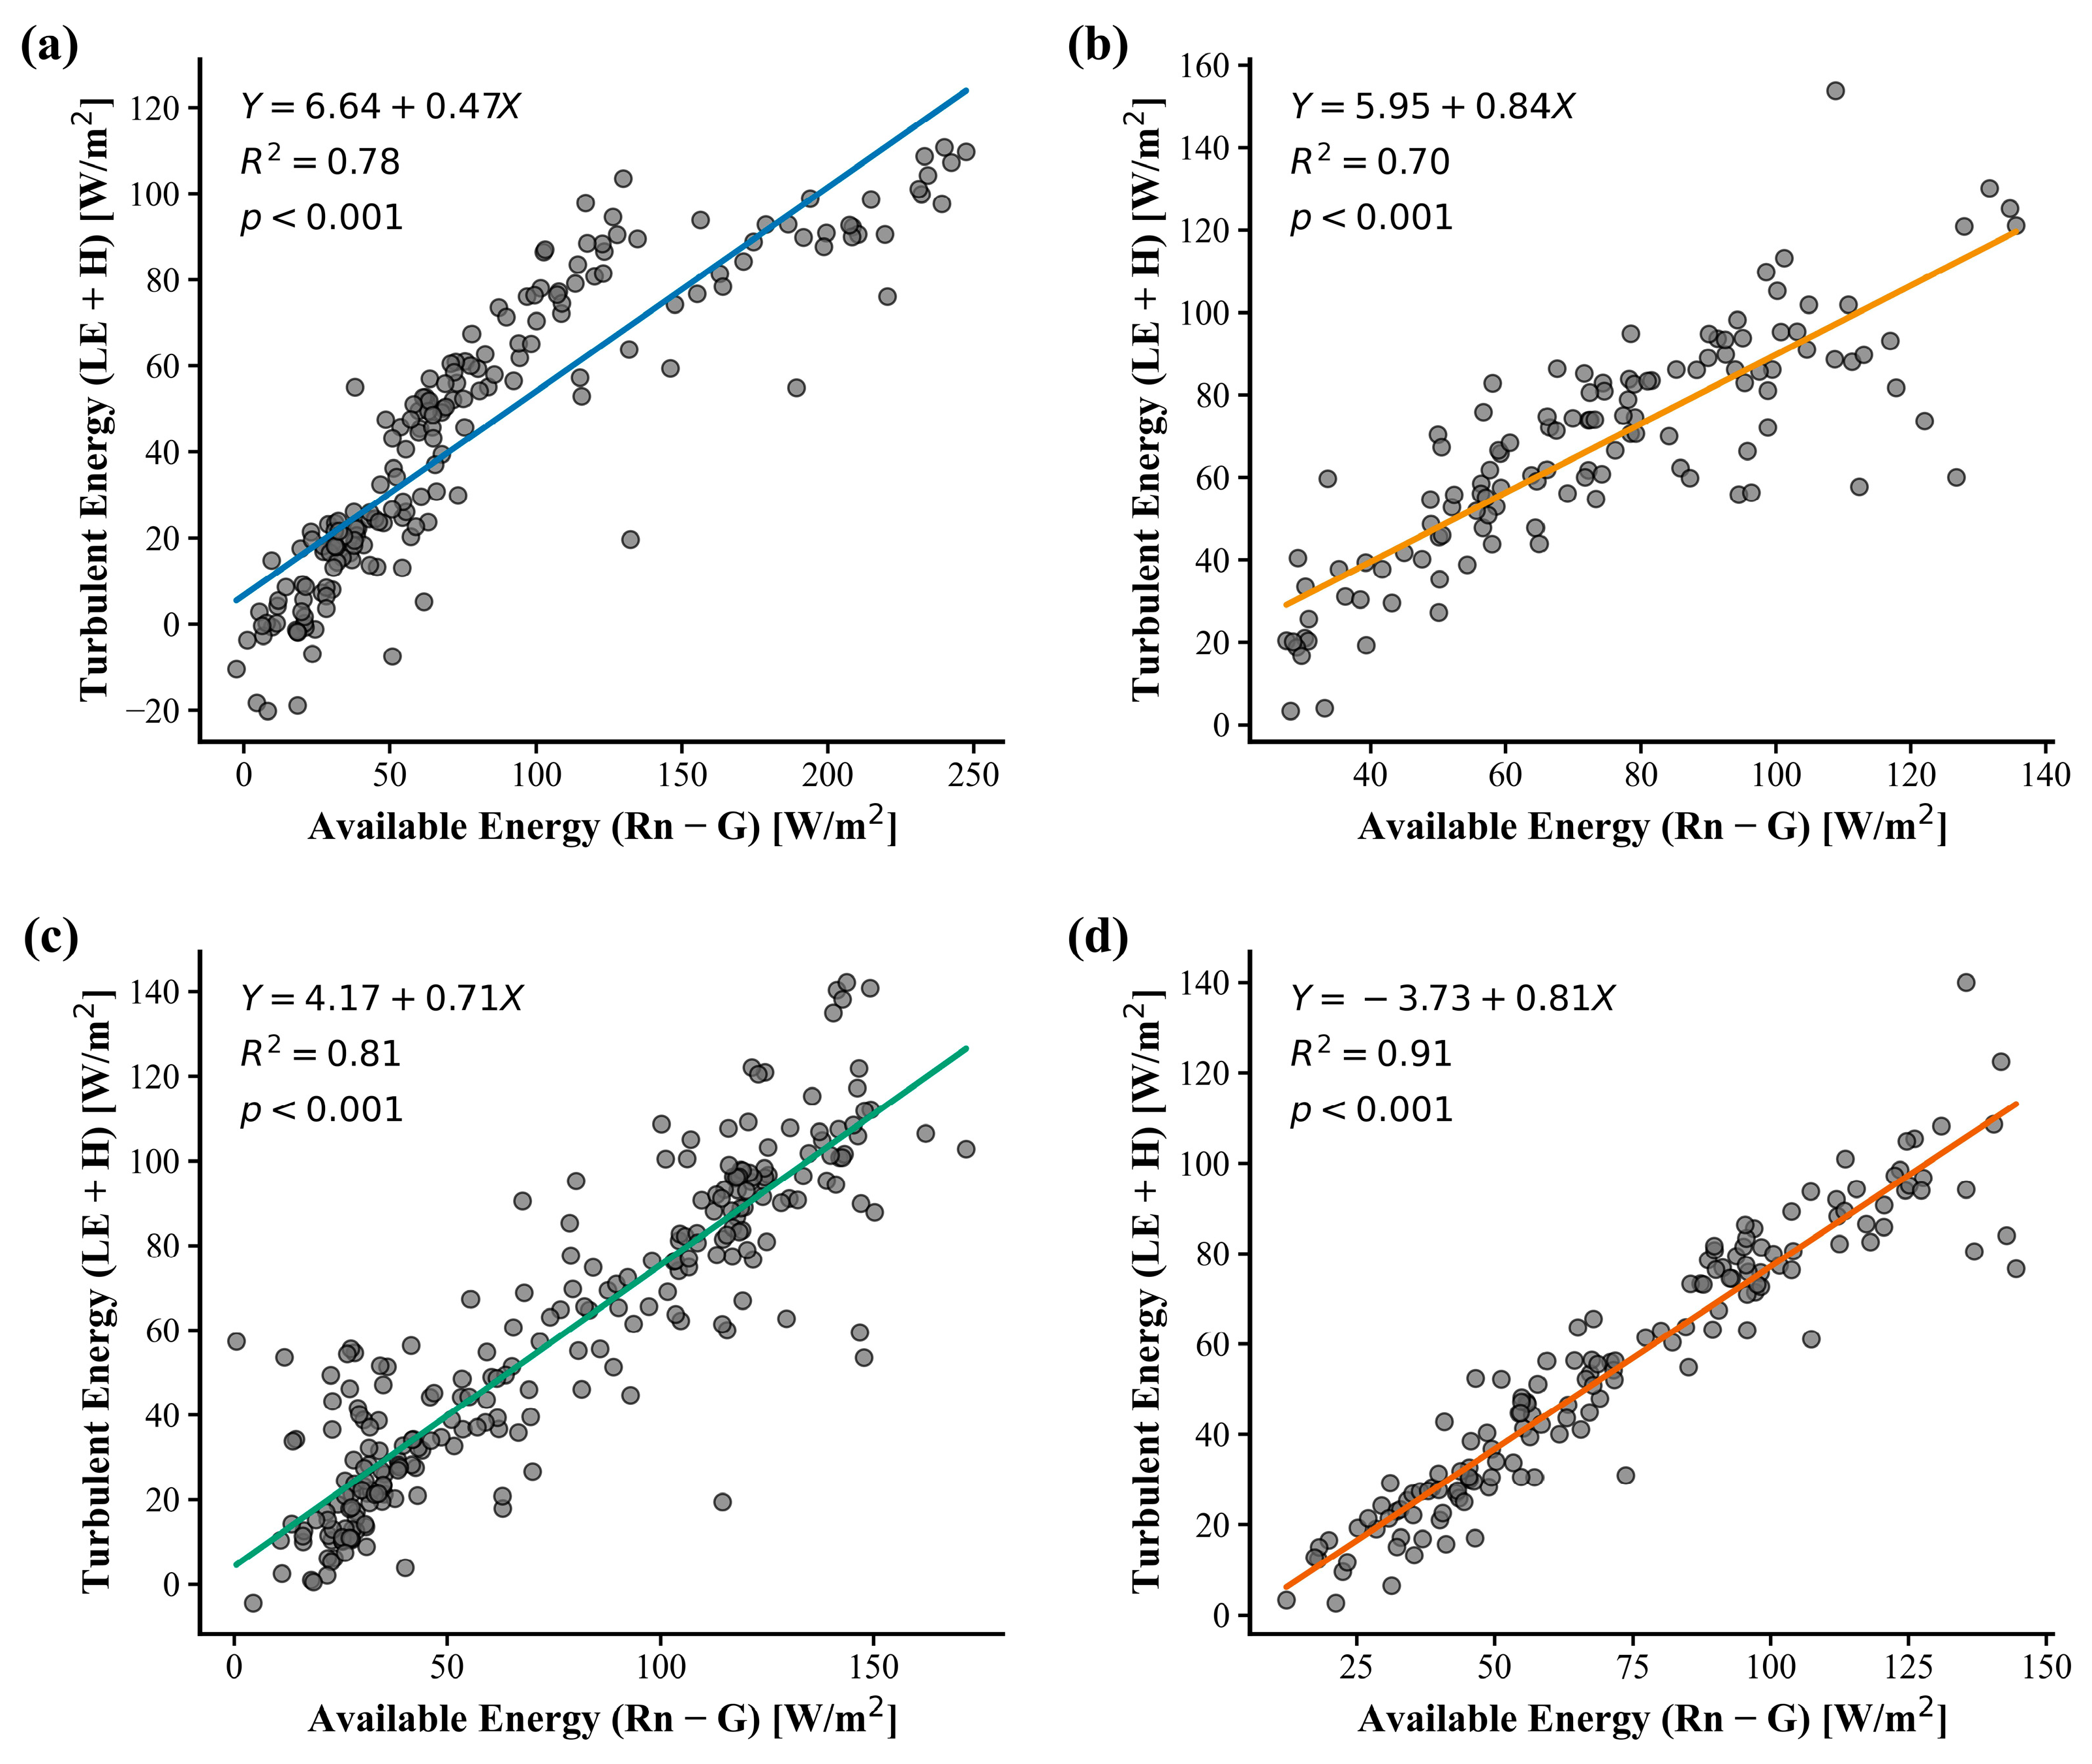
Daily energy closure, in which the energy intake (available energy, Rn − G) matches the energy output (turbulent energy, LE + H) is critical for effectively representing ecosystem energy dynamics, and the regression analysis between them is demonstrated in Figure 6a–d. However, deviations from this closure can occur due to a variety of variables, most notably the delayed impacts of short observation periods and misaligned flux data distributions.
These issues can result in major mistakes when evaluating energy dynamics, thereby distorting results and interpretations. The energy closure percentages in 2019, 2020, 2021 and 2022 were 67%, 66%, 67%, and 69%, respectively. In 2022, the application of linear regression analysis to assess available energy in conjunction with turbulent energy yielded a value of R2 = 0.91 (p = 0.001), indicating a close relationship and an improved explanation of energy processes within the ecosystem. A high R2 value suggests that the model represents the relationship between these variables, thus enriching our understanding of energy dynamics. The energy balance ratio (EBR) values of 0.61, 0.80, 0.70 and 0.75 offer further information about the annual fluctuations in energy closure. The highest EBR of 0.80 observed in 2021 shows tremendous improvements in energy efficiency or measurement precision. These results indicate that the year 2021 was quite conducive to energy dynamics research, possibly because of the ideal environmental conditions. On the other hand, the lower EBR values recorded in 2019 and 2020 suggest difficulties in closing energy, possibly due to environmental inconsistencies or technical constraints on data synchronism.

3.4. Seasonal Variation in Evapotranspiration

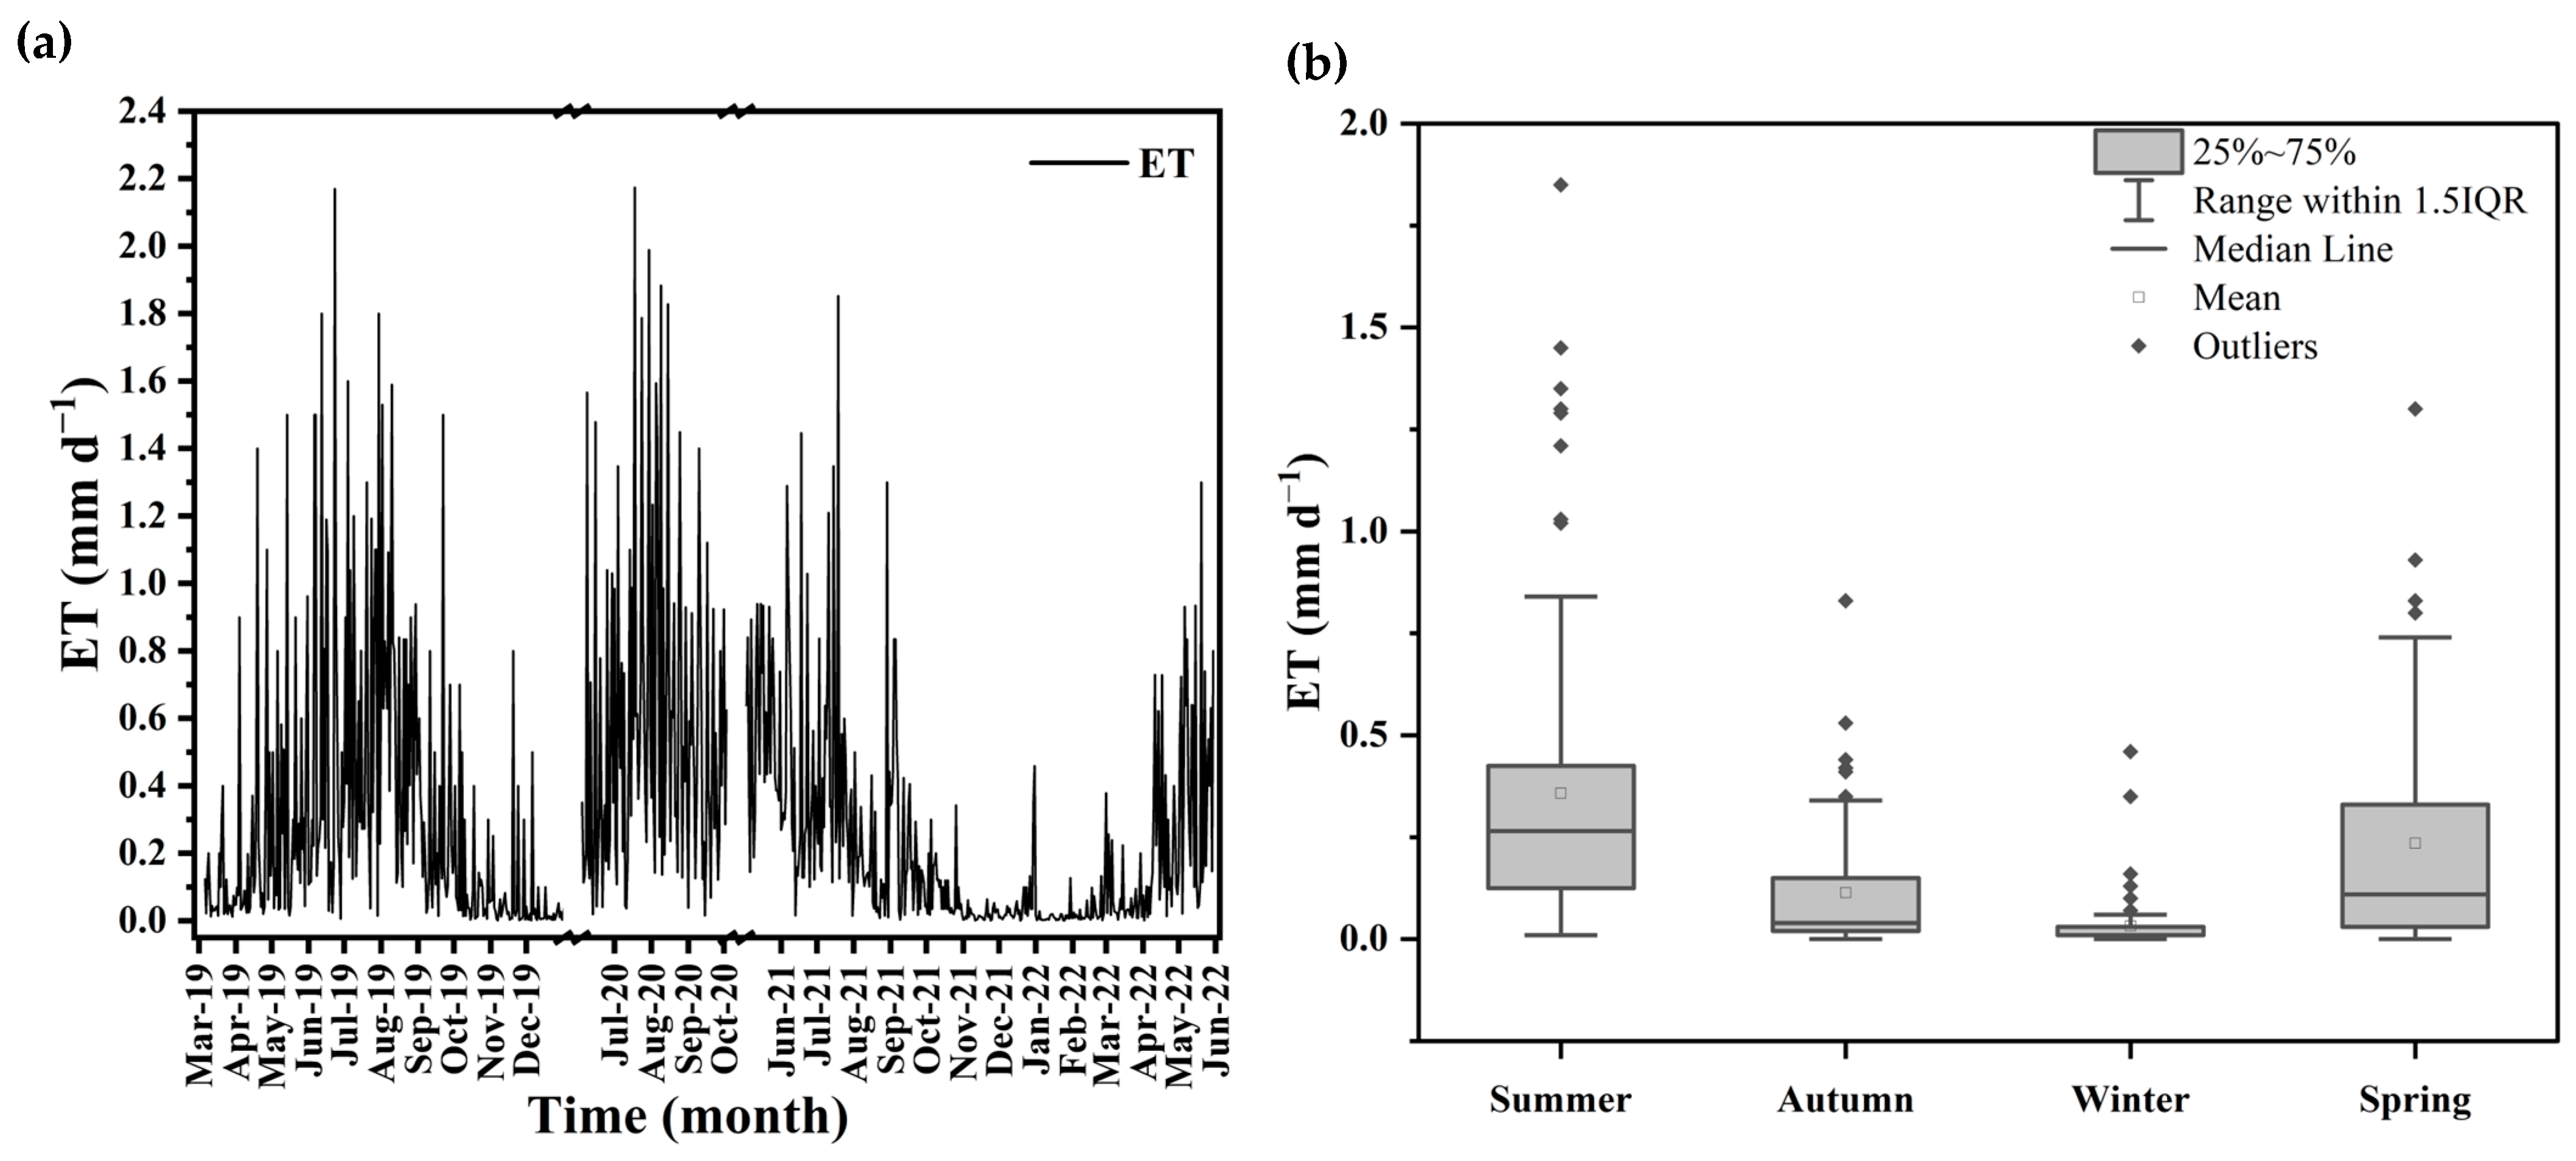
In Inner Mongolia’s desert ecology, the pattern of seasonal variations in ET is clearly apparent. Small-scale weather variations cause ET to fluctuate irregularly from the seasonal variation curve. In general, the daily total ET peaks twice a year. The expansion of vegetation mostly influences the first peak, while the effects of climate change are responsible for the second peak. When vegetation grows, ET varies dramatically over time. The change in daily total ET during the observation period is shown in Figure 7a. ET was less before May, and increased rapidly after entering the growing season (i.e., May to August).
The daily maximum average ET in 2019 was 2.17 mm d−1, which occurred on 23rd June, and the average value was 0.36 mm d−1. The maximum daily average ET in 2020 was 2.15 mm d−1, which occurred on 18th July, and the average value was 0.36 mm d−1. The maximum daily average ET in 2021 was 1.71 mm d−1, which occurred on 19th July, and the average value was 0.36 mm d−1. The maximum daily energy ET in 2022 was 1.3 mm d−1, which occurred on 20th May, and the average value was 0.15 mm d−1. Figure 7b illustrates the seasonal distribution of ET in Inner Mongolia’s desert ecosystem from June 2021 to May 2022. ET was highest during summer, with an average of 0.36 mm d−1, reflecting optimal vegetation growth conditions and increased evaporative demand. Spring showed moderate ET (mean 0.23 mm d−1), linked to the initial phase of vegetation development. Autumn had significantly lower ET values (mean 0.11 mm d−1), attributed to declining vegetation activity and cooler temperatures. Winter recorded the lowest ET (mean 0.03 mm d−1), indicating minimal vegetation activity and reduced evaporative conditions. The presence of outliers in summer and spring underscores the sensitivity of ET to short-term climatic variations.
In 2019, the total amount of rainfall and ET from March to October was 79.6 mm and 86.8 mm, respectively, with ET being higher than precipitation (Figure 8). ET exhibits a strong dependence on temperature, demonstrating a consistent increase with temperature rise, as shown in Figure 8. ET greater than precipitation indicates that the underlying surface water is in a deficit state. This single precipitation hardly generates surface runoff, and also cannot penetrate into the deep soil. It only increases the relative humidity of the air and the moisture of the surface soil, in a short interval of time. The total ET in June–September 2020 was less than the precipitation, indicating that there was a water deficit in the region during that observation period. The total ET in each month from June to September 2020 was less than the precipitation, and most of the precipitation was consumed in the form of ET. ET accounted for 61% of precipitation. In 2021, the desert ecosystem saw a total moisture loss of 62.29 mm, which was reflected in the total ET.
In 2022, the overall rate of ET from January to May was 22.59 mm, indicating average winter conditions in the desert habitat. The lower rates during this time show that cooler temperatures and lower humidity help to prevent moisture loss, even though in winter some evaporation happened because of sunny days. Understanding these trends is critical for understanding the loss of water through ET, particularly in arid areas where every drop of precipitation counts. This data demonstrates the seasonal variations in ET, which can help guide in estimating the total loss of water during the investigated years.

3.5. Variation in Net Ecosystem Production

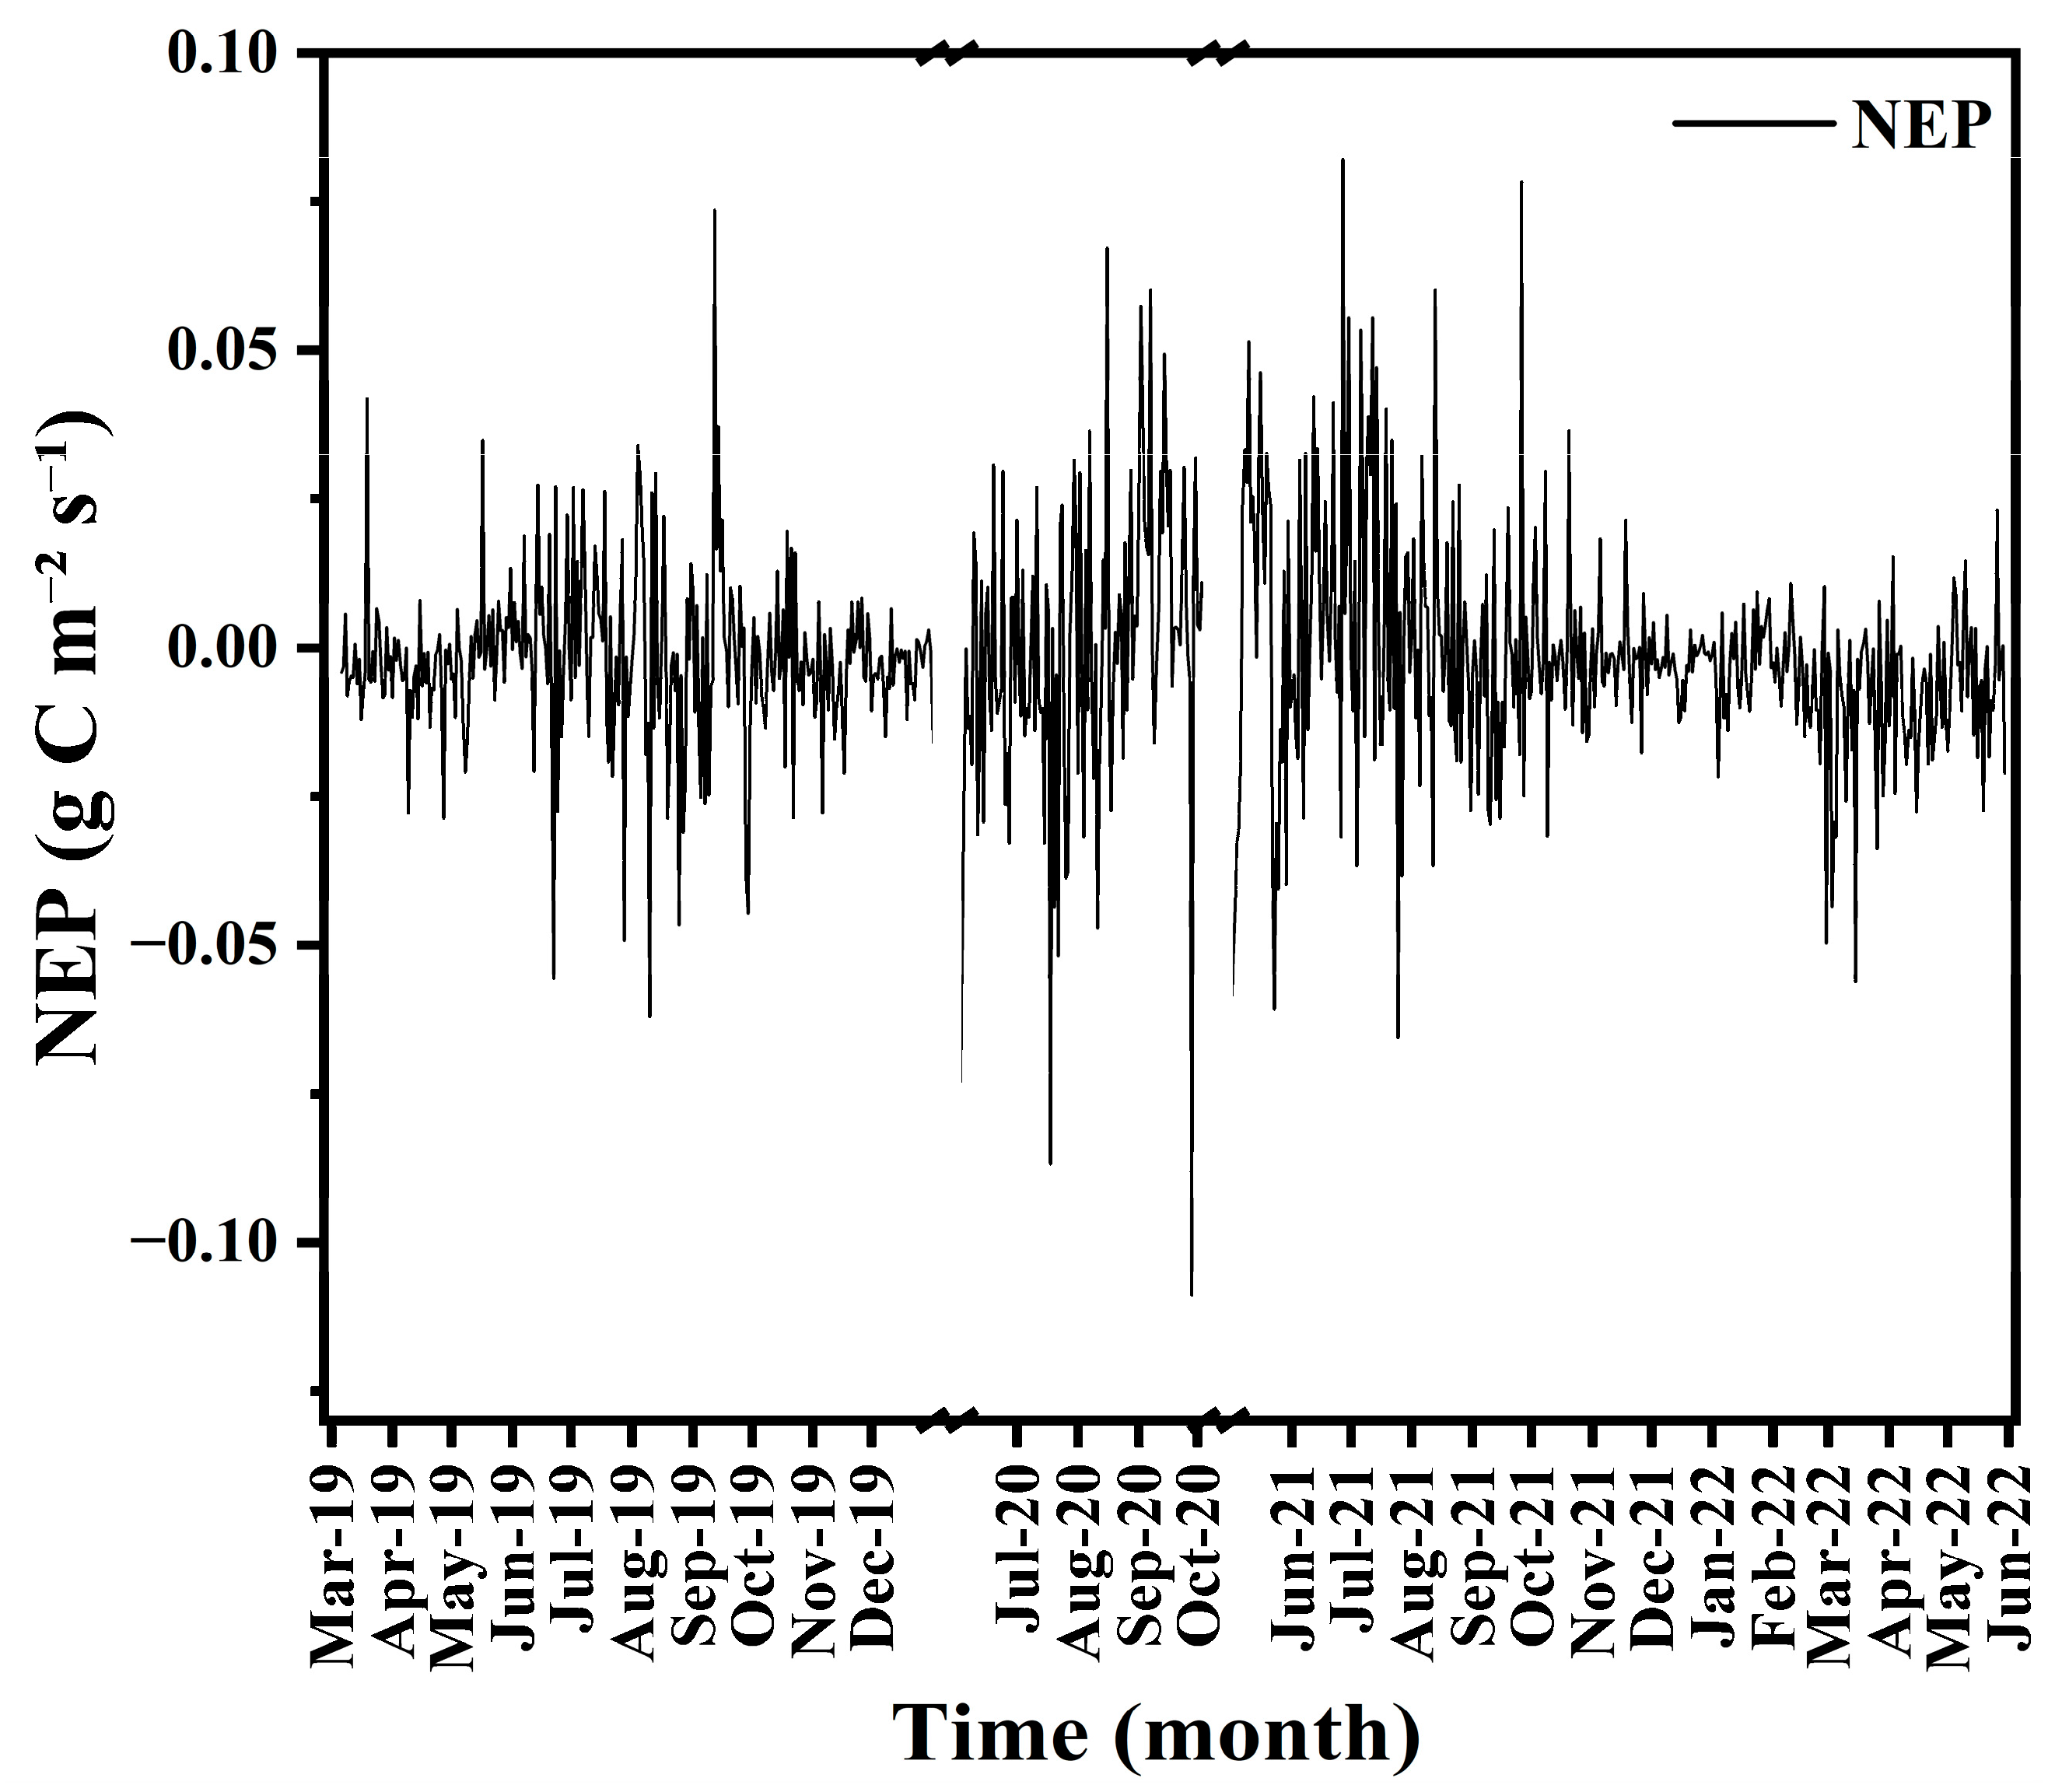
The seasonal variation in NEP and carbon production from 2019 to 2022 in Dengkou, Inner Mongolia, is illustrated in Figure 9. Carbon sequestration is indicated by positive values, whereas carbon release is indicated by negative values. Seasonal variations in NEP result in larger positive values in the summer, because of enhanced photosynthesis, and lower values in the winter, because of slower respiration and decreased production. In 2019, the desert ecosystem had a net loss of carbon, as evidenced by the NEP total annual sum of −0.551 g C m−2 s−1. The highest recorded NEP was 0.073 g C m−2 s−1, which was recorded on 12 September 2019. The entire NEP was −0.096 g C m−2 s−1 in 2020. During this year, the NEP had a maximum of 0.0672 g C m−2 s−1 and a minimum of −0.169 g C m−2 s−1. It represents the lowest observed measurement during the observation period of 2019 to 2022.
The overall NEP for 2021 was 0.295 g C m−2 s−1, which indicated a positive value. This was a major change, because it was the only year in the time under study to demonstrate a net increase in carbon. This year’s positive NEP indicates that the environment was successfully storing more carbon than it was emitting. The lowest NEP value throughout the observation period was reported in 2022, and was −0.996 g C m−2 s−1. This year’s negative NEP shows that there was a substantial loss of carbon from the environment due to high levels of carbon release, as opposed to sequestration.

3.6. Influencing Factors of Energy Fluxes and ET

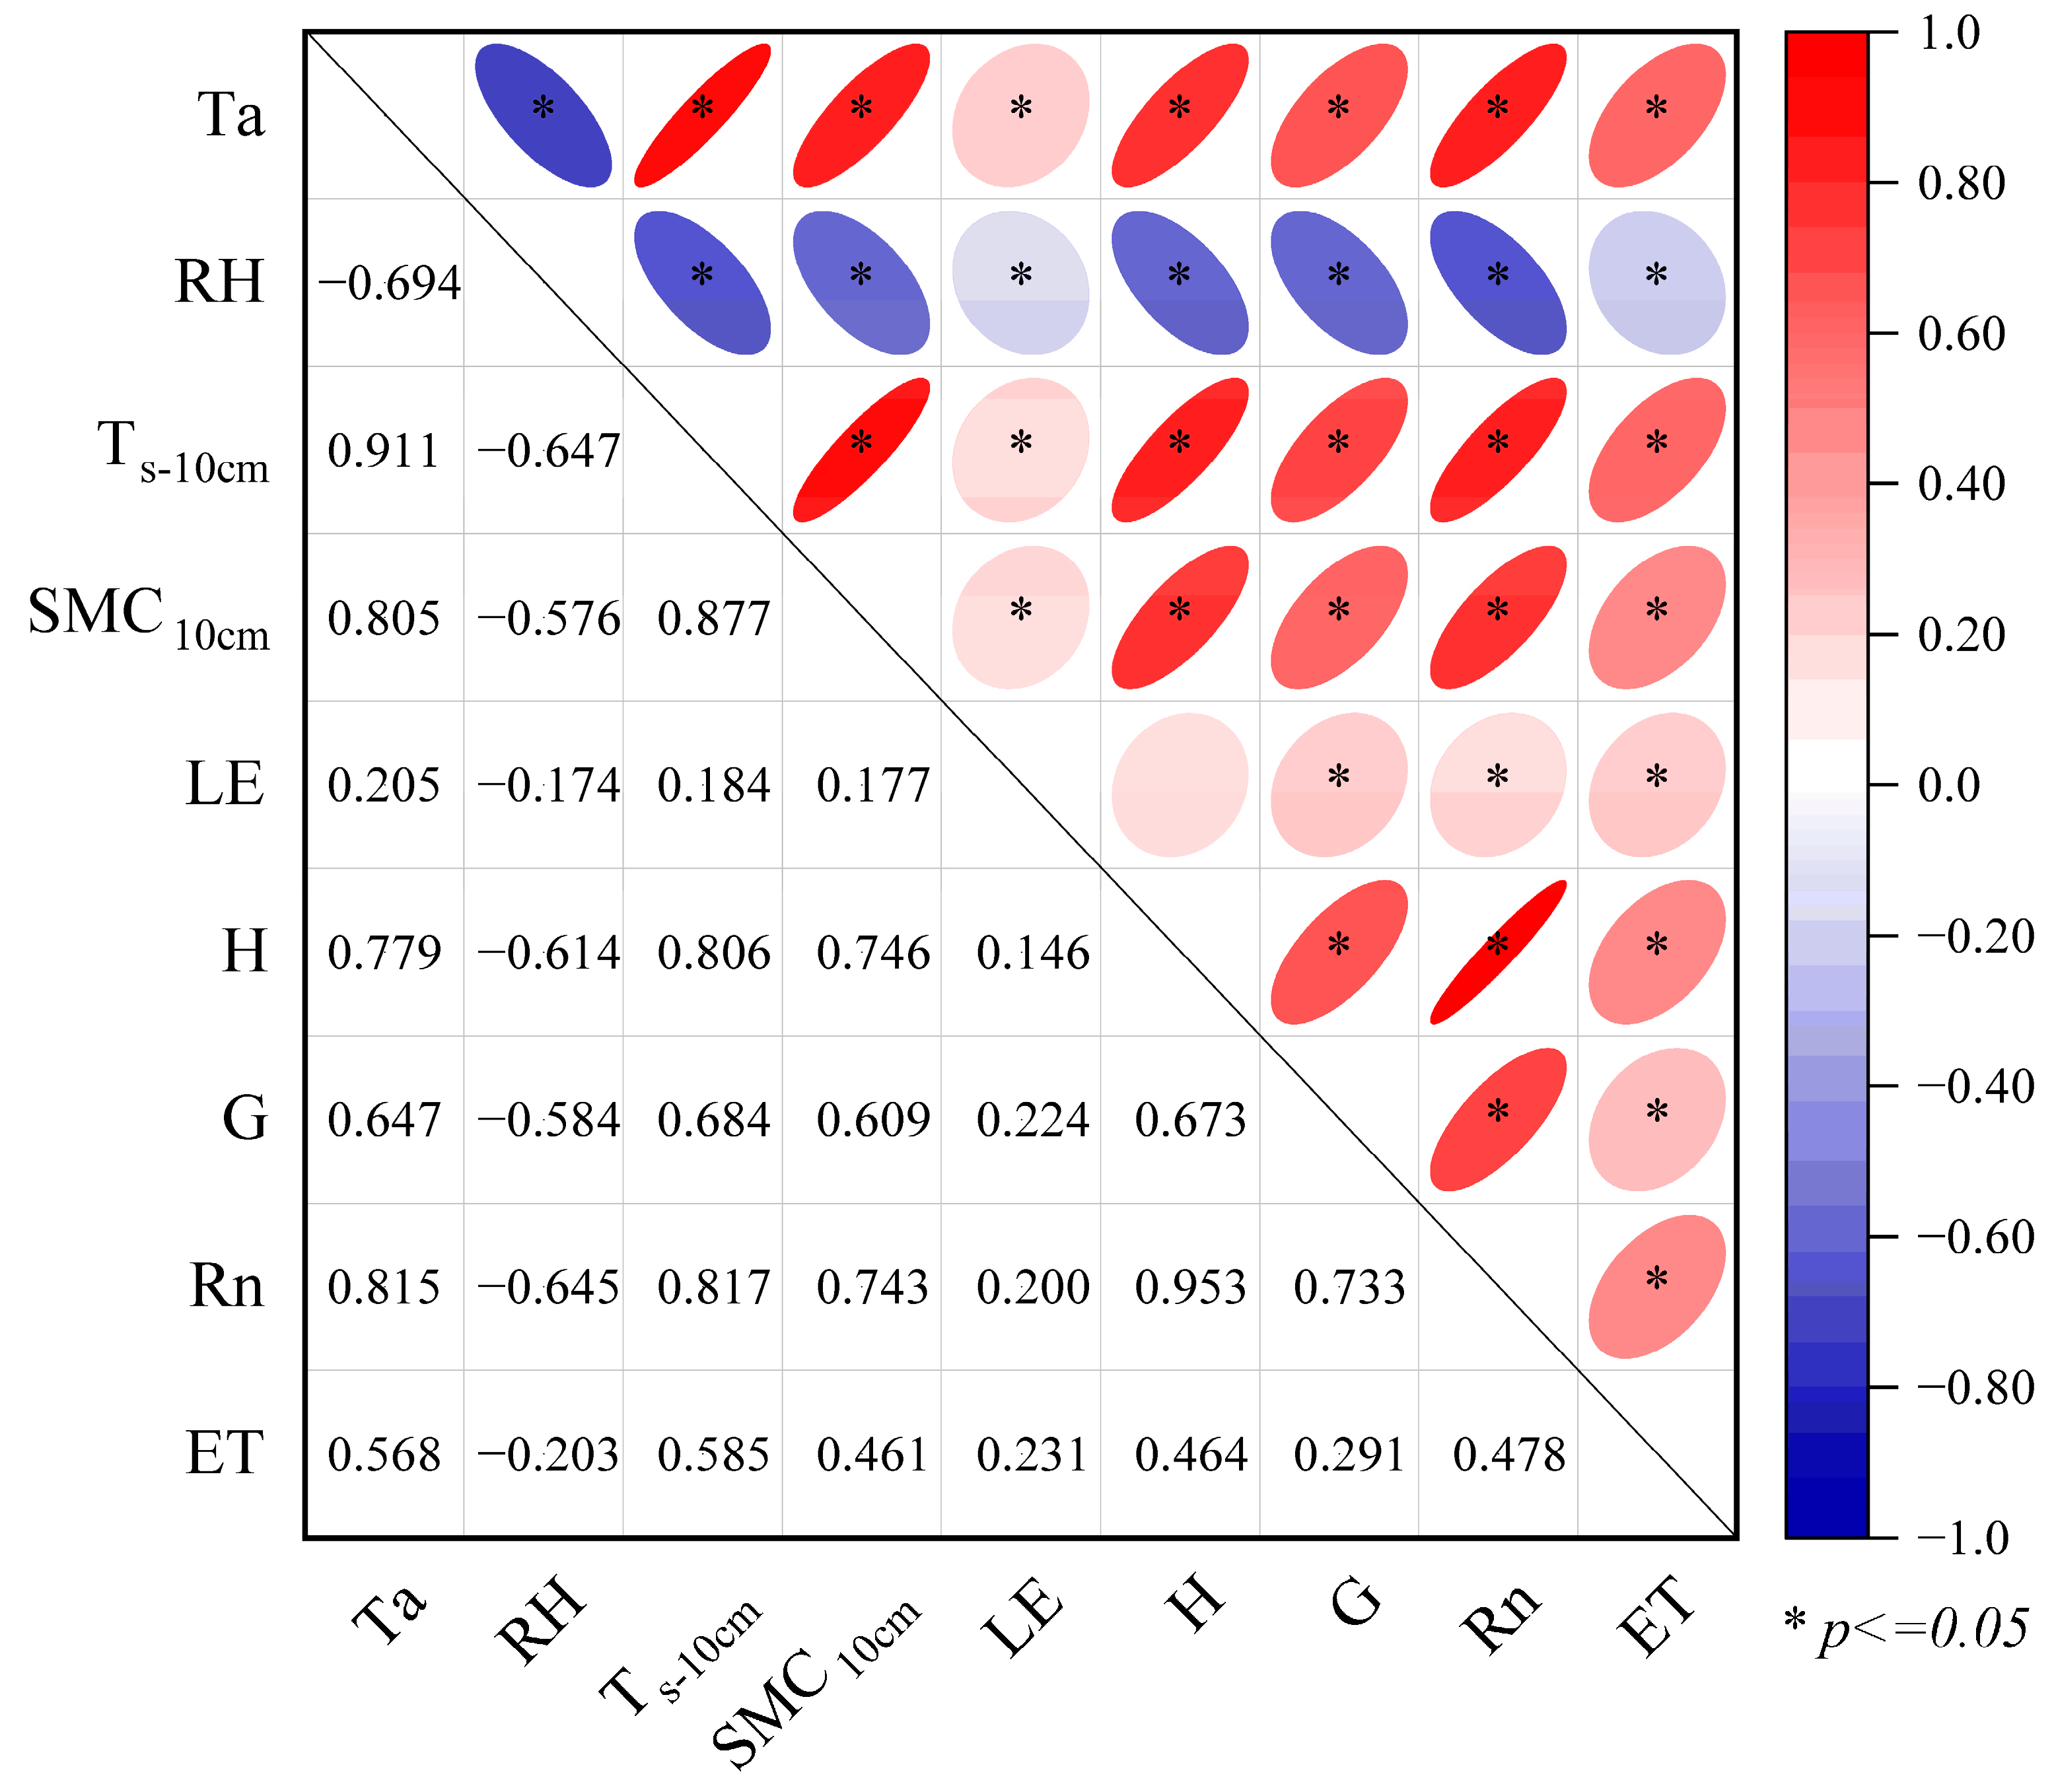
A correlation analysis was conducted to explore the relationship between ET, energy fluxes, and environmental factors. Air temperature (Ta), relative humidity (RH), soil temperature at a depth of 10 cm (Ts–10cm) and soil moisture content at a depth of 10 cm (SMC10cm) were the environmental factors that were correlated with the daily average flux data and ET from January to May 2022, as shown in Figure 10. A statistically significant correlation at the 0.05 level (p < 0.05) is indicated by an asterisk (*). The result shows that air temperature (Ta) was strongly positively correlated with soil temperature at 10 cm depth (Ts–10 cm) and Rn, but negatively correlated with RH. In addition, H exhibited strong positive correlations with Rn and G. SMC10cm was positively correlated with G and LE, and ET was moderately positive with Ta, demonstrating how these factors are interrelated and affect the ecosystem’s water dynamics and energy balance.

4. Discussion

4.1. Energy Closure

The closure of the energy balance is a crucial index for assessing the quality of data while monitoring the water, heat, and carbon fluxes using an EC system, but energy non-closure is a common phenomenon in EC observation [36]. Energy closure in Dengkou desert is influenced in unstable atmospheric conditions by the irregular turbulence, where the high convective eddies and the high winds lower the precision in the measurement of the fluxes. The vegetation cover (% < 10) decreases the roughness of the surface and the LE, interrupting the formation of turbulent flux. Instrument limitations, such as sensor response limitations and subsurface heterogeneity, further contribute to underassessing flow, particularly during times of high winds. Regarding data processing, various energy closure outcomes were obtained using various timescales and energy balance assessment techniques. Grassland, forest and deserts are all included in the range of slopes at FLUXNET sites of 0.53 to 0.99, with an average value of 0.79, intercept range from −32.9 to 36.9 W·m−2, and average value of 3.7 W·m−2 [35]. The EBR range of ChinaFLUX sites is between 0.58 and 1.00, with an average value of 0.83, and the EBR of FLUXNET sites is between 0.34 and 1.69, with an average value of 0.84 [43]. Subsequently, the degree of surface energy closure varied, according to the properties of the underlying surface. The desert and its underlying surface close between 63% and 96% of the time [30].
Energy closure from 2019 to 2022 reveals significant annual variability in ecosystem dynamics. Another study conducted in Xishuangbanna, Southwest China, also faced difficulties in achieving annual energy closure (65%) [6]. A higher EBR of 0.80 in 2021 indicates improved measurement efficiency or accuracy, but lower values in 2019 and 2020 show difficulties in reaching energy closure. These patterns highlight the necessity of ongoing data collection-method optimization and the significance of the time scale in energy balance investigations. The advective fluxes may be partially responsible for the incomplete energy closure (66–69%), and are often ignored in eddy covariance studies. Energy may be redistributed beyond the tower measurement zone in the heterogeneous desert ecosystem, due to horizontal heat advection from nearby soil or vegetation [44]. Unmeasured heat storage in the deep soil layers or air column may also result in energy non closure. The temperature in the desert ecosystem varies greatly during the day, and heat that is stored in shallow soil layers during the day may be released at night, altering energy closure [45].

4.2. Evapotranspiration and Net Ecosystem Production

The first step in comprehending ecohydrological dynamics, especially in dryland ecosystems with little water, is knowledge of water and energy exchanges across land surfaces. However, there is less knowledge about the desert ecotone, which is crucial in defending an oasis against the threat of desertification in dry parts of northwest China, in terms of patterns of ET and energy exchange [41]. Climate change and drought have reduced the amount of water in desert regions [46]. Over a two-year period of observation, ET greatly exceeded precipitation, suggesting that shallow groundwater is probably accessible to deep-rooted phreatophyte plants. This implies that groundwater plays a critical role in controlling the exchange of water with the atmosphere and affects the distribution of energy [41]. Although we employ standardized and well-established methods, uncertainties may exist in both ET and NEP calculations. Instrumental uncertainty from the eddy covariance system and meteorological sensors, including sensor calibration errors and minor sensor drift under varying environmental conditions, could introduce slight inaccuracies. Furthermore, gap-filling methods, specifically linear interpolation for short data gaps (<2 h) and the diurnal variation approach for longer gaps (>2 h), inherently assume regular daily cycles, potentially missing unusual variations or extreme events.
In Inner Mongolia, Dengkou County, observations show that in 2019, 2021, and the first five months of 2022, ET was also higher than precipitation. Local water resources and vegetation health may be impacted by this pattern. However, in 2020, precipitation exceeded ET, indicating a time of more moisture availability. The sensitivity of desert habitats to changes in climate is highlighted by the variability in precipitation and ET. In dry and semi-arid locations, where variations in precipitation patterns can have a substantial impact on water balance and land management approaches, these results are in line with more general trends.
Carbon flux is the amount of carbon that desert ecosystems absorb from or release into the atmosphere, but there is less knowledge about how this flux varies over time and how it depends on the type of soil cover and amount of rainfall [47]. Total carbon, and nutrient stocks are affected by the varied root structures of desert plants, which are influenced by water acquisition techniques [48]. NEP fluctuation in deserts is controlled by temperature–precipitation-vegetation interactions. Carbon uptake in 2021 (NEP = 0.295 g C m−2 s−1) was simultaneous with sufficient precipitation (136.4 mm), promoting photosynthesis and carbon deposition in soils and in shrubs such as Nitraria tantutorum. In contrast, carbon loss in 2019–2020 (NEP = −0.096 to −0.551 g C m−2 s−1) was because of water stress and high temperatures, which inhibited photosynthesis and promoted respiration. Abnormal carbon release in 2022 (−0.996 g C m−2 s−1) showed late rain and hotter temperatures (Ta max = 28.9 °C), which boosted soil carbon mineralization. Other hydrothermal-controlled events have been seen worldwide [47,49]. An ET greater than precipitation reflects the dominance of Rn in arid regions, where more than 60% precipitation returns to the atmosphere [50]. Additionally, desert plants maintain ET even in the presence of little precipitation by using morphological adaptations (such as succulence and deep roots) to access aquifers [45]. In the desert ecosystem, a large portion of precipitation is lost through ET, limiting soil moisture retention and ground-water recharge [51].

4.3. Influence of Environmental Factors on Energy Flux

Correlation analysis shows the Rn is the primary driver of H, showing the strongest positive correlation. Other variables, such as Ta and Ts–10cm, also showed strong correlations with H (0.779 and 0.684, respectively). Energy distribution is influenced by climatic (such as temperature, precipitation, radiation, and VPD) factors, according to many earlier studies [7,52,53,54]. The main factors influencing the energy distribution in the desert of Inner Mongolia, with its dry climate, little vegetation, and delicate ecological setting, are the water availability and the underlying surface conditions [37].

4.4. Influence of Environmental Factors on ET and NEP

Our findings indicate that air and soil temperatures (Ta and Ts–10cm) are primary drivers of ET in the Dengkou desert ecosystem, with ET increasing consistently as temperatures rise, particularly during summer. Strong positive correlations between Ta (r = 0.568, p < 0.05) and Ts–10cm (r = 0.585, p < 0.05) with ET aligned with global patterns where temperature governs the energy available for water vaporization in arid environments [55]. Precipitation emerged as the dominant factor influencing both ET and NEP, with sufficient rainfall (136.4 mm in 2021) simultaneously enhancing water loss and carbon sequestration. The shift in NEP from carbon sink conditions in 2021 (0.295 g C m−2 s−1) to substantial carbon source conditions in 2022 (−0.996 g C m−2 s−1) demonstrates how precipitation timing interacts with temperature extremes to determine carbon balance [20,49,56]. These findings highlight the delicate balance between water availability and carbon cycling in desert ecosystems, where minor environmental shifts can trigger substantial changes in hydrological and carbon processes, with significant implications for understanding desert ecosystem responses to climate change. This study demonstrates that carbon reversals operate through a threshold-based mechanism, rather than being linear responses to precipitation.

5. Conclusions

This research analyzed the Dengkou desert environment in Inner Mongolia, employing the eddy covariance system and 50 m meteorological station. The study found that the Dengkou desert ecosystem had significant seasonal fluctuations in energy fluxes, ET, and NEP. When ET surpassed precipitation, there were often water deficits. Additionally, according to the study, just one of the four years showed carbon sequestration, indicating that the Dengkou ecosystem is susceptible to harsh weather and little vegetation cover. This research area is characterized by low annual precipitation and uneven seasonal distribution. Results generally show that the soil serves as a heat sink, with significant heat transmission from atmosphere to soil during the growth season. LE was low because of underlying surface drought and sparse vegetation. The EBR values from 2019 to 2022 show energy balance variations, with 2020 showing the highest value of 0.80. In 2022, a significant R2 value of 0.91 between turbulent heat fluxes and available energy indicates greater consistency in energy dynamics, with energy closure reaching 69%.
Seasonal ET fluctuations in the Inner Mongolian Desert ecosystem show a complex interaction between vegetation growth and climatic change, with notable ET peaks during the growing season. NEP was negative in 2019 (−0.551 g C m−2 s−1) and 2020 (−0.096 g C m−2 s−1), indicating carbon loss. In 2021, NEP increased to 0.295 g C m−2 s−1, reflecting carbon sequestration, whereas 2022 saw a decline to −0.996 g C m−2 s−1, indicating a significant carbon release. This study explores the annual carbon reversals in the extreme arid desert.
The study demonstrates the successful application of the eddy covariance method in a challenging desert of Dengkou, where sparse vegetation, high wind speeds, and low humidity limit precise flow measurements. Although EC is widely used in various parts of the world, its implementation in arid environments such as the Dengkou Desert presents significant challenges and opportunities. Measurement errors, such as air and vegetation-canopy heat storage were not considered in this study. Therefore, it is necessary to enhance data continuity and integrity. Our research group is continuously working on this, and has a plan to expand the dataset with greater accuracy and consistency in the future, with additional parameters and analyses. Further long-term research is also needed on heat and water transport in Inner Mongolia’s Dengkou Desert’s unique ecosystem.

Author Contributions

Conceptualization, data curation, formal analysis, writing—original draft, writing—review and editing, M.Z.U.A.; conceptualization, investigation, supervision, funding acquisition, writing—review and editing, H.X.; visualization, validation, review and editing, S.M., F.H. and K.M.; writing—original draft preparation, review and editing, P.H. and M.A.H. All authors have read and agreed to the published version of the manuscript.

Funding

This study was funded by National Key R&D Program of China (2023YFF1304204): Desert Carbon Sequestration Mechanisms, National Natural Science Foundation of China (32371961), posting and leading the project of the National Forestry & Grassland Administration (202401-07), posting and leading the project of the Inner Mongolia Autonomous Region (2024JBGS0002) and the Intergovernmental International Cooperation Project in Science & Technology Innovation between China and the United States (2023YFE0121800).

Data Availability Statement

The original contributions presented in this study are included in the article. Further inquiries can be directed to the corresponding authors.

Acknowledgments

We appreciate the assistance provided by the Inner Mongolia Dengkou Desert Ecosystem National Observation Research Station, located in Dengkou, China. We want to express our gratitude to the employees at the Research Station in Dengkou, China.

Conflicts of Interest

The authors declare no conflicts of interest.

Appendix A

Table A1. Details of the specifications of the experimental instruments.
Observation SystemInstrument NameModelManufacturer and OriginObservation Elements
Vorticity ObservationClosed-Path H2O/CO2 analyzerEC155Campbell Scientific Inc., Logan, UT, USACarbon dioxide and water vapor concentration
3D sonic anemometerCSAT-3Campbell Scientific Inc., Logan, UT, USAThree-dimensional wind speed and sonic virtual temperature
Soil heat-flux plate4xHFP01Hukseflux, Delft, The NetherlandsSoil heat flux
Soil moisture and conductivity sensorEC5Decagon, San Francisco, CA, USASoil moisture content, conductivity
Averaging soil thermocouple ProbeTCAVAVALON, USASoil temperature
Gradient MeteorologicalFour-component radiometerCNR4 NR-LITEKipp & Zonen, Delft, The NetherlandsRadiation flux
Temperature sensorHMP45CVaisala Inc., Vantaa, FinlandAir temperature and relative humidity
Wind speed sensorW10Banner, USAWind speed and direction
Conventional MeteorologicalSoil temperature sensorCS616Campbell Scientific Inc., Logan, UT, USASoil temperature
Rain gaugeJD-05
Infrared temperature sensorSI-111-SSApogee, Logan, UT, USASurface temperature

References

  1. Brown, K.; Rosenberg, N.J. A resistance model to predict evapotranspiration and its application to a sugar beet field 1. Agron. J. 1973, 65, 341–347. [Google Scholar] [CrossRef]
  2. Yue, P.; Zhang, Q.; Zhao, W.; Wang, J.-S.; Wang, R.-Y.; Yao, Y.-B.; Wang, S.; Hao, X.-C.; Yang, F.-L.; Wang, R.-A. Effects of clouds and precipitation disturbance on the surface radiation budget and energy balance over loess plateau semi-arid grassland in China. Acta Phys. Sin. 2013, 62, 209201. [Google Scholar] [CrossRef]
  3. Leuning, R.; van Gorsel, E.; Massman, W.J.; Isaac, P.R. Reflections on the surface energy imbalance problem. Agric. For. Meteorol. 2012, 156, 65–74. [Google Scholar] [CrossRef]
  4. Meyers, T.P.; Hollinger, S.E. An assessment of storage terms in the surface energy balance of maize and soybean. Agric. For. Meteorol. 2004, 125, 105–115. [Google Scholar] [CrossRef]
  5. Anderson, R.G.; Wang, D. Energy budget closure observed in paired Eddy Covariance towers with increased and continuous daily turbulence. Agric. For. Meteorol. 2014, 184, 204–209. [Google Scholar] [CrossRef]
  6. Jin, Y.; Liu, Y.; Liu, J.; Zhang, X. Energy balance closure problem over a tropical seasonal rainforest in Xishuangbanna, Southwest China: Role of latent heat flux. Water 2022, 14, 395. [Google Scholar] [CrossRef]
  7. Matsumoto, K.; Ohta, T.; Nakai, T.; Kuwada, T.; Daikoku, K.i.; Iida, S.i.; Yabuki, H.; Kononov, A.V.; van der Molen, M.K.; Kodama, Y. Energy consumption and evapotranspiration at several boreal and temperate forests in the Far East. Agric. For. Meteorol. 2008, 148, 1978–1989. [Google Scholar] [CrossRef]
  8. Ganlin, Z.; Yaohui, L.; Xuying, S.; Tiejun, Z.; Cailing, Z. Characteristics of Surface Energy Fluxes over Different Types of Underlying Surfaces in North China. J. Arid. Meteorol. 2019, 37, 577. [Google Scholar]
  9. Yuan, W.; Tong, X.; Zhang, J.; Meng, P.; Li, J.; Zheng, N. Characteristics of energy balance of a mixed plantation in the Xiaolangdi area in the growing season. Acta Ecol. Sin. 2015, 35, 4492–4499. [Google Scholar] [CrossRef]
  10. Li, T.; Yan, C.; Wang, B.; Zhao, W.; Zhang, Y.; Qiu, G. Characteristics of energy balance in a mixed forest in Jiuzhaigou Valley. Acta Ecol. Sin. 2018, 38, 8098–8106. [Google Scholar]
  11. Yang, T.; Wang, X.; Zhao, C.; Chen, X.; Yu, Z.; Shao, Q.; Xu, C.Y.; Xia, J.; Wang, W. Changes of climate extremes in a typical arid zone: Observations and multimodel ensemble projections. J. Geophys. Res. Atmos. 2011, 116, D19. [Google Scholar] [CrossRef]
  12. Huang, J.; Yu, H.; Guan, X.; Wang, G.; Guo, R. Accelerated dryland expansion under climate change. Nat. Clim. Change 2016, 6, 166–171. [Google Scholar] [CrossRef]
  13. Abudukade, S.; Yang, F.; Liu, Y.; Mamtimin, A.; Gao, J.; Ma, M.; Wang, W.; Cui, Z.; Wang, Y.; Zhang, K. Effects of Artificial Green Land on Land–Atmosphere Interactions in the Taklamakan Desert. Land 2023, 12, 1541. [Google Scholar] [CrossRef]
  14. Cao, S.; Chen, L.; Shankman, D.; Wang, C.; Wang, X.; Zhang, H. Excessive reliance on afforestation in China’s arid and semi-arid regions: Lessons in ecological restoration. Earth-Sci. Rev. 2011, 104, 240–245. [Google Scholar] [CrossRef]
  15. Zheng, D.; Yin, Y. Eco-reconstruction in Northwest China. In Water and Sustainability in Arid Regions: Bridging the Gap Between Physical and Social Sciences; Springer: Berlin/Heidelberg, Germany, 2010; pp. 3–14. [Google Scholar]
  16. McCabe, M.F.; Wood, E.F. Scale influences on the remote estimation of evapotranspiration using multiple satellite sensors. Remote Sens. Environ. 2006, 105, 271–285. [Google Scholar] [CrossRef]
  17. Suyker, A.E.; Verma, S.B. Interannual water vapor and energy exchange in an irrigated maize-based agroecosystem. Agric. For. Meteorol. 2008, 148, 417–427. [Google Scholar] [CrossRef]
  18. Rind, D.; Rosenzweig, C.; Goldberg, R. Modelling the hydrological cycle in assessments of climate change. Nature 1992, 358, 119–122. [Google Scholar] [CrossRef]
  19. He, N.; Zhang, Y.; Dai, J.; Han, X.; Baoyin, T.; Yu, G. Land-use impact on soil carbon and nitrogen sequestration in typical steppe ecosystems, Inner Mongolia. J. Geogr. Sci. 2012, 22, 859–873. [Google Scholar] [CrossRef]
  20. Wang, C.; Zhao, W.; Zhang, Y. The change in net ecosystem productivity and its driving mechanism in a mountain ecosystem of arid regions, Northwest China. Remote Sens. 2022, 14, 4046. [Google Scholar] [CrossRef]
  21. Wang, Y.-R.; Buchmann, N.; Hessen, D.O.; Stordal, F.; Erisman, J.W.; Vollsnes, A.V.; Andersen, T.; Dolman, H. Disentangling effects of natural and anthropogenic drivers on forest net ecosystem production. Sci. Total Environ. 2022, 839, 156326. [Google Scholar] [CrossRef]
  22. Majozi, N.P.; Mannaerts, C.M.; Ramoelo, A.; Mathieu, R.; Nickless, A.; Verhoef, W. Analysing surface energy balance closure and partitioning over a semi-arid savanna FLUXNET site in Skukuza, Kruger National Park, South Africa. Hydrol. Earth Syst. Sci. 2017, 21, 3401–3415. [Google Scholar] [CrossRef]
  23. Friedlingstein, P.; Cox, P.; Betts, R.; Bopp, L.; von Bloh, W.; Brovkin, V.; Cadule, P.; Doney, S.; Eby, M.; Fung, I. Climate–carbon cycle feedback analysis: Results from the C4MIP model intercomparison. J. Clim. 2006, 19, 3337–3353. [Google Scholar] [CrossRef]
  24. Zhao, W.; Ji, X.; Liu, H. Progresses in evapotranspiration research and prospect in desert oasis evapotranspiration research. Arid. Zone Res. 2011, 28, 463–470. [Google Scholar]
  25. Göckede, M.; Rebmann, C.; Foken, T. A combination of quality assessment tools for eddy covariance measurements with footprint modelling for the characterisation of complex sites. Agric. For. Meteorol. 2004, 127, 175–188. [Google Scholar] [CrossRef]
  26. Yu, G.-R.; Wen, X.-F.; Sun, X.-M.; Tanner, B.D.; Lee, X.; Chen, J.-Y. Overview of ChinaFLUX and evaluation of its eddy covariance measurement. Agric. For. Meteorol. 2006, 137, 125–137. [Google Scholar] [CrossRef]
  27. Wenzhi, Z.; Guodong, C. A review of some problems in the study of eco-hydrological processes in arid areas. Sci. Bull. 2001, 46, 1. [Google Scholar]
  28. Ping, Y.; Qiang, Z.; Yang, Y.; Zhang, L.; Zhang, H.; Hao, X.; Sun, X. Seasonal and inter-annual variability of the Bowen smith ratio over a semi-arid grassland in the Chinese Loess Plateau. Agric. For. Meteorol. 2018, 252, 99–108. [Google Scholar] [CrossRef]
  29. Huang, T.; Liu, T.; Wang, G.; Duan, L.; Chen, X. Dynamic changes of water and heat fluxes and responses to environmental factors in cascade ecological zone. Res. Soil Water Conserv. 2019, 26, 122–127. [Google Scholar]
  30. Beyrich, F.; De Bruin, H.; Meijninger, W.; Schipper, J.; Lohse, H. Results from one-year continuous operation of a large aperture scintillometer over a heterogeneous land surface. Bound.-Lay. Meteorol. 2002, 105, 85–97. [Google Scholar] [CrossRef]
  31. Campos, S.; Mendes, K.R.; da Silva, L.L.; Mutti, P.R.; Medeiros, S.S.; Amorim, L.B.; dos Santos, C.A.; Perez-Marin, A.M.; Ramos, T.M.; Marques, T.V. Closure and partitioning of the energy balance in a preserved area of a Brazilian seasonally dry tropical forest. Agric. For. Meteorol. 2019, 271, 398–412. [Google Scholar] [CrossRef]
  32. Swinbank, W. The measurement of vertical transfer of heat and water vapor by eddies in the lower atmosphere. J. Atmos. Sci. 1951, 8, 135–145. [Google Scholar] [CrossRef]
  33. Falge, E.; Baldocchi, D.; Olson, R.; Anthoni, P.; Aubinet, M.; Bernhofer, C.; Burba, G.; Ceulemans, R.; Clement, R.; Dolman, H. Gap filling strategies for defensible annual sums of net ecosystem exchange. Agric. For. Meteorol. 2001, 107, 43–69. [Google Scholar] [CrossRef]
  34. McCaughey, J. Energy balance storage terms in a mature mixed forest at Petawawa, Ontario—A case study. Bound.-Lay. Meteorol. 1985, 31, 89–101. [Google Scholar] [CrossRef]
  35. Wilson, K.; Goldstein, A.; Falge, E.; Aubinet, M.; Baldocchi, D.; Berbigier, P.; Bernhofer, C.; Ceulemans, R.; Dolman, H.; Field, C. Energy balance closure at FLUXNET sites. Agric. For. Meteorol. 2002, 113, 223–243. [Google Scholar] [CrossRef]
  36. Mahrt, L. Flux sampling errors for aircraft and towers. J. Atmos. Oceanic Tech. 1998, 15, 416–429. [Google Scholar] [CrossRef]
  37. Yue, P.; Zhang, Q.; Zhang, L.; Li, H.; Yang, Y.; Zeng, J.; Wang, S. Long-term variations in energy partitioning and evapotranspiration in a semiarid grassland in the Loess Plateau of China. Agric. For. Meteorol. 2019, 278, 107671. [Google Scholar] [CrossRef]
  38. Kramer, K.; Leinonen, I.; Bartelink, H.; Berbigier, P.; Borghetti, M.; Bernhofer, C.; Cienciala, E.; Dolman, A.; Froer, O.; Gracia, C. Evaluation of six process-based forest growth models using eddy-covariance measurements of CO2 and H2O fluxes at six forest sites in Europe. Glob. Change Biol. 2002, 8, 213–230. [Google Scholar] [CrossRef]
  39. Kumar, A.; Bhatia, A.; Sehgal, V.K.; Tomer, R.; Jain, N.; Pathak, H. Net ecosystem exchange of carbon dioxide in rice-spring wheat system of northwestern Indo-Gangetic plains. Land 2021, 10, 701. [Google Scholar] [CrossRef]
  40. Zhang, X.; Fan, C.; Ma, Y.; Liu, Y.; Li, L.; Zhou, Q.; Xiong, Z. Two approaches for net ecosystem carbon budgets and soil carbon sequestration in a rice–wheat rotation system in China. Nutr. Cycl. Agroecosyst. 2014, 100, 301–313. [Google Scholar] [CrossRef]
  41. Ji, X.; Zhao, W.; Jin, B.; Liu, J.; Xu, F.; Zhou, H. Seasonal variations in energy exchange and evapotranspiration of an oasis-desert ecotone in an arid region. Hydrol. Process. 2021, 35, e14364. [Google Scholar] [CrossRef]
  42. Zhang, S.; Liu, T.; Hao, L.; Duan, L.; Tong, X.; Bao, Y.; Wang, Y.; Gong, Y.; Zhang, W. Seasonal variation and environmental regulation mechanisms of energy fluxes and energy allocation in dune and meadow ecosystems. CATENA 2025, 254, 108979. [Google Scholar] [CrossRef]
  43. Yuling, F. Energy balance closure at ChinaFLUX sites. Sci. China Earth Sci. 2005, 48, 2005. [Google Scholar]
  44. Zeydalinejad, N.; Javadi, A.A.; Webber, J.L. Global perspectives on groundwater infiltration to sewer networks: A threat to urban sustainability. Water Res. 2024, 262, 122098. [Google Scholar] [CrossRef]
  45. III, J.W.C.; Krausman, P.R.; Rosenstock, S.S.; Turner, J.C. Mechanisms of thermoregulation and water balance in desert ungulates. Wildl. Soc. Bull. 2006, 34, 570–581. [Google Scholar] [CrossRef]
  46. Montazar, A.; Putnam, D. Evapotranspiration and Yield Impact Tools for More Water-Use Efficient Alfalfa Production in Desert Environments. Agriculture 2023, 13, 2098. [Google Scholar] [CrossRef]
  47. Su, Y.; Wu, L.; Zhou, Z.; Liu, Y.; Zhang, Y. Carbon flux in deserts depends on soil cover type: A case study in the Gurbantunggute desert, North China. Soil Biol. Biochem. 2013, 58, 332–340. [Google Scholar] [CrossRef]
  48. Tariq, A.; Graciano, C.; Sardans, J.; Zeng, F.; Hughes, A.C.; Ahmed, Z.; Ullah, A.; Ali, S.; Gao, Y.; Peñuelas, J. Plant root mechanisms and their effects on carbon and nutrient accumulation in desert ecosystems under changes in land use and climate. New Phytol. 2024, 242, 916–934. [Google Scholar] [CrossRef]
  49. He, Z.; Yuan, W. Exploring the Influencing Factors of Net Ecosystem Productivity (NEP) Based on Random Forest and SHAP. Acad. J. Sci. Technol. 2024, 12, 242–248. [Google Scholar] [CrossRef]
  50. Jiao, P.; Hu, S.-J. Estimation of Evapotranspiration in the Desert–Oasis Transition Zone Using the Water Balance Method and Groundwater Level Fluctuation Method—Taking the Haloxylon ammodendron Forest at the Edge of the Gurbantunggut Desert as an Example. Water 2023, 15, 1210. [Google Scholar] [CrossRef]
  51. Lu, N.; Chen, S.; Wilske, B.; Sun, G.; Chen, J. Evapotranspiration and soil water relationships in a range of disturbed and undisturbed ecosystems in the semi-arid Inner Mongolia, China. J. Plant Ecol. 2011, 4, 49–60. [Google Scholar] [CrossRef]
  52. Launiainen, S.; Katul, G.G.; Kolari, P.; Lindroth, A.; Lohila, A.; Aurela, M.; Varlagin, A.; Grelle, A.; Vesala, T. Do the energy fluxes and surface conductance of boreal coniferous forests in Europe scale with leaf area? Glob. Change Biol. 2016, 22, 4096–4113. [Google Scholar] [CrossRef] [PubMed]
  53. Jia, X.; Zha, T.; Gong, J.; Wu, B.; Zhang, Y.; Qin, S.; Chen, G.; Feng, W.; Kellomäki, S.; Peltola, H. Energy partitioning over a semi-arid shrubland in northern China. Hydrol. Process. 2016, 30, 972–985. [Google Scholar] [CrossRef]
  54. Launiainen, S. Seasonal and inter-annual variability of energy exchange above a boreal Scots pine forest. Biogeosciences 2010, 7, 3921–3940. [Google Scholar] [CrossRef]
  55. Pan, X.; Yang, Z.; Yuan, J.; Guluzade, R.; Wang, Z.; Liu, S.; Zhou, Y.; Ma, W.; Yang, Y.; Liu, Y. A two-source non-parametric method for estimating terrestrial evapotranspiration: Validation at eddy covariance sites. J. Hydrol. 2024, 645, 132278. [Google Scholar] [CrossRef]
  56. Liu, Z.; Zhang, Y.; Fa, K.; Qin, S.; She, W. Rainfall pulses modify soil carbon emission in a semiarid desert. CATENA 2017, 155, 147–155. [Google Scholar] [CrossRef]
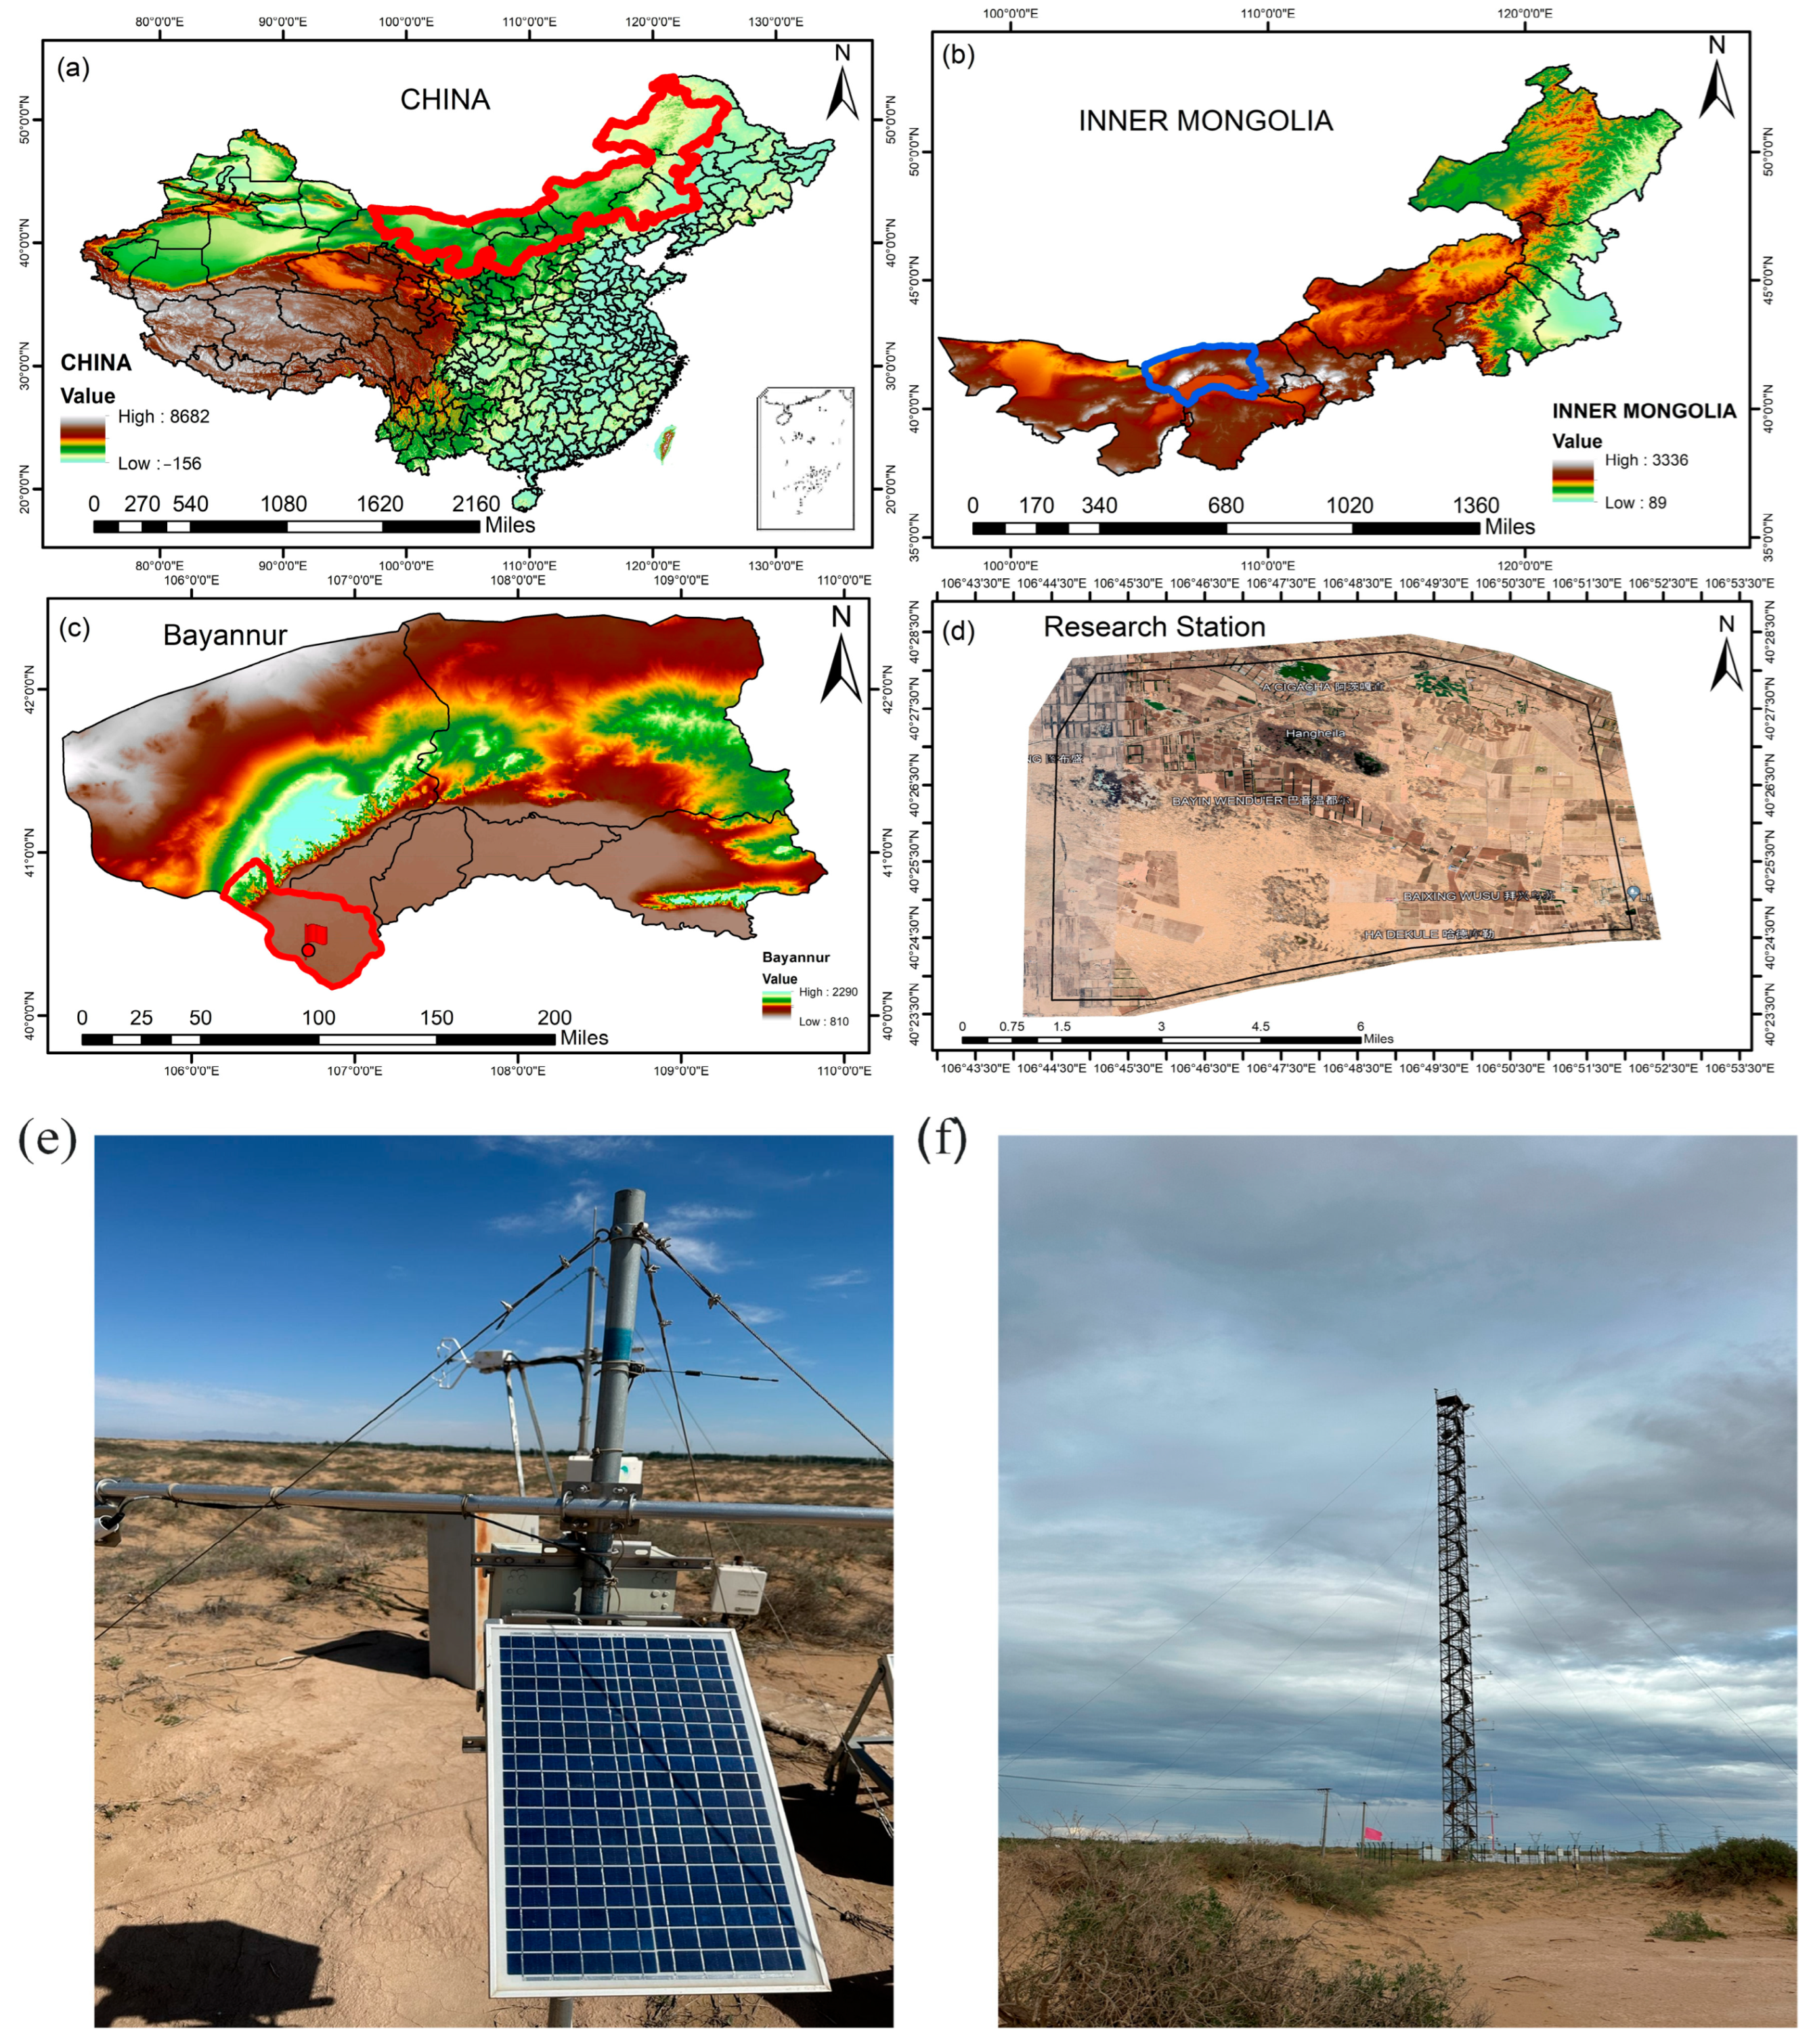
Figure 1. (a) Overall map of China (red marked area showing Inner Mongolia) (b) Inner Mongolia (blue marked area showing the Bayannur) (c) Bayannur (red flag on the map showing location of research station) (d) Research station (e) Eddy covariance system (f) Meteorological station.
Water 17 02307 g001
Figure 2. Flowchart diagram of adopted research methodology.
Water 17 02307 g002
Figure 3. Annual wind rose patterns in Dengkou (2019–2022). The wind roses show the distribution of wind speed and direction for each year, with direction represented in compass points (e.g., N, S, NW) and wind speed in meters per second (m/s).
Water 17 02307 g003
Figure 4. Yearly fluctuations in latent heat flux (LE), sensible heat flux (H), ground heat flux (G) and net radiation (Rn) over the four studied years.
Water 17 02307 g004
Figure 5. Seasonal variation in latent heat flux (LE), sensible heat flux (H), ground heat flux (G) and net radiation (Rn).
Water 17 02307 g005
Figure 6. Relationship between effective energy (Rn − G) and energy turbulent flux (H + LE) throughout various time periods using the daily average data set. (a) 2019: R2 = 0.78 (p = 0.001) (b) 2020: R2 = 0.70 (p = 0.002) (c) 2021: R2 = 0.81 (p = 0.001) (d) 2022: R2 = 0.91 (p = 0.001).
Water 17 02307 g006
Figure 7. (a) Interannual and (b) seasonal fluctuation in evapotranspiration.
Water 17 02307 g007
Figure 8. Monthly comparison between evapotranspiration ET and precipitation P and temperature T, for the observed period of time (2019–2022).
Water 17 02307 g008
Figure 9. Seasonal and interannual fluctuation of NEP (2019–2022).
Water 17 02307 g009
Figure 10. Correlation between environmental factors, energy fluxes, and evapotranspiration.
Water 17 02307 g010
Table 1. Annual descriptive statistics (mean, maximum, minimum, coefficient variance (CV) %) for temperature (°C), precipitation (mm), relative humidity (%) and wind speed (m/s) with ANOVA.
Environmental VariablesIndicators2019202020212022ANOVA (F-Statistic, p-Value)
Temperature (°C)Minimum−17.50−20.20−20.60−20.20F(3, N) = 0.32, p = 0.81
No significant differences
Maximum28.6028.9029.6028.90
Mean8.738.319.588.32
CV %152.51159.00142.74159.01
Precipitation (mm)Minimum0.100.300.200.50F(3, N) = 2.15, p = 0.09
Marginal trend (not significant)
Maximum8.2024.4042.4024.40
Mean0.250.390.210.37
CV %391.12602.861089.08601.72
Relative humidity (%)Minimum10.007.308.007.30F(3, N) = 3.02, p = 0.03
Significant differences
Maximum88.0094.5087.0094.50
Mean43.7144.8940.2944.94
CV %38.1845.8738.3145.86
Wind Speed (m/s)Minimum0.230.150.150.12F(3, N) = 2.51, p = 0.06
Marginal trend (not significant)
Maximum7.908.308.408.01
Mean3.123.03.483.05
CV %49.450.747.151.1
Disclaimer/Publisher’s Note: The statements, opinions and data contained in all publications are solely those of the individual author(s) and contributor(s) and not of MDPI and/or the editor(s). MDPI and/or the editor(s) disclaim responsibility for any injury to people or property resulting from any ideas, methods, instructions or products referred to in the content.