Abstract
Antibiotic resistance genes (ARGs) in suburban freshwater ecosystems pose a growing public health concern by potentially reducing the effectiveness of medical treatments. This study investigated how rainfall influences ARG dynamics in Lake Katherine, a 62-hectare suburban lake in Columbia, South Carolina, over one year. Surface water was collected under both dry and post-rain conditions from three locations, and ARGs were identified using metagenomic sequencing. Statistical models revealed that six of nine ARG classes with sufficient data showed significant responses to rainfall. Three classes, Bacitracin, Aminoglycoside, and Unclassified, were more abundant after rainfall, while Tetracycline, Multidrug, and Peptide resistance genes declined. Taxonomic analysis showed that members of the Pseudomonadota phylum, especially Betaproteobacteria, were prevalent among ARG-carrying microbes. These findings suggest that rainfall can alter the distribution of ARGs in suburban lakes, highlighting the importance of routine monitoring and water management strategies to limit the environmental spread of antibiotic resistance.
1. Introduction
Antibiotic resistance genes (ARGs) are genetic elements that confer resistance to antimicrobial agents and have become globally recognized as emerging environmental contaminants of public health concern [1]. Although ARGs occur naturally in soil and aquatic microbiomes, anthropogenic pressures, particularly the widespread use of antibiotics in clinical, agricultural, and veterinary settings, have accelerated their distribution and abundance across ecosystems [2,3]. Wastewater effluents, urban stormwater runoff, and agricultural discharges are primary conduits through which ARGs are introduced into freshwater systems [4,5]. These environments function as reservoirs of resistance genes and may promote their horizontal transfer to human pathogens, elevating the risk of treatment-resistant infections [1,6].
Studies have documented the presence of specific ARG classes in freshwater systems, including genes conferring resistance to sulfonamides, tetracyclines, β-lactams, aminoglycosides, and more [5,7]. These genes are frequently associated with mobile genetic elements such as plasmids and integrons, facilitating their spread across diverse microbial hosts [8]. In rivers and lakes located downstream of wastewater treatment plants or livestock operations, elevated concentrations of these resistance determinants have been repeatedly observed [4,5,9]. For example, Pruden et al. demonstrated that ARGs were significantly elevated downstream of urban and agricultural activity, specifically sulfonamide and tetracycline resistance genes [5]. Similarly, Di Cesare et al. found widespread co-detection of ARGs and integrons in wastewater treatment plants, underscoring the role of effluent discharge as a persistent point source [8].
Environmental factors, particularly rainfall and hydrological events, can greatly influence the mobilization and distribution of ARGs in freshwater systems. Rainfall introduces multiple contaminants through surface runoff, which can carry antibiotic residues, resistant bacteria, and fecal materials from agricultural land, impervious surfaces, and septic systems into nearby water bodies [10,11,12]. Storm events have been shown to increase both the concentration and diversity of ARGs in aquatic environments. For example, O’Malley et al. observed that stormwater runoff in urban environments exhibited seasonal and spatial shifts in the ARG profiles of microbes as well as their surrounding environments, with increased abundances during periods of high precipitation [10]. Similarly, Baral et al. used metagenomic sequencing to track ARGs in an urban stream during storm events and identified high abundance of multidrug and vancomycin resistance genes immediately following wet-weather conditions [13]. These findings suggest that rainfall can act as a vector, both resuspending sediment-associated ARGs and introducing new sources via runoff. In another study, Di Cesare et al. found that ARG abundance in a riverine microbial community increased significantly after rainfall, even in areas without direct point-source pollution [14].
Rainfall may also influence ARG fate by altering flow rates, sediment mixing, or dilution effects, leading to complex and sometimes site-specific patterns [11,12]. For example, storm-induced runoff can increase the concentration of resistance genes near inflow points while diluting them downstream. These differential effects highlight the need to examine ARG trends in freshwater systems at both temporal and spatial scales. Resistance genes may also persist long after rainfall events due to their association with biofilms, sediments, and mobile genetic elements, further complicating efforts to trace sources and assess risks [9].
The public health implications of ARG contamination in freshwater lakes are particularly relevant in suburban and residential areas, where water bodies are often used for recreation and are in close contact with domestic animals. Pets exposed to ARG-contaminated water have been shown to harbor resistant bacteria, including extended-spectrum β-lactamase-producing Escherichia coli, which can spread to human caretakers through close contact [15]. Such environments also provide ideal conditions for the accumulation of multidrug resistance determinants, increasing the likelihood of encountering bacterial strains capable of resisting multiple antibiotic classes [6,16].
Despite growing evidence linking precipitation to ARG mobilization in riverine and wastewater-influenced systems, there remains a critical gap in understanding how rainfall affects ARG patterns in small, suburban freshwater lakes. Riverine systems (lotic environments) are characterized by continuous flow and high mixing, which promote rapid dispersion of contaminants, including ARGs [17]. In contrast, lakes (lentic environments) typically experience slower water movement, reduced turbulence, and vertical stratification [18]. These hydrological features may facilitate localized ARG accumulation, sediment settling, or selective persistence following storm events. Suburban lakes are often embedded within urbanized landscapes and subject to diffuse pollution from lawns, septic systems, roadways, and pet activity, yet they remain underrepresented in environmental antimicrobial resistance research [10,19]. As climate change projections suggest increasing frequency and intensity of storm events, understanding how rainfall influences ARG dynamics in these contexts is vital.
This study addresses this research gap by evaluating the impact of rainfall on ARG abundance and composition in Lake Katherine, a suburban lake in Columbia, South Carolina. It was hypothesized that rainfall events enhance the abundance and diversity of ARGs in suburban lake water through runoff and hydrological change. This study investigates how short-term rainfall events influence the presence and distribution of ARGs over time, using metagenomic sequencing, taxonomic analysis, and statistical modeling. The findings contribute to a growing body of research on environmental resistomes and inform strategies for surveillance and mitigation in residential watersheds vulnerable to storm-driven microbial pollution.
2. Materials and Methods
2.1. Sampling Location and Site Selection
Lake Katherine is a suburban freshwater lake located east of Columbia, South Carolina, USA. It was selected for this study due to its recreational use and location within a residential neighborhood, both of which increase the likelihood of human–pathogen interactions and anthropogenic inputs [20]. To assess the spatial and temporal dynamics of ARGs, water sampling was conducted over the course of one year, from September 2019 to September 2020. This period captured seasonal variation, fluctuations in hydrology, and the effects of both dry weather and rainfall-influenced conditions.
Three sampling sites were selected to represent distinct hydrological characteristics and potential exposure to pollutants (Figure 1C). The inlet, designated as Site 1 (blue marker; 34.007569, −80.961264), is located at the point where a tributary flows into Lake Katherine, serving as the primary entry point of surface water and a likely conduit for upstream contaminants. The cove, Site 2 (orange marker; 34.005997, −80.958055), is a semi-enclosed, low-flow region within the lake body that does not receive direct tributary input but may promote the accumulation of particulate matter and microbial communities. The outlet, Site 3 (purple marker; 33.997428, −80.965949), is situated where water exits the lake and reflects the cumulative effects of upstream contributions, in-lake processes, and residential runoff [21].
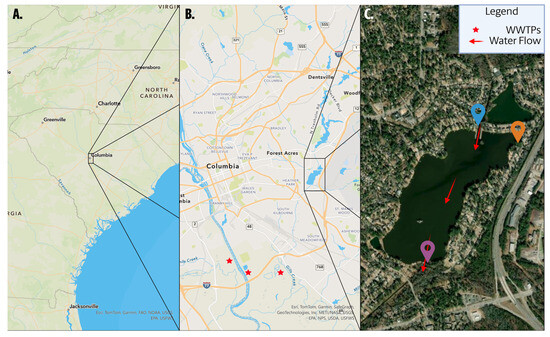
Figure 1.
Three-panel geographic overview of Lake Katherine sampling sites and hydrological context. (A) Regional map showing the location of Columbia, South Carolina, USA. (B) City-scale map of the Columbia metropolitan area, highlighting the Forest Acres neighborhood where Lake Katherine is situated. Red stars mark the locations of nearby wastewater treatment plants (WWTPs), which are downstream of Lake Katherine. (C) High-resolution satellite image of Lake Katherine with three surface water sampling sites marked. Site 1 (blue, 34.007569, −80.961264) represents the inlet, where a tributary enters the lake. Site 2 (orange, 34.005997, −80.958055) is located in a low-circulation cove within the lake. Site 3 (purple, 33.997428, −80.965949) is the outlet, where water exits the system. Red arrows indicate the general direction of surface water flow through the lake. Figure created using ArcGIS Pro v3.1.3 by Esri.
At each sampling site, triplicate surface water samples were collected using sterile 2 L polypropylene bottles. Immediately following collection, the samples were stored on ice and transported to the laboratory for processing and nucleic acid extraction.
To assess the effects of precipitation on ARG dynamics, sampling events were classified as wet-weather if they occurred within 48 h following a two-day cumulative rainfall total of ≥1 cm. Events with rainfall totals below this threshold were classified as dry-weather. This cutoff was selected to differentiate minimal precipitation from events likely to generate surface runoff and mobilize contaminants into the lake. Daily rainfall data were obtained from the Semmes Lake weather station, located approximately 1.35 km from Lake Katherine [22]. The timing of rainfall relative to sampling dates is detailed in Supplementary Table S1, and a visual timeline is provided in Supplementary Figure S1.
The lake is embedded within an urban watershed that likely contains both point and non-point sources of ARGs. The elevated ARG levels observed during dry-weather conditions suggest the presence of persistent local contamination sources. In contrast, rain-driven inputs may contribute large numbers of allochthonous bacteria and ARGs via surface runoff or episodic infrastructure discharge.
2.2. Sample Processing and DNA Extraction
Water samples were processed within 8 h to minimize degradation [23]. Samples and sterile water controls were homogenized and 1 L from each sample was filtered using a 0.22 µm Corning polyether sulfone (PES) vacuum filter (Corning Inc., Corning, NY, USA) [24]. The filter was removed and placed into a 50 mL conical tube. An additional 20 mL of unfiltered water from the respective sample was added to the tube and vortexed to resuspend the captured microbial mass. The resuspended cells were then centrifuged at 6000× g and the resultant cell pellet was used for nucleic acid extraction. DNA extraction was performed using the DNeasy PowerSoil Kit (QIAGEN, Hilden, Germany), following the manufacturer’s protocol [25]. Final DNA was eluted in 50 µL of RNase-free water and DNA concentration was measured using a Qubit 2.0 fluorometer (Life Technologies, Carlsbad, CA, USA) [26]. DNA integrity and purity were assessed using an Agilent 2100 Bioanalyzer (Agilent Technologies, Santa Clara, CA, USA) [27]. DNA yields ranged from approximately 35 to 145 ng/µL [Supplementary Table S2] and were within expected ranges for environmental samples.
2.3. Library Preparation and Sequencing
DNA was enzymatically sheared to approximately 300 bp, and Illumina sequencing libraries were prepared and barcoded using the New England Biolabs Ultra II FS DNA Library Prep Kit (NEB, Ipswich, MA, USA) and the New England Biolabs NEBNext Multiplex Oligos for Illumina following manufacturer protocols (NEB, Ipswich, MA, USA) [28]. Individually barcoded libraries (96 samples) were combined (1:1 based on Qubit concentrations) in EB buffer to a concentration of 15 nM in 20 µL [29]. Combined libraries were analyzed on a Bioanalyzer (Agilent Technologies, Santa Clara, CA, USA) to estimate the final library fragment size and concentration [29]. Sequencing was performed on the Illumina NovaSeq 6000 platform (Illumina, San Diego, CA, USA), using S4 flow cells with 2 × 150 bp paired-end sequencing [29]. Each analyzed sample yielded between approximately 8.7 million and 370 million total sequencing reads (paired and unpaired combined), with a mean of ~76.5 million reads per sample [Supplementary Table S3]. This sequencing depth was sufficient to support robust metagenomic assembly and antibiotic resistance gene profiling. The raw Illumina sequencing reads for each sample are available at the NCBI GenBank under the BioProject accession # PRJNA1282196.
2.4. Bioinformatic Analysis
Following each NovaSeq run, raw sequencing reads were quality filtered using FastP (version 0.20.0) with the parameters -Q -L -g --poly_g_min_len 5 and --adapter_fasta to remove sequencing adapters and trim poly-G tails [30]. Error correction of high-quality reads was then performed using SPAdes (version 3.12) with the --only-error-correction -m 800 settings [31]. Corrected reads were assembled into metagenomic contigs using MEGAHIT (version 1.2.7) with --presets meta-sensitive and a minimum contig length of 500 bp [32]. Open reading frames (ORFs) were predicted from assembled contigs using Prodigal (version 2.6.3) in meta mode, which is optimized for gene calling in metagenomic datasets [33]. The resulting amino acid sequences were aligned to the DeepARG database using DIAMOND (version 0.9.24) in predictive mode (--model LS --type prot -I -o -d), which applies deep learning models to identify both known and putative ARGs from protein sequences [34].
To quantify the abundance of each predicted ARG, cleaned sequencing reads were mapped back to the Prodigal-predicted ORFs derived from the assembled contigs using Bowtie2 (version 2.3.2), and alignments were saved as BAM files [35]. Coverage and read depth across each ORF were calculated using samtools bedcov (version 1.12) and bedtools coverage (version 2.27.1), respectively [36,37]. Both tools were run with default settings. The resulting coverage and count data were merged using a custom Python script that paired ORF-level depth with read counts. These data were further merged with DeepARG output files using Python to generate a unified file containing ARG identity, gene coverage, and read count data per sample. Total sequencing depth per sample was calculated using a Python script, which counted the number of reads across all paired and unpaired FASTQ files. These values were then used to calculate a normalized abundance metric. A detailed overview of the bioinformatics workflow, including software tools and data flow between steps, is provided in Supplementary Figure S2.
Statistical tests were performed using Python (Python version 3.11.11, Python Software Foundation, Wilmington, DE, USA) for total ARG and gene-class level analysis. ARG abundance was quantified using RPKM, defined as the number of reads mapped to a gene per kilobase of transcript per million mapped reads, and shown in the following equation:
This metric provides a normalized measure of gene abundance, enabling comparative analysis across different genes and samples [38]. By normalizing for both gene length and sequencing depth, RPKM allows for direct comparison of ARG abundance across samples, making it a reliable metric for assessing the influence of rainfall on ARG dynamics [39].
Taxonomic classification of contigs was performed using Kaiju (version 1.9.2), with contigs aligned to the NCBI non-redundant protein database using default greedy mode and the parameters -t, -f, -i, -v, and -z 40 to specify the taxonomy nodes file, index database, input file, verbose mode, and multithreading [40]. Taxonomic assignments were mapped to the ORFs by trimming contig suffixes and merging based on identifiers between Prodigal, DeepARG, and Kaiju outputs. This allowed each ARG to be associated with both a predicted resistance class and a corresponding microbial taxonomic lineage.
Putative plasmid-origin contigs were identified using PlasClass (version 0.1.1) [41]. Contigs with a plasmid probability score ≥ 0.8 were retained as plasmid-associated. ARGs predicted by DeepARG were cross-referenced with plasmid predictions to identify resistance genes potentially carried on plasmids.
2.5. Statistical Analysis
2.5.1. Two-Day Cumulative Rainfall Window Selection
For analyses involving cumulative rainfall, a two-day cumulative rainfall window (including the sampling day and one day prior) was selected based on preliminary correlation analyses evaluating windows ranging from 1 to 7 days. This window was chosen for its superior statistical performance and ecological relevance. Detailed results of this preliminary analysis and the rationale for selecting the two-day rainfall window are presented in the Results section (Section 3.1).
2.5.2. Sites-Combined Analysis
Using Python, a polynomial regression model (Equation (2)) was used to investigate the relationship between rainfall and ARG abundance. This model was chosen to account for the hypothesized non-linear relationship, where ARG abundance might initially increase with rainfall but then plateau or decline at higher rainfall levels due to dilution effects.
The analysis focused on total ARG abundance, RPKM, across three sampling sites in Lake Katherine. The predictor variable was cumulative rainfall over the two days leading up to each sampling event, measured in centimeters. A second-order polynomial model was applied to capture potential curvature in the relationship.
Equation (2) is a polynomial regression model for total ARG abundance, which is as follows:
In Equation (2), β0 represents the intercept, β1 captures the linear effect of rainfall, β2 represents the quadratic effect of rainfall, and ε accounts for unexplained variability. To guard against multicollinearity, we computed the Pearson correlation between the standardized rainfall term and its square (r = −0.395, corresponding to VIF ≈ 1.18), indicating minimal collinearity.
Separate models were fitted for all sites combined and for each of the three sampling sites (Site 1, Site 2, and Site 3), allowing for site-specific differences in rainfall effects. To account for replicates and streamline analysis, total ARG abundance values were averaged by location and sampling date. To assess the significance of the coefficients, a bootstrap resampling approach with 1000 iterations was employed, generating 95% confidence intervals (CIs) for the intercept, linear, and quadratic terms.
2.5.3. Gene-Class Level Analysis
To analyze the relationship between rainfall and ARG abundance at the gene-class level, a Zero-Inflated Poisson (ZIP) model was employed. The dataset consisted of ARG abundance values (in RPKM) across multiple sampling sites and dates. The ZIP model was specifically chosen due to the high proportion of zero observations in gene-class-level ARG data. To account for variability due to replicates, samples from the same site and date were aggregated by averaging values for each gene class. This approach reduced within-site noise while preserving the temporal and spatial resolution of the dataset. ZIP models were fitted separately for each ARG class at each sampling site, with rainfall, measured as the two-day cumulative precipitation, included as the primary predictor. Overall, the model formula can be displayed as follows:
In Equation (3), μ represents the expected ARG abundance measured in RPKM, the intercept β0 represents the expected log(RPKM) when rainfall is zero, and the slope coefficient β1 quantifies the change in the log of the expected RPKM for each unit increase in the two-day cumulative rainfall. This approach accounts for the potential non-linear effects and excess zeros often observed in environmental datasets.
To assess the relationship between rainfall and ARG abundance at the gene-class level, gene classes were first filtered to ensure sufficient representation. Specifically, only gene classes with at least five non-zero observations, and where non-zero observations constituted at least 10% of the total measurements, were retained. This filtering step minimized the inclusion of sparse data, thereby improving the reliability of subsequent statistical analyses [42,43]. Parameter estimates, confidence intervals, and p-values for each gene class and site were exported for further processing. Since the model coefficients are in log units, the intercepts and slopes can be exponentiated to interpret values on the original RPKM scale. For slopes, the percentage change in expected ARG abundance per unit increase in rainfall was calculated as follows:
This equation allows us to view the slope on a percent change scale as opposed to a log-linear scale, facilitating a clearer understanding of rainfall as a potential driver of ARG abundance in Lake Katherine, while accounting for site-level and replicate-level variability. Residual diagnostics were also performed on the ZIP models, deviance response residuals vs. fitted-value plots and Q-Q plots, to check model fit and distributional assumptions [Supplementary ZIP Residual Plots].
2.6. Taxonomic Analysis
To investigate the taxonomic associations with ARG classes, a custom Python workflow was developed to aggregate and visualize taxonomic composition across sampling events at Lake Katherine. Taxonomic assignment files were grouped by sampling date, and each file was parsed to extract key metadata including sampling date, predicted ARG class, taxonomic class, and phylum. For each ARG class, counts of associated taxonomic classes were aggregated across all samples. A contingency table of raw counts was generated with ARG classes as rows and taxonomic classes as columns. To account for differing total counts across ARG classes, the table was normalized to express values as percentages, producing a 100% stacked profile of taxonomic contributions to each ARG class. This allowed for comparative visualization of the relative microbial community composition across ARG classes. Taxonomic diversity was examined by calculating the Shannon diversity index for each ARG class based on its normalized taxonomic profile. Using Python, a heatmap was generated to visualize the abundance of taxonomic classes associated with each ARG class, using a non-linear color scale to preserve sensitivity across both low and high abundance taxa. ARG classes were hierarchically clustered using average linkage and Euclidean distance, and their order was optimized to group similar community profiles, before being plotted on the upper X axis. Adjacent to the heatmap, a phylum-level annotation stripe was included, with taxonomic classes grouped by phylum to highlight broad lineage-level patterns. For clarity, all “Candidatus” taxonomic names were abbreviated (e.g., Candidatus Omnitrophia to C. Omnitrophia). This analysis examines how distinct microbial taxa contribute to the distribution of ARGs in the lake system.
Principal Component Analysis (PCA) followed by k-means clustering was used to evaluate clustering patterns in taxonomic composition across ARG classes. Taxonomic data were aggregated from Excel files containing taxonomic counts at the class level, grouped by ARG class and taxonomic class, and normalized to generate percent compositions. PCA was conducted using the scikit-learn library in Python on the resulting matrix of relative abundances, and the first two principal components were retained. To determine the optimal number of clusters for k-means, the elbow method was applied by calculating within-cluster sum of squares (WCSS) for values of k ranging from 1 to 10. The optimal k was identified using the KneeLocator package. K-means clustering was then performed on the PCA-transformed data using the selected k value. PCA scatterplots were generated with cluster annotations and ARG class labels using matplotlib, and text labels were adjusted using the adjustText library to minimize overlap.
Lastly, taxonomic assignments were linked to sample rainfall data and classified as Dry (<1 cm two-day rainfall) or Wet (≥1 cm). For each sample, counts of ARG-bearing contigs were aggregated by taxonomic class, then converted to relative abundances:
Mean relative abundances under Dry and Wet conditions were computed and used to generate side-by-side bar charts of the top fifteen taxa. This approach controlled for unequal sample numbers in each category and highlights which bacterial lineages harbor ARGs during baseflow versus runoff-driven periods.
2.7. Plasmid Classification and ARG Association
Contigs identified as potentially plasmid-origin using PlasClass were cross-referenced with ARG predictions obtained from DeepARG. To address biases due to varying contig lengths or fragmented sequences, ARG classifications were summarized at the sample level using a binary presence/absence metric for each ARG class (1 = presence of at least one plasmid-predicted contig containing the ARG class; 0 = absence). Detection frequencies were calculated for each ARG class across all 82 samples by determining the proportion of samples in which each ARG class was present on plasmid-predicted contigs.
An identical workflow was applied for taxonomic analysis. Taxonomic assignments from Kaiju were matched to plasmid-predicted contigs. In cases of multiple assignments per contig, the most frequently occurring taxonomic class was selected. Each sample was then scored similarly, using a binary presence/absence approach for each identified taxonomic class associated with plasmids at the sample level.
Finally, Fisher’s exact tests with Benjamini–Hochberg correction were performed to identify ARG and taxonomic classes significantly enriched or depleted on plasmid-associated contigs (adjusted p < 0.05). This presence/absence approach at the sample level provided an unbiased comparison across samples, effectively minimizing potential biases from contig fragmentation or variable assembly quality.
3. Results
3.1. Two-Day Cumulative Rainfall Affects Trends in ARG Abundance
To assess the relationship between rainfall and the abundance of ARGs in Lake Katherine, the total ARG abundance was calculated for each sampling date by summing RPKM values across all identified ARG classes within each sample. The summed values were then averaged across replicates collected on the same date to provide a single metric of total ARG abundance per sampling event. Meteorological data were then integrated to explore how recent rainfall patterns may have influenced ARG dynamics. Daily precipitation values were aggregated into rolling cumulative rainfall windows ranging from one to seven days, with each window including the day of sample collection. The strength of association between cumulative rainfall and ARG abundance was quantified by calculating Spearman correlation coefficients for each rainfall window against total ARG abundance on the corresponding date and coefficients which are visualized in Figure 2.
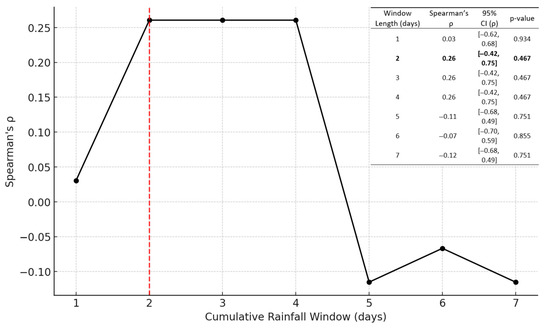
Figure 2.
Spearman’s rank-correlation coefficient (ρ) between total ARG abundance and cumulative rainfall windows of 1–7 days with table. Black line with markers shows ρ for each window length; the red dashed vertical line at 2 days highlights the window with the strongest positive correlation (ρ = 0.261). In the top right of the figure is a table containing the p-values and 95% confidence intervals for each window.
The two-day, three-day, and four-day cumulative rainfall windows all yielded an identical maximum Spearman correlation coefficient of approximately ρ = 0.26, suggesting that ARG abundance is most strongly influenced by rainfall occurring within a short window around the sampling date. Among these, the two-day window was chosen as the metric for all subsequent rain-correlation analyses, meaning the cumulative rainfall from the day of as well as the day before sampling. The choice of the two-day window was guided by both its statistical performance and its ecological interpretability. As the shortest window yielding the strongest correlation, it represents the most parsimonious model and avoids the inclusion of less relevant older rainfall events that might dilute meaningful signals. In such environments, impervious surfaces and stormwater infrastructure enable swift transport of contaminants, including microbial genetic material, into surface waters [44]. By limiting the accumulation period to the two days surrounding the sample collection, the metric reflects the most immediate environmental conditions that are likely to influence ARG mobilization and detection. This approach balanced explanatory strength with biological relevance and ensured that the rainfall metric used throughout the study closely mirrors real-world hydrometeorological processes that govern ARG transport and persistence.
3.2. Total ARG Abundance Shows Weak and Variable Association with Two-Day Rainfall
Regression analyses revealed a weak relationship between two-day cumulative rainfall and total antibiotic resistance gene (ARG) abundance in Lake Katherine (Figure 3). When all sampling sites were analyzed together, the linear regression model showed a negligible R2 value of 0.0007, with a rainfall coefficient of +1.216257 (p = 0.82), indicating almost no explanatory power or statistical significance. The quadratic model did not meaningfully improve the fit, producing an R2 of 0.0035 with a negative linear term (−8.79; p = 0.69) and a small positive quadratic coefficient (1.31; p = 0.64). These results suggest that while the overall trend may visually suggest a threshold effect, an initial decrease in ARG abundance followed by an increase at higher rainfall levels, this pattern is not statistically supported. These findings imply that rainfall alone is insufficient to explain total ARG dynamics in Lake Katherine. While modest rainfall could introduce ARGs through surface runoff, heavier precipitation may lead to dilution or rapid flushing of genes downstream. However, the per-site analysis yielded low R2 values and non-significant coefficients, indicating that the overall relationship between rainfall and total ARG abundance was weak. To account for spatial and class-level variability, subsequent site-specific and gene-class-level analysis were performed, which revealed significant rainfall associations at certain locations and for specific ARG classes. This demonstrates that the non-significant effect on total ARG abundance in response to rainfall stems from the heterogeneous responses of the individual ARG classes. Possible underlying factors include microbial community shifts, urban stormwater inputs, nutrient loading, sediment resuspension, and untreated wastewater contributions [45].
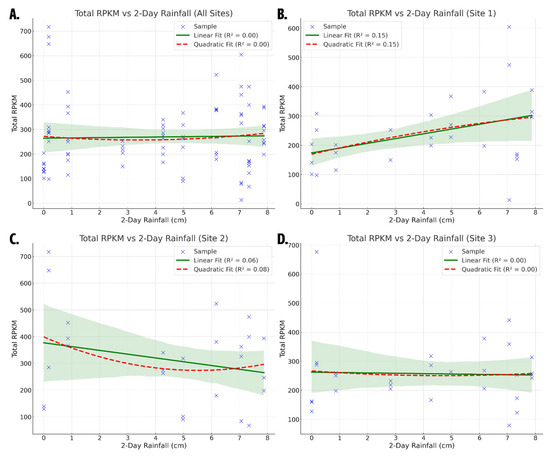
Figure 3.
Scatter plots of total ARG abundance (Total RPKM) versus two-day rainfall: (A) Regression and scatter data for all sites combined; (B) Regression and scatter data for Site 1; (C) Regression and scatter data for Site 2; (D) Regression and scatter data for Site 3. Blue points represent individual samples. Green lines indicate linear regression fits, and red dashed lines show quadratic fits. 95% confidence intervals for linear regression line represented by green shaded area. R2 values are displayed for each model. Only the linear model for Site 1 showed a statistically significant relationship.
Site-specific analyses reinforce the variability in rainfall-ARG relationships across the lake. At Site 1, located at the inlet, the linear model performed best with an R2 of 0.153 and a statistically significant rainfall coefficient of +16.26 (p = 0.039). This suggests a moderate increase in ARG abundance with rainfall at this location, potentially due to upstream transport from creeks or storm drains. The quadratic model for Site 1 slightly improved the explanatory power (R2 = 0.155) but produced non-significant coefficients, including a quadratic term of −0.81 (p = 0.84), suggesting limited evidence for a threshold or saturation effect. At Site 2, situated in a low-flow cove, the linear model revealed a negative rainfall coefficient of −14.17 (p = 0.21), with a low R2 of 0.063. The quadratic model for Site 2 showed an R2 value of 0.0747, with a linear coefficient of −45.44 (p = 0.44) and a quadratic coefficient of 4.12 (p = 0.83), indicating a poor fit and non-significant terms. At Site 3, the linear model yielded an R2 of 0.0011 with a rainfall coefficient of −1.25 (p = 0.87), while the quadratic model slightly improved the R2 to 0.0024 but still showed no statistically significant relationship (linear coefficient −6.88, p = 0.83; quadratic coefficient +0.73, p = 0.86). Collectively, these site-specific models show that only Site 1 exhibited a meaningful correlation between rainfall and ARG abundance.
Taken together, these results highlight both spatial and statistical variability in the influence of short-term rainfall on ARG abundance. While visual patterns may suggest non-linear dynamics, statistical modeling showed that two-day rainfall explained little of the observed variation in total ARG levels. This demonstrates the importance of incorporating additional environmental data in future models, including factors such as antecedent dry periods, hydrodynamic mixing, nutrient concentrations, microbial source tracking, and land use patterns. Site-specific analyses may be particularly valuable in urban freshwater systems like Lake Katherine, where hydrology and pollutant sources are highly heterogeneous [46]. Given the weak and spatially heterogeneous response at the aggregate level, class-level and site-specific analyses were performed to reveal significant rainfall associations for certain ARG classes and locations, potentially highlighting the value of finer-scale investigation.
3.3. Rainfall Events Differentially Influence Individual ARG Classes
Analysis of total ARG abundance yielded weak and non-significant relationships; however, individual ARG classes exhibited heterogeneous responses to rainfall. Across the three sampling sites, fourteen ARG classes were detected, of which nine met data quality criteria for statistical analysis. Classes excluded due to insufficient data included Beta-lactams, Fluoroquinolones, Fosfomycins, Glycopeptides, and Sulfonamides. Of the nine qualified classes, six demonstrated significant rainfall-associated changes: Aminoglycoside, Bacitracin, and Unclassified resistance genes increased, while Peptide, Tetracycline, and Multidrug resistance genes decreased (Figure 4A).
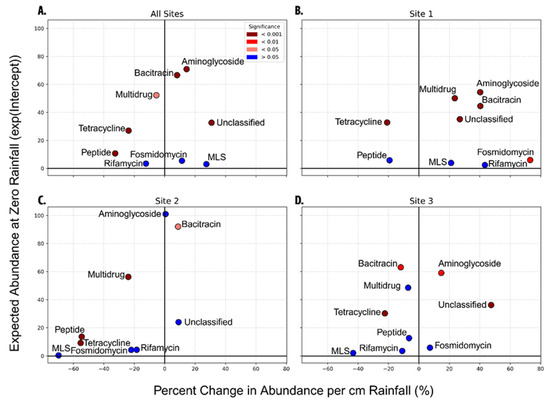
Figure 4.
Site-specific associations between rainfall and ARG class abundance in Lake Katherine. Rainfall-associated changes in ARG-class abundance: (A) average trends for the lake across all sites; (B) Site 1; (C) Site 2; (D) Site 3. All figures share an x axis and a y axis for comparability. X axis is the expected percent change in the ARG class per cm of rain in the 2 days leading up to the sampling date. Y axis is the baseline RPKM for the ARG class at 0 cm of rainfall in the two days leading up to the sampling. Significance is based on the X axis, because the primary focus is on whether rainfall has a significant impact on the ARG classes listed. Significance: Brown (<0.001), Red (<0.01), Pink (<0.05), Blue (>0.05). Figure data can be found in Supplementary Table S4.
Increases in Bacitracin resistance genes are most plausibly linked to runoff from residential applications of manure-based and other fertilizers, since Bacitracin can persist in such soil amendments. Although specific land-use or fertilizer-application data for the Lake Katherine catchment are not available, the lake’s location within a densely populated neighborhood supports this as the likely source of post-rainfall enrichment [47]. Elevated Aminoglycoside resistance genes may similarly reflect agricultural sources but could also originate from clinical or urban wastewater inputs [13,48]. The observed increase in Unclassified resistance genes potentially integrates signals from both agricultural and urban runoff [13]. Rifamycin, Fosmidomycin, and Macrolide–Lincosamide–Streptogramin (MLS) classes showed no significant response, meanwhile Peptide, Tetracycline, and Multidrug resistance genes exhibited significant negative responses, suggesting rainfall selectively modulates ARG distributions by enrichment and dilution effects.
Site-specific analyses further demonstrate spatial variability. At Site 1 (lake inlet), Aminoglycoside, Bacitracin, Multidrug, and Fosmidomycin resistance genes significantly increased following rainfall (Figure 4B). This suggests that rainfall-driven runoff introduces ARGs from urban or agricultural sources into the lake through its tributaries [13]. Conversely, Site 2 (low-flow cove) displayed significant increases only in Bacitracin genes, whereas Multidrug, Peptide, and Tetracycline resistance genes significantly decreased, potentially due to dilution or retention processes (Figure 4C). At Site 3 (lake outlet), Aminoglycoside genes increased moderately, while Bacitracin genes notably decreased following rainfall (Figure 4D). The contrasting trends between inlet and outlet sites indicate that rainfall-driven hydrological processes, including flushing and sedimentation, may redistribute ARG classes differently across locations within the lake [49].
Collectively, these observations indicate rainfall’s selective and spatially heterogeneous influence on ARG dynamics. Aminoglycoside and Bacitracin genes showed consistent sensitivity across multiple sites, although with opposite trends between inlet and outlet, highlighting complex environmental interactions. The consistently positive, though not uniformly significant, response of unclassified ARGs across all sites further supports contributions from diverse non-point sources such as agricultural or urban runoff [47]. These results demonstrate the necessity of accounting for both environmental drivers and site-specific characteristics in assessments of ARG dynamics within aquatic ecosystems [9].
3.4. Specific Microbial Communities Are Associated with ARG Classes
To contextualize observed rainfall-driven ARG fluctuations, we examined the taxonomic associations of ARG-containing microbial communities. Figure 5 illustrates the mean relative abundance of the 15 most prevalent taxonomic classes carrying ARGs under dry (<1 cm) and wet (≥1 cm) conditions. Betaproteobacteria were prevalent within the resistome in both conditions, comprising approximately 32% of ARG-bearing contigs under dry conditions and increasing to ~46% after rainfall. Actinomycetes declined from ~23% to 18%, and Cyanophyceae decreased from ~10% to 6% in wet samples, suggesting dilution or reduced mobilization of these classes by runoff. Conversely, Alphaproteobacteria and Opituta classes were enriched under wet conditions (rising from ~6% to ~8% and ~2% to ~6%, respectively), while Flavobacteria and Gammaproteobacteria showed modest increases. Notably, Holophaga, Acidimicrobia, and Spartobacteria were essentially absent in wet-weather samples, highlighting the selective retention or export of certain taxa. Contigs labeled as Unclassified comprised ~15% of ARG-bearing sequences which dropped to ~12% following rainfall. Human associated genera that ranked in the top classes include Streptomyces, Pseudomonas, Burkholderia, and E. coli. The full dataset containing all relative abundance values is located in Supplementary Table S5.
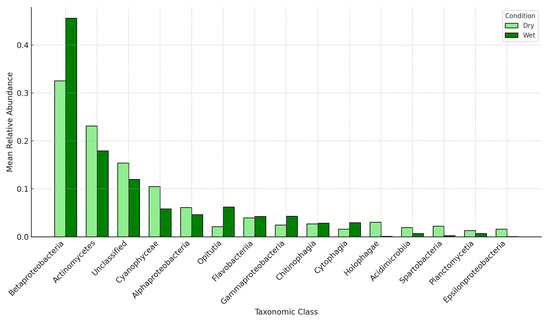
Figure 5.
Mean relative abundance bar chart of the top fifteen ARG-carrying taxonomic classes under dry (<1 cm two-day rainfall) and wet (≥1 cm) conditions. For each sample, the number of ARG-bearing contigs per class was divided by the total ARG-containing contigs to yield a relative abundance; these values were then averaged across all dry or wet samples. Bars are shown in light green (Dry) and dark green (Wet) with black outlines. Taxa are ordered by their overall mean abundance across both conditions; error bars denote the standard error of the mean. The top 15 results are shown in the figure.
Establishing a taxonomic profile of ARG-associated microorganisms in Lake Katherine provides context for understanding the environmental reservoirs and transmission pathways of ARGs. Overall, members of the Betaproteobacteria, Alphaproteobacteria, and Gammaproteobacteria classes within the phylum Pseudomonadota showed high association with genes across several ARG classes (Figure 6). These taxa, commonly associated with urban runoff and wastewater [50,51], were enriched in several resistance classes, suggesting a role as ARG reservoirs in Lake Katherine. This observation is consistent with previous reports implicating these proteobacterial classes in the environmental spread of clinically relevant resistance determinants in freshwater ecosystems [16].
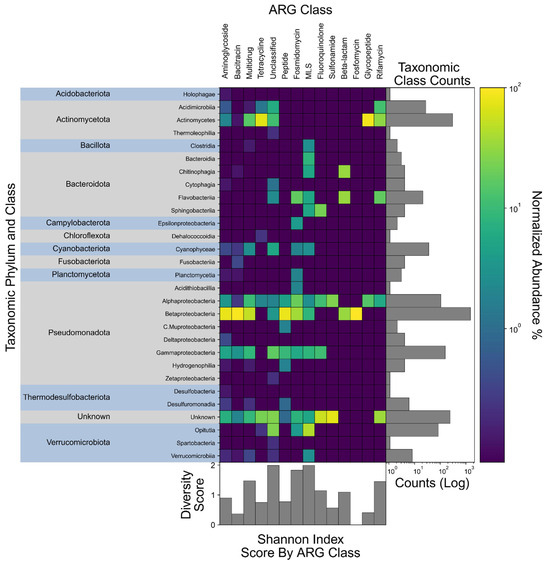
Figure 6.
Taxonomic composition proportion heatmap of ARG-associated microorganisms across all samples. The heatmap is 100% normalized for each ARG class to better show relative composition similarity. To the left of the heatmap are the taxonomic classes organized by phylum. Along the top axis are ARG classes clustered based on similarity. To the immediate right of the heatmap is a horizontal bar graph showing the raw counts of each taxonomic class, providing context on their absolute abundance. Along the bottom is a bar graph containing the Shannon diversity indices, representing the composite richness and evenness of taxonomic compositions corresponding to each ARG class along the top.
Class-level classification of ARG-carrying contigs indicated that glycopeptide- and tetracycline-resistance genes were primarily associated with members of the Actinomycetes, reflecting the contribution of this antibiotic-producing lineage to the background resistome [52,53]. A substantial proportion of ARG-bearing contigs, however, could not be assigned at the class level by Kaiju. Such “Unclassified” sequences likely arise from incomplete or low-coverage assemblies, gaps in existing reference databases, or ARGs located on mobile genetic elements that lack clear taxonomic signatures [54,55]. Notably, plasmid-borne ARGs often consist of partial or mosaic sequences and can be transferred horizontally among phylogenetically diverse hosts, which complicates accurate taxonomic assignment of these resistance determinants [55,56].
Calculating Shannon diversity indices across ARG classes highlighted considerable variability in taxonomic composition. ARG classes exhibiting high Shannon index scores, such as those associated with MLS resistance, imply a distribution of resistance-conferring genes among a wide array of microbial taxa. This high diversity indicates that these ARGs are likely under selection and contained on mobile elements, resulting in broad dissemination. Conversely, lower diversity within certain ARG classes suggests lower selective pressure or chromosomally located ARGs with limited mobility [57].
To further clarify taxonomic relationships between ARG classes, principal component analysis (PCA) was conducted on the overall taxonomic composition of each ARG class, and a k-means clustering of k = 4, as determined by elbow curve calculation, was used to group the points (Figure 7). Glycopeptide and Tetracycline (yellow) plotted near the upper left quadrant, indicating a distinct taxonomic composition compared to most other ARG classes. Specifically, as mentioned previously, these two classes largely occupy Actinomycetes (Figure 7). In contrast, classes such as Fosmidomycin, Beta-lactam, and Multidrug genes (blue) clustered near the center of the PCA plot, suggesting these ARG classes have microbial compositions that are more intermediate or mixed, without strong associations to specific taxa prevailing over either principal component. Fosfomycin, Bacitracin, Peptide, and Aminoglycoside gene classes (red) formed a loose cluster on the right, reflecting a shared community composition that differs from the other classes. Particularly, these four classes display high levels of association with betaproteobacteria (Figure 6), which is influencing their distribution across Principal Component 1 (PC1). These observations align with the earlier findings that certain proteobacterial lineages and other taxa are more frequently associated with specific ARG-classes. From a broader ecological perspective, these clusters may indicate that specific ARG classes are enriched by similar environmental niches or selective pressures. The high percentage of variance captured by the first two components suggests that taxonomic composition is a major driver in differentiating ARG classes.
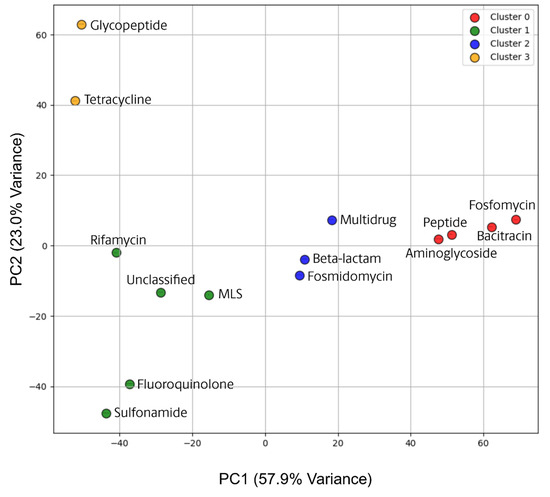
Figure 7.
ARG Taxonomy Principal Component Analysis (PCA) with K-Means Clustering. PCA of ARG taxonomic profiles with k-means clustering (k = 4) delineating distinct groupings based on microbial composition. The closer two points are in the PCA space, the more similar their taxonomic profiles are based on Principal Component 1 (PC1) and Principal Component 2 (PC2), which collectively account for approximately 80.9% of the total variance in the data. Based on the k-means clustering, 4 groups have been highlighted: Cluster 0 (Red, n = 4), Cluster 1 (Green, n = 5), Cluster 2 (Blue, n = 3), and Cluster 3 (Yellow, n = 2).
3.5. Plasmid-Associated ARGs
Plasmid-associated ARGs may play a central role in mediating gene mobility in freshwater environments. To investigate their contribution to the Lake Katherine resistome, ARGs identified on plasmid-classified contigs were examined. Plasmid origin was predicted using PlasClass, while ARGs were annotated via DeepARG. PlasClass predictions represent putative classifications based on machine learning applied to sequence features. Given that metagenomic contigs are often short and fragmented, these classifications should be interpreted cautiously. Reported precision and recall for PlasClass vary depending on contig length, with F1 scores of ~15 for contigs >500 bp and lower confidence for shorter sequences [41]. Although plasmid-associated contigs represented a minority of the total resistome, they exhibited distinct taxonomic and structural features that suggest a unique role in ARG dissemination.
To assess potential detection biases introduced by contig fragmentation, alignment lengths from DeepARG output were compared between plasmid-classified and non-plasmid contigs. Because DeepARG aligns translated nucleotide sequences to a protein database, alignment lengths are reported in amino acids. Note that the alignment lengths reported by DeepARG reflect translated ORF alignments and are not equivalent to nucleotide contig lengths. Although only contigs ≥500 bp were retained during preprocessing, some predicted ARGs align to internal regions of these contigs, resulting in shorter alignment lengths (e.g., ≥65 amino acids ≈ 195 bp). This explains why some ARG hits may appear shorter than the initial filtering threshold. ARGs located on plasmid-classified contigs had significantly shorter alignments (mean = 223 amino acids) than those across the entire dataset (mean = 298 amino acids), indicating a greater prevalence of partial or fragmented ARGs on plasmids (Mann–Whitney U test, p < 0.001) [Supplementary Table S6; Supplementary Figure S3]. To minimize the influence of these potential biases, downstream analyses used a binary presence/absence framework.
Each of the 82 sample files was scored as present (1) or absent (0) for each ARG class based on whether at least one plasmid predicted contig was detected for the ARG class in question. This binomial representation allowed for comparison across samples without being confounded by contig length or assembly completeness. The most frequently detected plasmid-associated ARG classes were Multidrug resistance (36.9% of samples), Aminoglycoside (35.7%), Unclassified (34.5%), and Bacitracin (29.8%) (Figure 8). One-tailed Fisher’s exact tests with Benjamini–Hochberg correction revealed that these four classes were significantly enriched on plasmids relative to all other ARG classes (adjusted p < 0.001) [Supplementary Table S7]. The marked enrichment of these classes, particularly the large proportion of unclassified ARGs, highlights a substantial, yet poorly characterized, pool of mobile resistance elements.
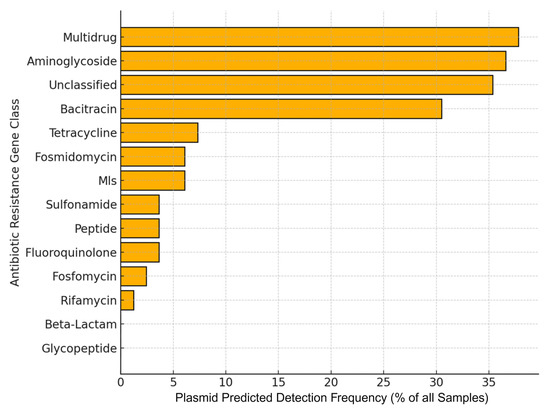
Figure 8.
Horizontal bar chart of ARG class detection frequency in plasmid-predicted samples. Each bar represents the percentage of 82 metagenomic samples in which at least one contig of the indicated ARG class was detected (binary presence/absence). Multidrug, Aminoglycoside, Unclassified, and Bacitracin classes are significantly enriched on plasmids (Fisher’s exact test, BH-adjusted p < 0.001), while Glycopeptide and Beta-Lactam show no plasmid association. While plasmid association provides useful context for ARG mobility, these predictions are not experimentally validated and should be interpreted as probabilistic, not definitive.
Similarly, taxonomic assignments of plasmid-associated contigs were also examined. Betaproteobacteria were the most frequently detected lineage (41/82 samples; 50.0%), followed by Gammaproteobacteria (25.6%) and Alphaproteobacteria (17.1%). Actinomycetes (13.4%) and Opitutia (8.5%) were less prevalent (Figure 9). Fisher’s exact tests confirmed significant enrichment of Betaproteobacteria, Gammaproteobacteria, and Alphaproteobacteria on plasmid-associated contigs compared to other classes (adjusted p < 0.001) [Supplementary Table S8]. The prevalence of these Proteobacterial lineages suggests they may serve as important hosts for plasmid-mediated resistance.
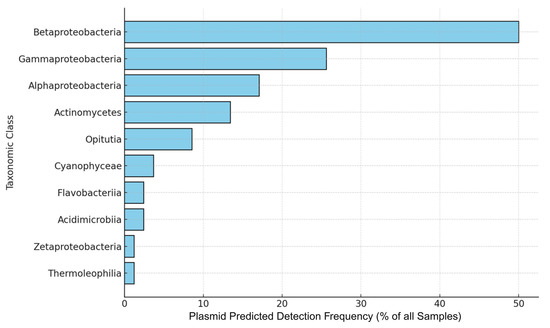
Figure 9.
Detection frequency of taxonomic classes in plasmid-predicted samples. Horizontal bars indicate the percentage of 82 metagenomic samples containing at least one plasmid-associated contig assigned to the indicated taxonomic class (binary presence/absence). Betaproteobacteria, Gammaproteobacteria, and Alphaproteobacteria are significantly enriched on plasmids (Fisher’s exact test, BH-adjusted p < 0.001). While plasmid association provides useful context for ARG mobility, these predictions are not experimentally validated and should be interpreted as probabilistic, not definitive.
Taken together, these findings support the role of plasmids as key vectors for mobile resistance elements, particularly those involved in multidrug and poorly characterized resistance mechanisms. The observed taxonomic and structural biases emphasize the importance of plasmid dynamics in shaping ARG distribution in urban freshwater environments. As rainfall and other disturbances influence microbial community structure and horizontal gene transfer potential, future studies should investigate the persistence and mobility of plasmid-associated ARGs in context-specific scenarios.
4. Discussion
This study demonstrates that rainfall is a complex driver of resistome fluctuations in Lake Katherine. In contrast to previously documented increases in ARG abundance following rainfall in rivers, this study observed heterogeneous responses across ARG classes and locations within the lake, reflecting distinct hydrological and anthropogenic processes characteristic of suburban lakes. Rain events did not uniformly elevate total ARG levels; instead, gene-class-specific responses emerged. Several ARG classes (notably Aminoglycoside, Bacitracin, and Unclassified resistance genes) increased in abundance following precipitation, whereas others (such as Tetracycline, Multidrug, and Peptide resistance genes) declined in relative abundance. This decline suggests that rain events may also introduce environmental changes, such as dilution effects, shifts in microbial community composition, or extracellular DNA degradation, that reduce the relative abundance of some resistance determinants. For example, heavy rainfall can dilute background ARG concentrations or disrupt sediment-bound communities, leading to microbial turnover. In addition, extracellular ARGs released from lysed cells may be degraded by nucleases or bound to particulates, reducing their detectability in post-rain samples. The contrasting trends may suggest that stormwater runoff can introduce pulses of ARGs even as dilution or microbial turnover suppresses certain classes. Also, the impact of rainfall varied spatially within the lake: the inlet site (closest to stormwater inputs) showed the strongest positive correlation between rainfall and ARG abundance, while downstream sites exhibited weaker or no relationships. Such non-uniform patterns highlight the complex interactions between hydrology and ARG dynamics, consistent with observations that precipitation can both concentrate and disperse resistance elements depending on local conditions [10,14].
Taxonomic profiling of ARG-bearing metagenomic contigs provided insight into the microbial reservoirs underlying these patterns. Pseudomonadota, particularly Betaproteobacteria, were disproportionately represented among ARG-associated bacteria across many gene classes. Members of the Betaproteobacteria (along with Alpha- and Gammaproteobacteria) prevailed over the communities carrying ARGs that increased post-rainfall, like aminoglycoside and multidrug resistance genes, suggesting that rain-mediated runoff transports bacteria carrying these resistance genes from urban environments or wastewater sources into the lake [51]. The prominence of these proteobacterial classes is consistent with their known association with polluted runoff and their role as vectors for disseminating clinically relevant ARGs in aquatic environments [16].
Another notable finding is the prevalence of plasmid-associated ARGs, highlighting the potential for horizontal gene transfer in this environment. Plasmids are well-recognized vectors for transferring ARGs across bacterial species, so their presence in the lake’s metagenome increases the risk of ARG dissemination [55]. Broad-spectrum resistance categories, like Unclassified or Multidrug ARGs, showed an enriched proportion of plasmid-borne genes, suggesting these mobile elements could readily spread resistance traits within the microbial community. This scenario is concerning because plasmid-mediated transfer can propagate ARGs beyond their original hosts, potentially seeding resistance into opportunistic pathogens or commensal bacteria in the water [56]. The detection of plasmid-linked ARGs in Lake Katherine thus reinforces the notion that environmental resistomes are not static repositories but interactive pools with the capacity for gene exchange. It demonstrates the importance of surveilling not just which resistance genes are present, but also their genetic context and mobility, to better anticipate patterns of ARG spread.
Collectively, these findings carry important public health implications for recreational freshwater systems. Suburban lakes like Lake Katherine are frequently used for fishing, swimming, or other forms of contact, yet they may serve as unnoticed reservoirs of antibiotic resistance. Although total ARG abundance remained relatively stable, storm-driven hydrological pulses caused significant reorganizations of the resistome, selectively enriching ARG classes linked to potentially mobile genetic elements and clinically important antibiotics, most notably aminoglycoside resistance genes. The concurrent increase in unclassified ARGs is also concerning, as these sequences either represent novel, previously undescribed resistance elements or reflect gaps in current annotation databases. Their response to rainfall suggests they may originate from sources that are not well-characterized in reference datasets, such as environmental or non-clinical bacteria. Future studies using functional metagenomics or metatranscriptomics will be essential to validate the resistance potential and ecological roles of these unclassified sequences. Their enrichment following rainfall suggests that stormwater inputs may not only mobilize known resistance elements but also introduce genetically diverse elements whose implications for human and environmental health remain poorly understood. Given that recreational exposure can involve dermal contact or incidental ingestion, such shifts in ARG profiles after rain events may present meaningful episodic health risks to lake users [1]. Even if lake water is not used for drinking, these ARGs and resistant microbes can be transported downstream or into underlying groundwater, contributing to the wider dissemination of resistance in the environment [4]. The fact that significant ARG fluctuations occur in response to ordinary rainstorms suggests that even well-maintained suburban water bodies are vulnerable to resistance pollution during wet weather. From a public health standpoint, this study underscores the need for regular monitoring of ARG levels in urban and suburban recreational waters and for integrating antibiotic resistance considerations into stormwater management and water quality guidelines. Proactive surveillance and mitigation strategies, such as timely advisories after heavy rains or improved runoff controls, could help minimize community exposure to environmental antibiotic resistance.
Despite its insights, this study has several limitations that highlight avenues for future research. First, the focus on recent rainfall as the primary explanatory variable means that other environmental factors were not accounted for in the analysis. Integrating ARG data with physico-chemical parameters such as turbidity, dissolved organic carbon (DOC), nutrient concentrations, and temperature could reveal how environmental conditions modulate ARG stability, transport, and persistence. Variables such as antecedent dry periods, seasonal temperature changes, nutrient loads, and water chemistry fluctuations could also influence ARG abundance and stability. Incorporating these factors into multivariate models or long-term datasets would provide a more holistic understanding of ARG dynamics [6,51]. Second, this investigation was limited to a single lake over the course of one year. Expanding surveillance to additional lakes and watersheds, encompassing different land use contexts and climates, is important to determine the generality of the rainfall-ARG relationships observed here. Comparative studies suggest that ARG profiles and drivers can vary significantly across freshwater systems; therefore, a broader geographic sampling would strengthen inferences about how ubiquitous these rain-driven resistome fluctuations are [20,21]. Third, the metagenomic approach relied on short-read sequencing, which limited the assembly of full-length ARG sequences and the resolution of their genetic contexts, like distinguishing whether a gene resides on a chromosome versus a plasmid. Future work employing long-read sequencing or hybrid assembly techniques could capture the complete architecture of ARG elements, allowing direct linkage of resistance genes to specific hosts and mobile elements [56]. Such detailed genomic context would improve source tracking of ARGs and help discern between endemic background resistance and newly introduced genes. ARGs were quantified at the DNA level without assessment of their expression or phenotypic impact. Follow-up studies using metatranscriptomics or culture-based assays would be valuable to evaluate whether the detected ARGs are actively expressed and confer resistance under in situ conditions. Fourth, the distribution of sampling events across rainfall conditions was uneven, with wet-weather samples outnumbering dry-weather samples by approximately 2:1 at each site [Supplemental Table S9]. Although this imbalance accurately reflects precipitation patterns during the study period, it reduces statistical power for some class- and site-specific comparisons under dry conditions. Consequently, effect estimates for gene classes or locations with fewer dry samples may be associated with wider confidence intervals and increased risk of Type II error. Future studies should employ stratified sampling or targeted collection efforts to achieve a more balanced representation of both dry- and wet-weather conditions, thereby improving statistical power for dry-weather comparisons and enhancing the reliability of class-specific and site-specific analyses. Although co-occurrence or modularity-based network analyses may offer additional insight into ARG transfer dynamics, such approaches require more complete genomic resolution and validated linkage data than are available in the current short-read dataset. These analyses remain an important direction for future work. Addressing these gaps will deepen our understanding of how environmental pressures like precipitation shape the spread of antibiotic resistance. In an era of changing climate and expanding urbanization, developing this knowledge is crucial for crafting effective water management policies and public health interventions to curb the proliferation of antibiotic resistance [51].
Supplementary Materials
The following supporting information can be downloaded at: https://www.mdpi.com/article/10.3390/w17152260/s1, Supplemental_Figures.docx: Figure S1: Time series of two-day cumulative precipitation, Figure S2: Flow chart of bioinformatic steps from program to program, Figure S3: Box Plots Comparing Alignment lengths of All ARGs Against Plasmid Associated ARGS; Supplemental_Tables.xlsx: Table S1: Semmes Lake weather data for sampling period, Table S2: Nucleic Acid Concentration Averages, Table S3: Total Reads from FastQ Files, Table S4: ZIP Model Results for ARG Classes per Site, Table S5: Dry vs. Wet Proportional Abundances for Taxonomic Classes. Table S6: Plasmid Associated ARG Alignment Length and chromosomal ARG contig length, Table S7: Binomial Comparison Table for ARG Class Associated Plasmids, Table S8: Binomial Comparison Table for ARG Taxonomic Class Associated Plasmids, Table S9: Numerical Comparison of Dry and Wet Samples Across All Three Sites; ZIP_Residual_Plots.zip: Folder Containing All Residual and Q-Q Plots for the Zero Inflated Poisson Model Results by Site and ARG Class.
Author Contributions
Conceptualization, K.E.C.V. and R.S.N.; formal analysis, J.R. and R.S.N.; funding acquisition, R.S.N.; investigation, J.R., K.E.C.V. and R.S.N.; methodology, J.R., K.E.C.V. and R.S.N.; project administration, R.S.N.; resources, R.S.N.; supervision, R.S.N.; visualization, J.R. and R.S.N.; writing—original draft, J.R.; writing—review and editing, J.R. and R.S.N. All authors have read and agreed to the published version of the manuscript.
Funding
This research was funded by a grant from the University of South Carolina ASPIRE Program to R.S.N (#13020-19-51236).
Data Availability Statement
The raw Illumina sequencing reads for each sample are available at the NCBI GenBank under the BioProject accession # PRJNA1282196.
Conflicts of Interest
The authors declare no conflicts of interest. The funders had no role in the design of the study; in the collection, analyses, or interpretation of data; in the writing of the manuscript; or in the decision to publish the results.
Abbreviations
The following abbreviations are used in this manuscript:
| ARG | Antibiotic Resistance Gene(s) |
| RPKM | Reads per Kilobase per Million mapped reads |
| MLS | Macrolide–Lincosamide–Streptogramin |
| ORF | Open Reading Frame |
| PES | Polyether Sulfone |
| PCA | Principal Component Analysis |
| WCSS | Within-Cluster Sum of Squares |
| WWTP | Wastewater Treatment Plant |
References
- Wellington, E.M.H.; Boxall, A.B.; Cross, P.; Feil, E.J.; Gaze, W.H.; Hawkey, P.M.; Johnson-Rollings, A.S.; Jones, D.L.; Lee, N.M.; Otten, W.; et al. The Role of the Natural Environment in the Emergence of Antibiotic Resistance in Gram-Negative Bacteria. Lancet Infect. Dis. 2013, 13, 155–165. [Google Scholar] [CrossRef]
- Zhuang, M.; Achmon, Y.; Cao, Y.; Liang, X.; Chen, L.; Wang, H.; Siame, B.A.; Leung, K.Y. Distribution of Antibiotic Resistance Genes in the Environment. Environ. Pollut. 2021, 285, 117402. [Google Scholar] [CrossRef] [PubMed]
- Singh, A.K.; Kaur, R.; Verma, S.; Singh, S. Antimicrobials and Antibiotic Resistance Genes in Water Bodies: Pollution, Risk, and Control. Front. Environ. Sci. 2022, 10, 830861. [Google Scholar] [CrossRef]
- Nnadozie, C.F.; Odume, O.N. Freshwater Environments as Reservoirs of Antibiotic Resistant Bacteria and Their Role in the Dissemination of Antibiotic Resistance Genes. Environ. Pollut. Barking Essex 1987 2019, 254, 113067. [Google Scholar] [CrossRef] [PubMed]
- Pruden, A.; Pei, R.; Storteboom, H.; Carlson, K.H. Antibiotic Resistance Genes as Emerging Contaminants: Studies in Northern Colorado. Environ. Sci. Technol. 2006, 40, 7445–7450. [Google Scholar] [CrossRef]
- Morina, J.C.; Franklin, R.B. Drivers of Antibiotic Resistance Gene Abundance in an Urban River. Antibiotics 2023, 12, 1270. [Google Scholar] [CrossRef]
- Chen, Y.; Su, J.-Q.; Zhang, J.; Li, P.; Chen, H.; Zhang, B.; Gin, K.Y.-H.; He, Y. High-Throughput Profiling of Antibiotic Resistance Gene Dynamic in a Drinking Water River-Reservoir System. Water Res. 2019, 149, 179–189. [Google Scholar] [CrossRef]
- Di Cesare, A.; Eckert, E.M.; D’Urso, S.; Bertoni, R.; Gillan, D.C.; Wattiez, R.; Corno, G. Co-Occurrence of Integrase 1, Antibiotic and Heavy Metal Resistance Genes in Municipal Wastewater Treatment Plants. Water Res. 2016, 94, 208–214. [Google Scholar] [CrossRef] [PubMed]
- Chen, Y.; Li, P.; Huang, Y.; Yu, K.; Chen, H.; Cui, K.; Huang, Q.; Zhang, J.; Yew-Hoong Gin, K.; He, Y. Environmental Media Exert a Bottleneck in Driving the Dynamics of Antibiotic Resistance Genes in Modern Aquatic Environment. Water Res. 2019, 162, 127–138. [Google Scholar] [CrossRef]
- O’Malley, K.; McNamara, P.J.; McDonald, W.M. Seasonal and Spatial Patterns Differ between Intracellular and Extracellular Antibiotic Resistance Genes in Urban Stormwater Runoff. Environ. Sci. Adv. 2022, 1, 380–390. [Google Scholar] [CrossRef]
- Zhang, Q.; Zhang, Z.; Lu, T.; Peijnenburg, W.J.G.M.; Gillings, M.; Yang, X.; Chen, J.; Penuelas, J.; Zhu, Y.-G.; Zhou, N.-Y.; et al. Cyanobacterial Blooms Contribute to the Diversity of Antibiotic-Resistance Genes in Aquatic Ecosystems. Commun. Biol. 2020, 3, 737. [Google Scholar] [CrossRef] [PubMed]
- Hou, L.; Li, J.; Wang, H.; Chen, Q.; Su, J.; Gad, M.; Ahmed, W.; Yu, C.-P.; Hu, A. Storm Promotes the Dissemination of Antibiotic Resistome in an Urban Lagoon Through Enhancing Bio-Interactions. Environ. Int. 2022, 168, 107457. [Google Scholar] [CrossRef]
- Baral, D.; Dvorak, B.I.; Admiraal, D.; Jia, S.; Zhang, C.; Li, X. Tracking the Sources of Antibiotic Resistance Genes in an Urban Stream during Wet Weather Using Shotgun Metagenomic Analyses. Environ. Sci. Technol. 2018, 52, 9033–9044. [Google Scholar] [CrossRef]
- Di Cesare, A.; Eckert, E.M.; Rogora, M.; Corno, G. Rainfall Increases the Abundance of Antibiotic Resistance Genes within a Riverine Microbial Community. Environ. Pollut. Barking Essex 1987 2017, 226, 473–478. [Google Scholar] [CrossRef]
- Habib, I.; Mohteshamuddin, K.; Mohamed, M.-Y.I.; Lakshmi, G.B.; Abdalla, A.; Bakhit Ali Alkaabi, A. Domestic Pets in the United Arab Emirates as Reservoirs for Antibiotic-Resistant Bacteria: A Comprehensive Analysis of Extended-Spectrum Beta-Lactamase Producing Escherichia Coli Prevalence and Risk Factors. Animals 2023, 13, 1587. [Google Scholar] [CrossRef] [PubMed]
- Narciso-da-Rocha, C.; Manaia, C.M. Multidrug Resistance Phenotypes Are Widespread over Different Bacterial Taxonomic Groups Thriving in Surface Water. Sci. Total Environ. 2016, 563–564, 1–9. [Google Scholar] [CrossRef] [PubMed]
- Bhattacharyya, S.; Harit, A.K.; Singh, M.; Sharma, U.; Pradhan, C. Occurrence of Antibiotic Resistance in Lotic Ecosystems. Sci. Temper 2022, 13, 421–424. [Google Scholar] [CrossRef]
- Di Cesare, A.; Eckert, E.M.; Cottin, C.; Bouchez, A.; Callieri, C.; Cortesini, M.; Lami, A.; Corno, G. The Vertical Distribution of tetA and intI1 in a Deep Lake Is Rather Due to Sedimentation than to Resuspension. FEMS Microbiol. Ecol. 2020, 96, fiaa002. [Google Scholar] [CrossRef]
- Le, T.H.; Truong, T.; Tran, L.-T.; Nguyen, D.-H.; Pham, T.P.T.; Ng, C. Antibiotic Resistance in the Aquatic Environments: The Need for an Interdisciplinary Approach. Int. J. Environ. Sci. Technol. 2023, 20, 3395–3408. [Google Scholar] [CrossRef]
- Rajasekar, A.; Murava, R.T.; Norgbey, E.; Vadde, K.K.; Qiu, M.; Guo, S.; Yu, T.; Wang, R.; Zhao, C. Distribution of Antibiotic Resistance Genes and Their Associations with Bacterial Communities and Water Quality in Freshwater Lakes. Water. Air. Soil Pollut. 2023, 234, 220. [Google Scholar] [CrossRef]
- Liu, S.; Yu, J.; Jian, M.; Hu, Q.; Zou, L. Metagenomic Insight into the Prevalence and Distribution of Antibiotic Resistance Genes in China’s Largest Freshwater Lake. Pol. J. Environ. Stud. 2024, 33, 5521–5531. [Google Scholar] [CrossRef] [PubMed]
- Personal Weather Station Dashboard. Weather Underground. Available online: https://www.wunderground.com/dashboard/pws/KSCCOLUM124/table/2019-09-26/2019-09-26/monthly (accessed on 26 February 2025).
- Hinlo, R.; Gleeson, D.; Lintermans, M.; Furlan, E. Methods to Maximise Recovery of Environmental DNA from Water Samples. PLoS ONE 2017, 12, e0179251. [Google Scholar] [CrossRef] [PubMed]
- Abreu-Silva, J.; Ribeirinho-Soares, S.; Oliveira-Inocêncio, I.; Pedrosa, M.; Silva, A.M.T.; Nunes, O.C.; Manaia, C.M. Performance of Polycarbonate, Cellulose Nitrate and Polyethersulfone Filtering Membranes for Culture-Independent Microbiota Analysis of Clean Waters. J. Environ. Chem. Eng. 2023, 11, 109132. [Google Scholar] [CrossRef]
- Pearman, J.K.; Keeley, N.B.; Wood, S.A.; Laroche, O.; Zaiko, A.; Thomson-Laing, G.; Biessy, L.; Atalah, J.; Pochon, X. Comparing Sediment DNA Extraction Methods for Assessing Organic Enrichment Associated with Marine Aquaculture. PeerJ 2020, 8, e10231. [Google Scholar] [CrossRef]
- Mardis, E.; McCombie, W.R. Library Quantification: Fluorometric Quantitation of Double-Stranded or Single-Stranded DNA Samples Using the Qubit System. Cold Spring Harb. Protoc. 2017, 2017, 489–490. [Google Scholar] [CrossRef]
- Sodowich, B.I.; Fadl, I.; Burns, C. Method Validation of in Vitro RNA Transcript Analysis on the Agilent 2100 Bioanalyzer. Electrophoresis 2007, 28, 2368–2378. [Google Scholar] [CrossRef]
- Modi, A.; Vai, S.; Caramelli, D.; Lari, M. The Illumina Sequencing Protocol and the NovaSeq 6000 System. In Bacterial Pangenomics: Methods and Protocols; Mengoni, A., Bacci, G., Fondi, M., Eds.; Springer: New York, NY, USA, 2021; pp. 15–42. ISBN 978-1-07-161099-2. [Google Scholar]
- Isanovic, M.; Correa Velez, K.E.; Viner, B.J.; Norman, R.S. Seasonal Patterns in Mobile Colistin Resistance Gene Variants in Wastewater Bioaerosols and Liquid Sludge. ACS EST Water 2024, 4, 178–189. [Google Scholar] [CrossRef]
- Chen, S.; Zhou, Y.; Chen, Y.; Gu, J. Fastp: An Ultra-Fast All-in-One FASTQ Preprocessor. Bioinformatics 2018, 34, i884–i890. [Google Scholar] [CrossRef]
- Bankevich, A.; Nurk, S.; Antipov, D.; Gurevich, A.A.; Dvorkin, M.; Kulikov, A.S.; Lesin, V.M.; Nikolenko, S.I.; Pham, S.; Prjibelski, A.D.; et al. SPAdes: A New Genome Assembly Algorithm and Its Applications to Single-Cell Sequencing. J. Comput. Biol. 2012, 19, 455–477. [Google Scholar] [CrossRef]
- Li, D.; Liu, C.-M.; Luo, R.; Sadakane, K.; Lam, T.-W. MEGAHIT: An Ultra-Fast Single-Node Solution for Large and Complex Metagenomics Assembly via Succinct de Bruijn Graph. Bioinformatics 2015, 31, 1674–1676. [Google Scholar] [CrossRef]
- Hyatt, D.; Chen, G.-L.; Locascio, P.F.; Land, M.L.; Larimer, F.W.; Hauser, L.J. Prodigal: Prokaryotic Gene Recognition and Translation Initiation Site Identification. BMC Bioinform. 2010, 11, 119. [Google Scholar] [CrossRef]
- Arango-Argoty, G.; Garner, E.; Pruden, A.; Heath, L.S.; Vikesland, P.; Zhang, L. DeepARG: A Deep Learning Approach for Predicting Antibiotic Resistance Genes from Metagenomic Data. Microbiome 2018, 6, 23. [Google Scholar] [CrossRef]
- Langmead, B.; Salzberg, S.L. Fast Gapped-Read Alignment with Bowtie 2. Nat. Methods 2012, 9, 357–359. [Google Scholar] [CrossRef]
- Li, H.; Handsaker, B.; Wysoker, A.; Fennell, T.; Ruan, J.; Homer, N.; Marth, G.; Abecasis, G.; Durbin, R. 1000 Genome Project Data Processing Subgroup The Sequence Alignment/Map Format and SAMtools. Bioinforma. Oxf. Engl. 2009, 25, 2078–2079. [Google Scholar] [CrossRef]
- Quinlan, A.R.; Hall, I.M. BEDTools: A Flexible Suite of Utilities for Comparing Genomic Features. Bioinformatics 2010, 26, 841–842. [Google Scholar] [CrossRef]
- Chouvarine, P.; Wiehlmann, L.; Losada, P.M.; DeLuca, D.S.; Tümmler, B. Filtration and Normalization of Sequencing Read Data in Whole-Metagenome Shotgun Samples. PLoS ONE 2016, 11, e0165015. [Google Scholar] [CrossRef] [PubMed]
- Mortazavi, A.; Williams, B.A.; McCue, K.; Schaeffer, L.; Wold, B. Mapping and Quantifying Mammalian Transcriptomes by RNA-Seq. Nat. Methods 2008, 5, 621–628. [Google Scholar] [CrossRef] [PubMed]
- Menzel, P.; Ng, K.L.; Krogh, A. Fast and Sensitive Taxonomic Classification for Metagenomics with Kaiju. Nat. Commun. 2016, 7, 11257. [Google Scholar] [CrossRef] [PubMed]
- Pellow, D.; Mizrahi, I.; Shamir, R. PlasClass Improves Plasmid Sequence Classification. PLoS Comput. Biol. 2020, 16, e1007781. [Google Scholar] [CrossRef] [PubMed]
- Lambert, D. Zero-Inflated Poisson Regression, With an Application to Defects in Manufacturing. Technometrics 1992, 34, 1–14. [Google Scholar] [CrossRef]
- Peduzzi, P.; Concato, J.; Kemper, E.; Holford, T.R.; Feinstein, A.R. A Simulation Study of the Number of Events per Variable in Logistic Regression Analysis. J. Clin. Epidemiol. 1996, 49, 1373–1379. [Google Scholar] [CrossRef]
- Garner, E.; Benitez, R.; von Wagoner, E.; Sawyer, R.; Schaberg, E.; Hession, W.C.; Krometis, L.-A.H.; Badgley, B.D.; Pruden, A. Stormwater Loadings of Antibiotic Resistance Genes in an Urban Stream. Water Res. 2017, 123, 144–152. [Google Scholar] [CrossRef]
- Zhou, Z.-C.; Zheng, J.; Wei, Y.-Y.; Chen, T.; Dahlgren, R.A.; Shang, X.; Chen, H. Antibiotic Resistance Genes in an Urban River as Impacted by Bacterial Community and Physicochemical Parameters. Environ. Sci. Pollut. Res. 2017, 24, 23753–23762. [Google Scholar] [CrossRef]
- Meierdiercks, K.L.; Smith, J.A.; Baeck, M.L.; Miller, A.J. Heterogeneity of Hydrologic Response in Urban Watersheds1. JAWRA J. Am. Water Resour. Assoc. 2010, 46, 1221–1237. [Google Scholar] [CrossRef]
- Joy, S.R.; Bartelt-Hunt, S.L.; Snow, D.D.; Gilley, J.E.; Woodbury, B.L.; Parker, D.B.; Marx, D.B.; Li, X. Fate and Transport of Antimicrobials and Antimicrobial Resistance Genes in Soil and Runoff Following Land Application of Swine Manure Slurry. Environ. Sci. Technol. 2013, 47, 12081–12088. [Google Scholar] [CrossRef]
- Rodriguez-Mozaz, S.; Chamorro, S.; Marti, E.; Huerta, B.; Gros, M.; Sànchez-Melsió, A.; Borrego, C.M.; Barceló, D.; Balcázar, J.L. Occurrence of Antibiotics and Antibiotic Resistance Genes in Hospital and Urban Wastewaters and Their Impact on the Receiving River. Water Res. 2015, 69, 234–242. [Google Scholar] [CrossRef]
- Brown, P.C.; Borowska, E.; Schwartz, T.; Horn, H. Impact of the Particulate Matter from Wastewater Discharge on the Abundance of Antibiotic Resistance Genes and Facultative Pathogenic Bacteria in Downstream River Sediments. Sci. Total Environ. 2019, 649, 1171–1178. [Google Scholar] [CrossRef]
- Teira, E.; Nieto-Cid, M.; Álvarez-Salgado, X.A. Bacterial Community Composition and Colored Dissolved Organic Matter in a Coastal Upwelling Ecosystem. Aquat. Microb. Ecol. 2009, 55, 131–142. [Google Scholar] [CrossRef]
- Le, H.T.; Ho, C.T.; Trinh, Q.H.; Trinh, D.A.; Luu, M.T.N.; Tran, H.S.; Orange, D.; Janeau, J.L.; Merroune, A.; Rochelle-Newall, E.; et al. Responses of Aquatic Bacteria to Terrestrial Runoff: Effects on Community Structure and Key Taxonomic Groups. Front. Microbiol. 2016, 7, 889. [Google Scholar] [CrossRef]
- Iron-Induced Respiration Promotes Antibiotic Resistance in Actinomycete Bacteria. mBio. Available online: https://journals.asm.org/doi/10.1128/mbio.00425-22 (accessed on 24 February 2025).
- Steininger, C.; Willinger, B. Resistance Patterns in Clinical Isolates of Pathogenic Actinomyces Species. J. Antimicrob. Chemother. 2016, 71, 422–427. [Google Scholar] [CrossRef]
- Rinke, C.; Schwientek, P.; Sczyrba, A.; Ivanova, N.N.; Anderson, I.J.; Cheng, J.-F.; Darling, A.; Malfatti, S.; Swan, B.K.; Gies, E.A.; et al. Insights into the Phylogeny and Coding Potential of Microbial Dark Matter. Nature 2013, 499, 431–437. [Google Scholar] [CrossRef] [PubMed]
- Partridge, S.R.; Kwong, S.M.; Firth, N.; Jensen, S.O. Mobile Genetic Elements Associated with Antimicrobial Resistance. Clin. Microbiol. Rev. 2018, 31, e00088-17. [Google Scholar] [CrossRef] [PubMed]
- Stalder, T.; Press, M.O.; Sullivan, S.; Liachko, I.; Top, E.M. Linking the Resistome and Plasmidome to the Microbiome. ISME J. 2019, 13, 2437–2446. [Google Scholar] [CrossRef] [PubMed]
- Sabino, Y.N.V.; de Melo, M.D.; da Silva, G.C.; Mantovani, H.C. Unraveling the Diversity and Dissemination Dynamics of Antimicrobial Resistance Genes in Enterobacteriaceae Plasmids across Diverse Ecosystems. J. Appl. Microbiol. 2024, 135, lxae028. [Google Scholar] [CrossRef]
Disclaimer/Publisher’s Note: The statements, opinions and data contained in all publications are solely those of the individual author(s) and contributor(s) and not of MDPI and/or the editor(s). MDPI and/or the editor(s) disclaim responsibility for any injury to people or property resulting from any ideas, methods, instructions or products referred to in the content. |
© 2025 by the authors. Licensee MDPI, Basel, Switzerland. This article is an open access article distributed under the terms and conditions of the Creative Commons Attribution (CC BY) license (https://creativecommons.org/licenses/by/4.0/).