
Does Urban Economic Development Increase Sewage Discharge Intensity? A Case Study of 288 Cities in China


 ,
,
Abstract
1. Introduction
2. Materials and Methods
2.1. Variable Selection
2.1.1. Dependent Variable: Sewage Discharge Intensity (SDI)
2.1.2. Independent Variables: Explanatory and Control Variables
2.2. Data Sources and Statistical Analysis of Indicators
2.3. Research Methods
2.3.1. OLS Model
2.3.2. Spatial Regression Model
3. Results
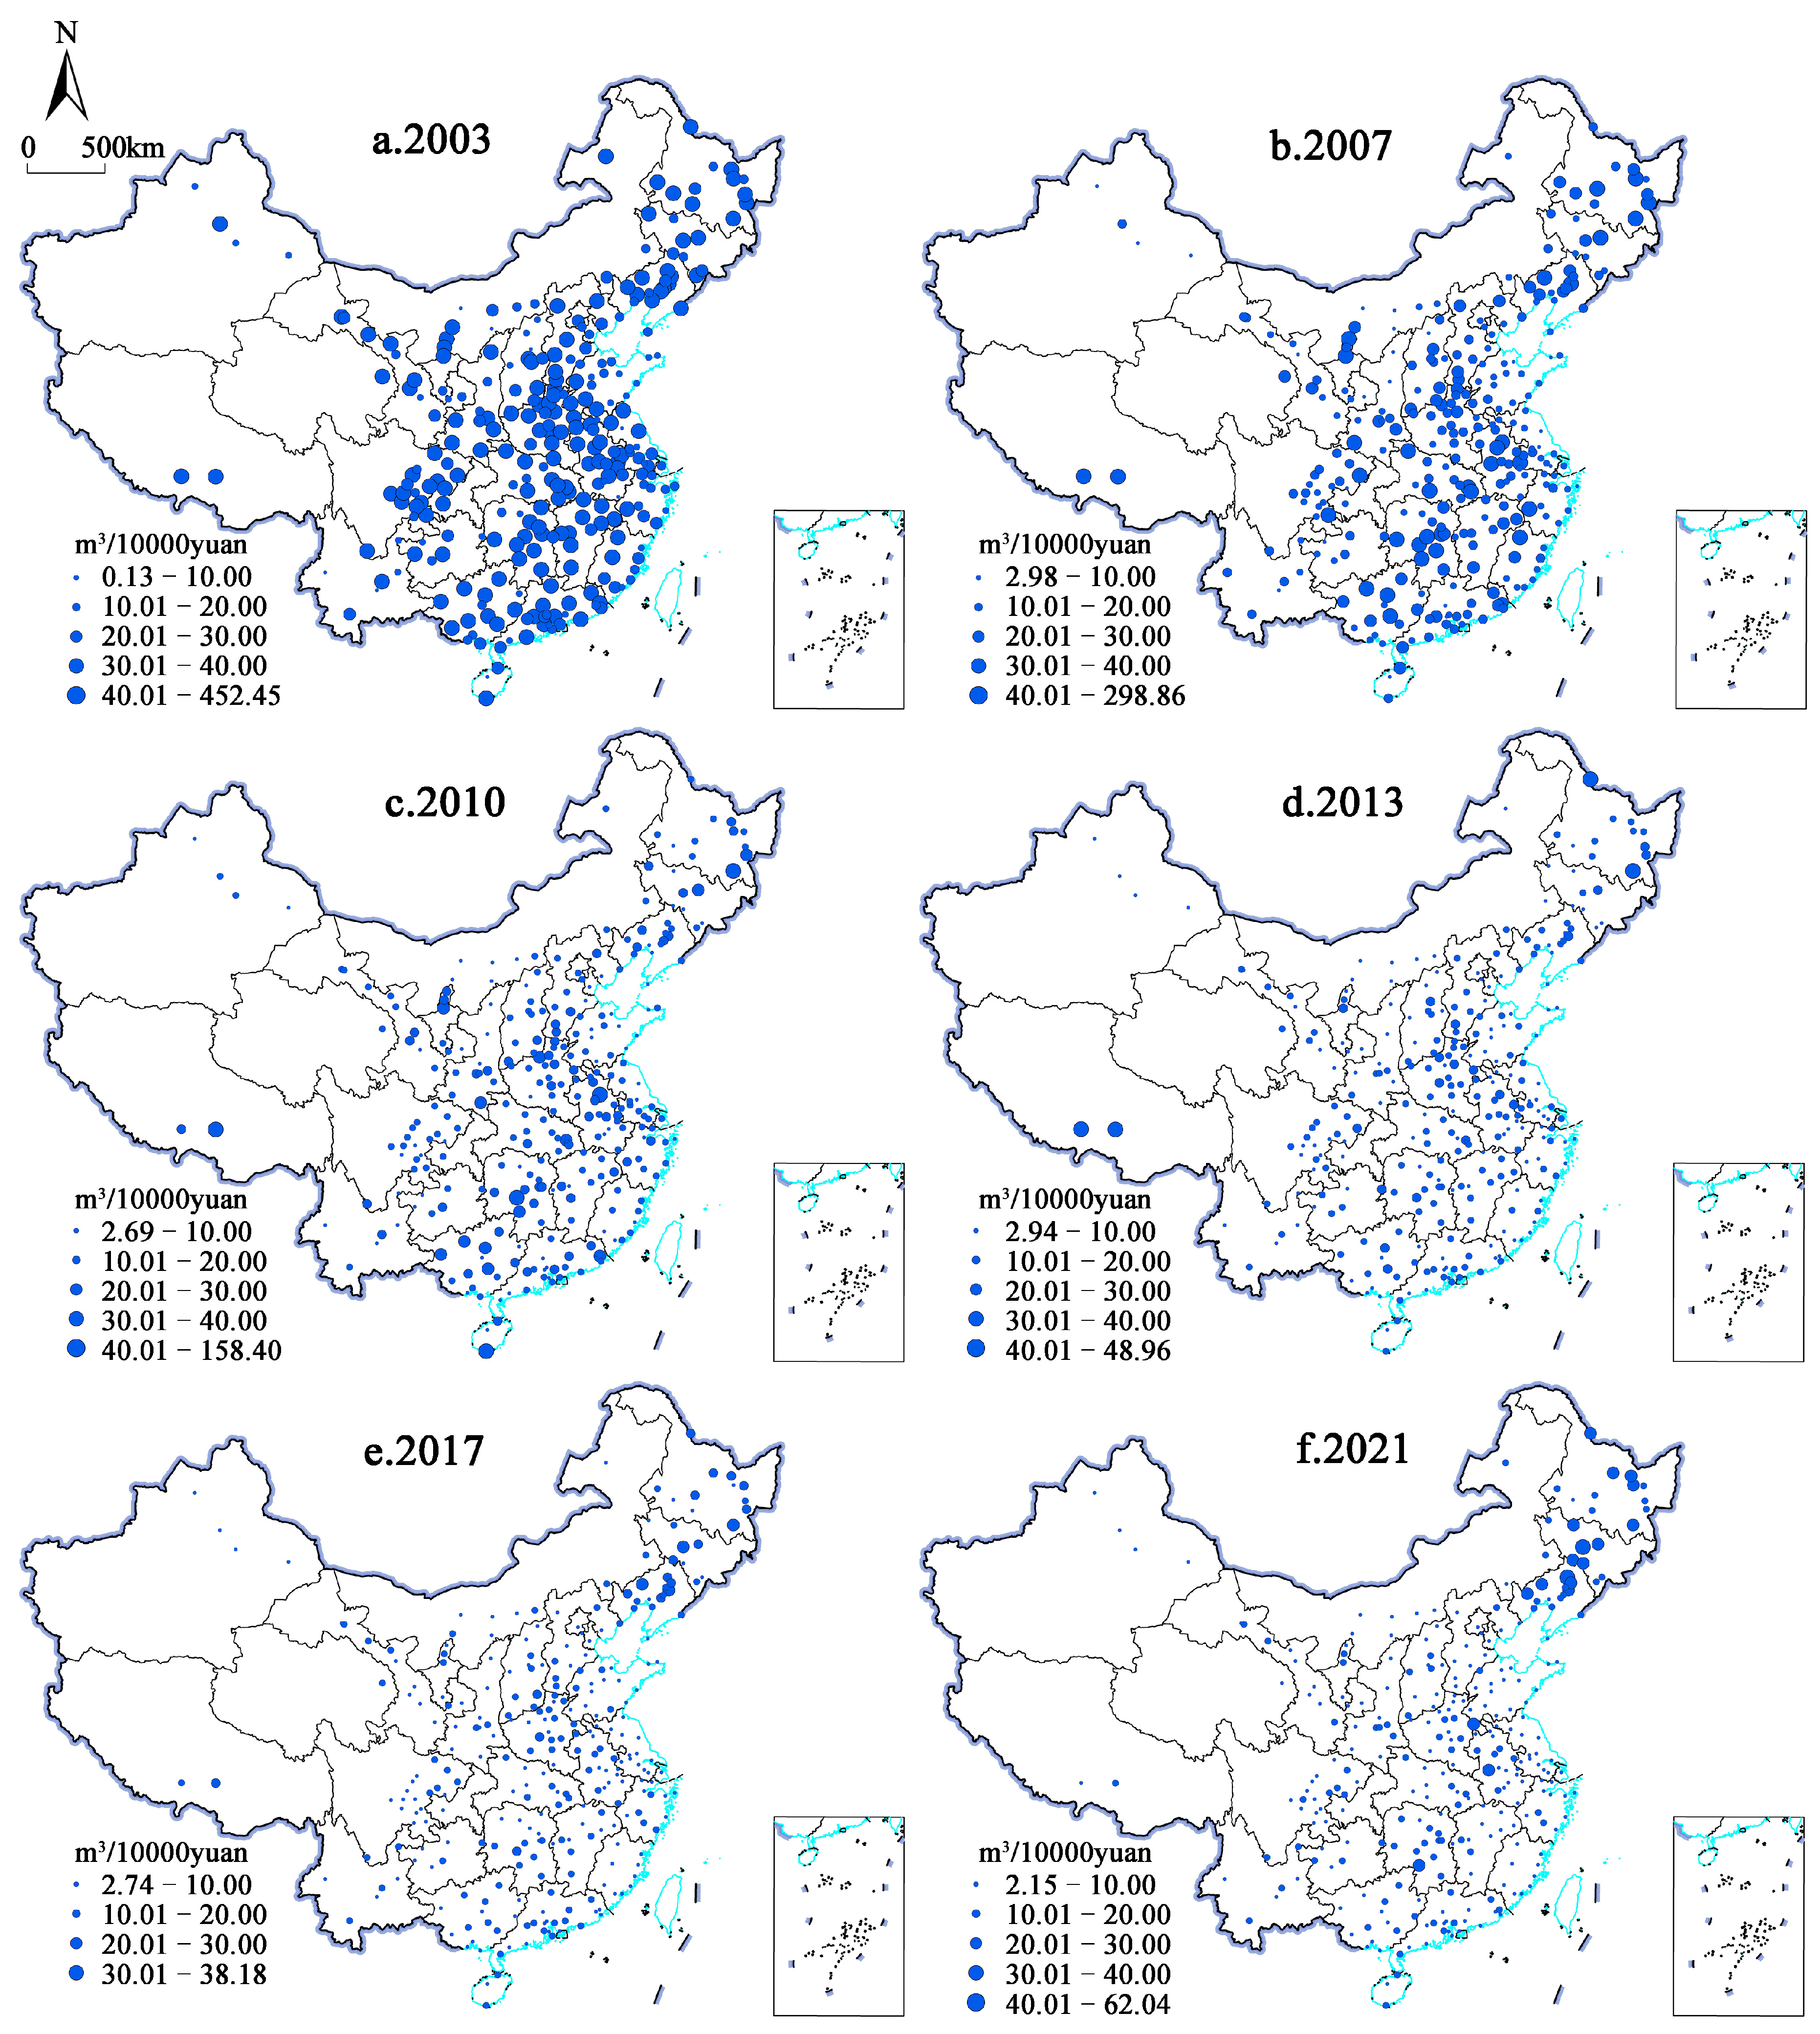
3.1. Spatial and Temporal Distribution and Agglomeration Characteristics of Urban SDI
3.2. Spatial Regression Analysis of Urban SDI
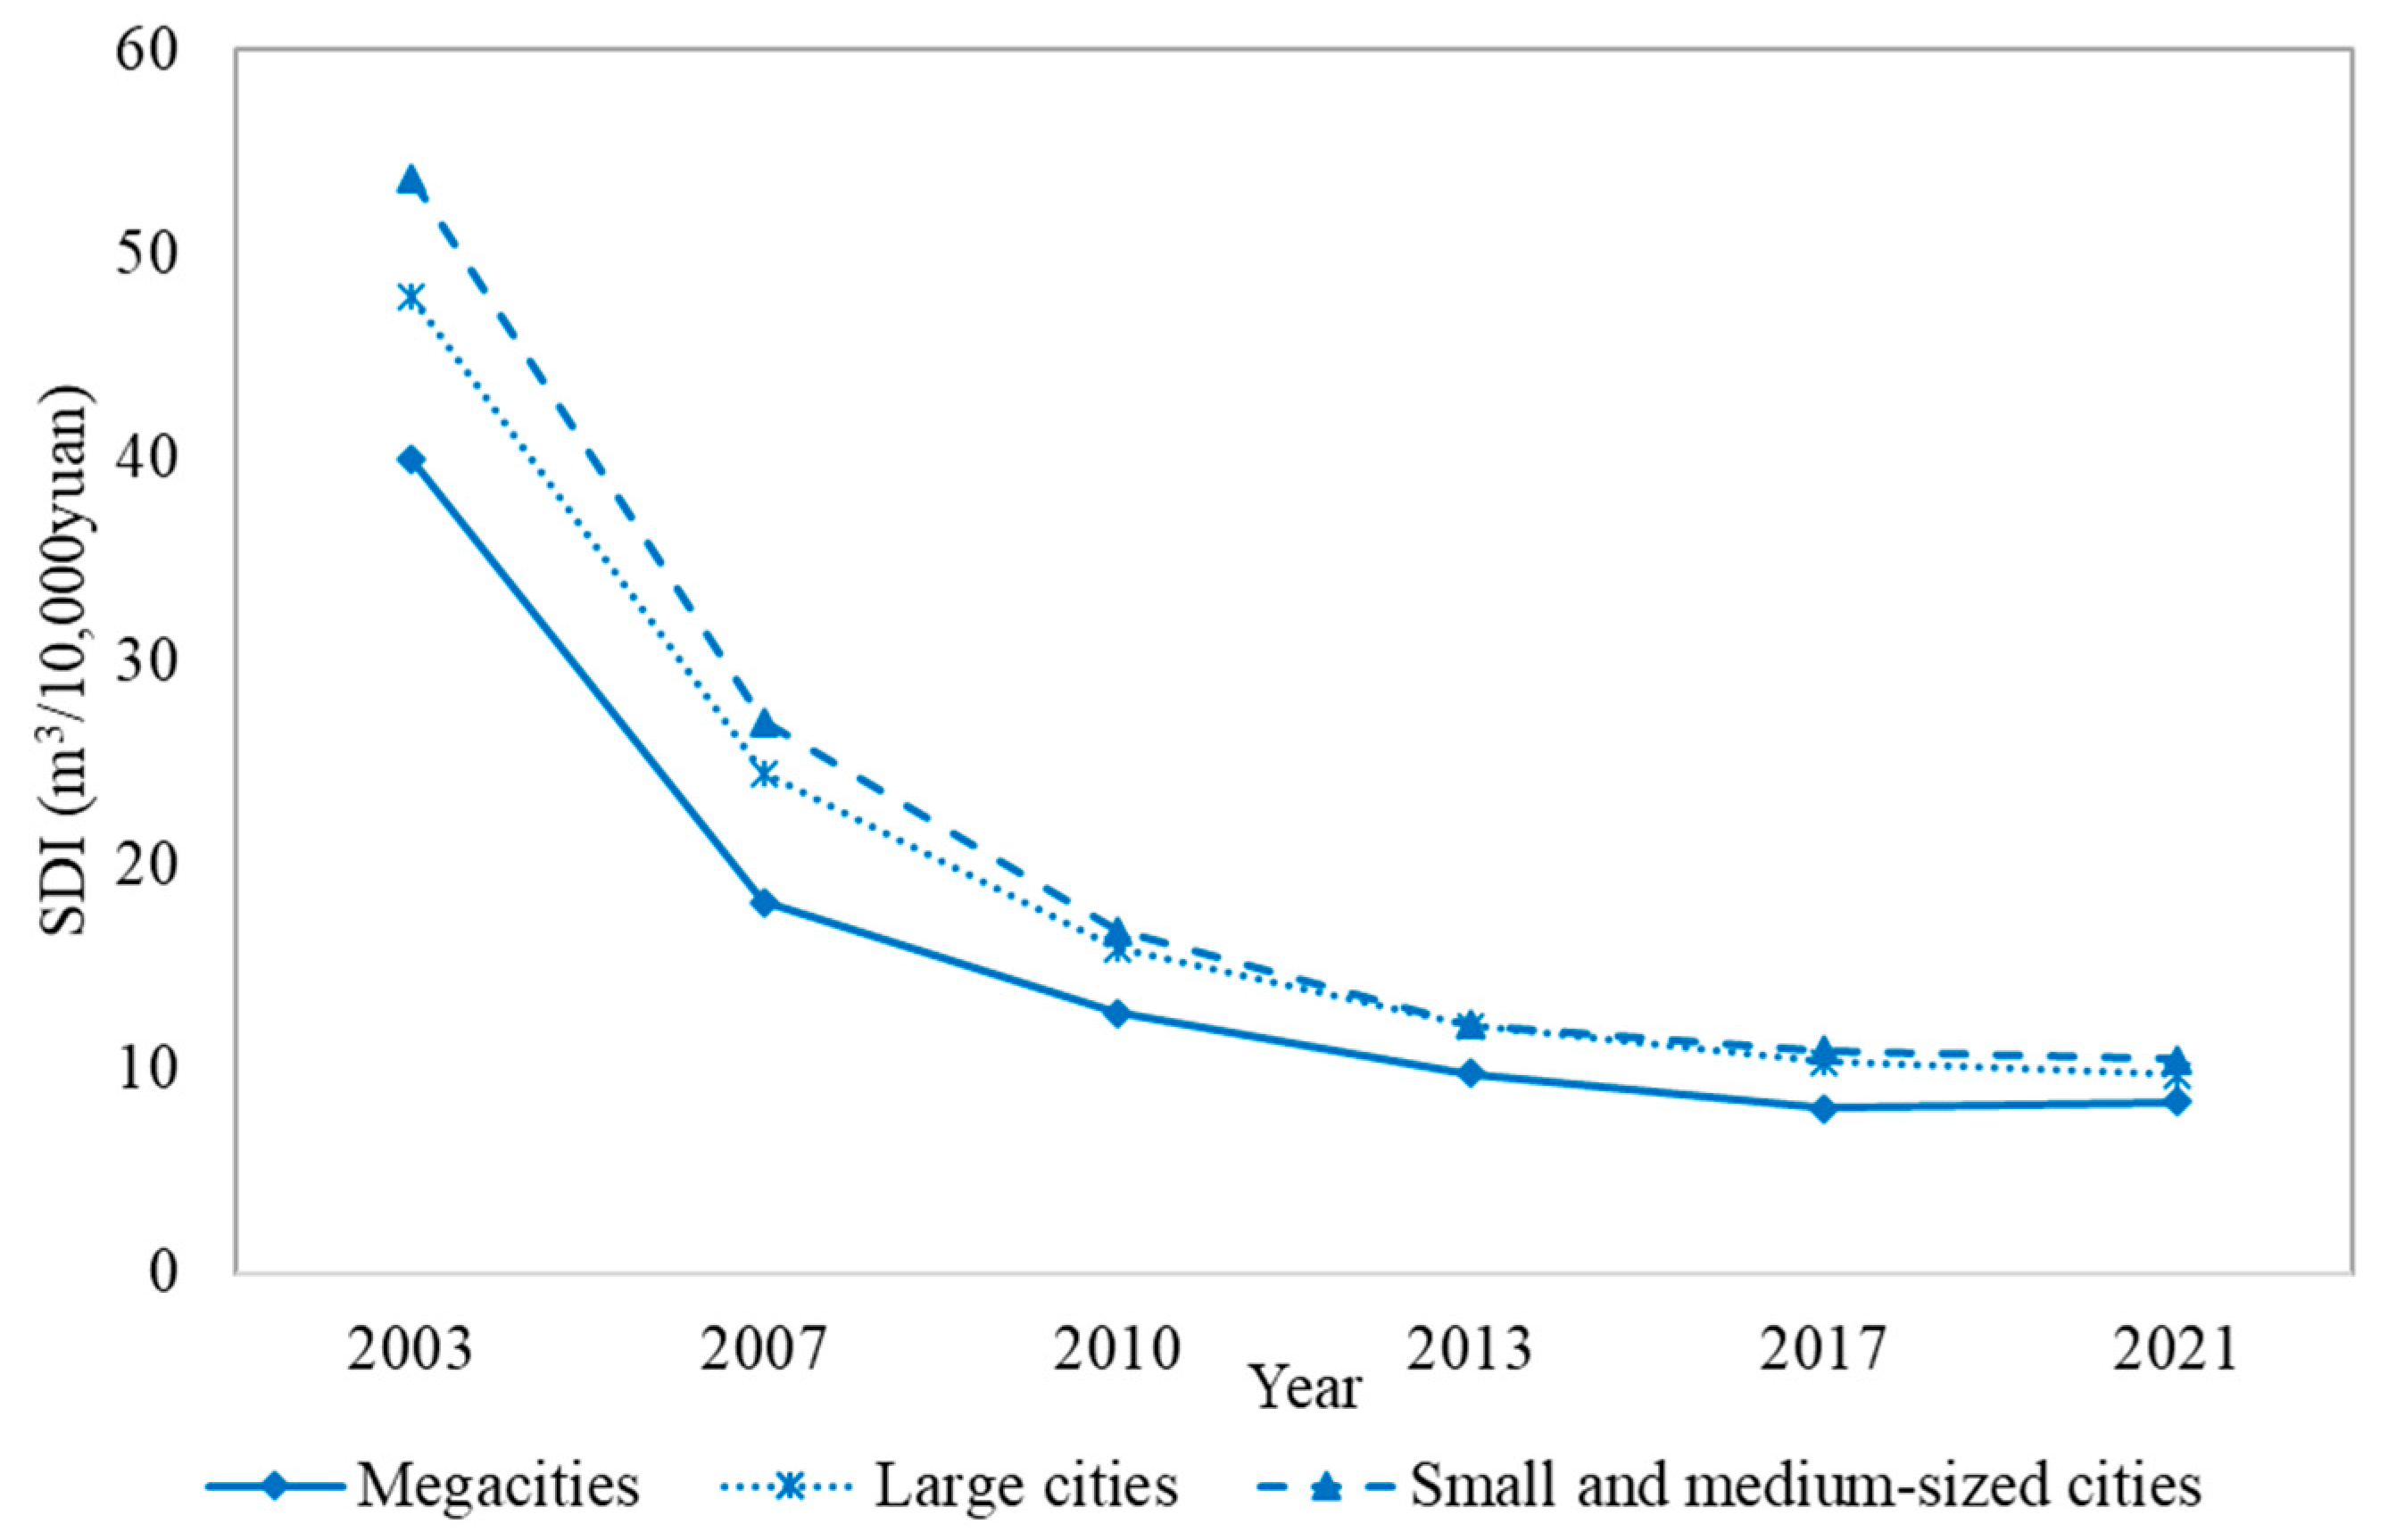
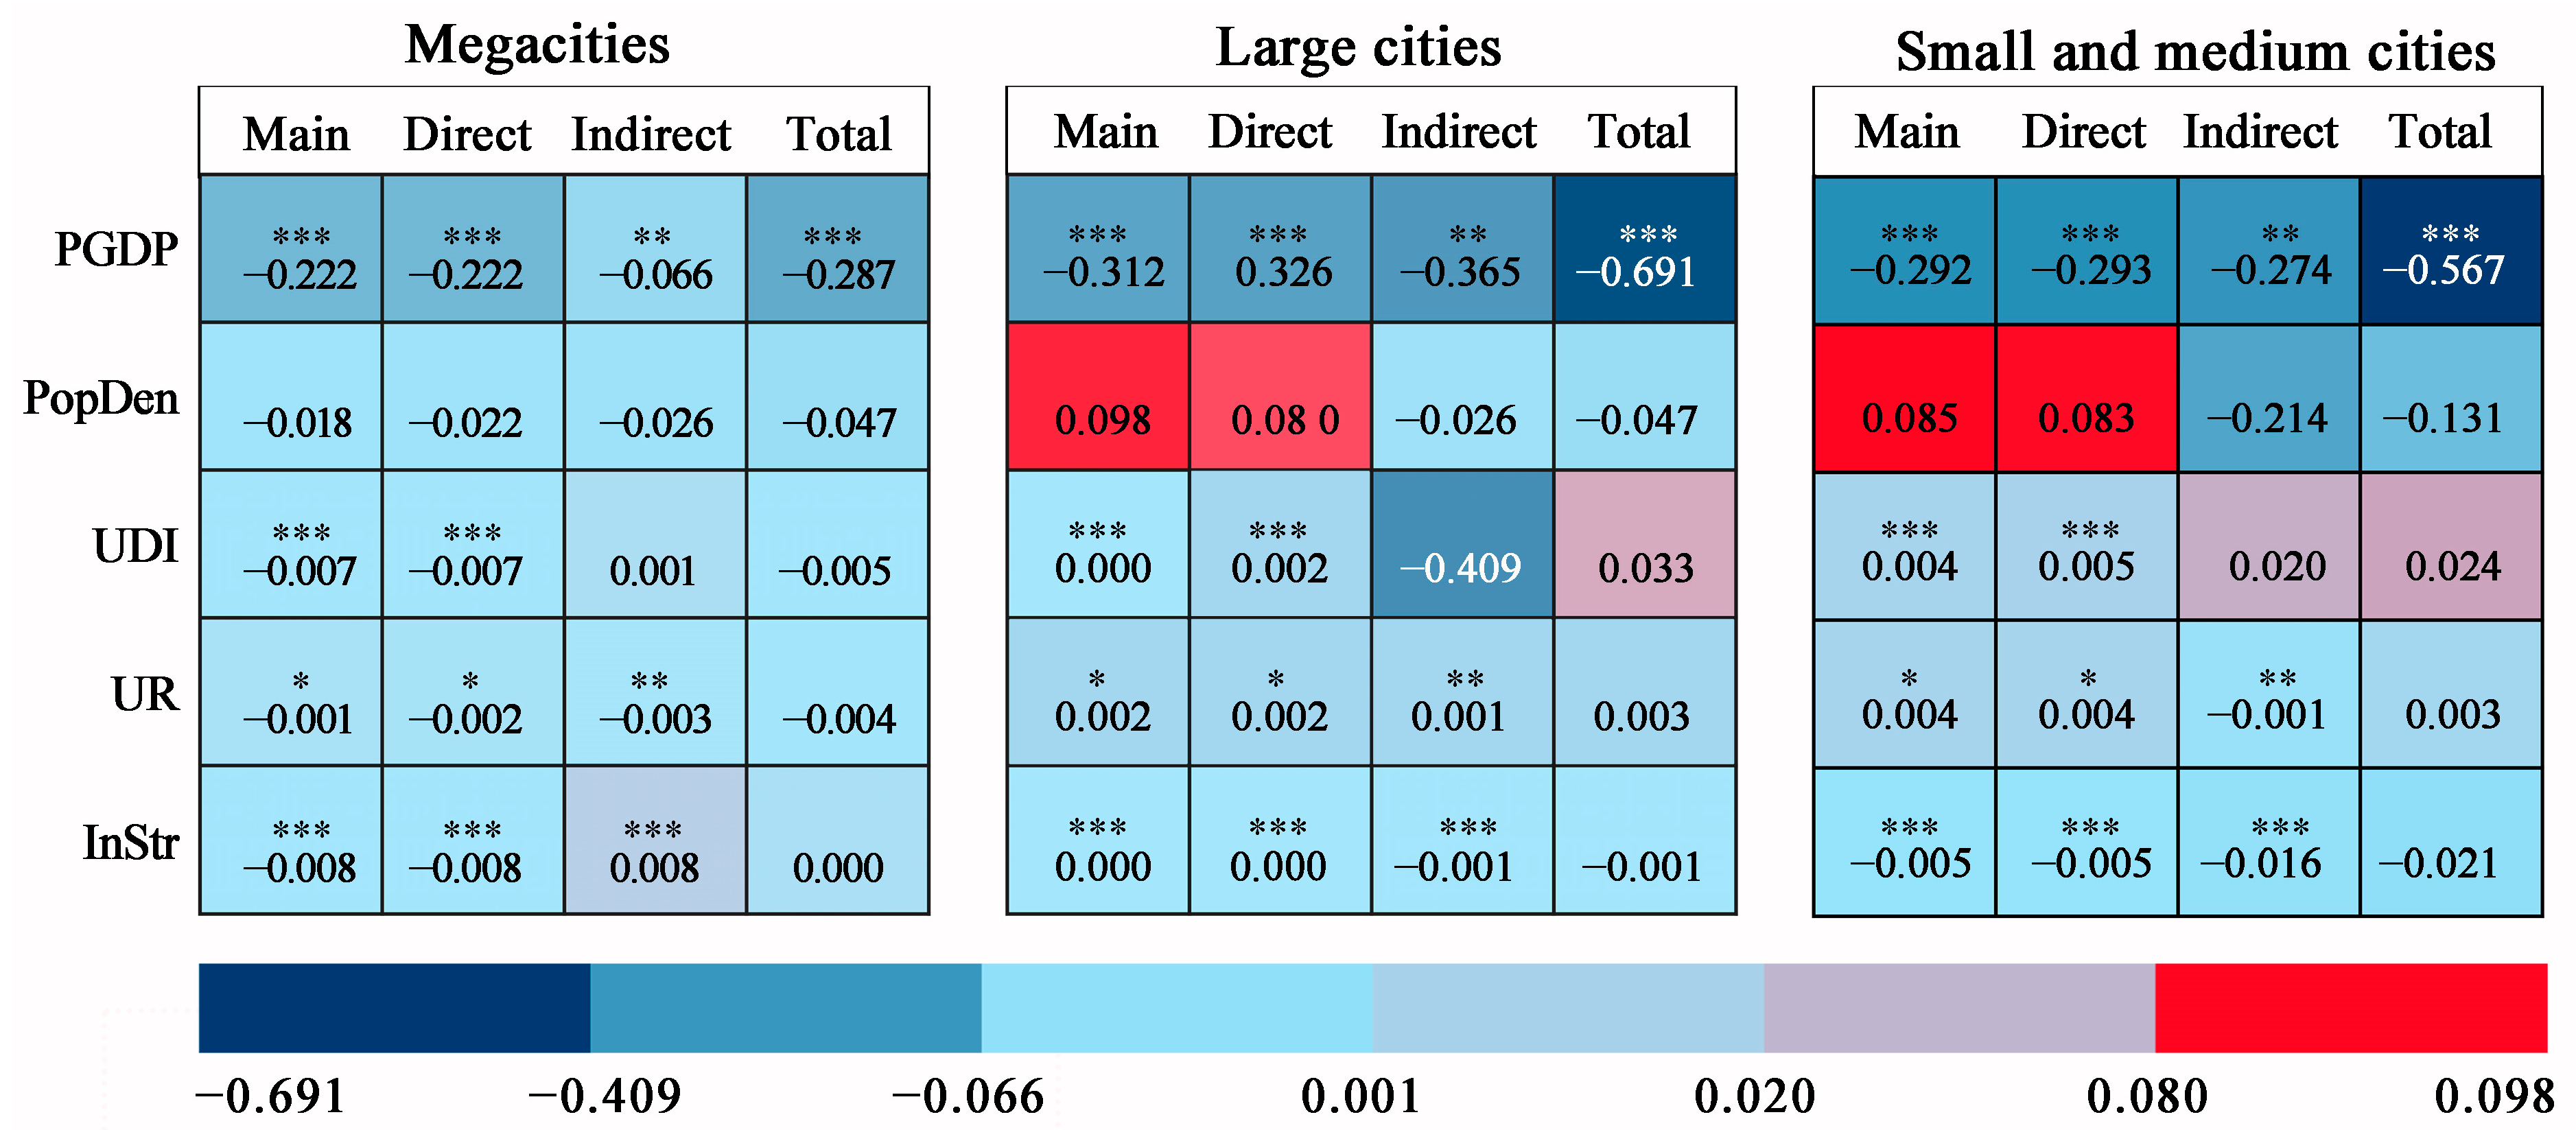
3.3. Impact of EDL of Different-Sized Cities on SDI
4. Discussion
4.1. Spatial and Temporal Variations in Urban SDI
4.2. Relationship Between EDL and SDI
4.3. Limitations
5. Conclusions
Author Contributions
Funding
Data Availability Statement
Acknowledgments
Conflicts of Interest
References
- Bleischwitz, R.; Spataru, C.; VanDeveer, S.D.; Obersteiner, M.; Van Der Voet, E.; Johnson, C.; Andrews-Speed, P.; Boersma, T.; Hoff, H.; Van Vuuren, D.P. Resource nexus perspectives towards the United Nations Sustainable Development Goals. Nat. Sustain. 2018, 1, 737–743. [Google Scholar] [CrossRef]
- Gain, A.K.; Giupponi, C.; Wada, Y. Measuring global water security towards sustainable development goals. Environ. Res. Lett. 2016, 11, 124015. [Google Scholar] [CrossRef]
- Zhuo, C.F.; Mao, Y.H.; Rong, J.X. Policy dividend or “policy trap”? Environmental welfare of establishing free trade zone in China. Sci. Total Environ. 2021, 756, 143856. [Google Scholar] [CrossRef] [PubMed]
- Long, S.; Zhao, L.; Shi, T.; Li, J.; Yang, J.; Liu, H.; Mao, G.; Qiao, Z.; Yang, Y. Pollution control and cost analysis of wastewater treatment at industrial parks in Taihu and Haihe water basins, China. J. Clean Prod. 2018, 172, 2435–2442. [Google Scholar] [CrossRef]
- Liu, M.; Wang, Y.; Liu, R.; Ding, C.; Zhou, G.X.; Han, L. How magnitude of PM2.5 exposure disparities have evolved across Chinese urban-rural population during 2010–2019. J. Clean Prod. 2023, 382, 135333. [Google Scholar] [CrossRef]
- Qadir, M.; Wichelns, D.; Raschid-Sally, L.; McCornick, P.G.; Drechsel, P.; Bahri, A.; Minhas, P.S. The challenges of wastewater irrigation in developing countries. Agr. Water Manage. 2010, 97, 561–568. [Google Scholar] [CrossRef]
- Cegar, S.; Bogovic, N.D.; Jugovic, A. Impact of intersectoral dependencies in national production on wastewater discharges: An extended input-output study of the Croatian economy. Water 2022, 14, 2122. [Google Scholar] [CrossRef]
- Lasut, M.T.; Jensen, K.R.; Shivakoti, G. Analysis of constraints and potentials for wastewater management in the coastal city of Manado, North Sulawesi, Indonesia. J. Environ. Manag. 2008, 88, 1141–1150. [Google Scholar] [CrossRef] [PubMed]
- Yin, H.L.; Islam, M.S.; Ju, M.D. Urban river pollution in the densely populated city of Dhaka, Bangladesh: Big picture and rehabilitation experience from other developing countries. J. Clean Prod. 2021, 321, 129040. [Google Scholar] [CrossRef]
- Wei, H.R.; Zhang, Y.; Xiu, P.S.; Zhang, H.F.; Zhu, S.K. Index-based analysis of industrial structure and environmental efficiency based on sewage discharge assessment in China. Alex. Eng. J. 2022, 61, 493–500. [Google Scholar] [CrossRef]
- Bu, Y.; Wang, E.D.; Jiang, Z.Y. Evaluating spatial characteristics and influential factors of industrial wastewater discharge in China: A spatial econometric approach. Ecol. Indic. 2021, 121, 107219. [Google Scholar] [CrossRef]
- Ma, B.; Tian, G.; Kong, L. Spatial-temporal characteristics of China’s industrial wastewater discharge at different scales. Environ. Sci. Pollut. Res. 2020, 27, 8103–8118. [Google Scholar] [CrossRef] [PubMed]
- Chen, M.; Chen, H.Q. Spatiotemporal coupling measurement of industrial wastewater discharge and industrial economy in China. Environ. Sci. Pollut. Res. 2021, 28, 46319–46333. [Google Scholar] [CrossRef] [PubMed]
- Zhang, C.; Wei, T.; Wang, Y.; Zhu, X.D. Driving forces and spatio-temporal differentiation of pollutants discharge from industrial wastewater and domestic sewage in Fujian Province. Acta Sci. Circumst. 2022, 42, 485–494. [Google Scholar]
- Shen, C.Y.; Yang, Z.J.; Li, L. The spatial and temporal evolution characteristics and influencing factors of industrial pollution in North China. Energy Rep. 2023, 9, 267–271. [Google Scholar] [CrossRef]
- Ruan, F.L.; Yan, L. Interactions among electricity consumption, disposable income, wastewater discharge, and economic growth: Evidence from megacities in China from 1995 to 2018. Energy 2022, 260, 124910. [Google Scholar] [CrossRef]
- Wang, W.; Wang, H.F. A simulation study of an innovation-driven sustainable development model and its impacts and applications: A case study of the Yangtze River Economic Belt. Environ. Prog. Sustain. Energy 2021, 42, e13999. [Google Scholar] [CrossRef]
- Chen, H.; Hu, W.Z. Determining whether trade can affect regional environmental sustainability from the perspective of environmental pollution. Sustainability 2020, 12, 1746. [Google Scholar] [CrossRef]
- Tang, Z.P.; Mei, Z.A.; Song, T.; Yang, C.X. Gearing urban metabolism toward the carbon neutrality target: A case study of Hebei province, China. Energies 2022, 15, 5243. [Google Scholar] [CrossRef]
- Zhang, Y.Y.; Sun, M.Y.; Yang, R.J.; Li, X.H.; Zhang, L.; Li, M.Y. Decoupling water environment pressures from economic growth in the Yangtze River Economic Belt, China. Ecol. Indic. 2021, 122, 107314. [Google Scholar] [CrossRef]
- Zhu, L.Y.; Chen, Y.Y.; Wang, Y.W.; Wei, Y.S.; Zheng, H.; Zhang, Y.X. A comprehensive analysis of impacts of socio-economic development and land use on river water quality in a megacity-region: A case study. Environ. Res. Commun. 2023, 5, 025006. [Google Scholar] [CrossRef]
- Zhang, Y.; Liu, W.X.; Cai, Y.; Khan, S.U.; Zhao, M.J. Decoupling analysis of water use and economic development in arid region of China-Based on quantity and quality of water use. Sci. Total Environ. 2021, 761, 143275. [Google Scholar] [CrossRef] [PubMed]
- Jiang, Z.Y.; Li, Z.B.; Wang, Z.J. Whether openness and inclusiveness exacerbates urban pollution: Evidence from China. J. Urban Plan. Dev. 2022, 148, 05022018. [Google Scholar] [CrossRef]
- Leng, J.F.; Yuan, L.D. An empirical of the environmental Kuznets curve in the Huaihe River basin. Fresenius Environ. Bull. 2021, 30, 8740–8748. [Google Scholar]
- Liang, X.D.; Gong, Q.X.; Zheng, H.T.; Xu, J. Examining the impact factors of the water environment using the extended STIRPAT model: A case study in Sichuan. Environ. Sci. Pollut. Res. 2020, 27, 12942–12952. [Google Scholar] [CrossRef] [PubMed]
- Shen, Z.H. Coordinated environment and economy in coastal development based on industrial wastewater and SO2 emissions. J. Coast. Res. 2020, 109, 13–18. [Google Scholar] [CrossRef]
- Wang, J.N.; Zhao, X.T.; Cai, N.; Chen, M.M.; Wang, H. Pollution discharge and environmental treatment efficiency of rural domestic sewage in China. Res. Environ. Sci. 2020, 33, 2665–2674. [Google Scholar]
- Geng, Y.; Wang, M.; Sarkis, J.; Xue, B.; Zhang, L.; Fujita, T.; Yu, X.; Ren, W.; Zhang, L.; Dong, H. Spatial-temporal patterns and driving factors for industrial wastewater emission in China. J. Clean Prod. 2014, 76, 116–124. [Google Scholar] [CrossRef]
- Hao, Y.; Zheng, S.Q.; Zhao, M.Y.; Wu, H.T.; Guo, Y.X.; Li, Y.W. Reexamining the relationships among urbanization, industrial structure, and environmental pollution in China—New evidence using the dynamic threshold panel model. Energy Rep. 2020, 6, 28–39. [Google Scholar] [CrossRef]
- Zheng, B.Y.; Huang, G.H.; Liu, L.R.; Guan, Y.R.; Zhai, M.Y. Dynamic wastewater-induced research based on input-output analysis for Guangdong Province, China. Environ. Pollut. 2020, 256, 113502. [Google Scholar] [CrossRef] [PubMed]
- Yang, Z.; Li, B.; Xia, R.; Ma, S.; Jia, R.; Ma, C.; Wang, L.; Chen, Y.; Bin, L. Understanding China’s industrialization driven water pollution stress in 2002–2015—A multi-pollutant based net gray water footprint analysis. J. Environ. Manag. 2022, 310, 114735. [Google Scholar] [CrossRef] [PubMed]
- Anselin, L.; Syabri, I.; Kho, Y. GeoDa: An introduction to spatial data analysis. Geogr. Anal. 2006, 38, 5–22. [Google Scholar] [CrossRef]
- Wang, Y.; Wu, K.M.; Zhao, Y.B.; Wang, C.J.; Zhang, H.O. Examining the effects of the built environment on housing rents in the Pearl River Delta of China. Appl. Spat. Anal. Policy 2022, 15, 289–313. [Google Scholar] [CrossRef]
- Arbia, G. Spatial Econometrics: Statistical Foundations and Applications to Regional Economic Growth; Springer: Berlin/Heidelberg, Germany, 2006. [Google Scholar]
- Lesage, J.; Pace, R.K. Introduction to Spatial Econometrics; Chapman and Hall/CRC: London, UK, 2009. [Google Scholar]
- Xu, J.; Xu, Z.X. China sewage treatment engineering issues assessment. J. Clean Prod. 2022, 377, 134391. [Google Scholar] [CrossRef]
- Ren, F.R.; Liu, X.Y.; Ji, L.L.; Lou, Z.X.; Yuan, X.M. The emission reduction effect of industrial wastewater in the pilot city policy of water ecological civilization. Ecol. Indic. 2024, 159, 111702. [Google Scholar] [CrossRef]
- Yao, T.; Wei, Y.G.; Zhang, J.H.; Wang, Y.N.; Yu, Y.J.; Huang, W.Y. What influences the urban sewage discharge in China? The effect of diversified factors on the urban sewage discharge in different regions of China. Environ. Dev. Sustain. 2022, 24, 6099–6135. [Google Scholar] [CrossRef]
- Liu, B.; Tang, J.; Qu, Y.; Yang, Y.; Lyu, H.; Dai, Y.; Li, Z. A GIS-based method for identification of blindness in former site selection of sewage treatment plants and exploration of optimal siting areas: A case study in Liao River Basin. Water 2022, 14, 1092. [Google Scholar] [CrossRef]
- He, Y.H.; Tang, C.C.; Wang, Z.R. Spatial patterns and influencing factors of sewage treatment plants in the Guangdong-Hong Kong-Macau Greater Bay Area, China. Sci. Total Environ. 2021, 792, 148430. [Google Scholar] [CrossRef] [PubMed]
- Tao, M.M.; Wen, L.; Sheng, M.S.; Poletti, S. Appraising the role of energy conservation and emission reduction policy for eco-friendly productivity improvements: An entropy-balancing DID approach. Energy Econ. 2024, 132, 107422. [Google Scholar] [CrossRef]
- Lv, L.; Chen, C.; Wang, Z. Spatiotemporal differentiation and the obstacle factors influencing the coupling coordination between economic development and water pollution control capability in the Yangtze River Economic Belt. Environ. Sci. Pollut. Res. 2022, 29, 75681–75698. [Google Scholar] [CrossRef] [PubMed]
- Zhang, K.; Shao, S.; Fan, S. Market integration and environmental quality: Evidence from the Yangtze River delta region of China. J. Environ. Manag. 2020, 261, 110208. [Google Scholar] [CrossRef] [PubMed]
- Wu, C.; Li, Y.; Qi, L. Assessing the impact of green transformation on ecological well-being performance: A case study of 78 cities in western China. Int. J. Environ. Res. Public Health 2022, 9, 11200. [Google Scholar] [CrossRef] [PubMed]
- Zhang, Y.; Cai, Q. Impact mechanism of new urbanization on environmental pollution: Empirical analysis based on spatial panel model. Front. Public Health 2022, 10, 928100. [Google Scholar] [CrossRef] [PubMed]
- Liang, Y.; Zhang, J.; Zhou, K. Study on driving factors and spatial effects of environmental pollution in the Pearl River-Xijiang River Economic Belt, China. Int. J. Environ. Res. Public Health 2022, 19, 6833. [Google Scholar] [CrossRef] [PubMed]
- Zhou, K.; Wu, J.X.; Qian, Z.D.; Fan, J.; Wang, Q. Spatial effects on emission reduction of water pollutants and its driving forces in Yangtze River Economic Belt. China Environ. Sci. 2020, 40, 885–895. [Google Scholar]
- Mu, L.; Tan, Z.; Luo, C.X.; Qiao, N. Exploring the contribution of the river chief system on controlling industrial water pollution under quasi-natural experimental conditions. Environ. Sci. Pollut. Res. 2023, 30, 89415–89429. [Google Scholar] [CrossRef] [PubMed]
- Xi, B.; Zhai, P. Economic growth, industrial structure upgrading and environmental pollution: Evidence from China. Kybernetes 2023, 52, 518–553. [Google Scholar] [CrossRef]


| Indicator | Variables | Symbol | Unit | Expected Direction |
|---|---|---|---|---|
| Sewage discharge intensity | Sewage discharge per unit of GDP | SDI | m3/10,000 yuan | / |
| Economic development level | GDP per capita | PGDP | Yuan | + |
| Population agglomeration degree | Population density | PopDen | person/km2 | + |
| Urban development intensity | The proportion of built-up area to urban area | UDI | % | + |
| Urbanization rate | The proportion of the urban population to the urban area population | UR | % | + |
| Industrial structure | The ratio of the added value of the secondary industry to the GDP | InStr | % | + |
| Variables | Unit | Min | Max | Mean | Std. Dev |
|---|---|---|---|---|---|
| SDI | m3/10,000 yuan | 0.1251 | 452.4525 | 19.4702 | 22.2846 |
| PGDP | Yuan | 2511.0000 | 467,749.0000 | 51,844.6455 | 37,255.2272 |
| PopDen | person/km2 | 4.9344 | 8901.3290 | 905.4758 | 857.6030 |
| UDI | % | 0.0305 | 92.7835 | 7.7034 | 8.5756 |
| UR | % | 7.2976 | 100.0000 | 64.3486 | 23.9445 |
| InStr | % | 8.0500 | 90.9700 | 47.76378 | 12.4745 |
| Year | Moran’s I | p | Z-Value |
|---|---|---|---|
| 2003 | 0.0490 | 0.0004 | 3.5231 |
| 2007 | 0.0490 | 0.0001 | 3.9255 |
| 2010 | 0.0277 | 0.0206 | 2.3154 |
| 2013 | 0.0772 | 0.0000 | 5.1941 |
| 2017 | 0.2503 | 0.0000 | 16.1993 |
| 2021 | 0.3005 | 0.0000 | 19.8844 |
| Model (1) | Model (2) | Model (3) | Model (4) | |
|---|---|---|---|---|
| No fixed effect | Individual fixed effect | Time-fixed effect | Individual–time double fixed effect | |
| PGDP | −0.673 *** | −0.828 *** | −0.432 *** | −0.350 *** |
| (−71.89) | (−94.69) | (−31.57) | (−15.55) | |
| PopDen | 0.068 *** | 0.113 *** | 0.056 *** | 0.056 *** |
| (7.55) | (6.24) | (6.51) | (3.23) | |
| UDI | 0.002 | −0.001 | 0.002 | 0.003 ** |
| (1.33) | (−0.52) | (1.35) | (2.13) | |
| UR | 0.012 *** | 0.005 *** | 0.009 *** | 0.003 *** |
| (35.61) | (10.82) | (28.67) | (6.36) | |
| InStr | 0.002 *** | 0.000 | −0.003 *** | −0.006 *** |
| (3.23) | (0.64) | (−4.90) | (−6.88) | |
| Constant | 8.504 *** | 10.407 *** | 6.406 *** | 6.098 *** |
| (75.32) | (63.52) | (46.01) | (25.49) | |
| Time-fixed | No | No | Yes | Yes |
| Ind-fixed | No | Yes | No | Yes |
| Observations | 5472 | 5472 | 5472 | 5472 |
| R-squared | 0.526 | 0.791 | 0.575 | 0.814 |
| Variables | Main | Wx | LR_Direct | LR_Indirect | LR_Total |
|---|---|---|---|---|---|
| PGDP | −0.245 *** | −0.251 *** | −0.248 *** | −0.322 *** | −0.570 *** |
| (−10.725) | (−6.295) | (−10.628) | (−7.945) | (−13.444) | |
| PopDen | 0.071 *** | −0.153 *** | 0.068 *** | −0.163 ** | −0.095 |
| (4.334) | (−2.911) | (4.281) | (−2.576) | (−1.383) | |
| UDI | 0.002 | 0.015 *** | 0.002 * | 0.017 *** | 0.020 *** |
| (1.409) | (2.971) | (1.710) | (3.257) | (3.509) | |
| UR | 0.003 *** | −0.002 * | 0.003 *** | −0.002 | 0.001 |
| (7.760) | (−1.857) | (8.077) | (−1.405) | (1.170) | |
| InStr | −0.004 *** | −0.016 *** | −0.004 *** | −0.019 *** | −0.023 *** |
| (−4.312) | (−8.771) | (−4.825) | (−9.659) | (−11.426) | |
| Spatial rho | 0.140 *** | 0.140 *** | 0.140 *** | 0.140 *** | 0.140 *** |
| (4.915) | (4.915) | (4.915) | (4.915) | (4.915) | |
| Variance sigma2_e | 0.092 *** | 0.092 *** | 0.092 *** | 0.092 *** | 0.092 *** |
| (52.285) | (52.285) | (52.285) | (52.285) | (52.285) | |
| Time-fixed | Yes | Yes | Yes | Yes | Yes |
| Ind-fixed | Yes | Yes | Yes | Yes | Yes |
| Observations | 5472 | 5472 | 5472 | 5472 | 5472 |
| R-squared | 0.645 | 0.645 | 0.645 | 0.645 | 0.645 |
| Number of cities | 288 | 288 | 288 | 288 | 288 |
| City Scale | Variables | Main Effect | Direct Effect | Indirect Effect | Total Effect | ||||
|---|---|---|---|---|---|---|---|---|---|
| Coefficient | Z-Value | Coefficient | Z-Value | Coefficient | Z-Value | Coefficient | Z-Value | ||
| Megacities | PGDP | −0.222 *** | (−4.290) | −0.222 *** | (−4.101) | −0.066 ** | (−2.231) | −0.287 *** | (−5.590) |
| PopDen | −0.018 | (−0.440) | −0.022 | (−0.522) | −0.026 | (−0.457) | −0.047 | (−0.611) | |
| UDI | −0.007 *** | (−3.221) | −0.007 *** | (−3.183) | 0.001 | (0.465) | −0.005 | (−1.365) | |
| UR | −0.001 * | (−1.695) | −0.002 * | (−1.926) | −0.003 ** | (−2.267) | −0.004 *** | (−2.719) | |
| InStr | −0.008 *** | (−3.351) | −0.008 *** | (−3.499) | 0.008 *** | (4.523) | 0.000 | (0.107) | |
| R-squared: 0.788; spatial rho: 0.059; variance sigma2_e: 0.022 *** | |||||||||
| Large cities | PGDP | −0.312 *** | (−7.681) | −0.326 *** | (−7.890) | −0.365 *** | (−6.446) | −0.691 *** | (−9.663) |
| PopDen | 0.098 *** | (2.829) | 0.080 ** | (2.385) | −0.026 | (−7.194) | −0.047 | (−5.241) | |
| UDI | 0.000 | (0.119) | 0.002 | (0.695) | −0.409 *** | (5.819) | 0.033 *** | (5.482) | |
| UR | 0.002 ** | (2.499) | 0.002 *** | (2.683) | 0.001 | (0.980) | 0.003 ** | (2.065) | |
| InStr | 0.000 | (−0.177) | 0.000 | (−0.189) | −0.001 | (−0.266) | −0.001 | (−0.328) | |
| R-squared: 0.737; spatial rho: 0.150 ***; variance sigma2_e: 0.074 *** | |||||||||
| Small and medium cities | PGDP | −0.292 *** | (−9.573) | −0.293 *** | (−9.389) | −0.274 *** | (−6.901) | −0.567 *** | (−13.530) |
| PopDen | 0.085 *** | (4.085) | 0.083 *** | (4.090) | −0.214 *** | (−3.266) | −0.131 * | (−1.851) | |
| UDI | 0.004 ** | (2.210) | 0.005 ** | (2.476) | 0.020 *** | (3.500) | 0.024 *** | (4.015) | |
| UR | 0.004 *** | (6.914) | 0.004 *** | (7.185) | −0.001 | (−0.556) | 0.003 ** | (2.415)) | |
| InStr | −0.005 *** | (−4.565) | −0.005 *** | (−4.956) | −0.016 *** | (−8.858) | −0.021 *** | (−10.966) | |
| R-squared: 0.657; spatial rho: 0.059 *; variance sigma2_e: 0.103 *** | |||||||||
Disclaimer/Publisher’s Note: The statements, opinions and data contained in all publications are solely those of the individual author(s) and contributor(s) and not of MDPI and/or the editor(s). MDPI and/or the editor(s) disclaim responsibility for any injury to people or property resulting from any ideas, methods, instructions or products referred to in the content. |
© 2025 by the authors. Licensee MDPI, Basel, Switzerland. This article is an open access article distributed under the terms and conditions of the Creative Commons Attribution (CC BY) license (https://creativecommons.org/licenses/by/4.0/).
Share and Cite
Yue, X.; Wu, Y.; Wang, Y.; Li, W.; Wang, Y.; Sun, G.; Zhang, H. Does Urban Economic Development Increase Sewage Discharge Intensity? A Case Study of 288 Cities in China. Water 2025, 17, 2251. https://doi.org/10.3390/w17152251
Yue X, Wu Y, Wang Y, Li W, Wang Y, Sun G, Zhang H. Does Urban Economic Development Increase Sewage Discharge Intensity? A Case Study of 288 Cities in China. Water. 2025; 17(15):2251. https://doi.org/10.3390/w17152251
Chicago/Turabian StyleYue, Xiaoli, Yingmei Wu, Yang Wang, Wenlu Li, Yufei Wang, Guiquan Sun, and Hong’ou Zhang. 2025. "Does Urban Economic Development Increase Sewage Discharge Intensity? A Case Study of 288 Cities in China" Water 17, no. 15: 2251. https://doi.org/10.3390/w17152251
APA StyleYue, X., Wu, Y., Wang, Y., Li, W., Wang, Y., Sun, G., & Zhang, H. (2025). Does Urban Economic Development Increase Sewage Discharge Intensity? A Case Study of 288 Cities in China. Water, 17(15), 2251. https://doi.org/10.3390/w17152251