
Hydrogeochemical Characteristics, Formation Mechanisms, and Groundwater Evaluation in the Central Dawen River Basin, Northern China

Abstract
1. Introduction
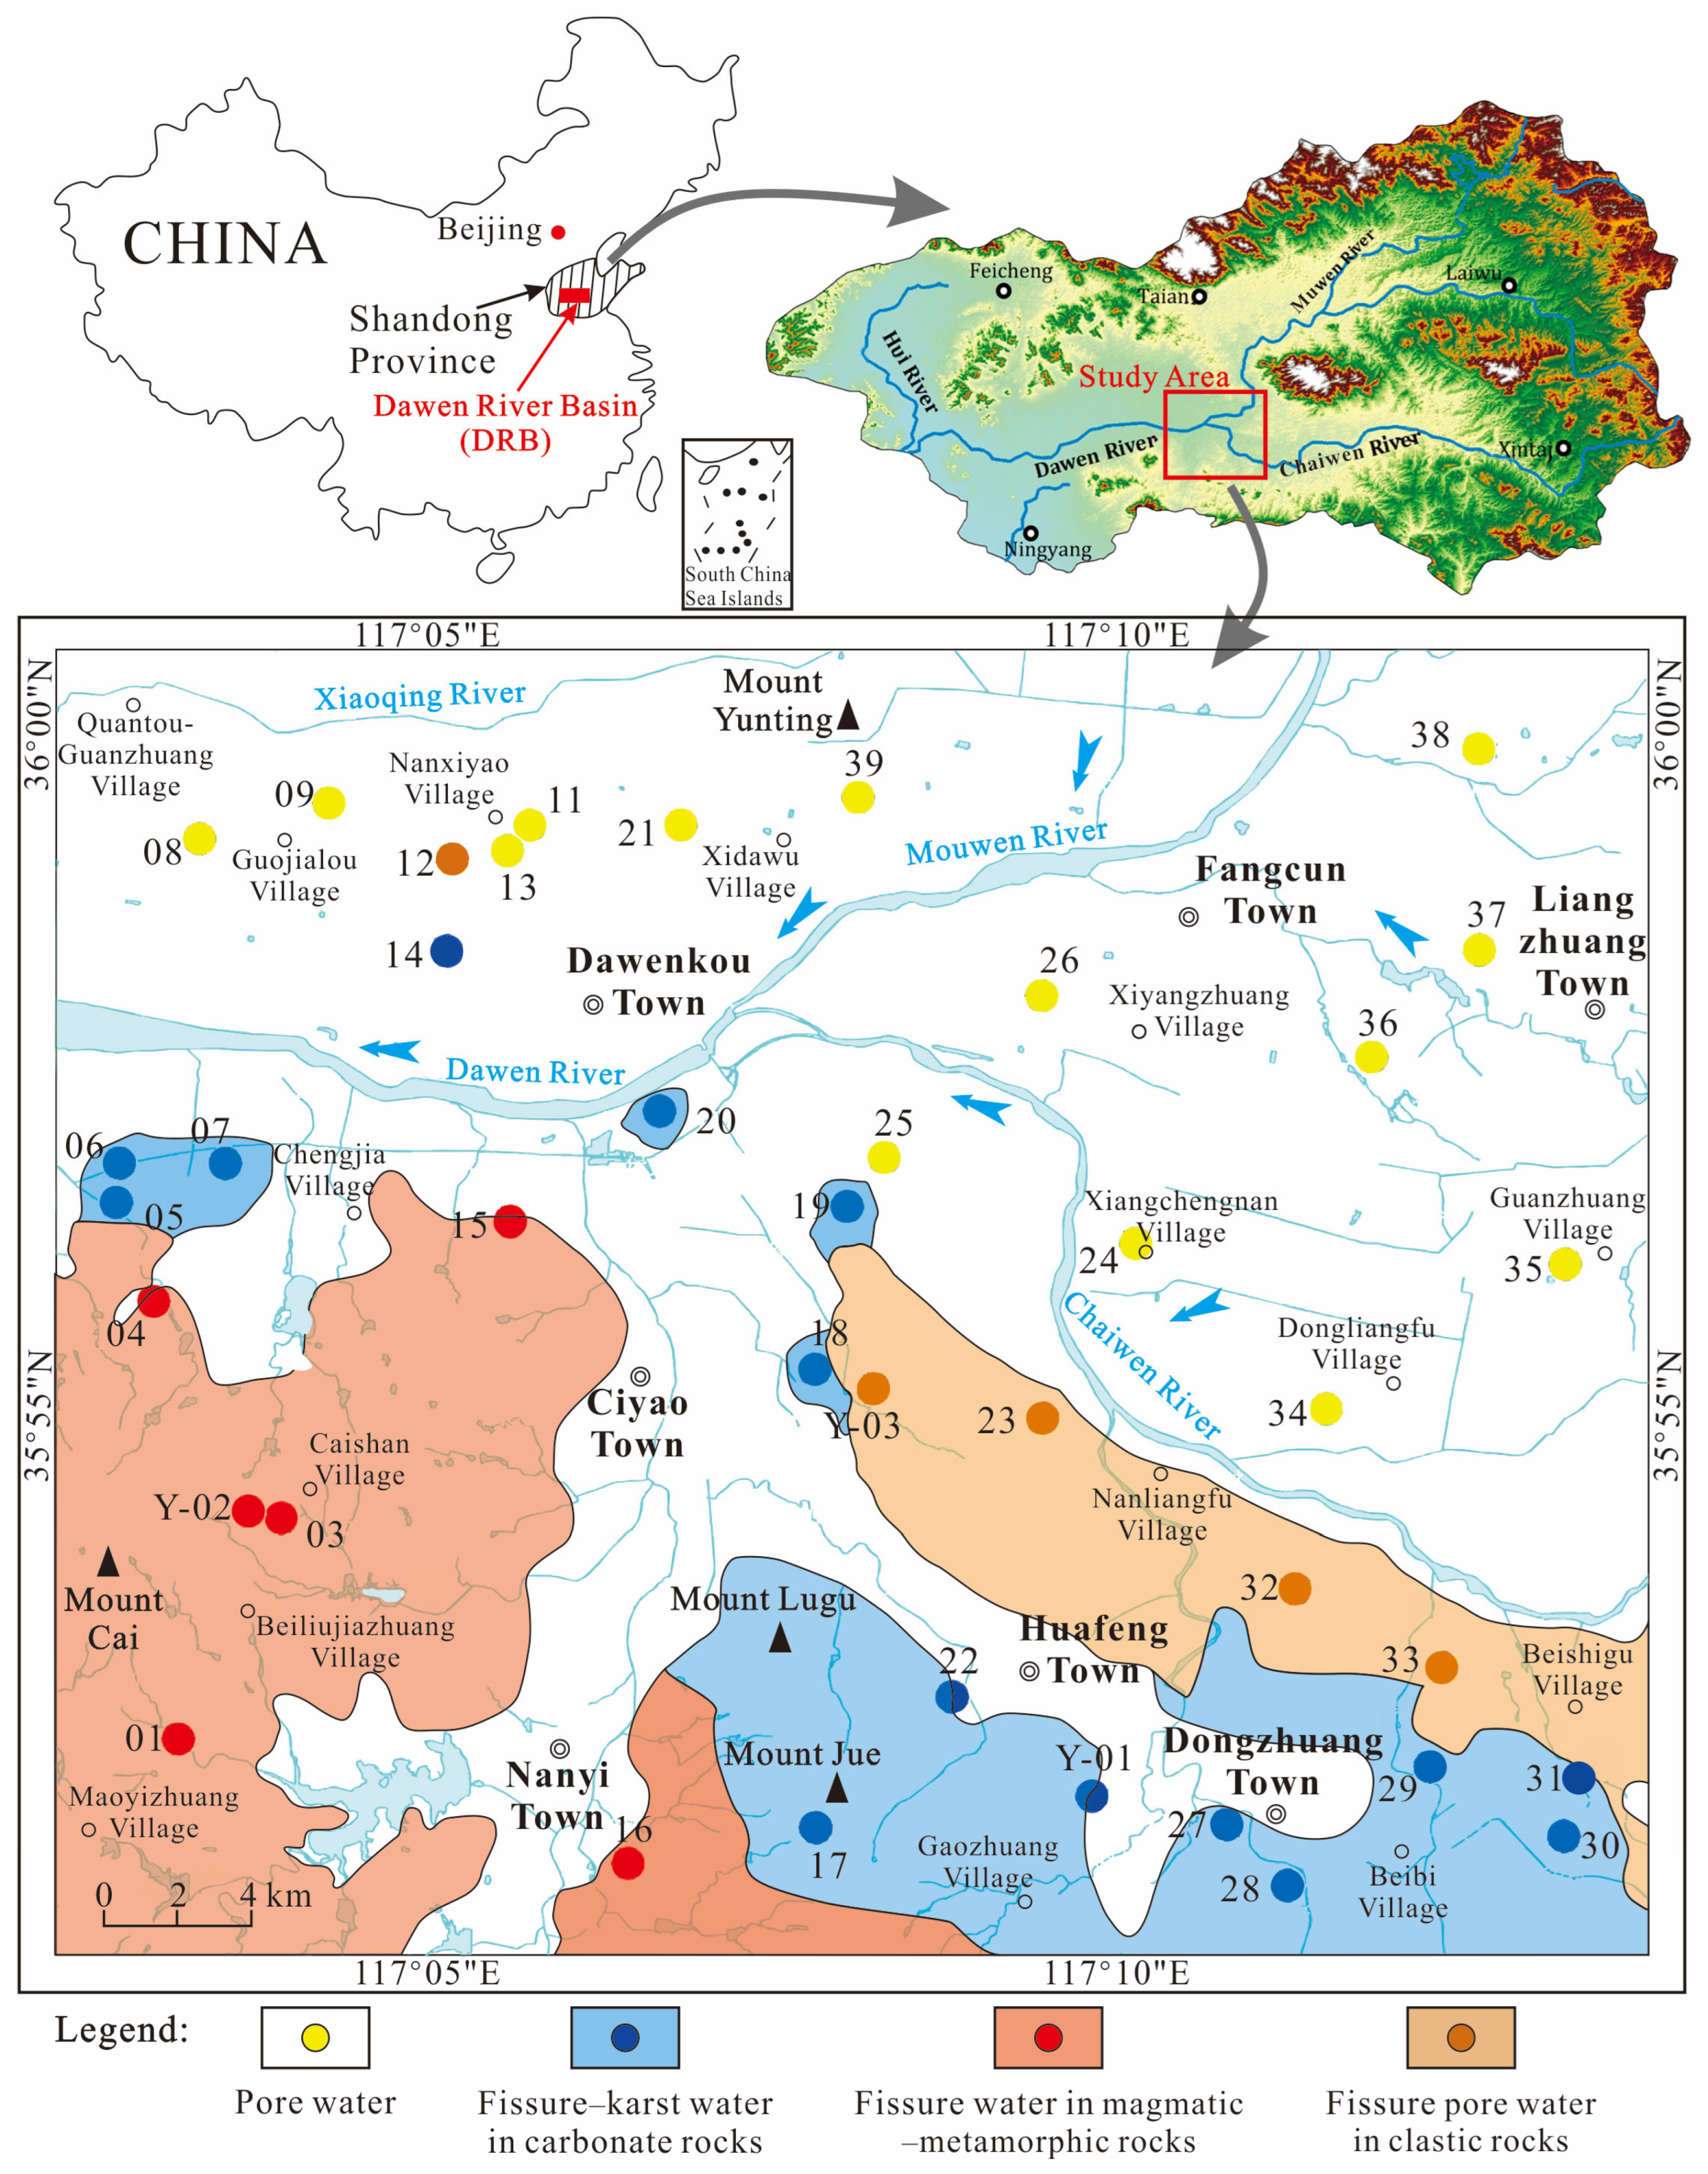
2. Study Area
3. Materials and Methods
3.1. Sample Distribution
3.2. Sample Collection and Analysis
3.2.1. Sample Collection and Preservation
3.2.2. Analytical Methods
3.3. Geostatistical Methods
3.4. EWQI Method
4. Results and Discussion
4.1. Hydrochemical Composition Characteristics
4.2. Groundwater Hydrochemical Types
4.3. Interrelationships Among Chemical Indicators
4.4. Groundwater Recharge Sources
4.5. Assessment of Key Chemical Influences on Groundwater
4.5.1. Water–Rock Interaction
4.5.2. Ion Exchange and Sources of Major Components in Groundwater
4.5.3. Industrial and Agricultural Activity Impacts
4.6. EWQI Assessment
5. Conclusions
- (1)
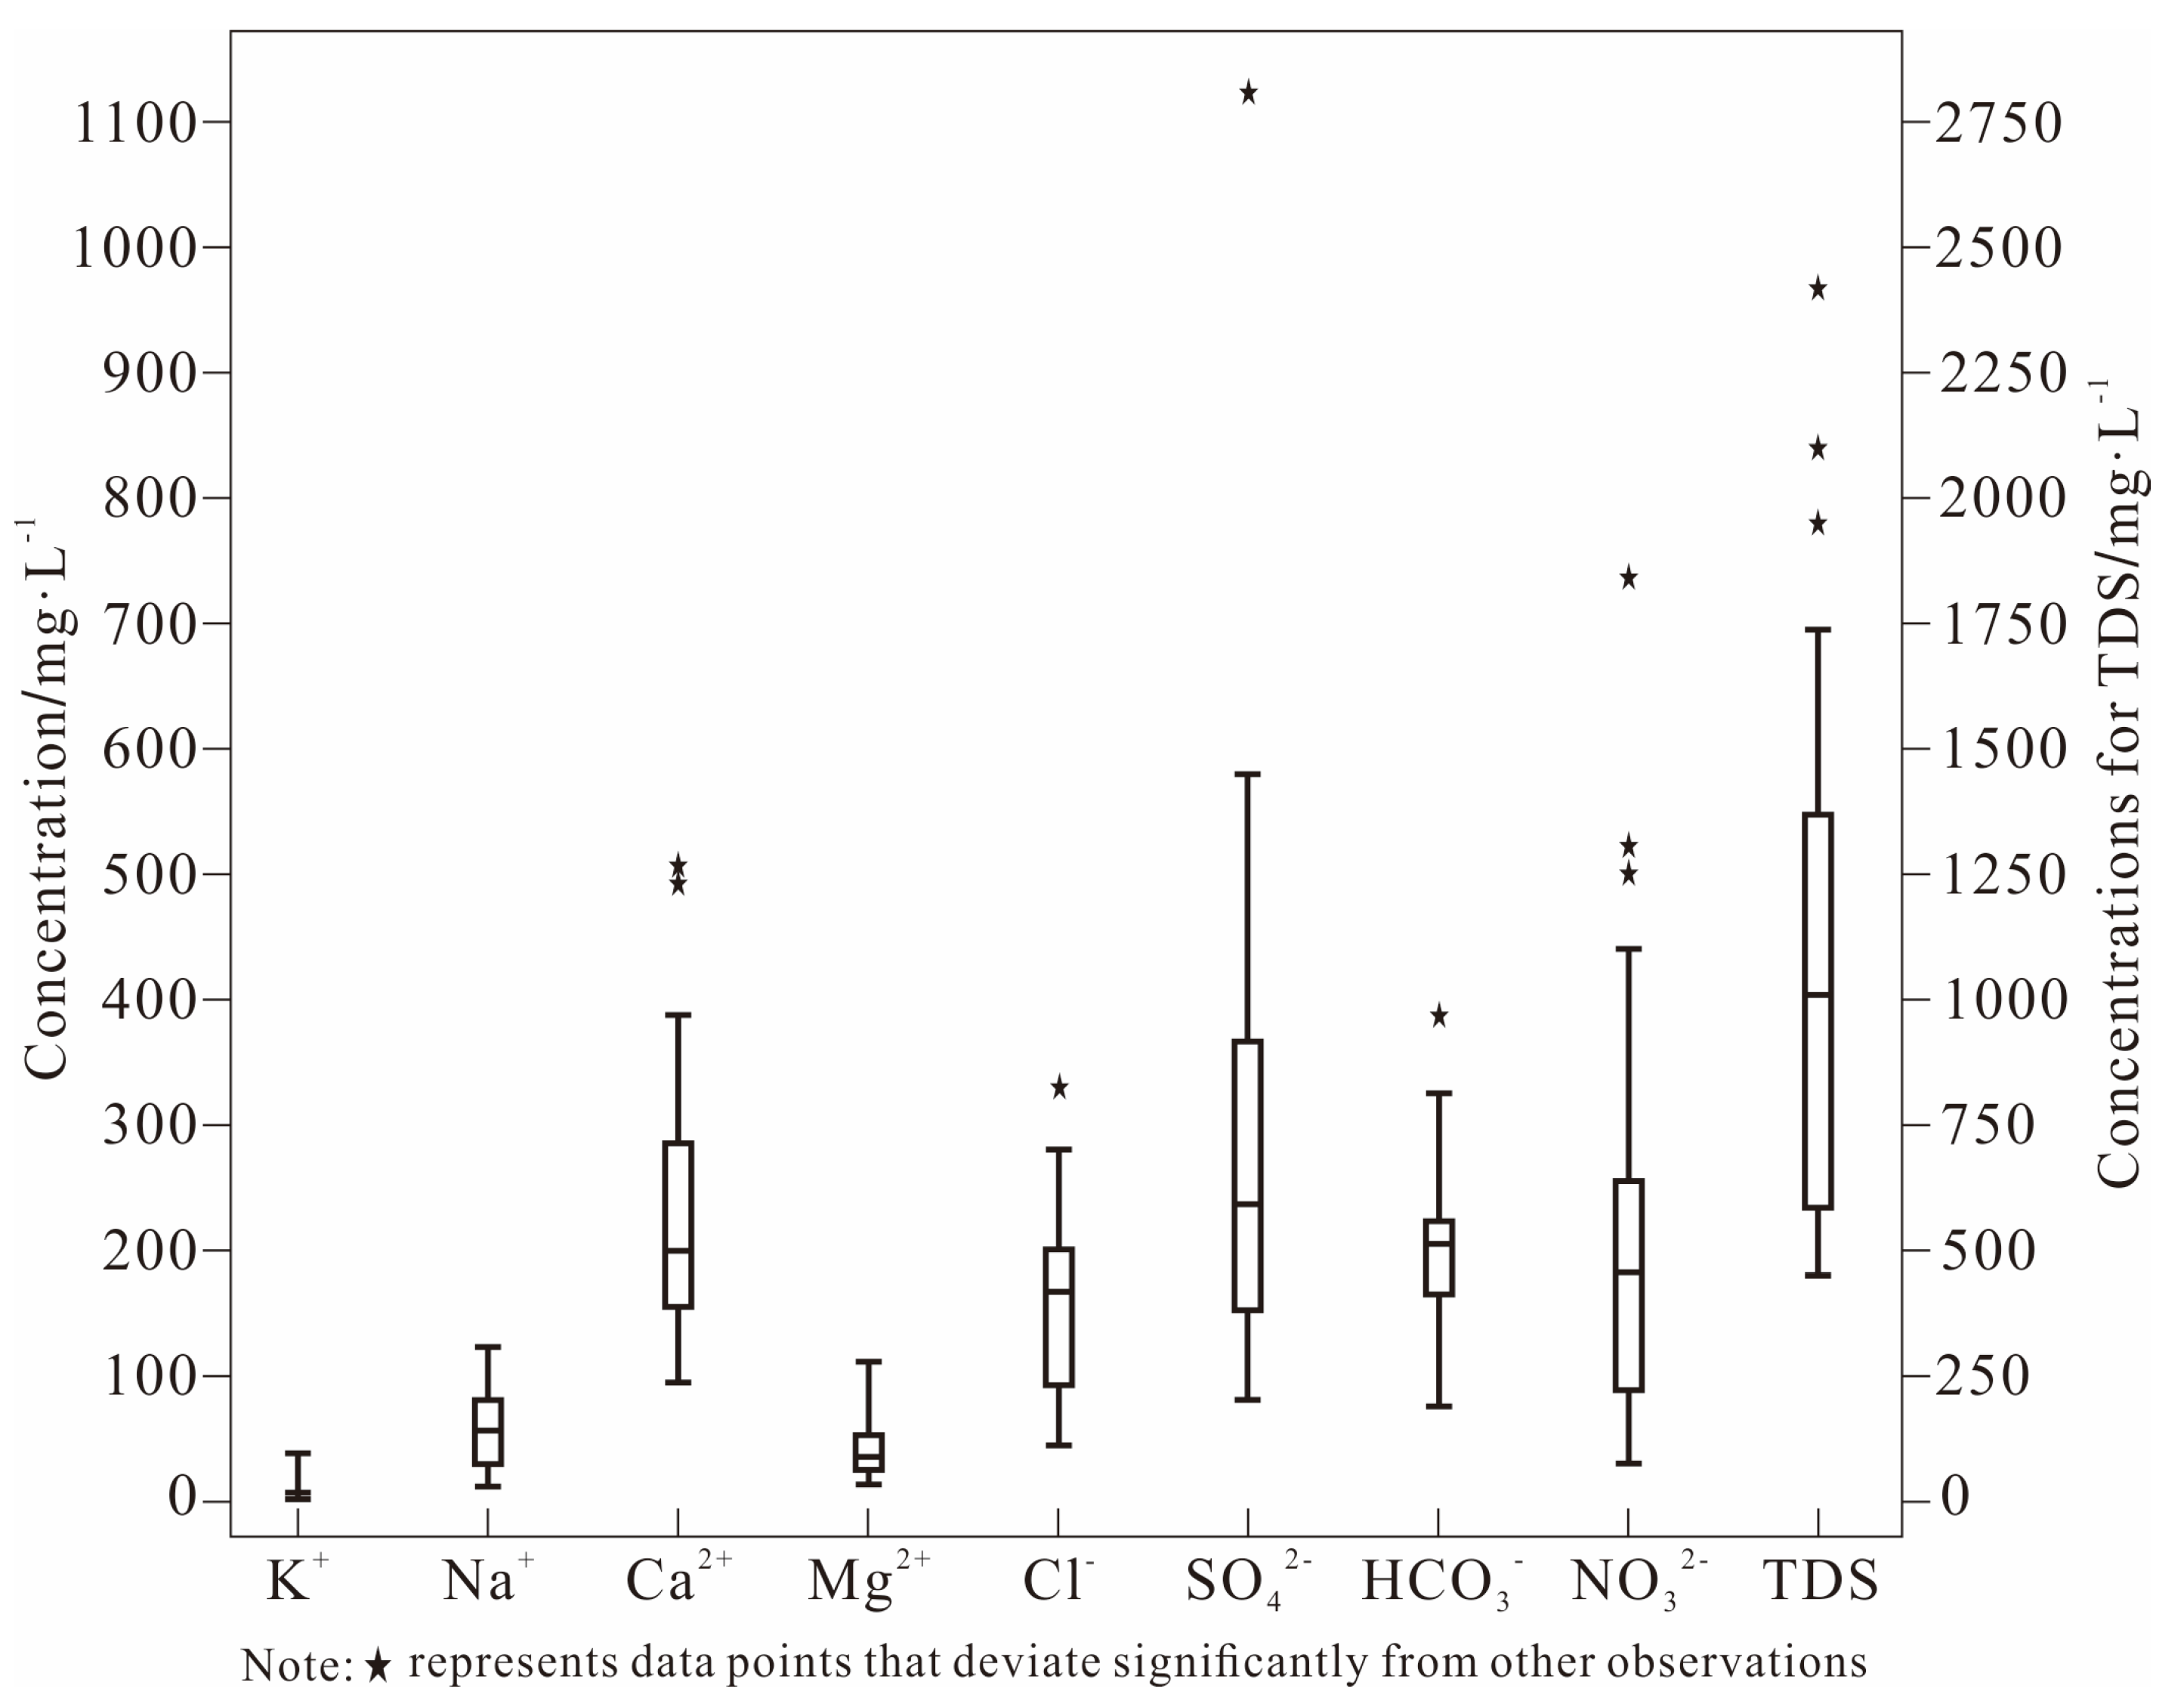
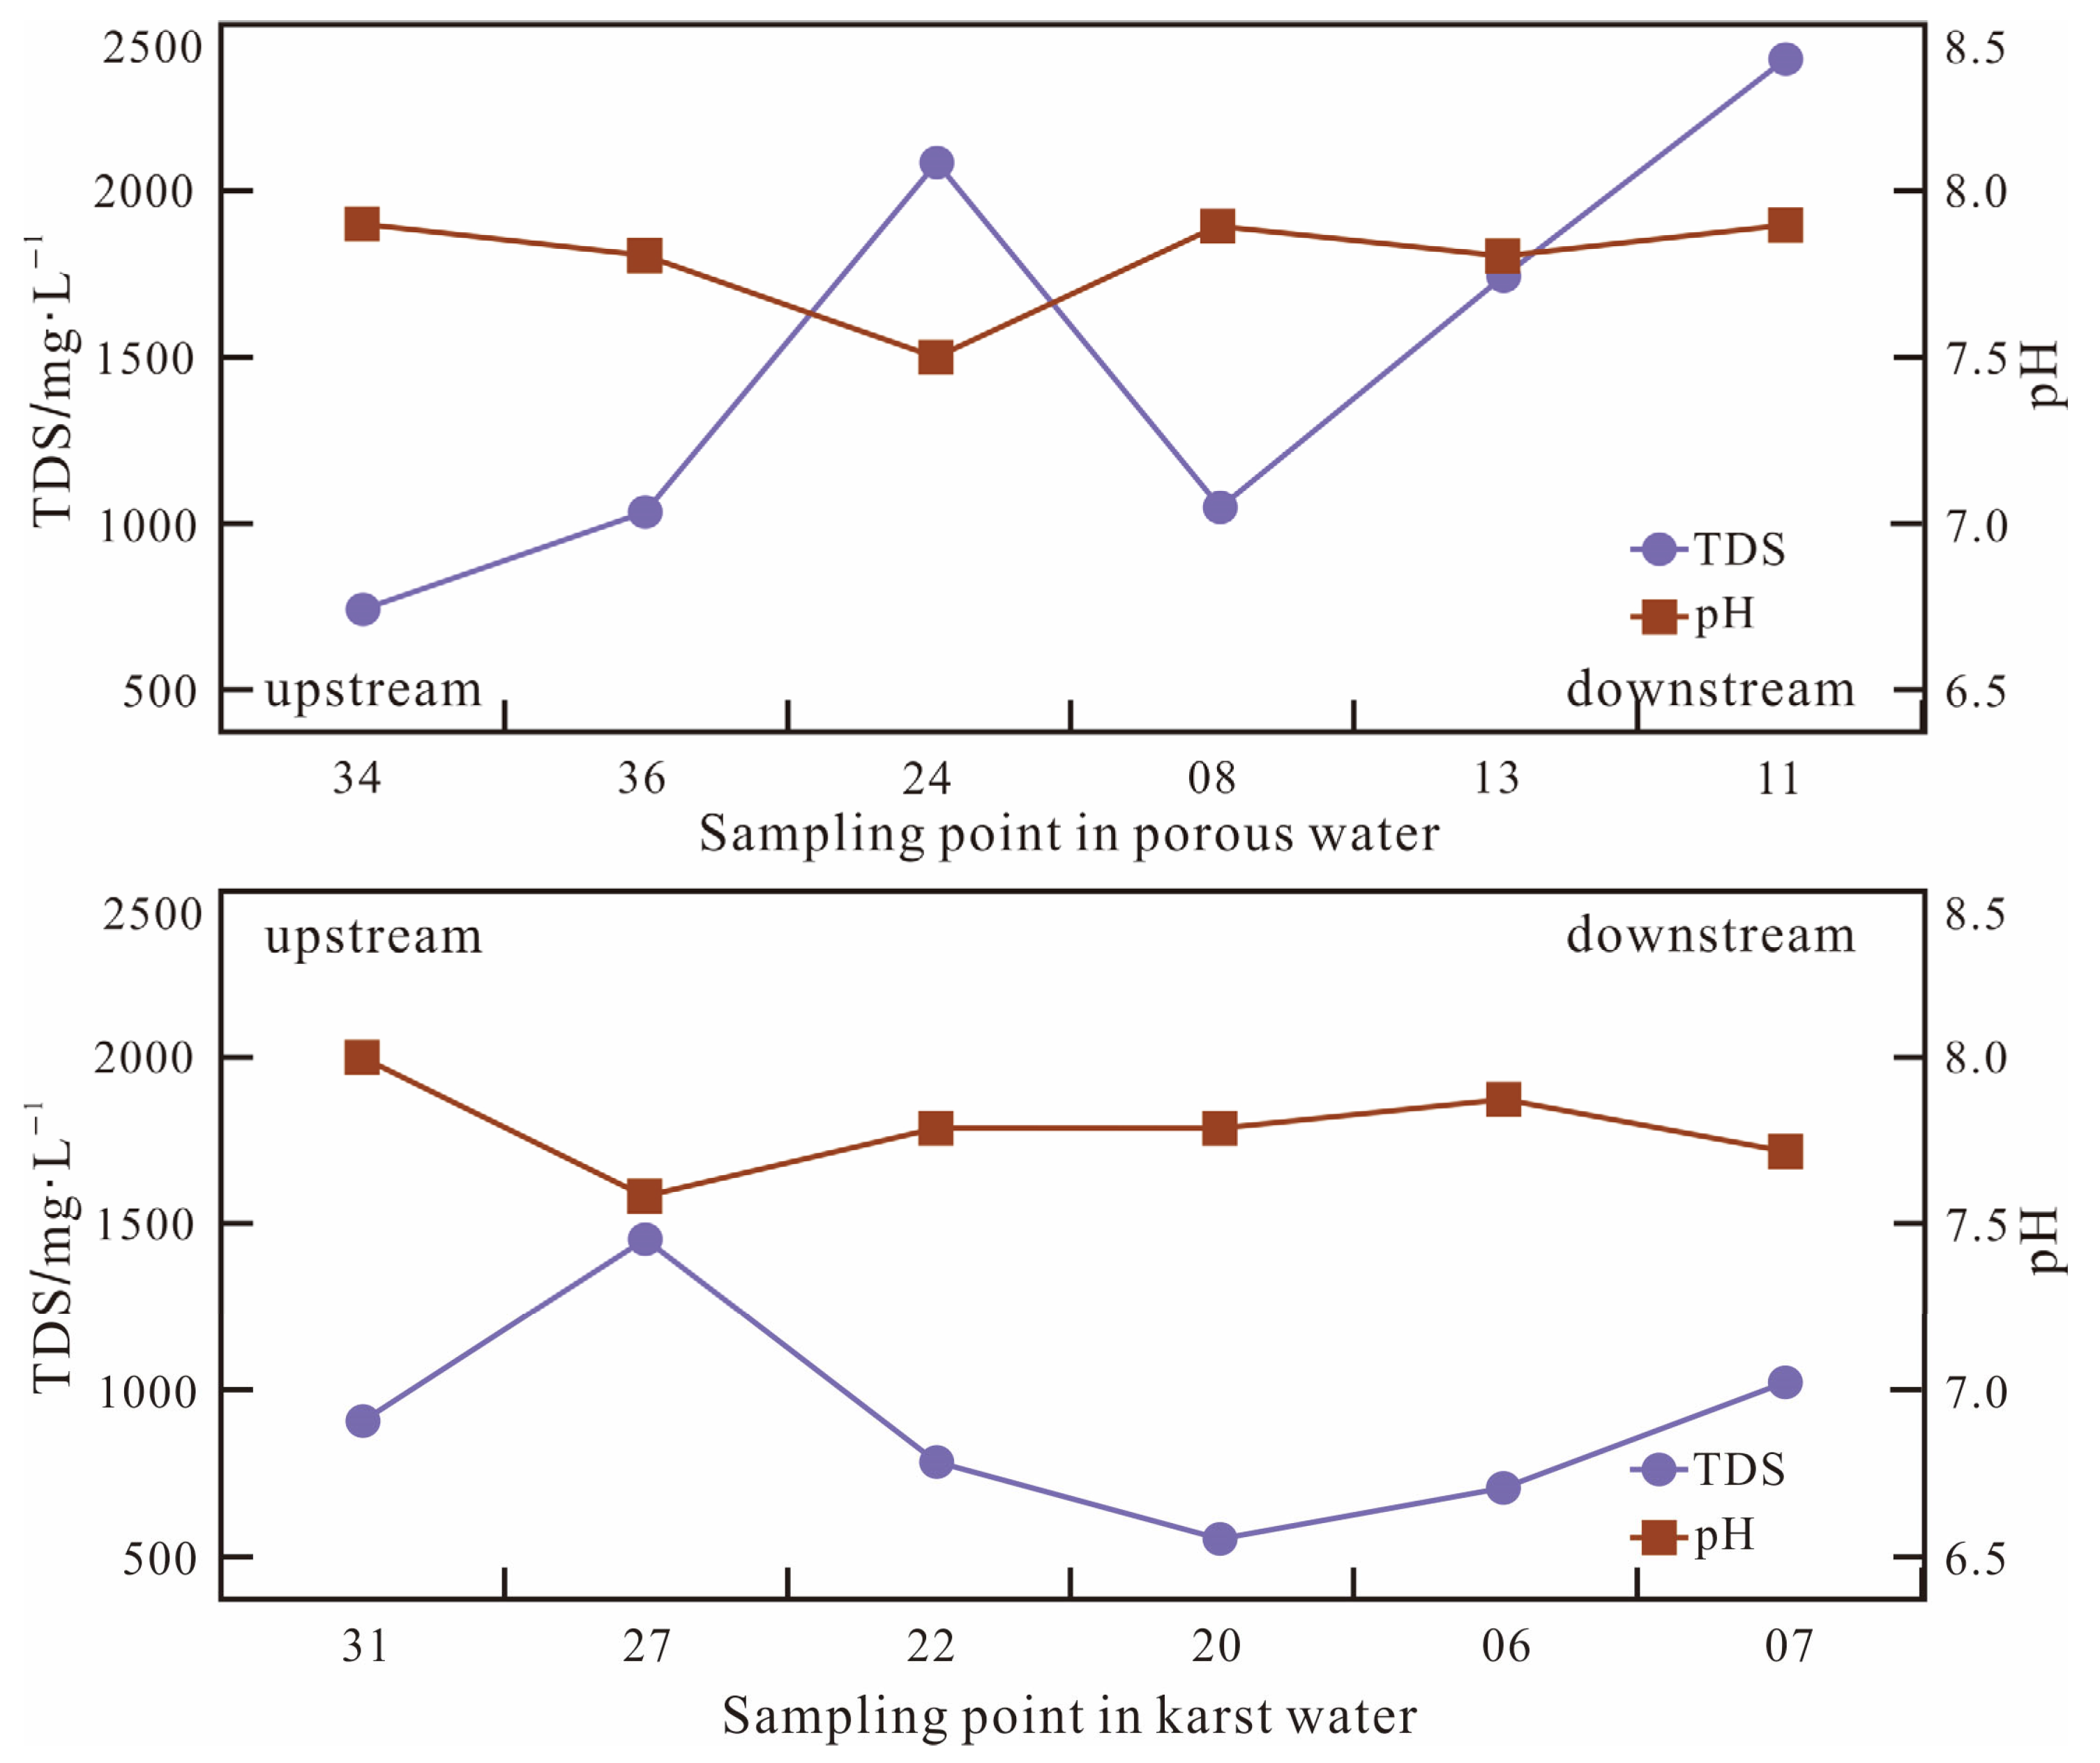
- Groundwater in the central part of the DRB exhibits pH levels between 7.5 and 8.2 (mean 7.8), signifying mild alkalinity. Concentrations of TDSs range from 450 to 2420 mg/L, with an average of 1075.4 mg/L, and the DRB is predominantly characterized by brackish water. Ca2+ is the most major cation (68.3% of total cations), with SO42− (33.6%) and NO3− (28.4%) as the dominant anions.
- (2)
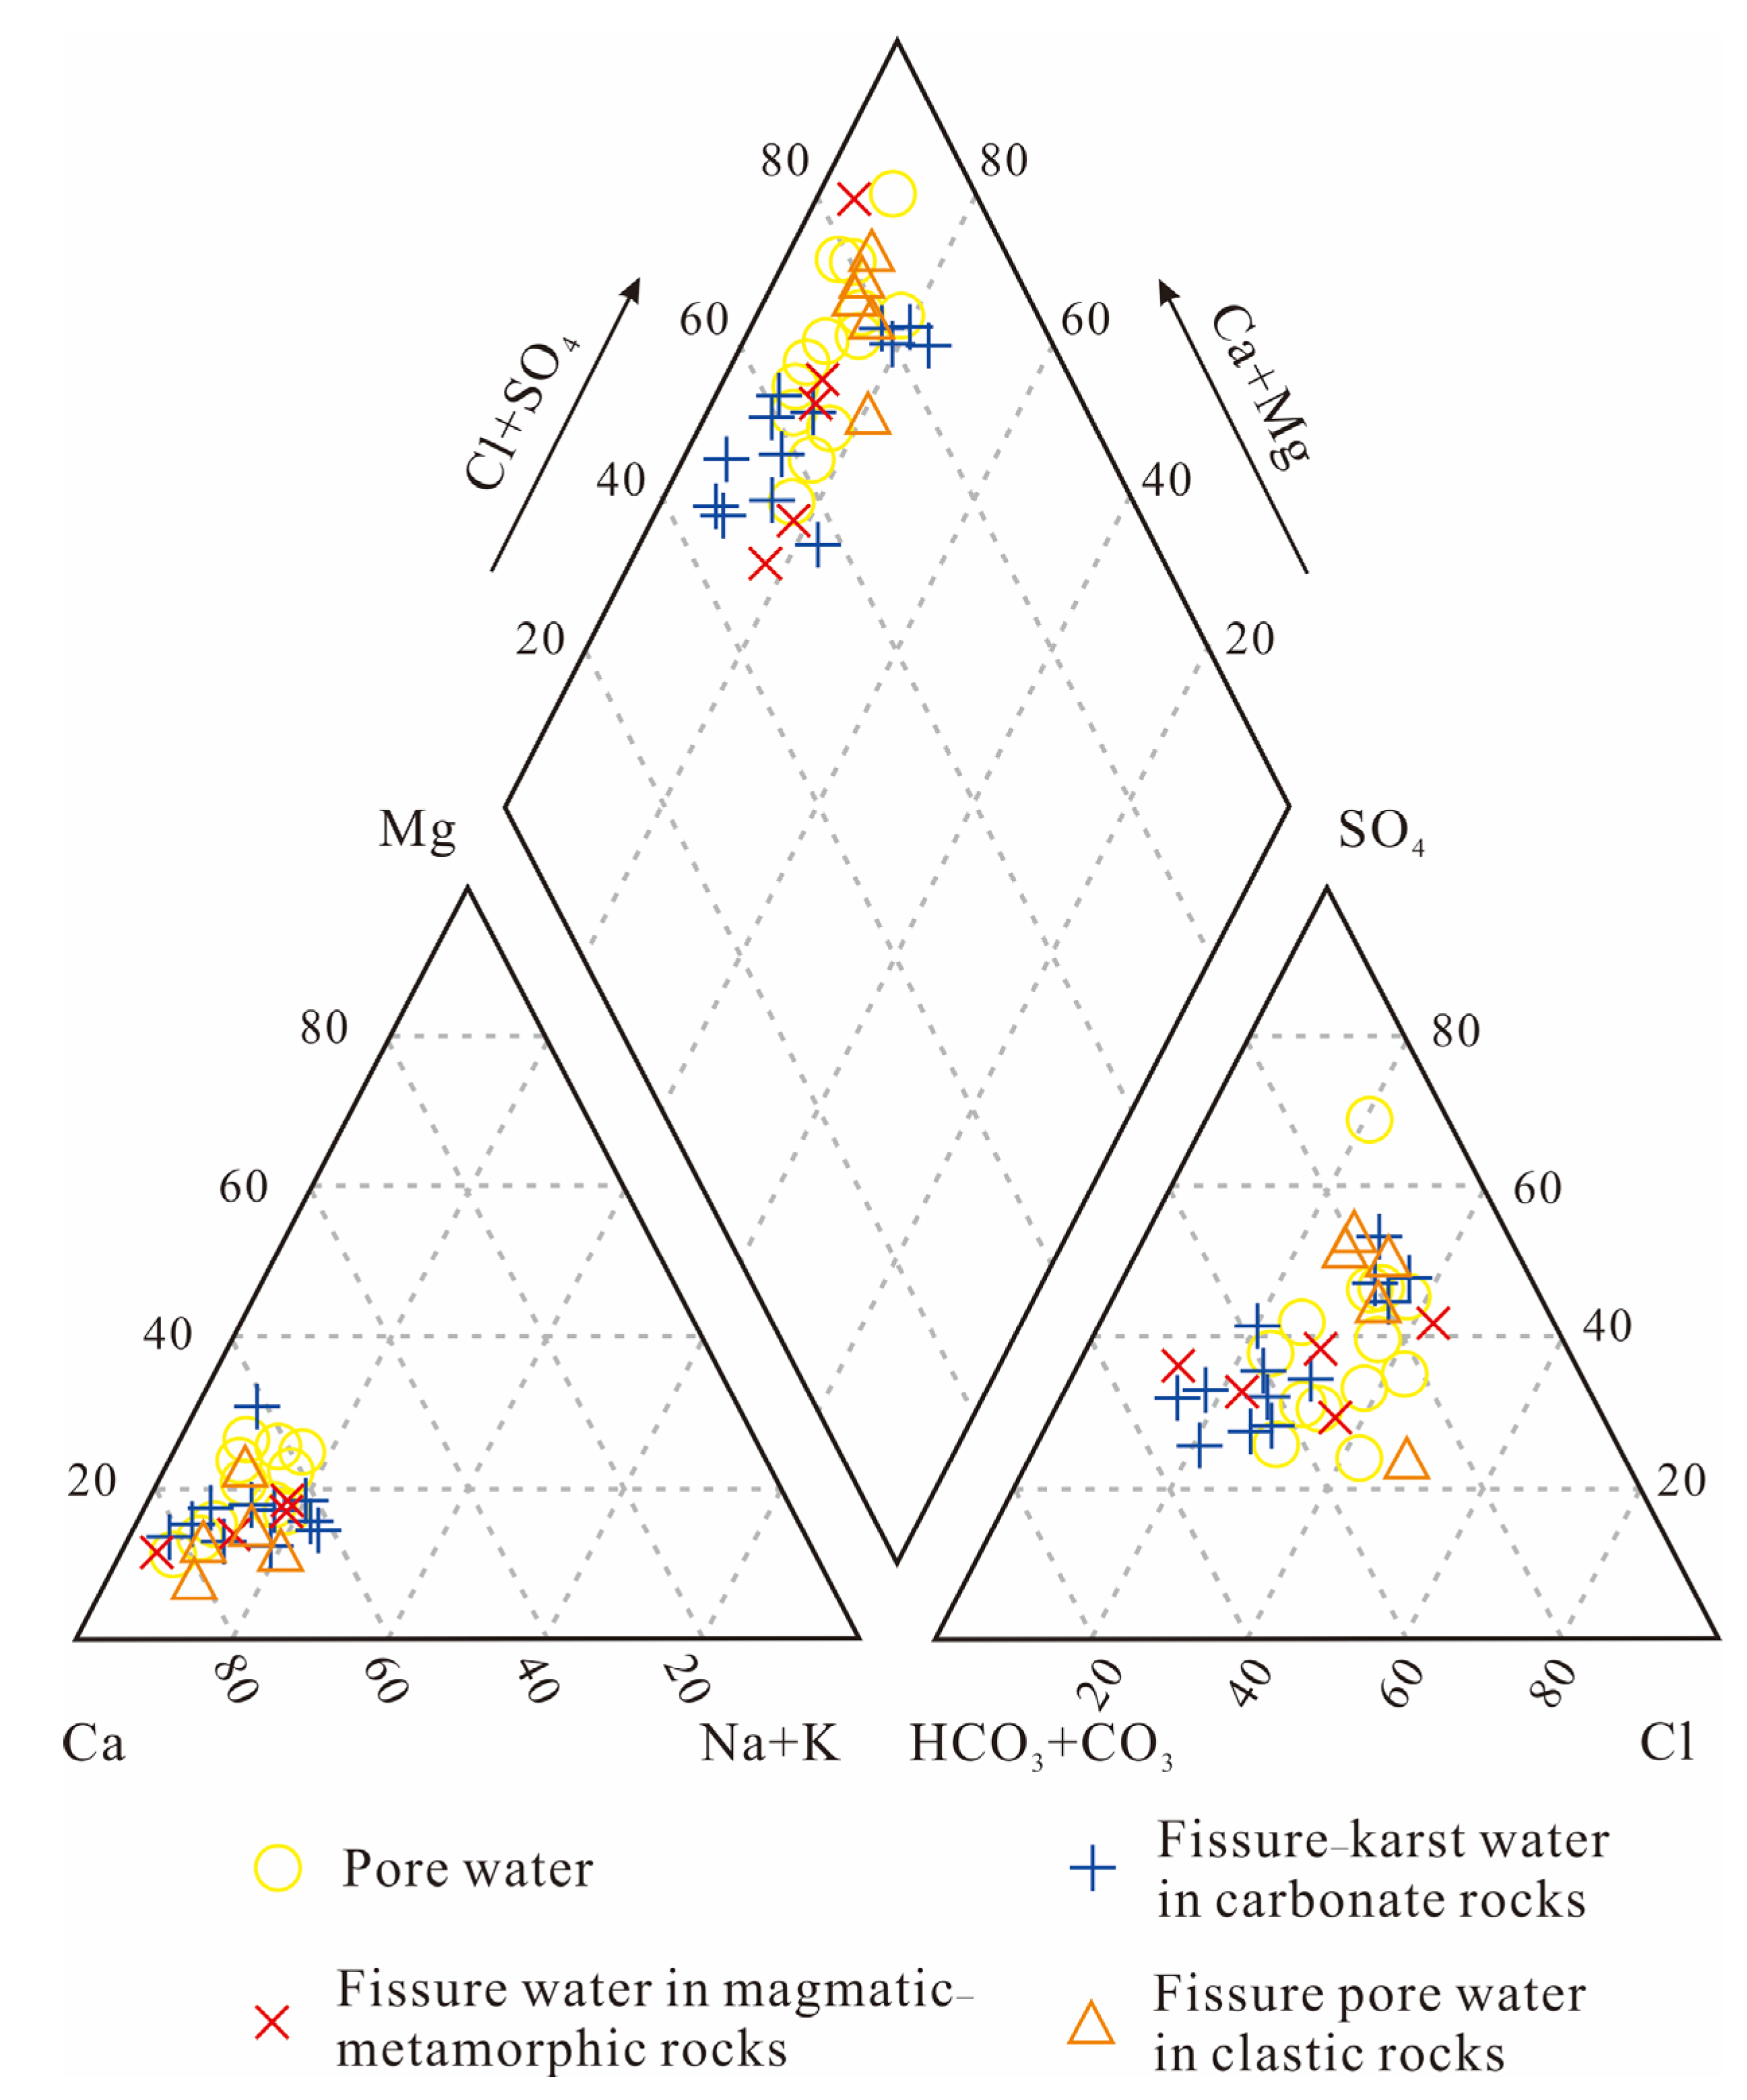
- The groundwater chemical types in this region are complex and diverse, predominantly classified as HCO3·SO4-Ca and HCO3·Cl·SO4-Ca, followed by SO4·HCO3-Ca, HCO3·SO4·Cl-Ca, and Cl·SO4-Ca types.
- (3)
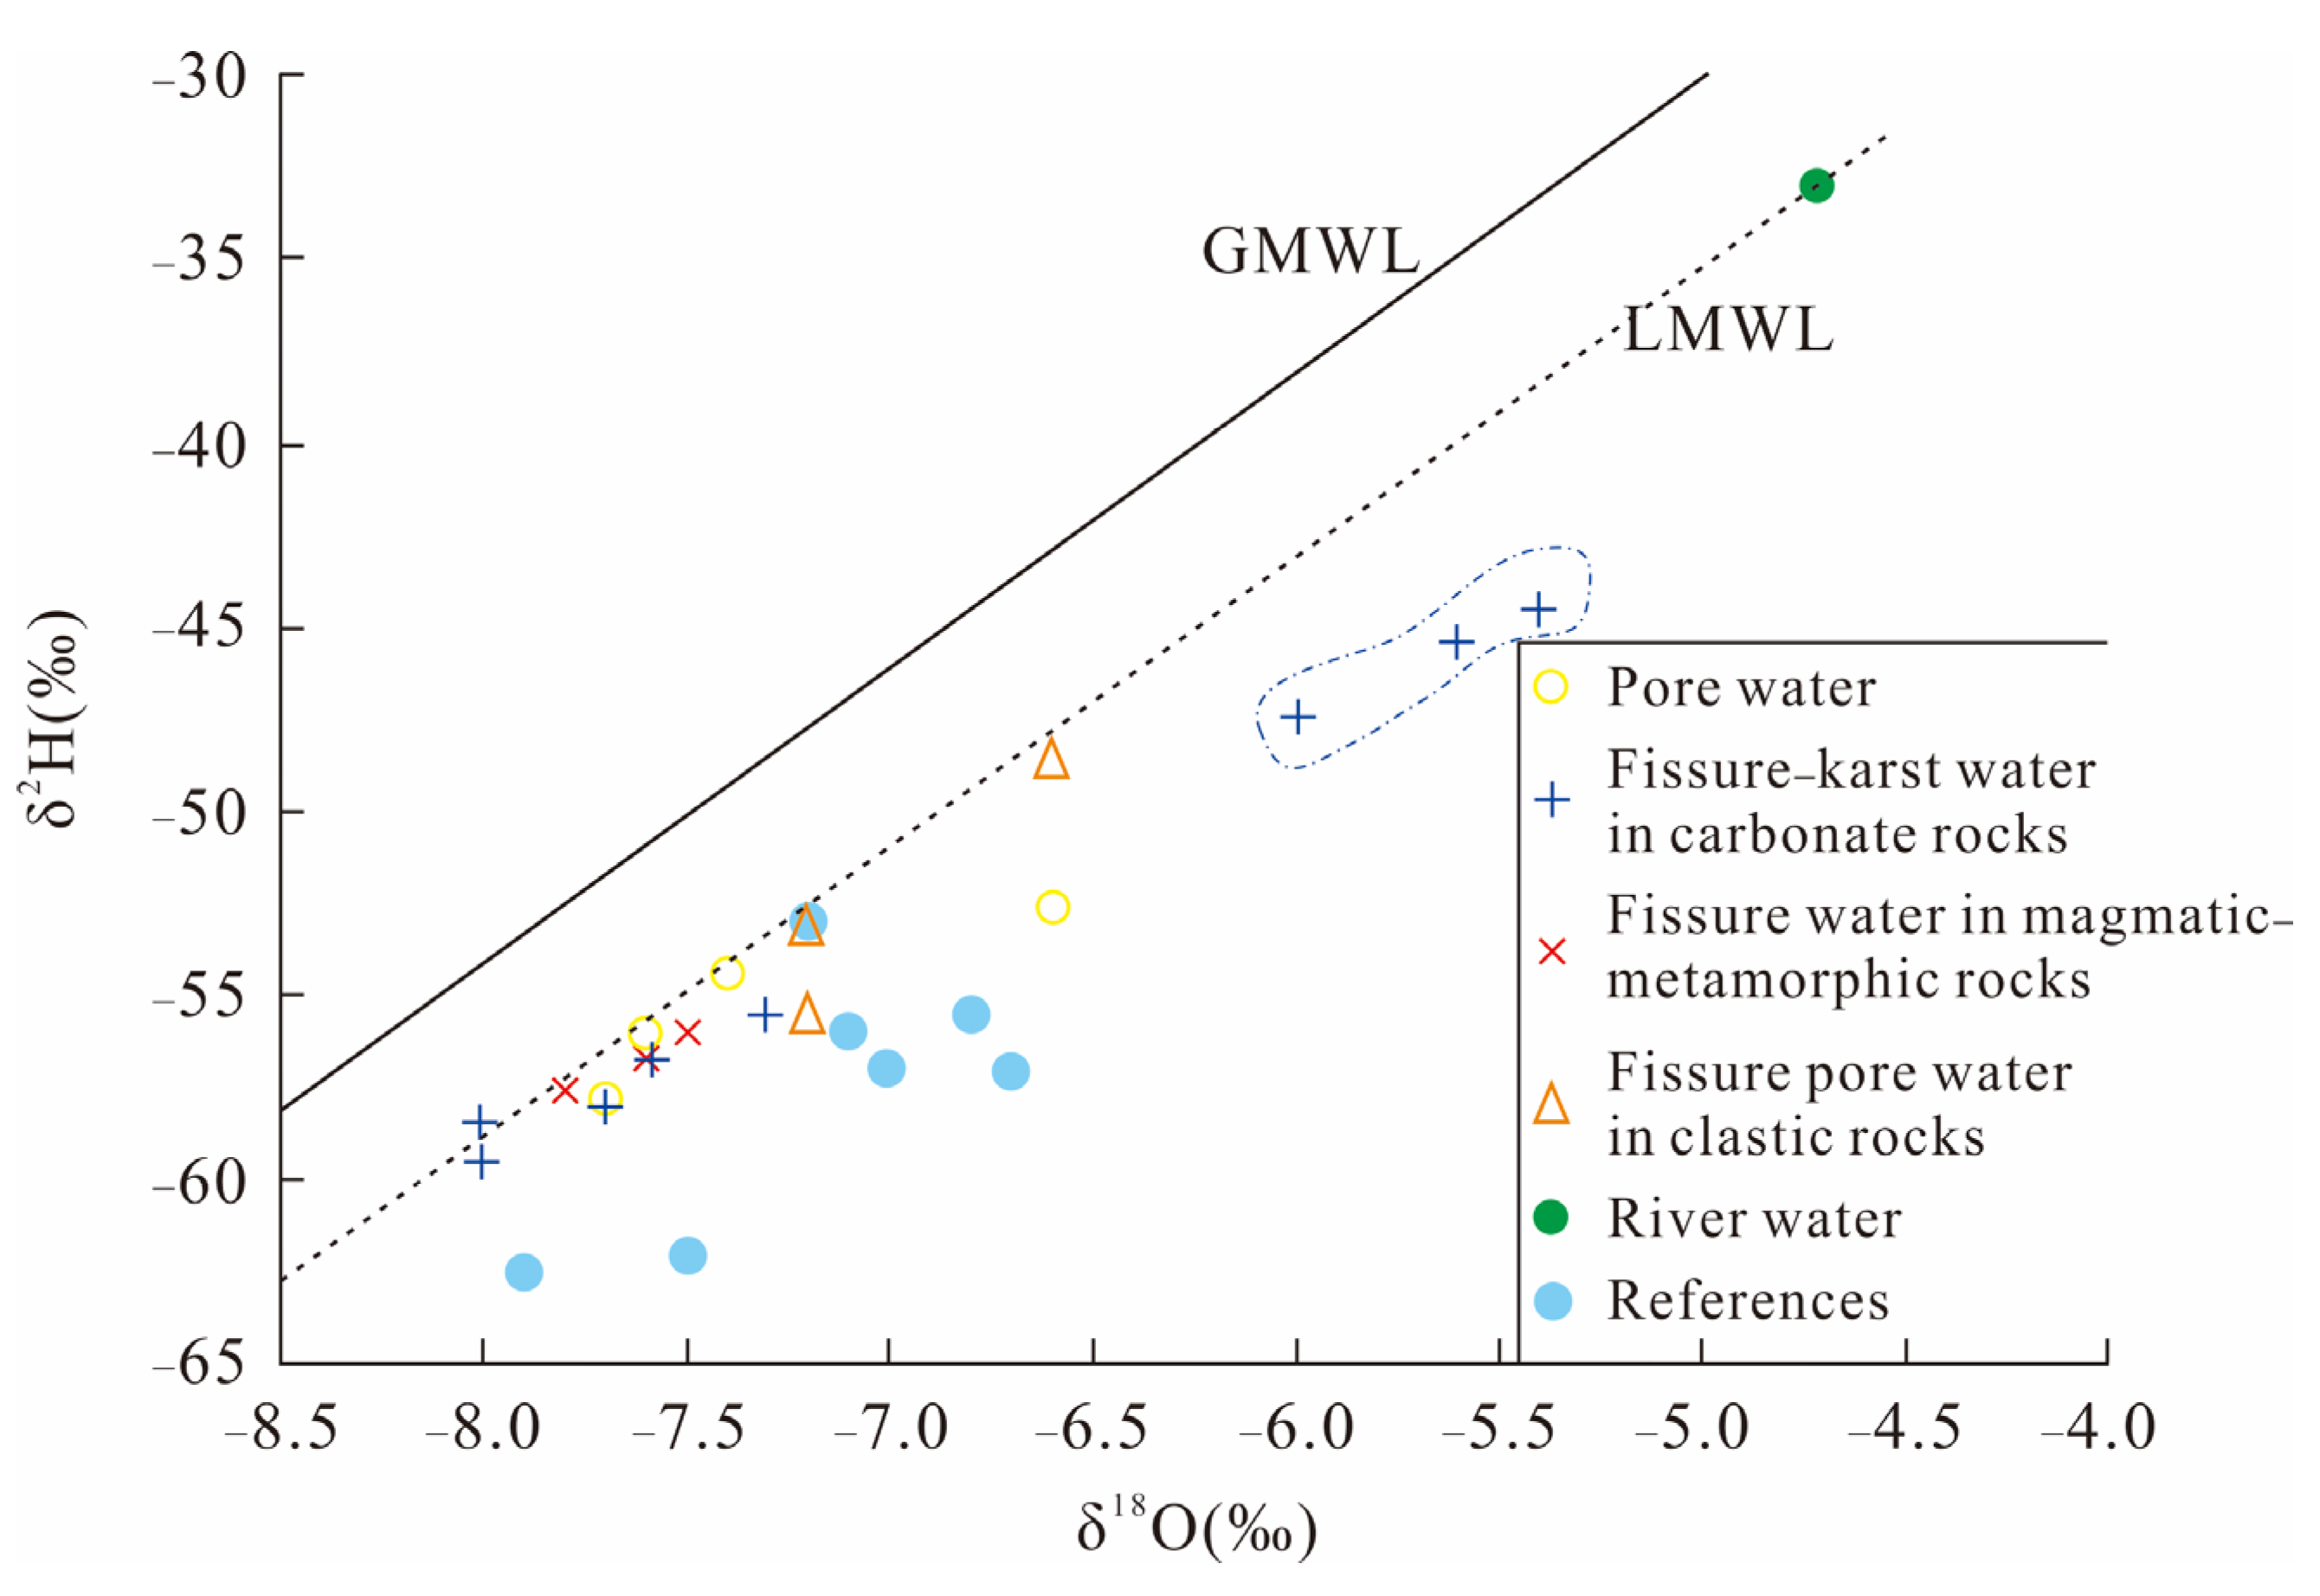
- Stable isotope analyses (δ2H and δδ18O) show concentrated clustering of groundwater samples near the local meteoric water line with slight downward deviation, forming linear distributions. This pattern confirms atmospheric precipitation as the primary recharge source. Notably, pore water in loose sediments exhibits higher δ2H and δ18O values compared to other groundwater types, attributed to shallow burial depths and enhanced evaporation effects during runoff processes.
- (4)
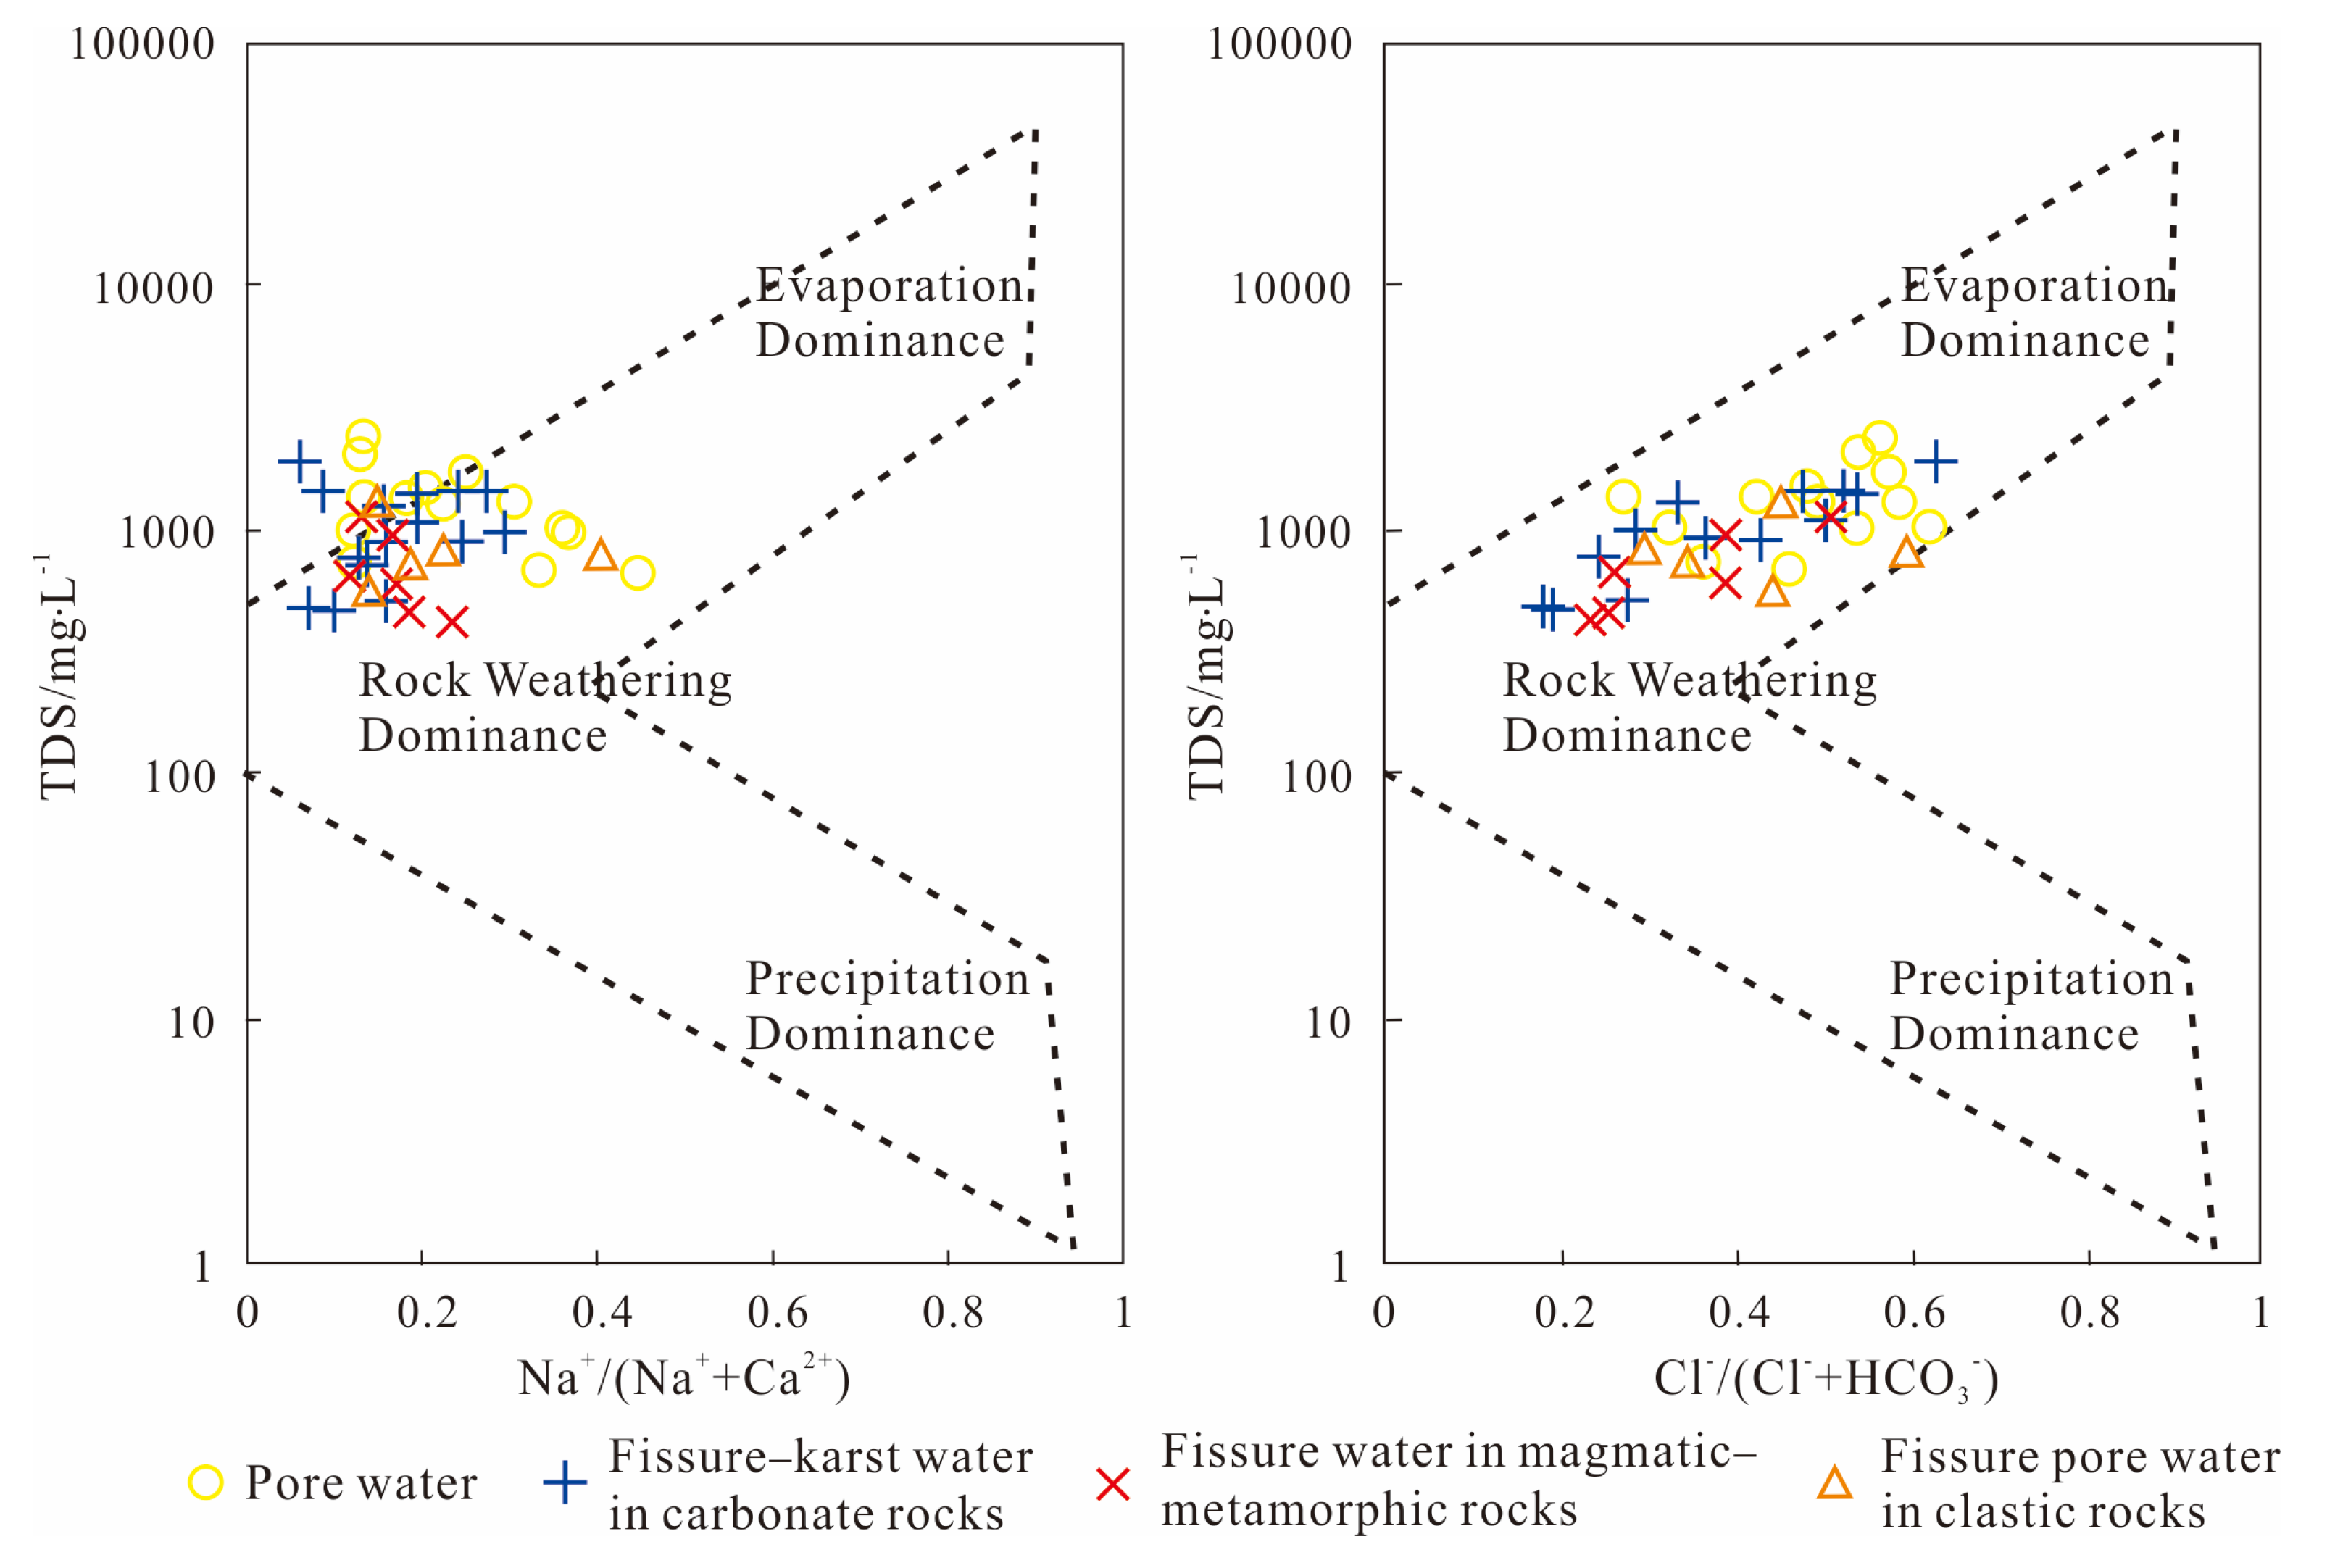
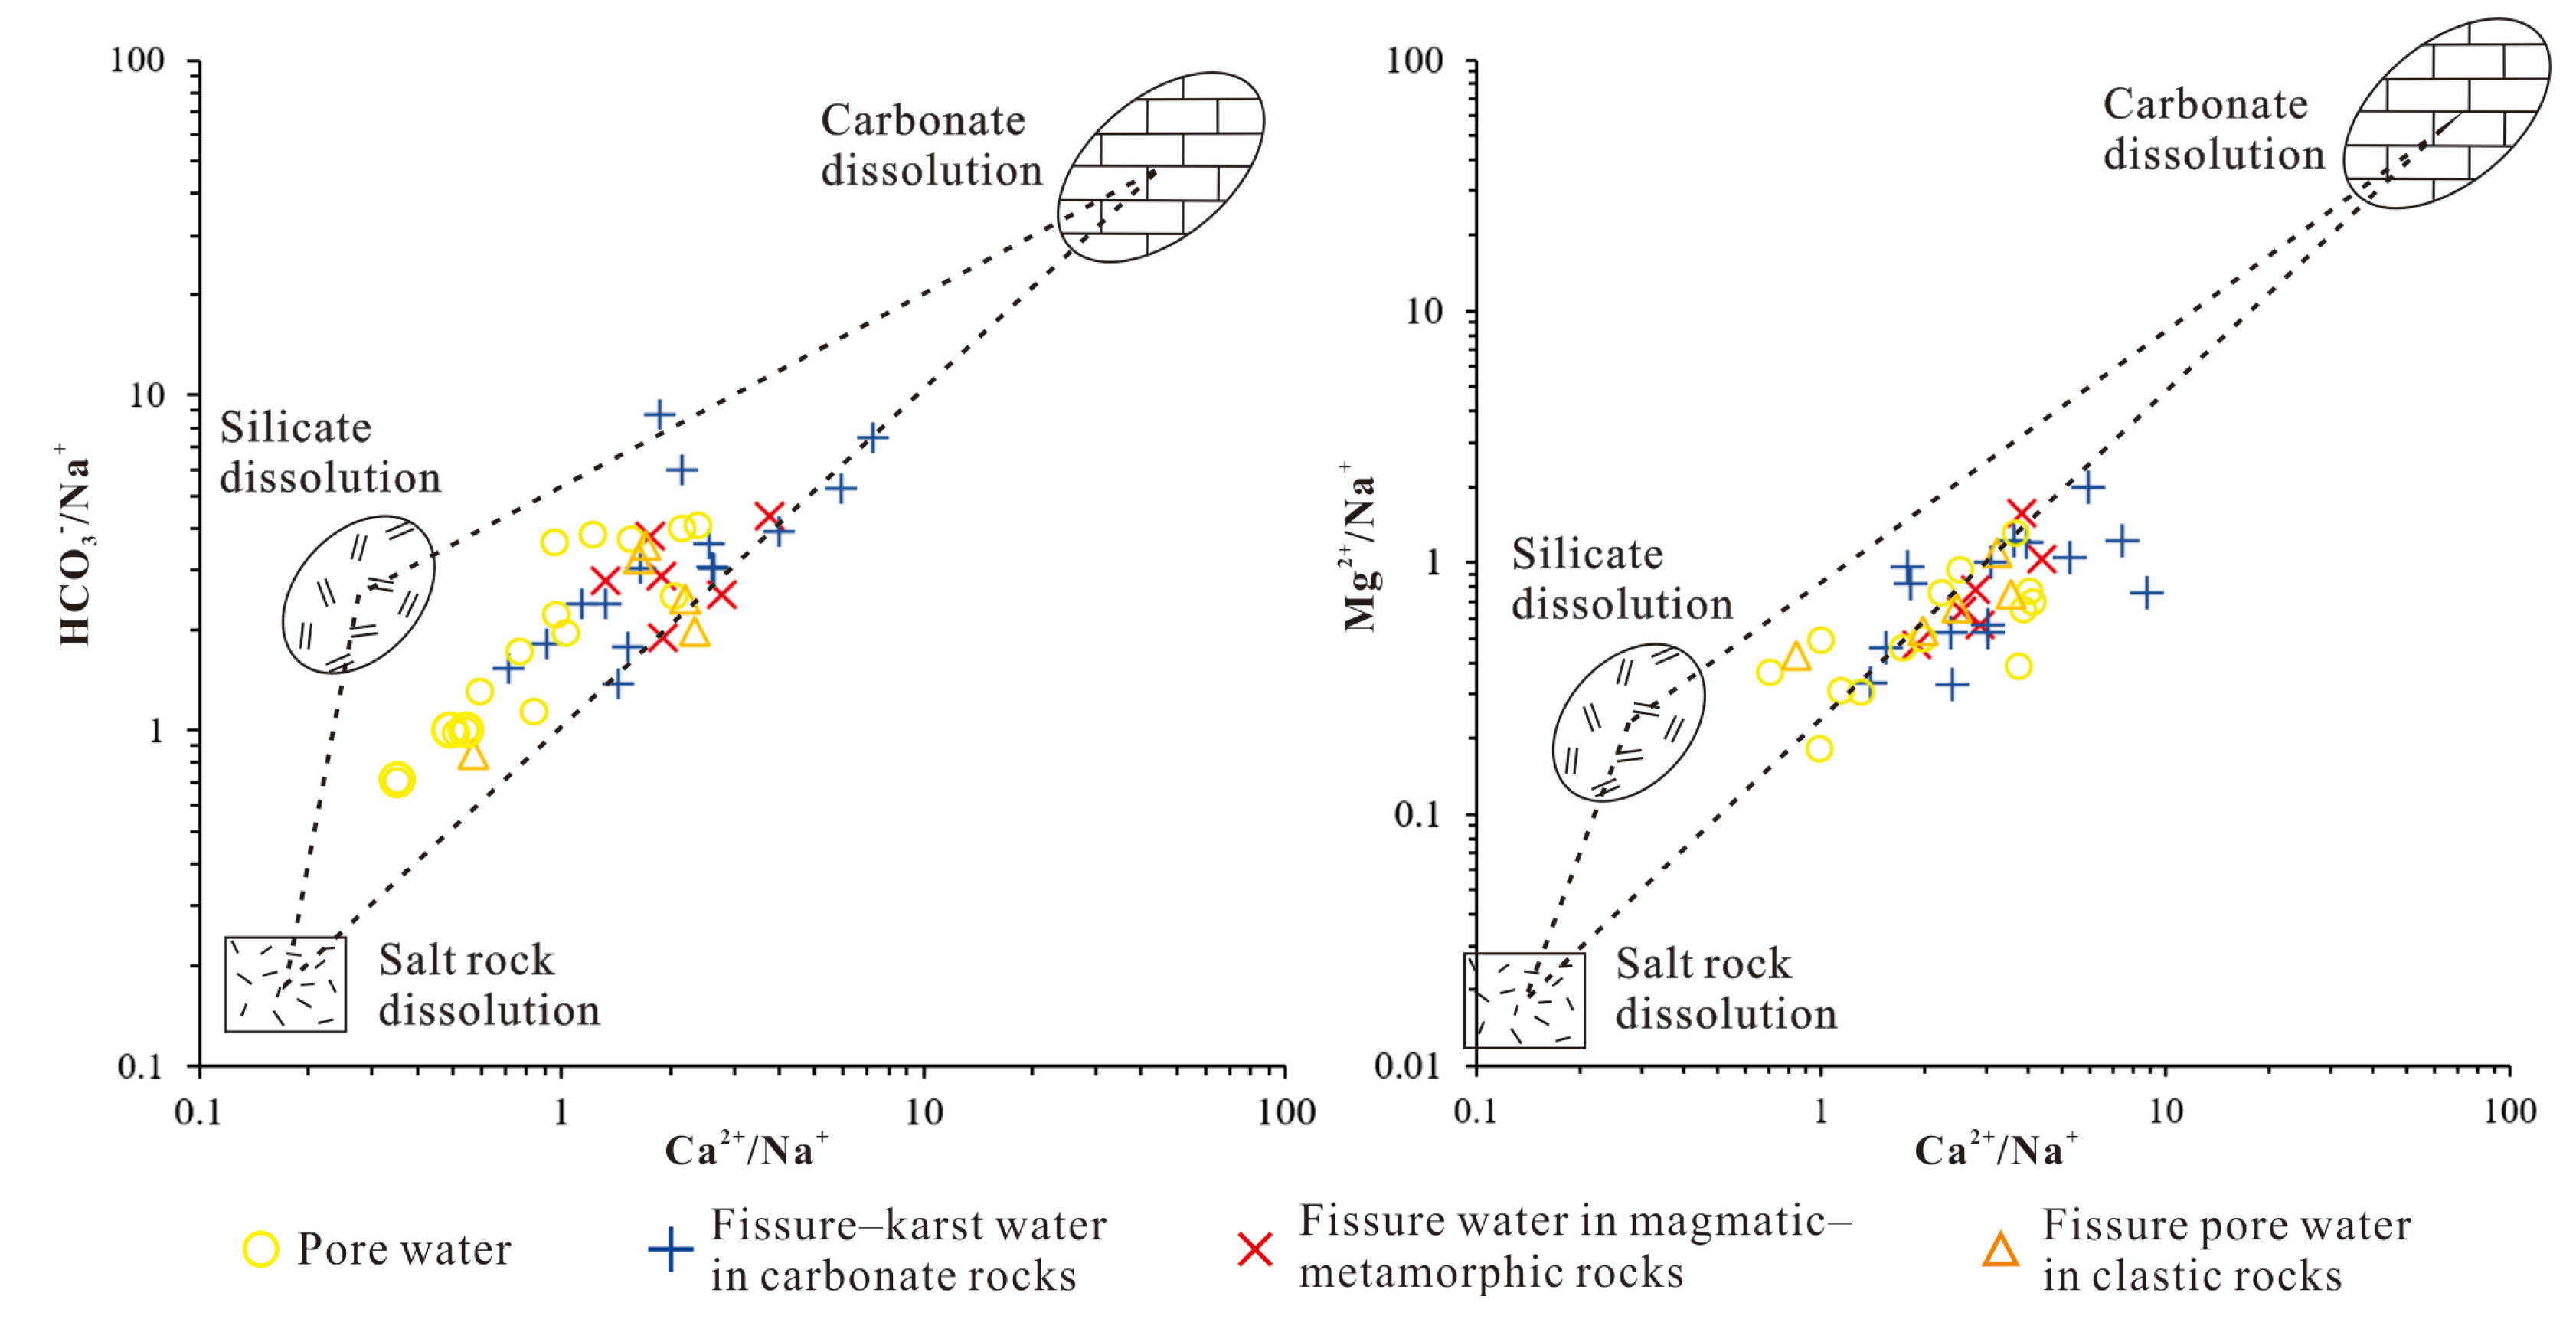
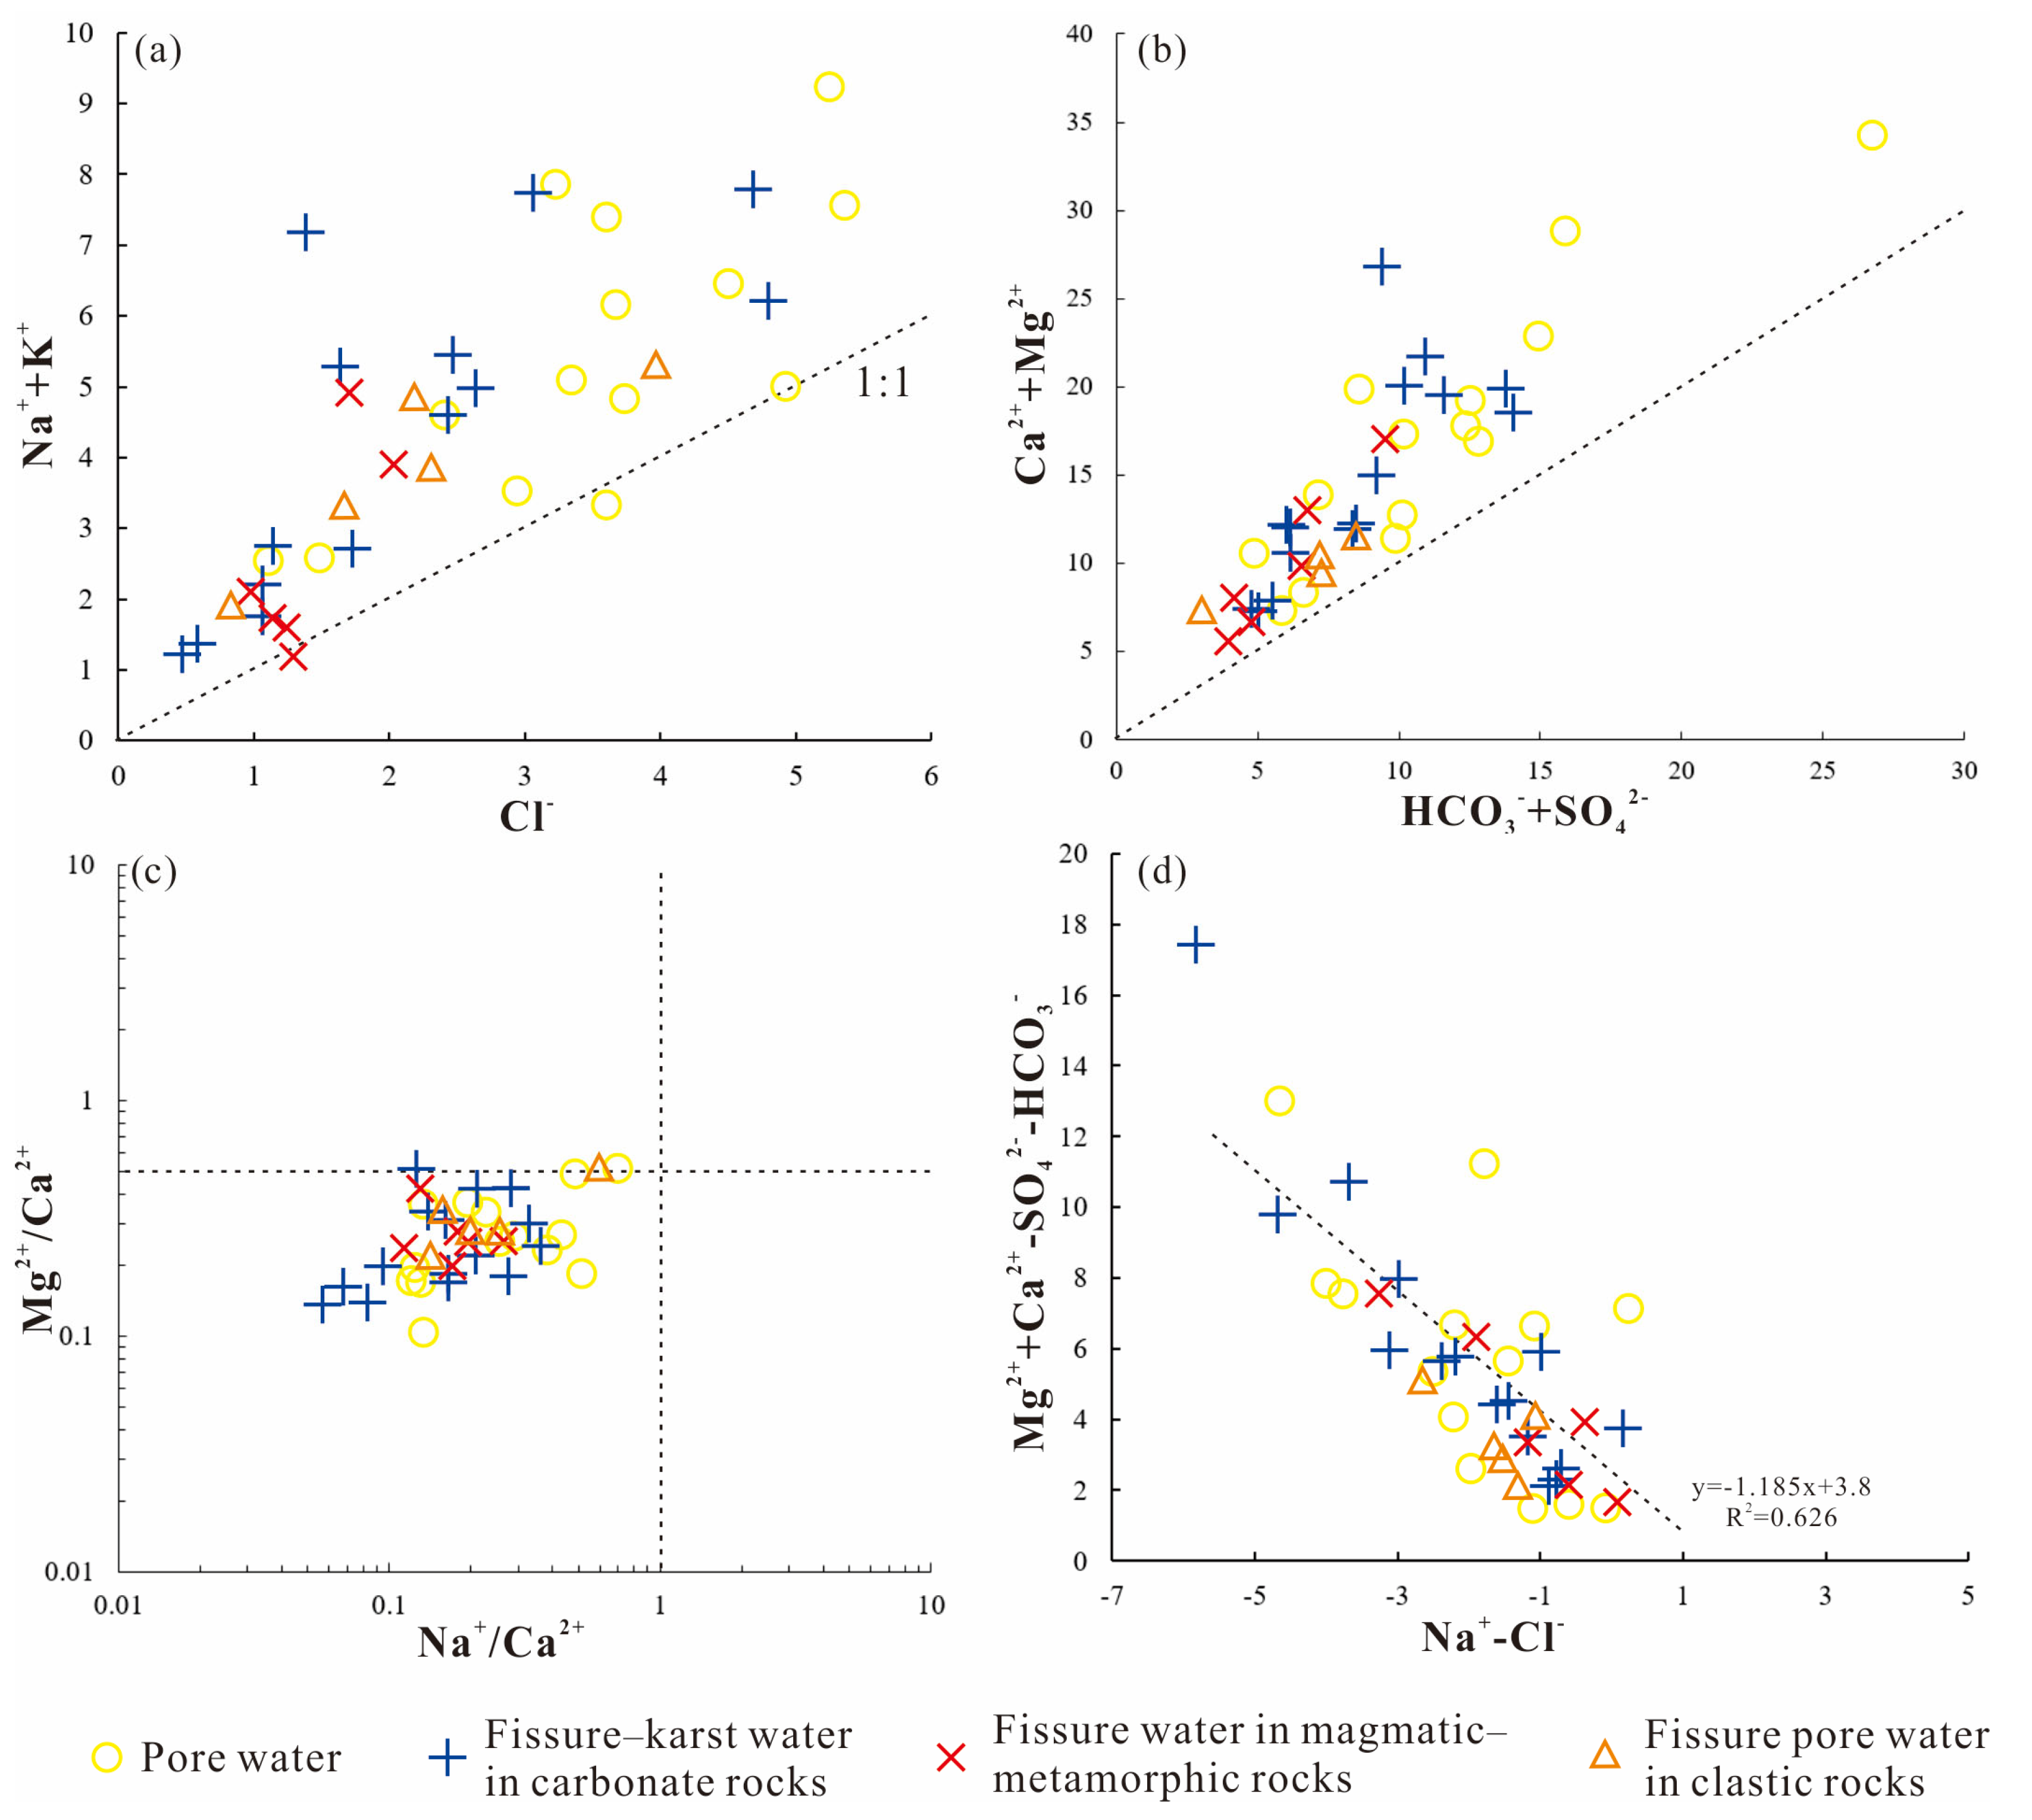
- The hydrochemical composition of groundwater in the central DRB stems from a combination of natural processes and human impact, as revealed by Gibbs plot assessments and ionic correlation studies. Rock weathering, ion exchange dynamics, and anthropogenic inputs all play a role in shaping the region’s water chemistry. Water chemistry is mainly influenced by silicate and carbonate mineral weathering and dissolution, with evolutionary trends strongly affected by calcite-dominated low-magnesium mineral dissolution. Systematic Na++K+ depletion and Ca2++Mg2+ enrichment were observed, alongside pronounced cation exchange phenomena.
- (5)
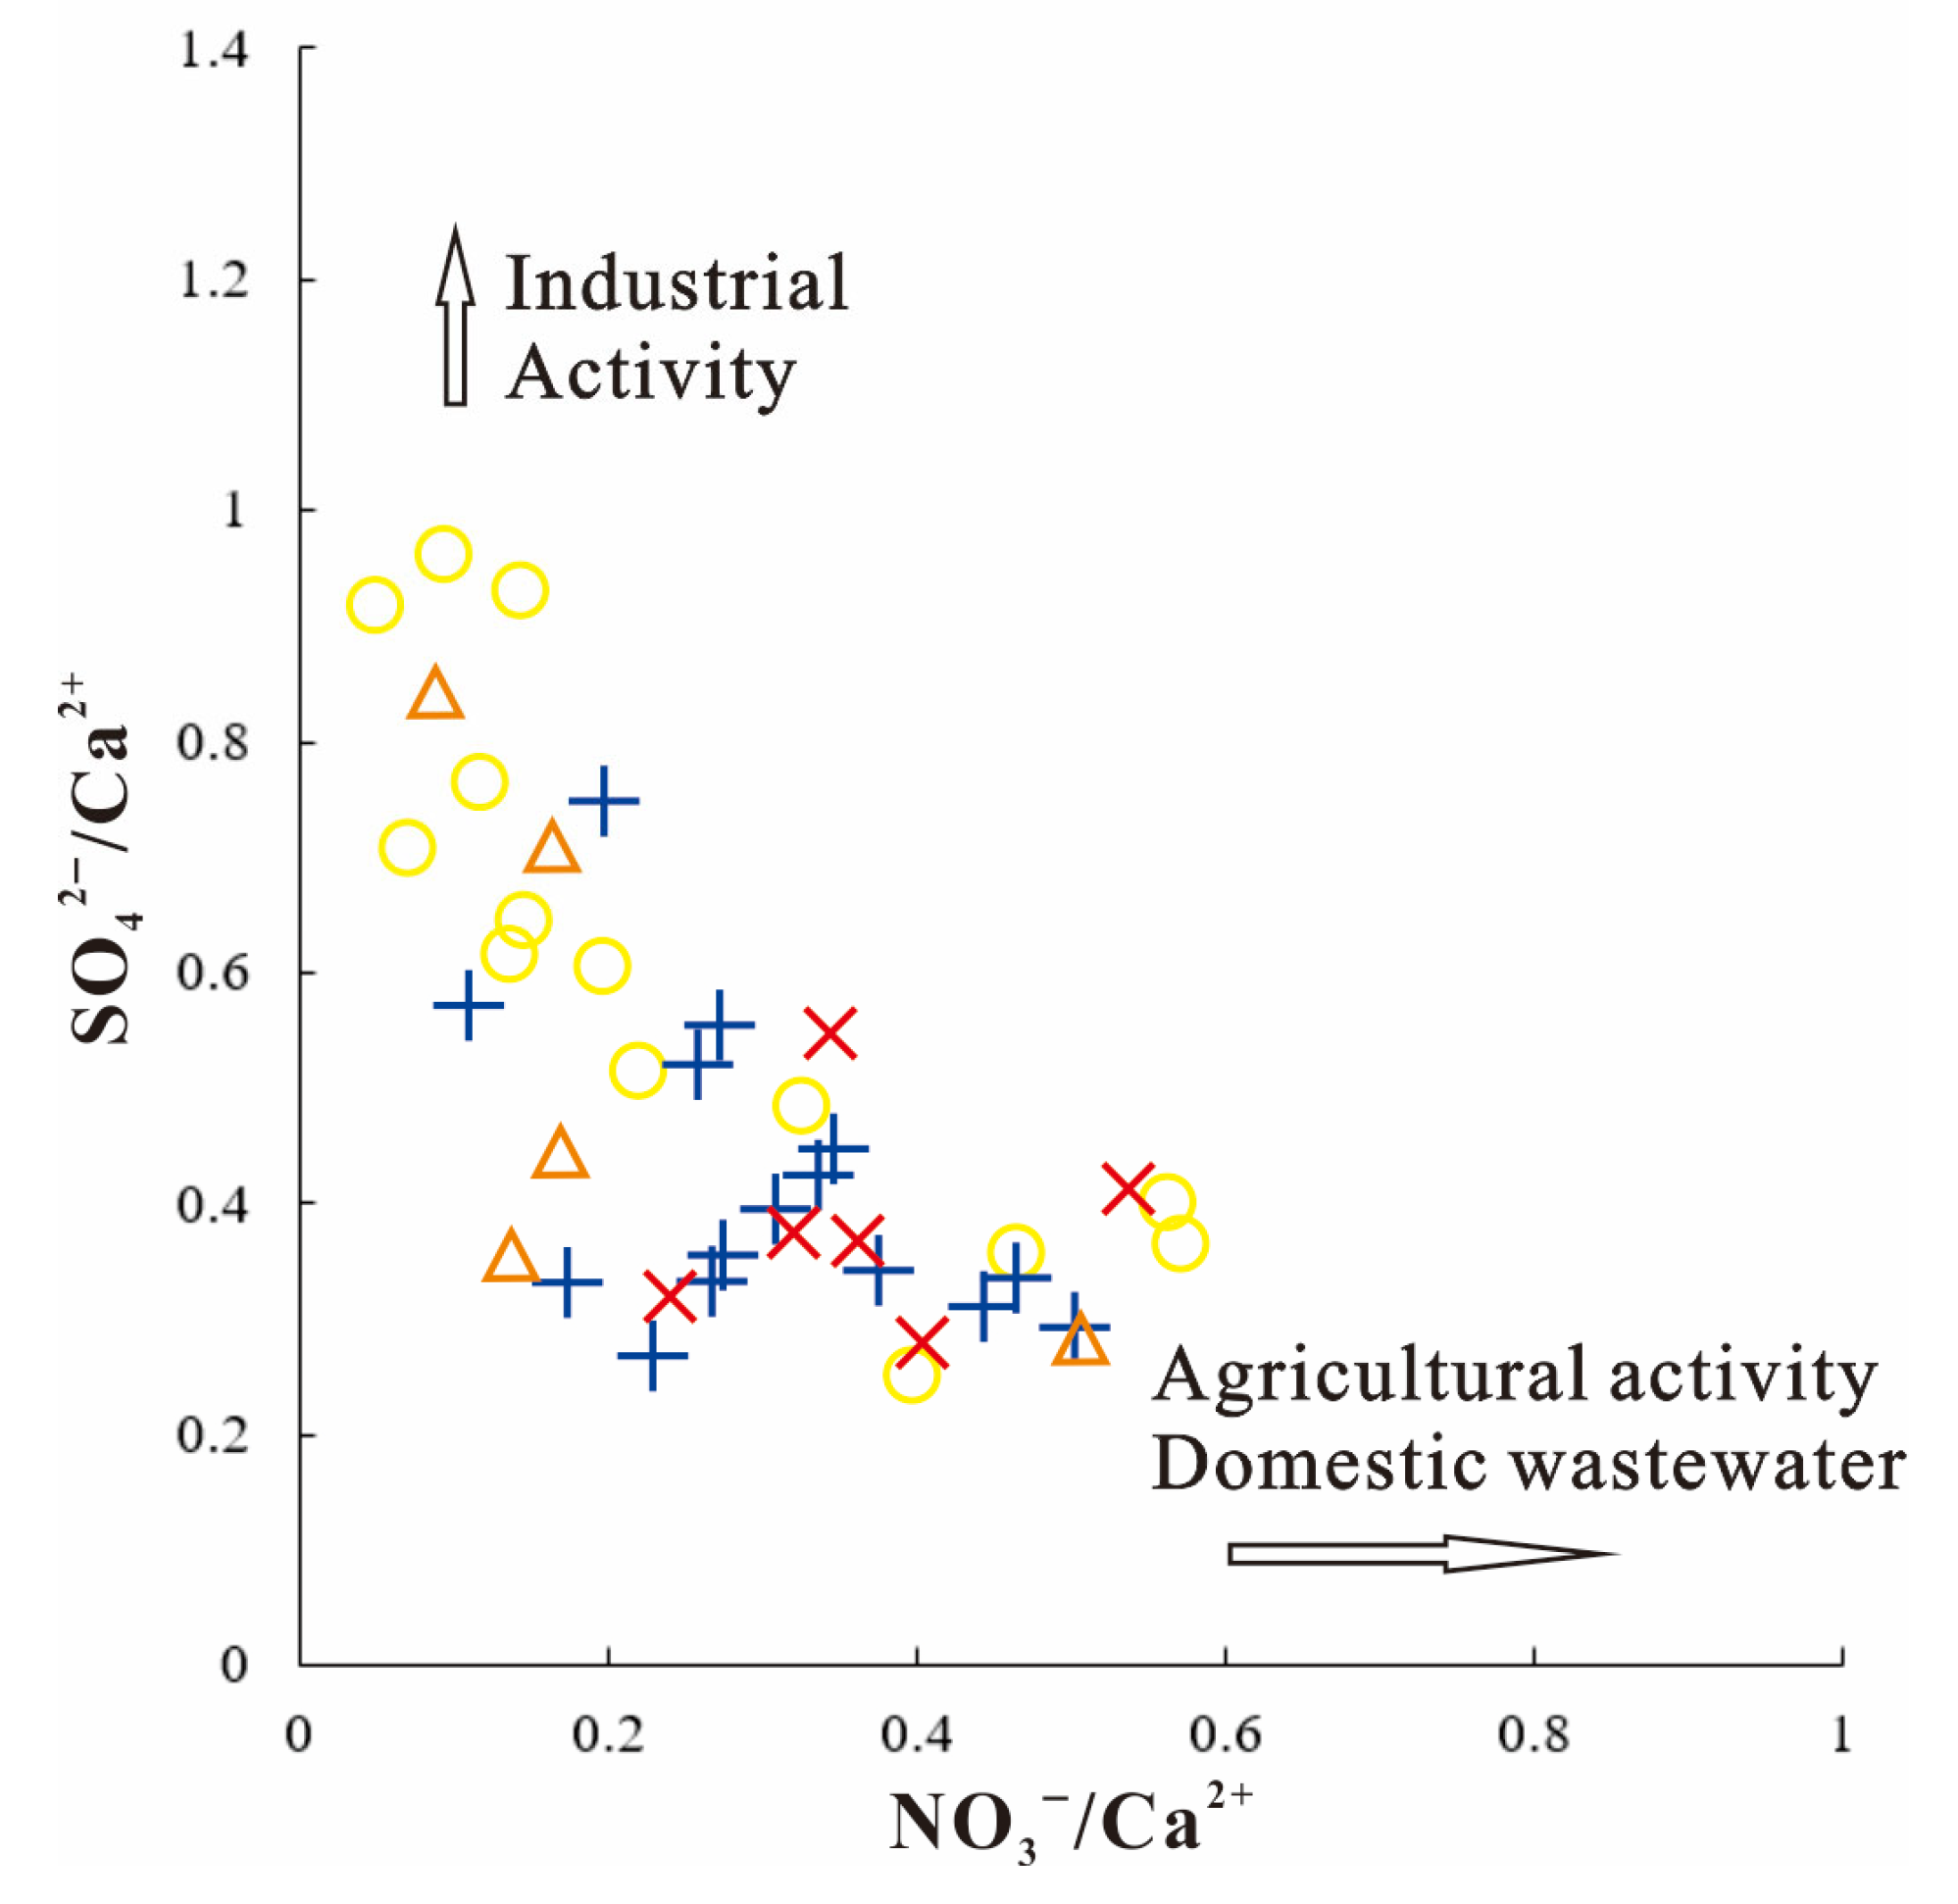
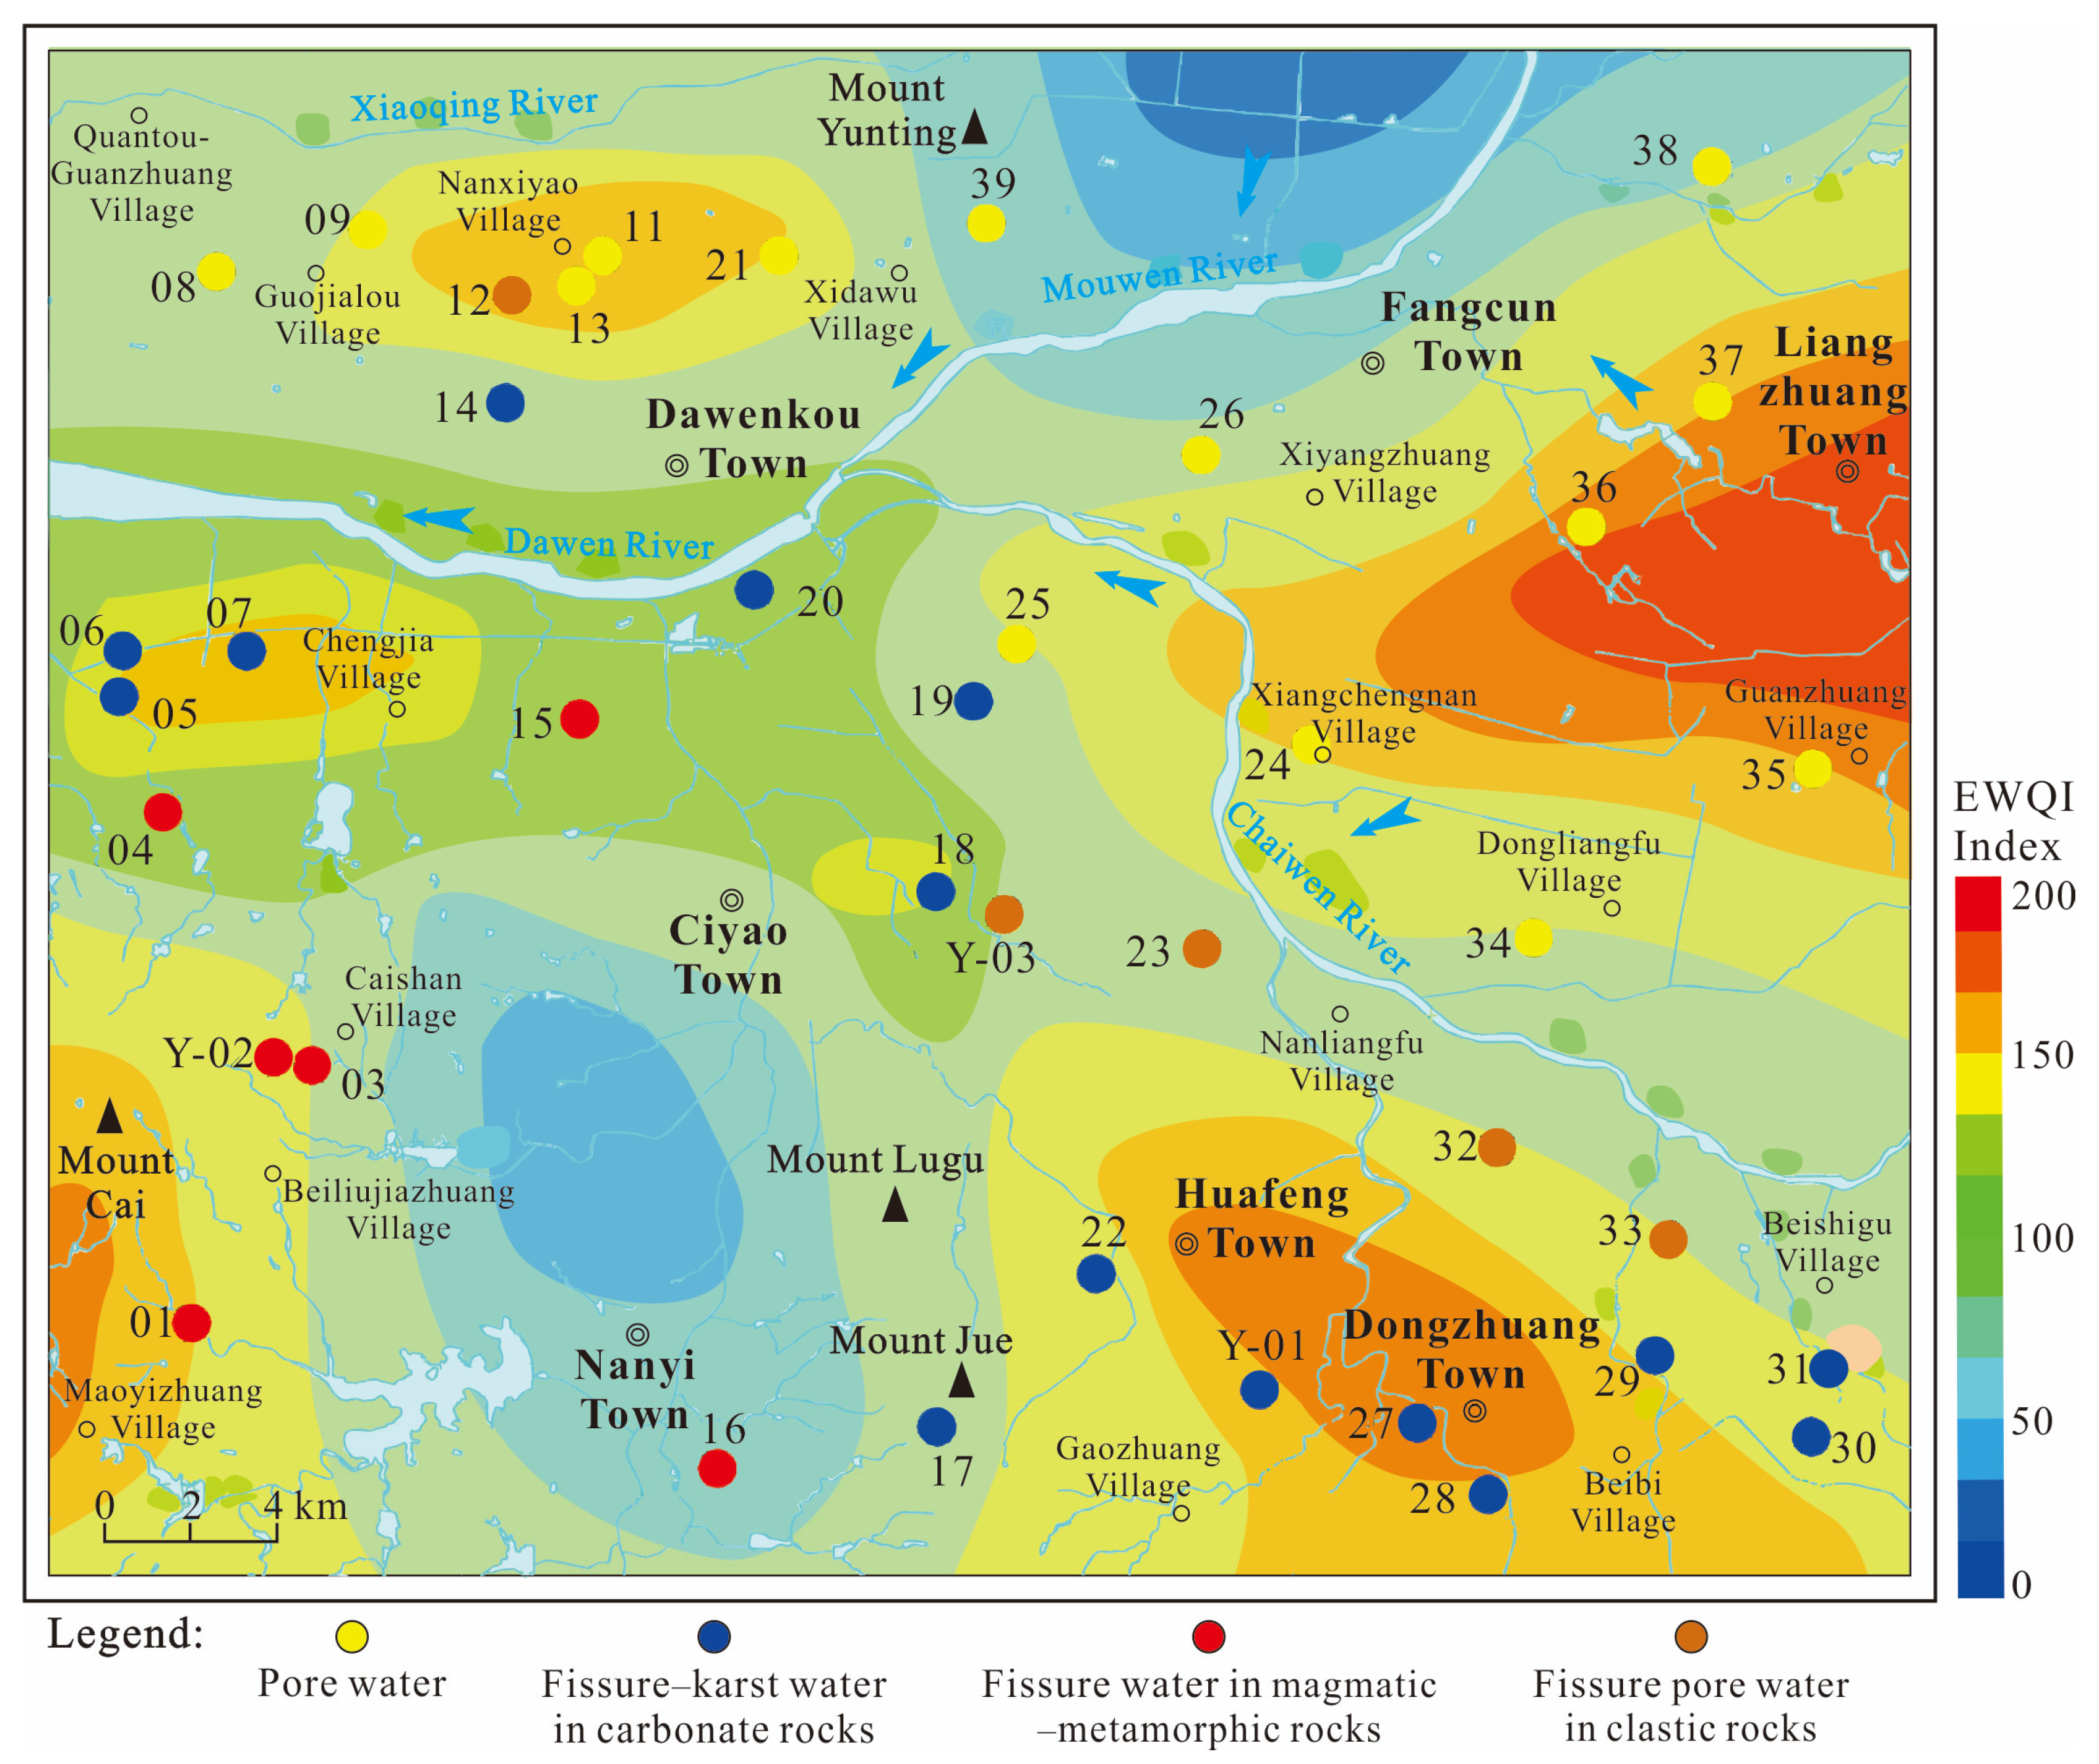
- EWQI evaluation reveals that groundwater quality in the central DRB, while generally good overall (average EWQI = 156.2), exhibits significant spatial variability controlled by hydrogeological setting. Localized high-pollution zones were identified within the basin’s midstream region, contrasting with previous basin-wide assessments. Porous water in eastern agricultural areas suffers from nitrogenous agrochemical pollution, while karst water in southern mining/industrial zones is impacted by pollutant discharges. This research underscores the urgency for customized correction measures aimed at particular aquifer categories and land-use practices within the designated areas of high risk.
Author Contributions
Funding
Data Availability Statement
Conflicts of Interest
References
- Varol, S.; Davraz, A. Evaluation of the groundwater quality with WQI (Water Quality Index) and multivariate analysis: A case study of the Tefenni plain (Burdur/Turkey). Environ. Earth Sci. 2015, 73, 1725–1744. [Google Scholar] [CrossRef]
- Mirzaei Aminiyan, M.; Mirzaei Aminiyan, F.; Heydariyan, A. Study on hydrochemical characterization and annual changes of surface water quality for agricultural and drinking purposes in semi-arid area. Sustain. Water Resour. Manag. 2016, 2, 473–487. [Google Scholar] [CrossRef]
- Everest, T.; Özcan, H. Applying multivariate statistics for identification of groundwater resources and qualities in NW Turkey. Environ. Monit. Assess. 2019, 191, 47. [Google Scholar] [CrossRef]
- El Alfy, M.; Lashin, A.; Abdalla, F.; Al-Bassam, A. Assessing the hydrogeochemical processes affecting groundwater pollution in arid areas using an integration of geochemical equilibrium and multivariate statistical techniques. Environ. Pollut. 2017, 229, 760–770. [Google Scholar] [CrossRef]
- Li, C.; Gao, Z.; Chen, H.; Wang, J.; Liu, J.; Li, C.; Teng, Y.; Liu, C.; Xu, C. Hydrochemical analysis and quality assessment of groundwater in southeast North China Plain using hydrochemical, entropy-weight water quality index, and GIS techniques. Environ. Earth Sci. 2021, 80, 523. [Google Scholar] [CrossRef]
- Qian, H.; Chen, J.; Howard, K.W.F. Assessing groundwater pollution and potential remediation processes in a multi-layer aquifer system. Environ. Pollut. 2020, 263, 114669. [Google Scholar] [CrossRef]
- Gao, Y.; Qian, H.; Ren, W.; Wang, H.; Liu, F.; Yang, F. Hydrogeochemical characterization and quality assessment of groundwater based on integrated-weight water quality index in a concentrated urban area. J. Clean. Prod. 2020, 260, 121006. [Google Scholar] [CrossRef]
- Gao, Z.; Han, C.; Xu, Y.; Zhao, Z.; Luo, Z.; Liu, J. Assessment of the water quality of groundwater in Bohai Rim and the controlling factors—A case study of northern Shandong Peninsula, north China. Environ. Pollut. 2021, 285, 117482. [Google Scholar] [CrossRef]
- Xiao, J.; Wang, L.; Deng, L.; Jin, Z. Characteristics, sources, water quality and health risk assessment of trace elements in river water and well water in the Chinese Loess Plateau. Sci. Total Environ. 2019, 650, 2004–2012. [Google Scholar] [CrossRef]
- Arto, I.; Andreoni, V.; Rueda-Cantuche, J.M. Global use of water resources: A multiregional analysis of water use, water footprint and water trade balance. Water Resour. Econ. 2016, 15, 1–14. [Google Scholar] [CrossRef]
- Adimalla, N. Controlling factors and mechanism of groundwater quality variation in semiarid region of South India: An approach of water quality index (WQI) and health risk assessment (HRA). Environ. Geochem. Health 2020, 42, 1725–1752. [Google Scholar] [CrossRef]
- Hua, K.; Xiao, J.; Li, S.; Li, Z. Analysis of hydrochemical characteristics and their controlling factors in the Fen River of China. Sustain. Cities Soc. 2020, 52, 101827. [Google Scholar] [CrossRef]
- Ma, T.; Sun, S.; Fu, G.; Hall, J.W.; Ni, Y.; He, L.; Yi, J.; Zhao, N.; Du, Y.; Pei, T.; et al. Pollution exacerbates China’s water scarcity and its regional inequality. Nat. Commun. 2020, 11, 650. [Google Scholar] [CrossRef]
- Sun, C.; Yang, L.; Hu, D. Groundwater ecological sensitivity assessment in the lower Liaohe River Plain based on GIS technique. Acta Ecol. Sin. 2011, 31, 7428–7440. [Google Scholar]
- Cosgrove, W.J.; Loucks, D.P. Water management: Current and future challenges and research directions. Water Resour. Res. 2015, 51, 4823–4839. [Google Scholar] [CrossRef]
- Li, Q.; Zhou, J.; Zhou, Y.; Bai, C.; Tao, H.; Jia, R.; Ji, Y.; Yang, G. Variation of groundwater hydrochemical characteristics in the plain area of the Tarim Basin, Xinjiang Region, China. Environ. Earth Sci. 2014, 72, 4249–4263. [Google Scholar] [CrossRef]
- Liu, J.; Peng, Y.; Li, C.; Gao, Z.; Chen, S. Characterization of the hydrochemistry of water resources of the Weibei Plain, Northern China, as well as an assessment of the risk of high groundwater nitrate levels to human health. Environ. Pollut. 2021, 268, 115947. [Google Scholar] [CrossRef]
- Liu, J.; Peng, Y.; Li, C.; Gao, Z.; Chen, S. An investigation into the hydrochemistry, quality and risk to human health of groundwater in the central region of Shandong Province, North China. J. Clean. Prod. 2021, 282, 125416. [Google Scholar] [CrossRef]
- Zhang, Q.; Qian, H.; Xu, P.; Hou, K.; Yang, F. Groundwater quality assessment using a new integrated-weight water quality index (IWQI) and driver analysis in the Jiaokou Irrigation District, China. Ecotoxicol. Environ. Saf. 2021, 212, 111992. [Google Scholar] [CrossRef]
- Xiao, J.; Wang, L.; Chai, N.; Liu, T.; Jin, Z.; Rinklebe, J. Groundwater hydrochemistry, source identification and pollution assessment in intensive industrial areas, eastern Chinese loess plateau. Environ. Pollut. 2021, 278, 116930. [Google Scholar] [CrossRef]
- Omonona, O.V.; Okogbue, C.O. Hydrochemical evolution, geospatial groundwater quality and potential health risks associated with intake of nitrate via drinking water: Case of Gboko agricultural district, central Nigeria. Environ. Earth Sci. 2021, 80, 126. [Google Scholar] [CrossRef]
- Turan, V.; Aydın, S.; Sönmez, O. Production, Cost Analysis, and Marketing of Bioorganic Liquid Fertilizers and Plant Nutrition Enhancers. In Industrial Microbiology Based Entrepreneurship. Microorganisms for Sustainability; Amaresan, N., Dharumadurai, D., Cundell, D.R., Eds.; Springer: Singapore, 2022; Volume 42. [Google Scholar]
- Singaraja, C. Relevance of water quality index for groundwater quality evaluation: Thoothukudi District, Tamil Nadu, India. Appl. Water Sci. 2017, 7, 2157–2173. [Google Scholar] [CrossRef]
- Adimalla, N.; Qian, H. Groundwater quality evaluation using water quality index (WQI) for drinking purposes and human health risk (HHR) assessment in an agricultural region of Nanganur, south India. Ecotoxicol. Environ. Saf. 2019, 176, 153–161. [Google Scholar] [CrossRef]
- Gao, Z.; Han, C.; Yuan, S.; Liu, J.; Peng, Y.; Li, C. Assessment of the hydrochemistry, water quality, and human health risk of groundwater in the northwest of Nansi Lake Catchment, north China. Environ. Geochem. Health. 2022, 44, 961–977. [Google Scholar] [CrossRef]
- Zhang, Q.; Xu, P.; Qian, H. Groundwater Quality Assessment Using Improved Water Quality Index (WQI) and Human Health Risk (HHR) evaluation in a semi-arid region of Northwest China. Expo. Health 2020, 12, 487–500. [Google Scholar] [CrossRef]
- Raja, V.; Neelakantan, M.A. Evaluation of groundwater quality with health risk assessment of fluoride and nitrate in Virudhunagar district, Tamil Nadu, India. Arab. J. Geosci. 2021, 14, 52. [Google Scholar] [CrossRef]
- Chen, P.; Liu, Y.M.; Chen, H.Y.; Yuan, Q.W.; Chen, Q.Z.; Mei, S.L.; Wu, Z.H. Analysis of hydrogeochemical characteristics of tunnel groundwater based on multivariate statistical technology. Geofluids 2021, 1, 4867942. [Google Scholar]
- Loaiza, J.G.; Bustos-Terrones, Y.; Bustos-Terrones, V.; Monjardín-Armenta, S.A.; Quevedo-Castro, A.; Estrada-Vazquez, R.; Rangel-Peraza, J.G. Evaluation of the Hydrochemical and Water Quality Characteristics of an Aquifer Located in an Urbanized Area. Appl. Sci. 2022, 12, 6879. [Google Scholar] [CrossRef]
- Piper, A.M. A Graphic Procedure in the Geochemical Interpretation of Water-Analyses. Eos Trans. Am. Geophys. Union 1944, 25, 914–928. [Google Scholar]
- Marandi, A.; Shand, P. Groundwater chemistry and the Gibbs Diagram. Appl. Geochem. 2018, 97, 209–212. [Google Scholar] [CrossRef]
- Mukherjee, I.; Singh, U.K. Fluoride abundance and their release mechanisms in groundwater along with associated human health risks in a geologically heterogeneous semi-arid region of east India. Microchem. J. 2020, 152, 104304. [Google Scholar] [CrossRef]
- Ismail, E.; Snousy, M.G.; Alexakis, D.E.; Abdelhalim, A.; Ahmed, M.S.; Elsayed, E. Diagnosis of groundwater quality in North Assiut Province, Egypt, for drinking and irrigation uses by applying multivariate statistics and hydrochemical methods. Water 2023, 15, 2812. [Google Scholar] [CrossRef]
- Boudibi, S.; Sakaa, B.; Benguega, Z. Spatial variability and risk assessment of groundwater pollution in El-Outaya region, Algeria. J. Afr. Earth Sci. 2021, 176, 104135. [Google Scholar] [CrossRef]
- Zhan, H.; Wu, Q.; Liu, B.; Zhou, G. Exploration of hydrogeochemical characterization and assessment of organic pollution characteristics of shallow groundwater near a chemical plant that discharged sewage illegally. Sustainability 2022, 14, 660. [Google Scholar] [CrossRef]
- Ha, Q.K.; Ngoc, T.D.T.; Le Vo, P.; Nguyen, H.Q.; Dang, D.H. Groundwater in Southern Vietnam: Understanding geochemical processes to better preserve the critical water resource. Sci. Total Environ. 2022, 807, 151345. [Google Scholar] [CrossRef]
- Lapworth, D.; Boving, T.; Brauns, B.; Dottridge, J.; Hynds, P.; Kebede, S.; Kreamer, D.; Misstear, B.; Mukherjee, A.; Re, V.; et al. Groundwater quality: Global challenges, emerging threats and novel approaches. Hydrogeol. J. 2023, 31, 15–18. [Google Scholar] [CrossRef]
- Omo-Irabor, O.O.; Olobaniyi, S.B.; Oduyemi, K.; Akunna, J. Surface and groundwater water quality assessment using multivariate analytical methods: A case study of the Western Niger Delta, Nigeria. Phys. Chem. Ear. Parts A/B/C 2008, 33, 666–673. [Google Scholar] [CrossRef]
- Thanh, N.N.; Chotpantarat, S.; Ngu, N.H.; Thunyawatcharakul, P.; Kaewdum, N. Integrating machine learning models with cross-validation and bootstrapping for evaluating groundwater quality in Kanchanaburi province, Thailand. Environ. Res. 2024, 252, 118952. [Google Scholar] [CrossRef]
- Biswas, T.; Pal, S.C.; Saha, A.; Ruidas, D. Arsenic and fluoride exposure in drinking water caused human health risk in coastal groundwater aquifers. Environ. Res. 2023, 238, 117257. [Google Scholar] [CrossRef]
- Ravindra, B.; Subba Rao, N.; Dhanamjaya Rao, E. N Groundwater quality monitoring for assessment of pollution levels and potability using WPI and WQI methods from a part of Guntur district, Andhra Pradesh, India. Environ. Dev. Sustain. 2024, 25, 14785–14815. [Google Scholar] [CrossRef]
- Sheng, D.R.; Meng, X.H.; Wen, X.H.; Wu, J.; Yu, H.J.; Wu, M.; Zhou, T. Hydrochemical characteristics, quality and health risk assessment of nitrate enriched coastal groundwater in northern China. J. Clean. Prod. 2023, 403, 136872. [Google Scholar] [CrossRef]
- Feng, J.; He, M.; Li, G.; Li, W.; Gao, Z.; Lu, Y.; Wang, Y. Analysis of hydrochemical characteristics and controlling factors of porewater in the Dawen Basin. Environ. Chem. 2019, 38, 2594–2600. [Google Scholar]
- Zhao, M.M.; Wang, S.M.; Chen, Y.P.; Wu, J.H.; Xue, L.G.; Fan, T.T. Pollution status of the Yellow River tributaries in middle and lower reaches. Sci. Total Environ. 2020, 722, 137861. [Google Scholar] [CrossRef]
- Liu, J.; Gao, Z.; Feng, J.; Wang, M. Identification of the hydrochemical features, genesis, water quality and potential health hazards of groundwater in Dawen River Basin, North China. Ecol. Indic. 2023, 149, 110175. [Google Scholar] [CrossRef]
- Wei, S.; Zhang, Y.; Cai, Z.; Bi, D.; Wei, H.; Zheng, X.; Man, X. Evaluation of groundwater quality and health risk assessment in Dawen River Basin, North China. Environ. Res. 2025, 264, 120292. [Google Scholar] [CrossRef]
- Wu, X.; Song, Y.X.; Wang, J.X.; Wang, J.X.; Gao, H.; Liu, C.W.; Li, B. Characterisation of groundwater chemistry in the upper reaches of the Chaiwen River, Shandong Province. Environ. Chem. 2021, 40, 2125–2134. [Google Scholar]
- Li, B.; Wu, X.; Zhang, Y.F.; Xu, C.C.; Liu, C.W.; Guan, Q.; Luo, F. Hydrogeological characteristics and groundwater enrichment pattern of water-bearing rock groups of the Paleocene Zhujiagou Formation in the lower reaches of the Chaiwen River, Shandong. Mod. Geol. 2021, 35, 675–681. [Google Scholar]
- Chen, Y.; Li, W.; Hou, Z.; Yu, S.Y.; Chen, S.; Song, Y. Clay minerals and provenancial implications of surface sediments in the Dongping Lake, North China. Quat. Int. 2023, 673, 53–61. [Google Scholar] [CrossRef]
- Gao, Z.J.; Wan, Z.P.; He, K.Q.; Victor, K.; Liu, J.T. Hydrochemical characteristics and controlling factors of karst groundwater in middle and upper reaches of Dawen River basin. Bull. Geol. Sci. Technol. 2022, 41, 264–272. [Google Scholar]
- Li, X.B.; Li, M.Y.; Zhang, X.M.; Ma, X.Q.; Sun, D.W.; Meng, Q.L.; Ma, C.M. Study on sulfate traceability of karst groundwater system in Tai’an city, Shandong Province. Min. Anal. 2025. [Google Scholar] [CrossRef]
- DZ/T 0064.2-2021; Methods for analysis of groundwater quality—Part 2: Collection and preservation of water samples. China Standard Press: Beijing, China, 2021.
- Goodarzi, M.R.; Abedi, M.J.; Niknam, A.R.R.; Heydaripour, M. Groundwater quality status based on a modification of water quality index in an arid area, Iran. Water Supply 2022, 22, 6245–6261. [Google Scholar] [CrossRef]
- Mamat, N.; Mohd Razali, S.F.; Hamzah, F.B. Enhancement of water quality index prediction using support vector machine with sensitivity analysis. Front. Environ. Sci. 2023, 10, 1061835. [Google Scholar] [CrossRef]
- Verma, M.; Loganathan, V.A.; Bhatt, V.K. Development of entropy and deviation- based water quality index: Case of river Ganga, India. Ecol. Indic. 2022, 143, 109319. [Google Scholar] [CrossRef]
- Zhou, J.X.; Ding, Y.J.; Zeng, G.X.; Wu, J.K.; Qin, J. Major ion chemistry of surface water in the upper reach of Shule River basin and the possible controls. Environ. Sci. 2014, 35, 3315–3324. [Google Scholar]
- Zhang, Y.; Wu, Y.; Yang, J.; Sun, H.Y. Hydrochemical characteristic and reasoning analysis in Siyi Town Langzhong City. Environ. Sci. 2015, 36, 3230–3237. [Google Scholar]
- He, J.; Ma, J.; Zhang, P.; Tian, L.; Zhu, G.; Edmunds, W.M.; Zhang, Q. Groundwater recharge environments and hydrogeo-chemical evolution in the Jiuquan Basin, Northwest China. Appl. Geochem. 2012, 27, 866–878. [Google Scholar] [CrossRef]
- Xing, L.N. Groundwater Hydrochemical Characteristics and Hydrogeochemical Processes Approximately Along Flow Paths in the North China Plain. Master’s Thesis, China University of Geosciences, Beijing, China, 2012. [Google Scholar]
- Pu, J.B. Hydrogen and oxygen isotope geochemistry of karst groundwater in Chongiqng. Acta Geosci. Sin. 2013, 34, 713–722. [Google Scholar]
- Liu, Y.Q.; Zhou, L.; Li, W.; Zhu, Q.J.; Xu, M.; Lv, L.; Deng, Q.J.; He, J.; Wang, X.F. The characteristics and genetic analysis of the paleogene semi-consolidated water-bearing formation on the northwestern margin of Laiwu Basin, Shandong Province. Acta Geosci. Sin. 2018, 39, 737–748. [Google Scholar]
- He, X.Q.; Gao, Z.J.; He, J.; Li, W.; Deng, Q.J. Hydrochemical characteristics of groundwater in typical sections of the upper reaches of dawen river basin and analysis of its influencing factors. Sci. Technol. Eng. 2020, 20, 7558–7566. [Google Scholar]
- Zhou, L.; Liu, Y.Q.; Li, W.; Zhu, Q.J.; Li, F.Z.; Lv, L.; Deng, Q.J.; Ma, X.M.; He, J. Characteristics of the Paleogene waterbearing Formation in the middle and upper reaches of the Dawenhe River basin, Shandong Province. Geol. China 2019, 46, 316–327. [Google Scholar]
- Dotsika, E.; Lykoudis, S.; Poutoukis, D. Spatial distribution of the isotopic composition of precipitation and spring water in Greece. Glob. Planet. Change 2010, 71, 141–149. [Google Scholar] [CrossRef]
- Gibbs, R.J. Mechanisms controlling world water chemistry. Science 1970, 170, 1088–1090. [Google Scholar] [CrossRef]
- Chetelat, B.; Liu, C.Q.; Zhao, Z.Q.; Wang, Q.L.; Li, S.L.; Li, J.; Wang, B.L. Geochmistry of the dissolved load of the Changjiang Basin Rivers: Anthropogenic impacts and chemical weathering. Geochim. Cosmochim. Acta 2008, 72, 4254–4277. [Google Scholar] [CrossRef]
- Wei, X.; Zhou, J.L.; Nai, W.H.; Zeng, Y.Y.; Fan, W.; Li, B. Hydrochemical characteristics and evolution of groundwater in the Kashgar Delta area in Xinjiang. Environ. Sci. 2019, 40, 4042–4051. [Google Scholar]
- Gaillardet, J.; Dupré, B.; Louvat, P.; Allègre, C.J. Global silicate weathering and CO2 consumption rates deduced from the chemistry of large rivers. Chem. Geol. 1999, 159, 3–30. [Google Scholar] [CrossRef]
- Liu, J.; Wang, M.; Gao, Z.; Chen, Q.; Wu, G.; Li, F. Hydrochemical characteristics and water quality assessment of groundwater in the Yishu River basin. Acta Geophys. 2020, 68, 877–889. [Google Scholar] [CrossRef]
- Lin, M.L.; Peng, W.H.; Gui, H.R. Hydrochemical characteristics and quality assessment of deep groundwater from the coal-bearing aquifer of the Linhuan coal-mining district, Northern Anhui Province, China. Environ. Monit. Assess. 2016, 188, 202. [Google Scholar] [CrossRef]
- Feng, J.G.; Ji, D.S.; Gao, Z.J.; Yang, L.Z.; Zhu, H.H.; Liu, Z.Z. Hydrochemical characteristics and water quality evalution of groundwater in Zibo Dawu water source, Shandong Province. J. Chang. River Sci. Res. Inst. 2020, 37, 18–23. [Google Scholar]
- Yang, N.; Su, C.L.; Zeng, H.B.; Li, Z.M.; Liu, W.B.; Kang, W. Evolutional processes of groundwater in Xinglong County based on hydrochemistry and hydrogen and oxygen isotopes. Hydrogeol. Eng. Geol. 2020, 47, 154–162. [Google Scholar]
- Zhang, Y.; Su, C.L.; Ma, Y.H.; Liu, W.J. Indicators of groundwater evolution processes based on hydrochemistry and envi-ronmental isotopes: A case study of the Dongyuan drinking water source area in Ji’nan City. Environ. Sci. 2019, 40, 2667–2674. [Google Scholar]
- Zhu, B.; Yang, X.; Rioual, P.; Qin, X.; Liu, Z.; Xiong, H.; Yu, J. Hydrogeochemistry of three watersheds (the Erlqis, Zhungarer and Yili) in northern Xinjiang, NW China. Appl. Geochem. 2011, 26, 1535–1548. [Google Scholar] [CrossRef]
- Charfi, S.; Zouari, K.; Feki, S.; Mami, E. Study of variation in groundwater quality in a coastal aquifer in north-eastern Tunisia using multivariate factor analysis. Quat. Int. 2013, 302, 199–209. [Google Scholar] [CrossRef]
- Zuo, Y.Z.; An, Y.L.; Wu, Q.X.; Qu, K.J.; Fan, G.H.; Ye, Z.X.; Qin, L.; Qian, J.T.; Tu, C.L. Study on the hydrochemical characteris-tics of Duliu River basin in Guizhou Province. China Environ. Sci. 2017, 37, 2684–2690. [Google Scholar]
- GB/T 14848-2017; Standard for groundwater quality. China Standard Press: Beijing, China, 2018.
- Zhang, J. Study on the evolution of groundwater quality and its formation mechanism in the plain area of Yarkant River Basin. Ph.D. Thesis, Xinjiang Agricultural University, Urumqi, China, 2022. [Google Scholar]

| Classification Level | I | II | III | IV | V |
|---|---|---|---|---|---|
| EQWI | ≤50 | 51~100 | 101~150 | 151~200 | ≥200 |
| Description | Unpolluted | Low pollution | Moderate pollution | High pollution | Very significant pollution |
| K+ | Na+ | Ca2+ | Mg2+ | Cl− | SO42− | HCO3− | NO3− | TDS | pH | |
|---|---|---|---|---|---|---|---|---|---|---|
| AVG | 3.5 | 55.9 | 229.9 | 36.5 | 156.1 | 279.3 | 200.2 | 203.4 | 1075.4 | 7.8 |
| MAX | 37.3 | 120.7 | 505.1 | 108.4 | 328.3 | 1124.4 | 386.2 | 736.1 | 2420 | 8.2 |
| MIN | 0.3 | 10.5 | 91.8 | 13.1 | 42.9 | 78.8 | 73.5 | 27.1 | 450 | 7.5 |
| SD | 5.9 | 31.0 | 106.4 | 19.3 | 76.2 | 194.0 | 62.3 | 148.1 | 461.7 | 0.17 |
| K+ | Na+ | Ca2+ | Mg2+ | Cl− | SO42− | HCO3− | NO3− | TDS | PH | |
|---|---|---|---|---|---|---|---|---|---|---|
| K+ | 1 | |||||||||
| Na+ | 0.183 | 1 | ||||||||
| Ca2+ | −0.008 | 0.373 * | 1 | |||||||
| Mg2+ | 0.258 | 0.451 ** | 0.641 ** | 1 | ||||||
| Cl− | 0.048 | 0.787 ** | 0.756 ** | 0.679 ** | 1 | |||||
| SO42− | 0.079 | 0.598 ** | 0.793 ** | 0.766 ** | 0.758 ** | 1 | ||||
| HCO3− | 0.129 | 0.144 | 0.349 * | 0.321 * | 0.215 | 0.136 | 1 | |||
| NO3− | 0.109 | −0.117 | 0.649 ** | 0.308 | 0.266 | 0.158 | 0.186 | 1 | ||
| TDS | 0.117 | 0.521 * | 0.969 ** | 0.774 ** | 0.831 ** | 0.854 ** | 0.329 * | 0.604 ** | 1 | |
| PH | 0.014 | 0.029 | −0.471 ** | −0.081 | −0.158 | −0.165 | −0.521 ** | −0.403 ** | −0.368 * | 1 |
| Pore Water | Fissure–Karst Water in Carbonate Rocks | Fissure Water in Magmatic–Metmorphic Rocks | Fissure Pore Water in Clastic Rocks | ||
|---|---|---|---|---|---|
| δ2H (‰) | MAX | −32.5 | −44.6 | −56 | −48.7 |
| MIN | −57.7 | −59.6 | −57.6 | −55.6 | |
| AVG | −50.7 | −53.2 | −56.8 | −52.5 | |
| δ18O (‰) | MAX | −4.5 | −5.4 | −7.5 | −6.6 |
| MIN | −7.7 | −8 | −7.8 | −7.2 | |
| AVG | −6.8 | −6.9 | −7.5 | −7.0 |
| Range | Level | Classification | Samples | ||||
|---|---|---|---|---|---|---|---|
| Study Area | Porous Water | Karst Water | Fissure Water | Fissure Porous Water | |||
| ≤50 | I | Unpolluted | 0 | 0 | 0 | 0 | 0 |
| 51~100 | II | Low pollution | 12 (80.2) | 4 (81.7) | 3 (75.9) | 2 (76.0) | 3 (85.3) |
| 101~150 | III | Moderate pollution | 10 (131.5) | 3 (134.2) | 3 (129.2) | 3 (135.9) | 1 (117.1) |
| 151~200 | IV | High pollution | 8 (181.3) | 1 (196.9) | 5 (171.9) | 2 (193.2) | 0 |
| ≥200 | V | Very significant pollution | 10 (263.4) | 6 (280.7) | 4 (228.9) | 0 | 0 |
Disclaimer/Publisher’s Note: The statements, opinions and data contained in all publications are solely those of the individual author(s) and contributor(s) and not of MDPI and/or the editor(s). MDPI and/or the editor(s) disclaim responsibility for any injury to people or property resulting from any ideas, methods, instructions or products referred to in the content. |
© 2025 by the authors. Licensee MDPI, Basel, Switzerland. This article is an open access article distributed under the terms and conditions of the Creative Commons Attribution (CC BY) license (https://creativecommons.org/licenses/by/4.0/).
Share and Cite
Hu, C.; Peng, K.; Zhu, H.; Li, S.; Qin, P.; Hu, Y.; Wang, N. Hydrogeochemical Characteristics, Formation Mechanisms, and Groundwater Evaluation in the Central Dawen River Basin, Northern China. Water 2025, 17, 2238. https://doi.org/10.3390/w17152238
Hu C, Peng K, Zhu H, Li S, Qin P, Hu Y, Wang N. Hydrogeochemical Characteristics, Formation Mechanisms, and Groundwater Evaluation in the Central Dawen River Basin, Northern China. Water. 2025; 17(15):2238. https://doi.org/10.3390/w17152238
Chicago/Turabian StyleHu, Caiping, Kangning Peng, Henghua Zhu, Sen Li, Peng Qin, Yanzhen Hu, and Nan Wang. 2025. "Hydrogeochemical Characteristics, Formation Mechanisms, and Groundwater Evaluation in the Central Dawen River Basin, Northern China" Water 17, no. 15: 2238. https://doi.org/10.3390/w17152238
APA StyleHu, C., Peng, K., Zhu, H., Li, S., Qin, P., Hu, Y., & Wang, N. (2025). Hydrogeochemical Characteristics, Formation Mechanisms, and Groundwater Evaluation in the Central Dawen River Basin, Northern China. Water, 17(15), 2238. https://doi.org/10.3390/w17152238