Article

The Hydrochemical Dynamics and Water Quality Evolution of the Rizhao Reservoir and Its Tributary Systems

1
No. 8 Institute of Geology and Mineral Resources Exploration of Shandong Province, Rizhao 276826, China
2
Rizhao Coastal Soil and Water Observation and Research Station, Rizhao 276826, China
3
College of Earth Science and Engineering, Shandong University of Science and Technology, Qingdao 266590, China
4
Rizhao Municipal Bureau of Natural Resources and Planning, Rizhao 276800, China
*
Author to whom correspondence should be addressed.
Water 2025, 17(15), 2224; https://doi.org/10.3390/w17152224
Submission received: 18 June 2025 / Revised: 13 July 2025 / Accepted: 14 July 2025 / Published: 25 July 2025
(This article belongs to the Topic Human Impact on Groundwater Environment, 2nd Edition)

Abstract

Rizhao Reservoir, Shandong Province, China, as a key regional water supply hub, provides water for domestic, industrial, and agricultural uses in and around Rizhao City by intercepting runoff, which plays a central role in guaranteeing water supply security and supporting regional development. This study systematically collected 66 surface water samples to elucidate the hydrochemical characteristics within the reservoir area, identify the principal influencing factors, and clarify the sources of dissolved ions, aiming to enhance the understanding of the prevailing water quality conditions. A systematic analysis of hydrochemical facies, solute provenance, and governing processes in the study area’s surface water was conducted, employing an integrated mathematical and statistical approach, comprising Piper trilinear diagrams, correlation analysis, and ionic ratios. Meanwhile, the entropy weight-based water quality index (EWQI) and irrigation water quality evaluation methods were employed to assess the surface water quality in the study area quantitatively. Analytical results demonstrate that the surface water system within the study area is classified as freshwater with circumneutral to slightly alkaline properties, predominantly characterized by Ca-HCO3 and Ca-Mg-SO4-Cl hydrochemical facies. The evolution of solute composition is principally governed by rock–water interactions, whereas anthropogenic influences and cation exchange processes exert comparatively minor control. Dissolved ions mostly originate from silicate rock weathering, carbonate rock dissolution, and sulfate mineral dissolution processes. Potability assessment via the entropy-weighted water quality index (EWQI) classifies surface waters in the study area as Grade I (Excellent), indicating compliance with drinking water criteria under defined boundary conditions. Irrigation suitability analysis confirms minimal secondary soil salinization risk during controlled agricultural application, with all samples meeting standards for direct irrigation use.

1. Introduction

As the key to human survival, there is no substitute for water resources. Surface water (including rivers, lakes, and reservoirs) represents the most directly accessible freshwater resource. Characterized by rapid renewal cycles, broad spatial distribution, and ease of extraction, it constitutes the primary source of global anthropogenic water consumption. However, its exposure to the surface makes it highly susceptible to pollution while making it easy to serve the needs of irrigated agriculture, urban water supply, and hydropower generation [1,2,3,4]. Population expansion and rapid socio-economic development have driven a surge in resource consumption, and surface water is under increasing pressure from irrational use, overexploitation, and pollution [5,6,7]. Constrained water security resulting from diminishing reserves, uneven spatiotemporal allocation, and physicochemical deterioration (notably nutrient enrichment and trace metal pollution) has operationally impeded socio-ecological system sustainability [8,9]. More importantly, over the past few decades, these problems have led to severe environmental disasters, including soil erosion, river outflow, shrinking lakes, a sharp decline in biodiversity, and outbreaks of cyanobacteria [10]. To promote the sustainable use of regional surface water resources, ecological environment, and socio-economic coordination, we must prioritize clarifying the hydrological cycle characteristics of surface water bodies, the rules governing water quality changes, and the internal driving mechanisms [11]. This constitutes the scientific foundation for integrated water resources stewardship, serving as an essential precondition for securing hydrologic sustainability and maintaining aquatic ecosystem resilience.
The quality of surface water is characterized by its complex chemical composition, which is formed through the exchange of substances with the surrounding natural environment and the combined effects of human activities during the long course of the water cycle [12,13]. Surface water quality assessment plays an indispensable role in the development of comprehensive surface water environmental assessment and protection strategies, guiding the direction of sustainable surface water management and protection [14,15]. Through detailed testing and scientific analysis of the hydrochemical properties of surface water, we can evaluate its quality, laying the foundation for the construction of a scientific and reasonable regional surface water quality management system, and thus guaranteeing that surface water will continue to play a positive and crucial role in the ecological and social dimensions [16,17].
Surface water in the Rizhao Reservoir Basin serves as both the primary source of regional water supply and the core link in the water ecosystem, having a strategic impact on the protection of people’s livelihoods and sustainable development [18]. However, there is still a lack of systematic research on the hydrological processes and water quality dynamics. This study integrates long-term monitoring data from reservoir hydrological stations, combines hydrological methods and multivariate statistical techniques, and aims to achieve three objectives: (1) to analyze the basic characteristics of hydrology and water quality in the reservoir area; (2) to reveal the spatial and temporal evolution patterns of the key water quality parameters; and (3) to assess the comprehensive environmental status of the water body and the trend of long-term evolution. The results of the study not only provide scientific support for the construction of adaptive management strategies and ecological protection systems for surface water in the reservoir area, but also provide methodological references for small and medium-sized reservoir basins in the same type of monsoon area (especially those with both water supply and ecological functions).

2. Study Area

Located in the western Donggang District of Rizhao City, Shandong Province, the Rizhao Reservoir is a major comprehensive water conservancy project on the Futuan River, playing a crucial role in regional water resource management. The present study area mainly focuses on the Futuan River basin [19]. The study area is located in the eastern extension of the collision zone between the North China Plate and the Yangzi Plate. It is significantly influenced by the Yishu Fracture Zone (branch of the Tanlu Fracture). The rock mass near the fracture zone is fragmented, forming a water-conducting channel that may enhance the groundwater runoff capacity.
The study area’s lithostratigraphy is dominated by Proterozoic-Tg metamorphics (gneiss/schist) exhibiting moderate fracturing that hosts bedrock groundwater, with localized low-κ Mesozoic granites. Quaternary units comprise high-yield alluvium (sand/gravel-clay; κ = 5–20 m/d) and low-permeability residual deposits (clay-gravel).
Topographically, low hills dominate (50–200 m elevation; significant relief; thin regolith, exposed bedrock), interspersed with alluvial plains along rivers (e.g., Futuan River; flat terrain; thick Quaternary sediments: 5–20 m; important agricultural/groundwater-rich zone). The reservoir impounds upper Futuan River runoff; tributaries are developed [20]. Hydrologically, the area exhibits high wet-season surface runoff and predominant dry-season groundwater recharge. River terraces, containing significant gravel aquifers (unconfined), are widespread.
The Rizhao Reservoir basin features an oval topography with distinct elevational zonation: upper shallow mountainous areas (40% coverage, 200–400 m ASL) transition to mid-lower hilly regions (20%) and river valley plains (40%), exhibiting a west-to-east declination. Climatically, this warm-temperate humid monsoon zone displays marked seasonality, evidenced by a mean annual temperature of 12.6 °C (extreme range: −18.9 to 43 °C), precipitation averaging 817.6 mm (514.5–1206.1 mm) with 72.7% occurring in June–September, and northwestward-decreasing rainfall gradients. Supplementary hydrological characteristics include a 282.8 mm runoff depth, 1085.6 mm evaporation, 226-day frost-free period, 2503 h sunshine, and 72% humidity.

3. Materials and Methods

3.1. Collection and Methodology

In this study, six monitoring sites were established within the Futong River Basin for the collection of river water samples (hereinafter referred to as “river water”) during 2023 and 2024. Specifically, sampling for river water was conducted in August, October, and December of 2023, and in February, April, and June of 2024, yielding a cumulative total of 36 surface water samples. Concurrently, one monitoring site was deployed in the Rizhao Reservoir area to collect reservoir water samples (hereinafter referred to as “reservoir water”) over the period 2019–2023. For reservoir water, sampling was performed monthly in January, March, May, July, September, and November of each year, with detailed sampling information presented in Figure 1. Surface water sampling protocol: Pre-cleaned polyethylene bottles (2 × 1000 mL) underwent triple-rinsing with in situ water prior to collection. Samples were filled to capacity ensuring zero headspace to prevent atmospheric contamination. Sample custody procedure: Field-preserved samples were maintained at 4 °C during transit (<168 h) prior to ISO 17025 [21] -accredited laboratory analysis employing multiparameter water quality assessment. Subsequent to their arrival, a comprehensive assessment of the water quality parameters of these samples was conducted in the laboratory. Hydrochemical analyses adhered to standardized protocols: pH quantification utilized a calibrated S220-K (METTLER-TOLEDO, Switzerland) pH meter. Major cations (K+, Na+, Ca2+, Mg2+), total dissolved solids (TDS), and total hardness (TH) were determined via inductively coupled plasma optical emission spectrometry (ICP-OES; Optima 7000 DV, PerkinElmer, Springfield, IL, USA). Anionic species (Cl, SO42−, NO3) underwent separation by ion chromatography (ICS-600, Dionex, Sunnyvale, CA, USA), whereas bicarbonate alkalinity was assessed through Gran titration. All datasets conformed to |±5%| charge balance error thresholds, validating analytical precision in accordance with APHA 1030E guidelines.

3.2. Surface Water Quality Assessment

Employing information entropy theory, a novel Entropy-Weighted Water Quality Index (EWQI) framework was established to perform spatiotemporal assessment of surface water quality across the study region. Compared with the traditional water quality index (WQI), which has the limitation of relying on subjective weighting, EWQI quantifies the weighting coefficients of each water quality parameter objectively with the help of information entropy theory [22,23]. Unlike the traditional single-factor evaluation method (such as the Nemero Index), which focuses solely on individual exceedance parameters, the EWQI innovatively employs a synergistic analysis mechanism that integrates heterogeneous water quality parameters from multiple sources [24]. The model first eliminates scale differences through standardized preprocessing of polar deviation and then constructs an evaluation system that covers pH, TDS, and major anions and cations, allowing for systematic analysis of water quality pollution spatial variability.
The key indicators selected for this study were pH, TDS, TH, Na+, Cl, SO42−, and NO3-. The process consists of five steps: creating an initial water quality matrix, normalizing the data, determining the weights using the entropy weighting method, setting quantitative grading criteria, and calculating and classifying the water quality indices. The process of estimating the EWQI is as follows [25,26]:
The initial water quality matrix is created
X = x 11 x 1 n x m 1 x m n
where m is the number of water samples, and n is the number of water chemistry parameters.
The eigenvalue matrix obtained above is normalized by Equation (2), and then the standard evaluation matrix Y is obtained by Equation (3):
y i j = x i j min x j max x j min x j 0,1
Y = y 11 y 1 n y m 1 y m n
where max (xj) and min (xj) denote the maximum and minimum values of the same water chemistry parameter in all samples, respectively, and Yij is the normalization process.
Calculate the ratio Pij and information entropy eij by Equations (4) and (5)
P i j = y i j i = 1 m y i j 0,1
e j = 1 ln m × i = 1 m p i j ln p i j
where Pij is the ratio of parameter values of parameter j in sample i, obtained from Equation (5).
Calculate the entropy weight (wj) for each parameter and the grading index (qj) for indicator j through Equations (6) and (7)
w j = 1 e j j = 1 n 1 e j 0,1
q j = c j s j × 100
In the formula, cj is the measured concentration of chemical ions in surface water (mg/L), and sj indicates the permissible limit of indicator j. sj is the concentration of Class III ions determined according to the China Surface Water Quality Standard (GB 3838-2002) [27].
Calculation of EWQI according to Equation (8) is as follows:
E W Q I = j = 1 n w j q j

3.3. Evaluation of Agricultural Irrigation Water Quality

According to the contents of K+, Na+, Mg2+, Ca2+, and HCO3 in the water bodies, four evaluation systems, namely, sodium percentage method (Na%) [28], sodium adsorption ratio (SAR) [29], residual sodium carbonate (RSC) [30], and permeability index (PI) [31], were used to comprehensively evaluate the suitability of the river water and reservoir water for irrigation. Equations (9) and (10) were calculated, and according to the results of the four evaluations, the water bodies were classified into irrigation suitability levels, as shown in Table 1, where the unit of ion concentration is meq/L.
% N a = N a + M g 2 + + C a 2 + + N a + + K +
S A R = N a + C a 2 + M g 2 + 2
R S C = H C O 3 C a 2 + + M g 2 +
P I = N a + + H C O 3 C a 2 + + M g 2 + + N a +

4. Results and Discussion

4.1. Statistical Characterization of Surface Water Chemistry

Figure 2 present hydrochemical datasets from riverine (2023–2024) and reservoir (2019–2023) monitoring programs. Figure 2 presents the outcomes of water quality monitoring data, encompassing river water from 2023 to 2024 and reservoir water spanning 2019 to 2023. For river water, statistical analysis of hydrochemical characterization parameters revealed that the cation content followed the order of Ca2+ > Na+ > Mg2+ > K+, with their respective average mass concentrations being 45.04 mg/L, 26.37 mg/L, 14.59 mg/L, and 4.21 mg/L. This indicated that Ca2+ served as the dominant cation in the region. Regarding anions, the ranking sequence was HCO3 > SO42− > Cl > NO3, with average mass concentrations of 146.00 mg/L, 52.22 mg/L, 35.76 mg/L, and 1.49 mg/L, respectively. Among these, HCO3 was the major anion. The pH of the study area ranged from 7.63 to 9.68, with a mean value of 8.60, signifying that the surface water was alkaline and categorized as slightly hard water. The total hardness (TH) spanned from 127 mg/L to 232 mg/L, with a mean value of 172.53 mg/L. The total dissolved solids (TDS) ranged from 239.31 mg/L to 446.55 mg/L, with a mean value of 324.19 mg/L. Notably, the pH range (7.63–9.68) and mean value (8.60) of the surface water consistently reflected its alkaline nature and slight hardness, as previously stated.
Reservoir water hydrochemical analysis indicated cation concentrations followed the order Ca2+ > Na+ > Mg2+ > K+ (mean: 38.50, 16.45, 12.39, 3.93 mg/L, respectively), confirming Ca2+ as the dominant cation. Anion abundances ranked HCO3 > SO42− > Cl > NO3 (mean: 111.10, 51.22, 23.83, 1.29 mg/L), with HCO3 as the primary anion. The pH ranged from 7.30 to 9.00 (mean 8.29), indicating alkaline conditions. Total hardness (TH) and total dissolved solids (TDS) ranged from 109 to 192 mg/L (mean 147.17 mg/L) and 197.75 to 319.17 mg/L (mean 257.41 mg/L), respectively.
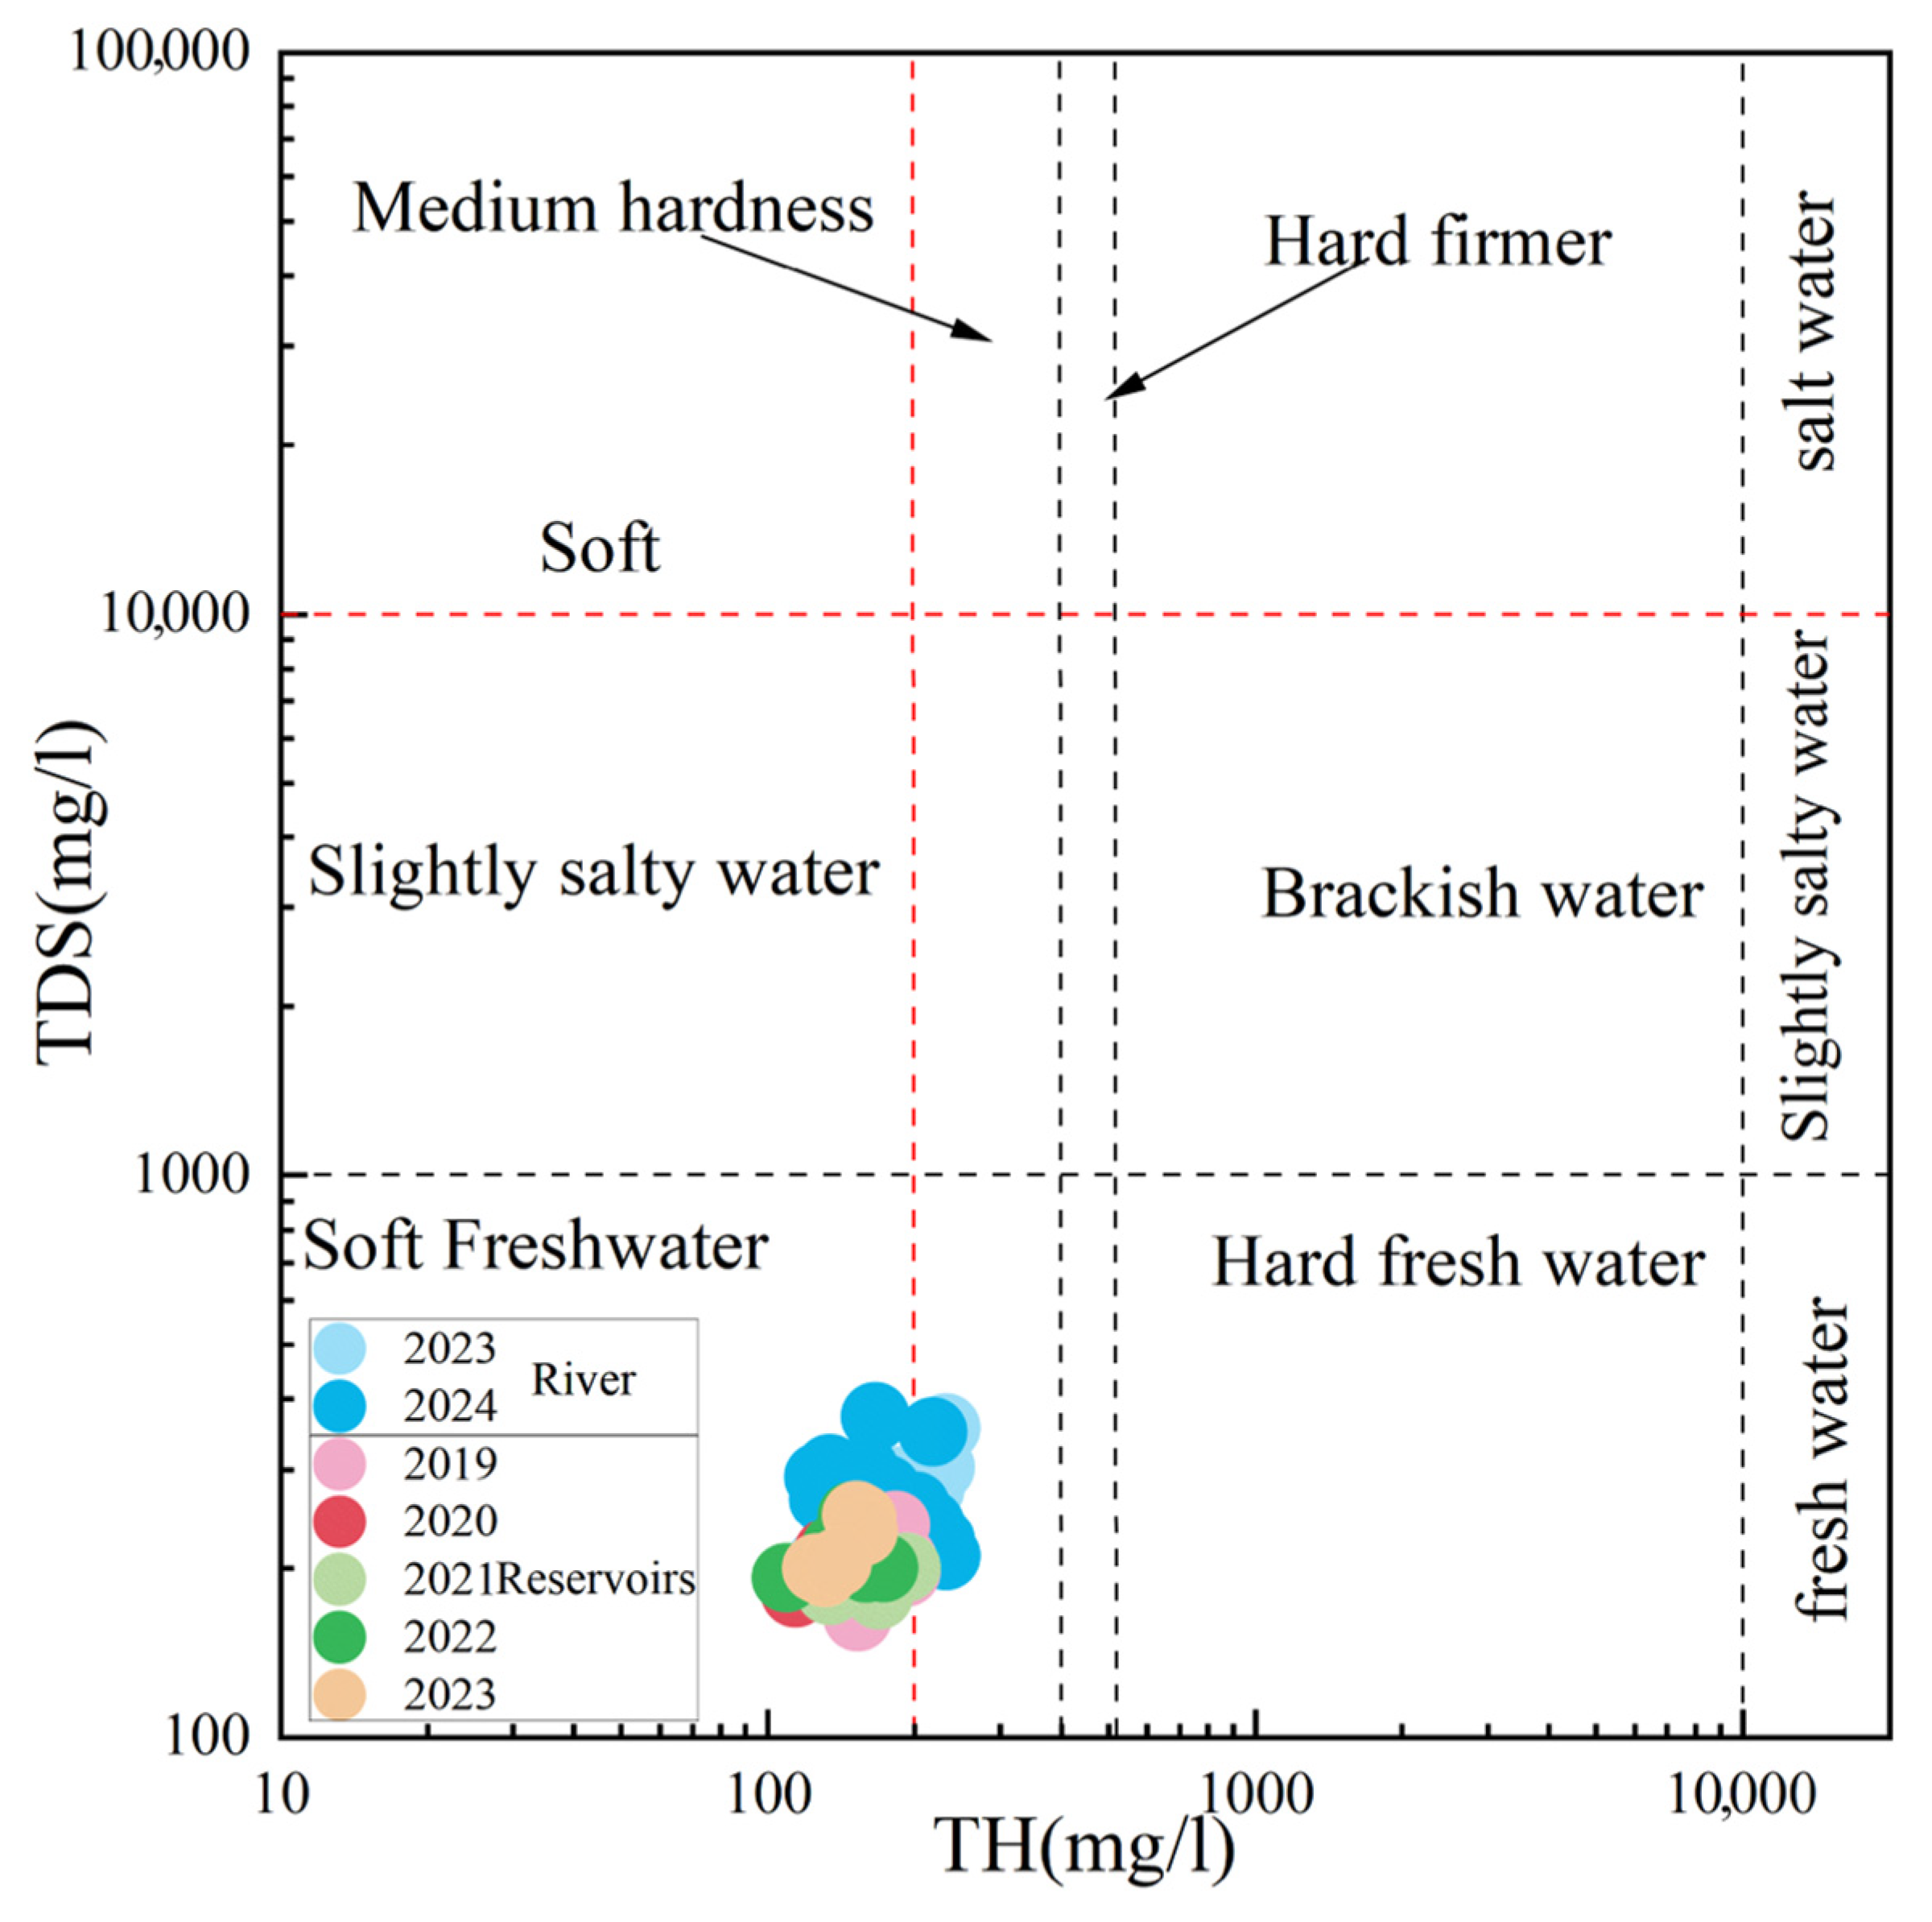
Based on TDS/TH classifications (Figure 3), the surface water is categorized as soft freshwater. Both parameters comply with drinking water safety thresholds (TDS ≤ 1000 mg/L; TH ≤ 450 mg/L) outlined in the Health Standard for Drinking Water (GB 5749-2022) [32].
After one-way ANOVA, as shown in Table 2, the p-values of Ca2+, Mg2+, Na+, HCO3, Cl, pH, TDS, and TH indicators were all less than 0.05, which suggests that there is a significant difference between the river water and the water from the reservoir in these water quality parameters. The p-values of K+, SO42−, and NO3 are greater than 0.05, indicating that there is no significant difference between the two water quality indicators.

4.2. Types of Water Chemistry

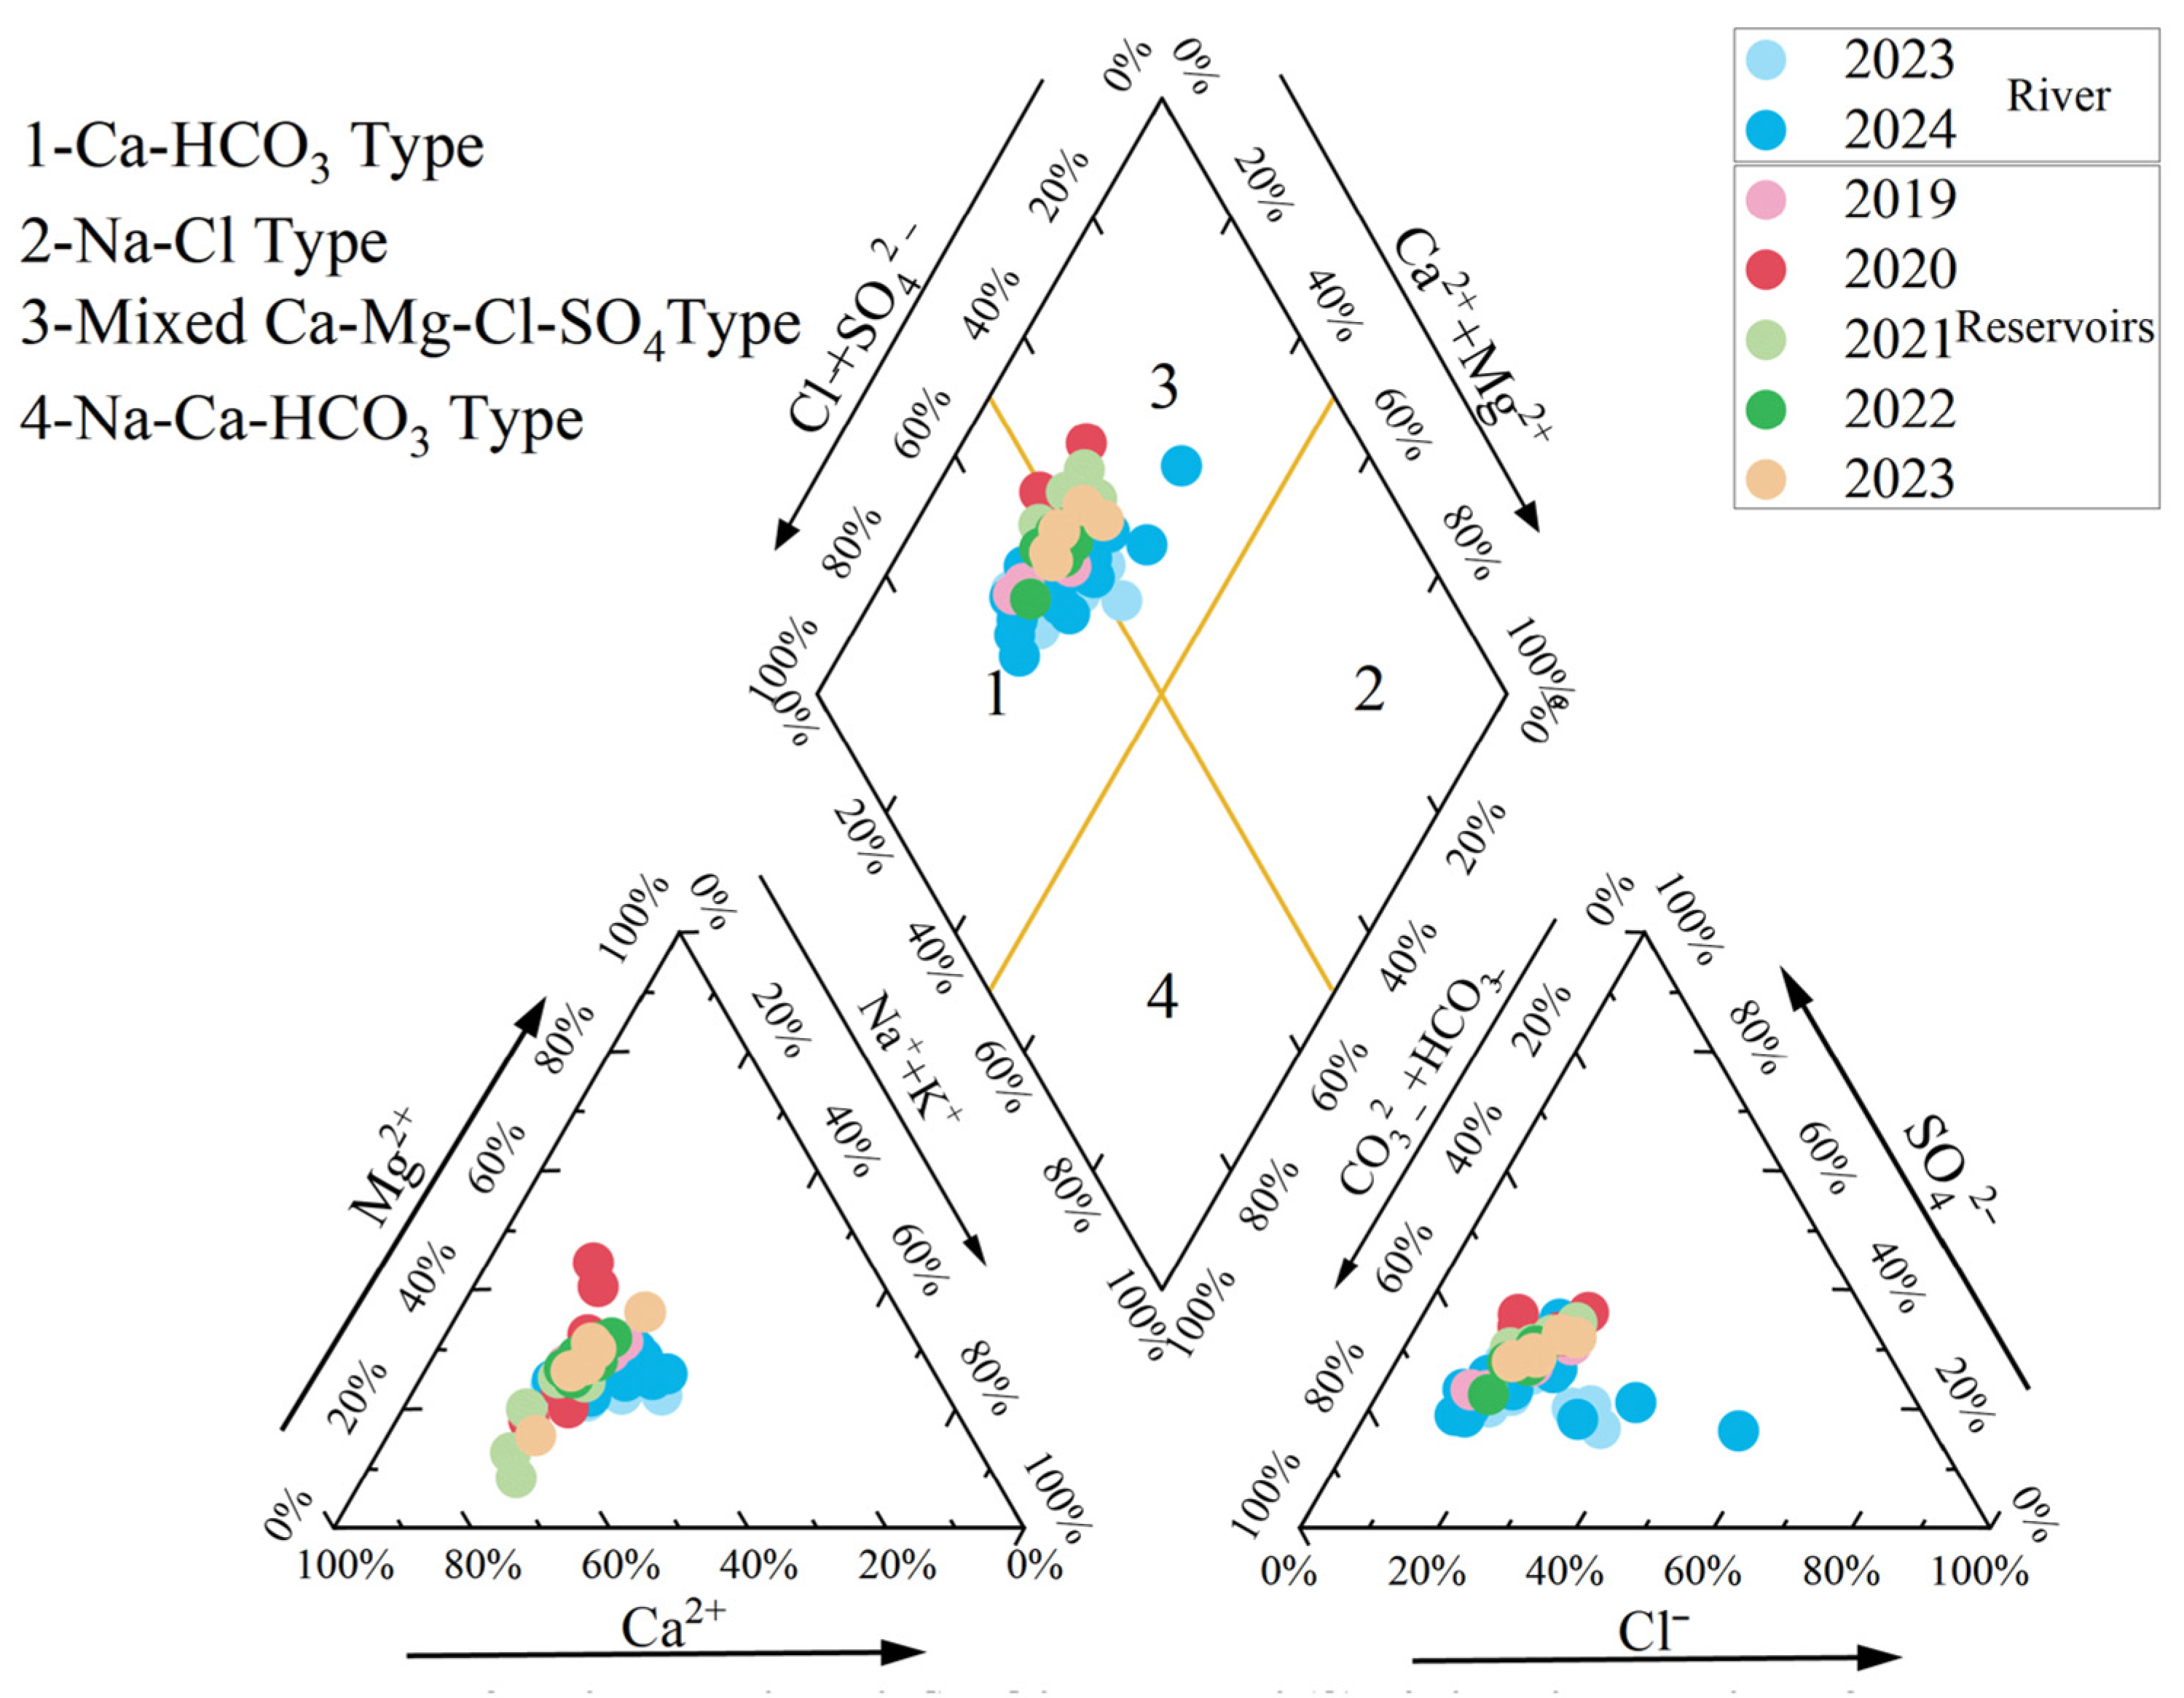
The Piper diagram is expressed as the percentage of milligram equivalents of Na+, K+, Ca2+, Mg2+, SO42−, Cl, HCO3, and is mainly used to show the type and characteristics of water chemistry in different water bodies [33,34]. Piper trilinear analysis (Figure 4) delineates cationic hydrochemical facies within the study area: 82% of samples cluster in the Ca2+-enriched domain (lower-left quadrant), while 15% occupy the Mg2+-associated zone (upper-right quadrant), establishing calcium as the principal constituent with magnesium subordinate. This distribution signifies preferential carbonate dissolution over silicate weathering as the dominant geochemical process governing cationic provenance. Anionic compositions predominantly clustered within the carbonate domain (lower-left quadrant) of the Piper diagram, signifying bicarbonate dominance in the aqueous system. Consequently, the predominant hydrochemical facies were classified as Ca-HCO3 and Ca-Mg-SO4-Cl types, indicative of carbonate weathering and evaporite dissolution processes.

4.3. Correlation Analysis of Key Indicators of Water Chemistry

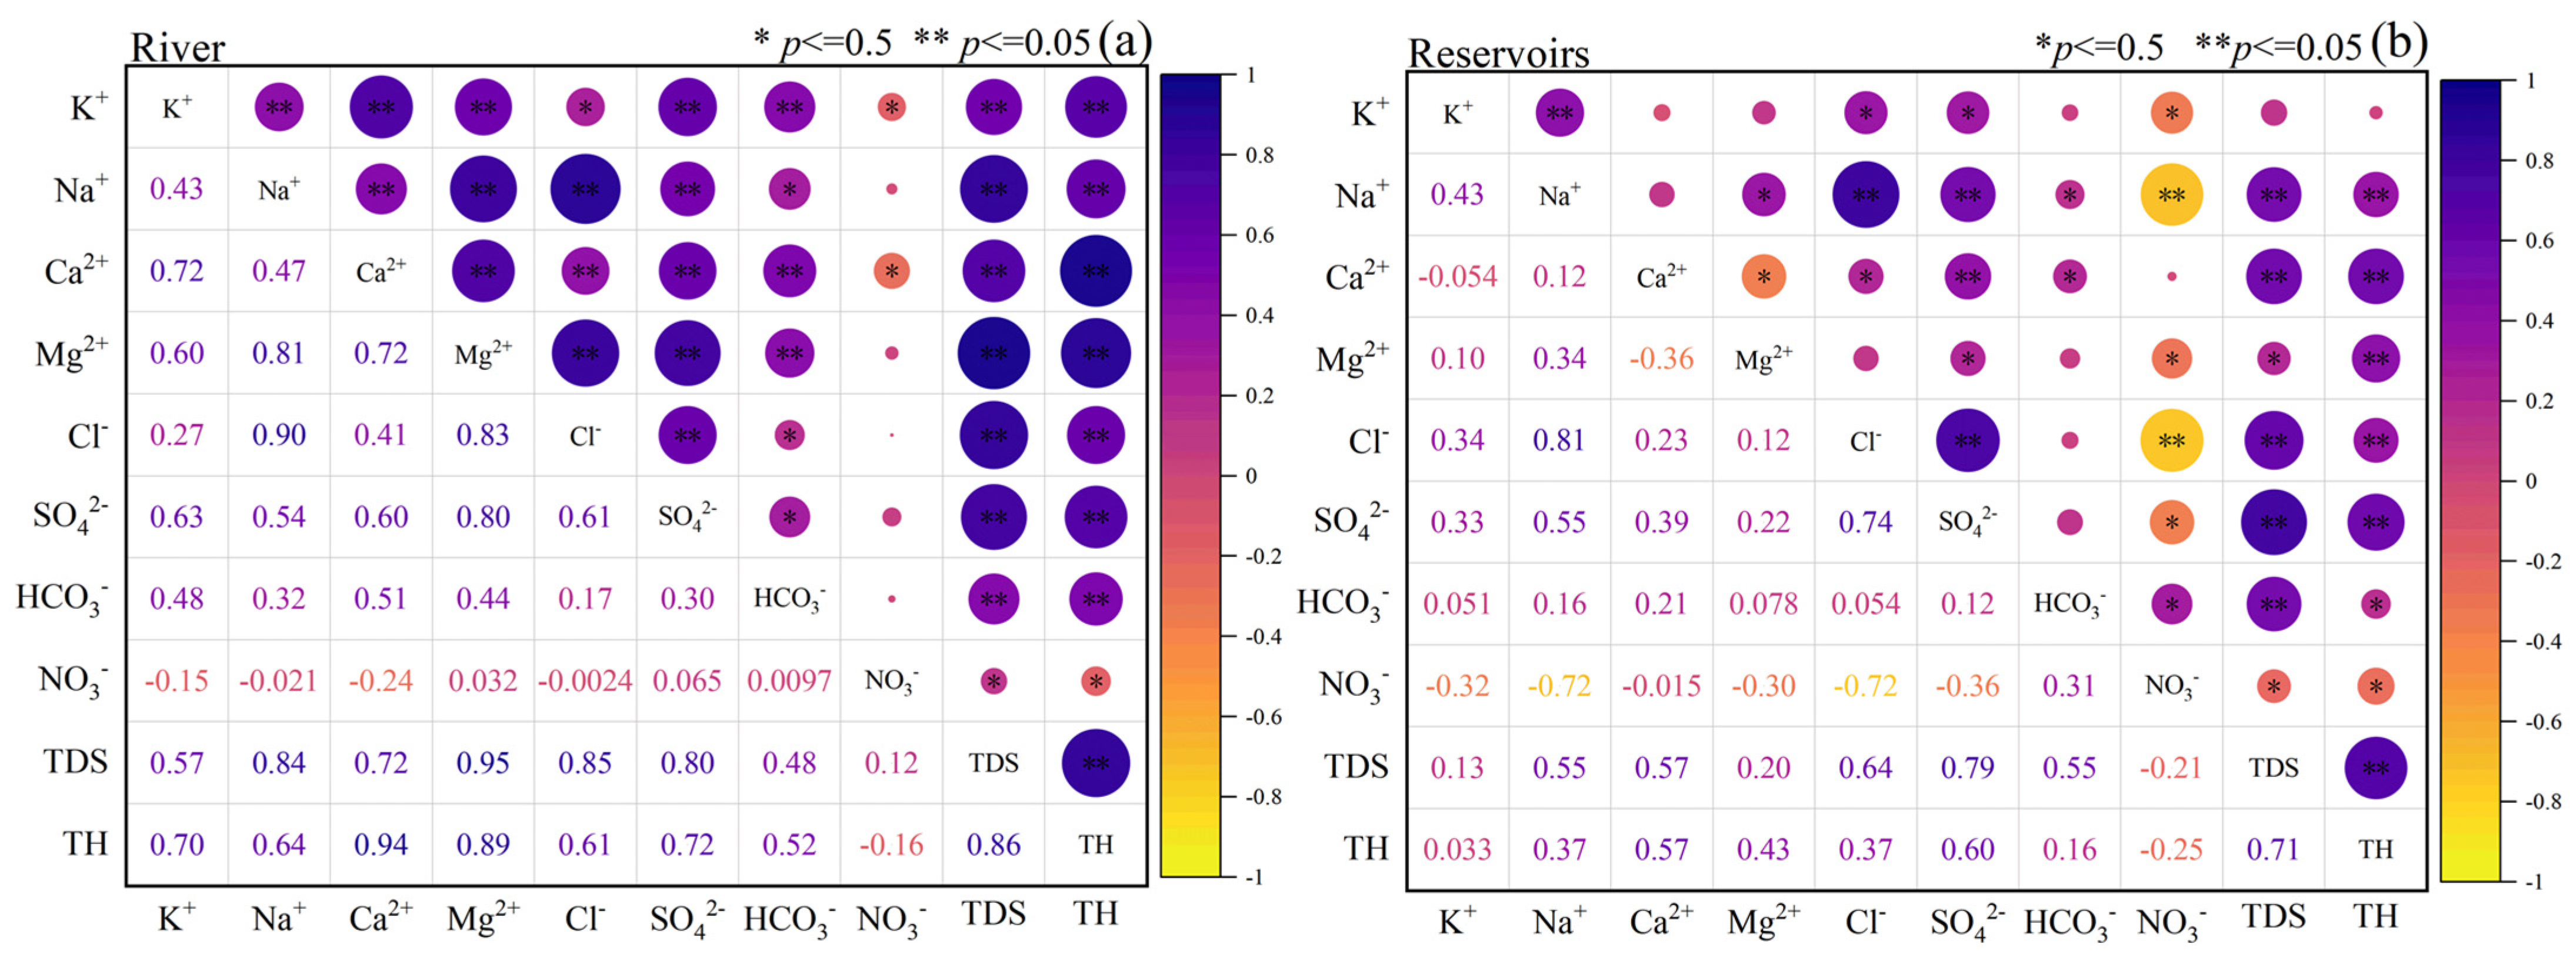
Correlation analysis between hydrochemical constituents is commonly used to reveal ion source relationships, where significant inter-component correlations indicate homologous origins and similar migration pathways [35,36]. As shown in Figure 5a, TDS in river water shows strong positive correlations with K+, Na+, Ca2+, Mg2+, Cl, SO42−, and HCO3, confirming these ions as primary contributors to dissolved solids [37]. Purple coloration between K+, Na+, Ca2+, and Mg2+ indicates highly synergistic cation sourcing and migration processes, likely controlled by rock weathering mechanisms (e.g., carbonate and silicate dissolution). Ca2+, Mg2+, SO42− correlations reflect sulfate associations (e.g., gypsum dissolution) [38], while NO3’s predominantly weak negative correlations with other indicators demonstrate its source independence from dominant ions, instead associating with agricultural fertilization and domestic sewage [39]. Similarly, Figure 5b reveals strong positive correlations between reservoir TDS and Na+, Cl, SO42−, establishing these as core TDS contributors. Positive correlations among Ca2+, Mg2+, SO42− and TH reflect sulfate (e.g., gypsum) and carbonate dissolution contributions to water hardness, while strongly correlated Na+-Cl-SO42− indicates sodium salts’ (e.g., NaCl, Na2SO4) dominant contribution, potentially linked to watershed salt mineral dissolution and precipitation. NO3’s prevalent negative correlations with most parameters further confirm its primary association with agricultural/domestic sources rather than natural weathering processes.

4.4. Analysis of the Hydrochemical Causes of Surface Water

Gibbs [40] conducted a study on the relationship between TDS and Na+/(Na++Ca2+) and Cl/(Cl + HCO3) and summarized the effects of the three key factors on the chemical composition of surface water: evaporation control, rock control and precipitation control [40]. The Gibbs diagram delineates three diagnostic hydrochemical domains based on total dissolved solid (TDS) thresholds and cationic–anionic ratios: (1) the atmospheric-dominated regime (TDS < 100 mg/L) exhibits Na+/(Na+ + Ca2+) ≈ 1 and Cl/(Cl + HCO3) ≈ 1, with samples plotting in the lower-right quadrant, indicating precipitation-derived solutes; (2) the weathering-controlled regime (TDS = 100–500 mg/L) demonstrates Na+/(Na+ + Ca2+) ≤ 0.5 and Cl/(Cl + HCO3) ≤ 0.5, where central-left clustering signifies lithogenic weathering dominance; (3) the evapoconcentration regime (TDS > 500 mg/L) is characterized by near-unity molar ratios of Na+/(Na+ + Ca2+) and Cl/(Cl + HCO3), with the diagnostic upper-right quadrant distribution in Gibbs diagrams signifying evaporative crystallization processes. This tripartite zoning reflects fundamental controls on global surface water chemistry.
The cationic Na+/(Na+ + Ca2+) ratios of river water samples were 0.23~0.46 during 2023 and 2024. The cationic Na+/(Na+ + Ca2+) ratios of reservoir water samples were 0.25~0.35; 0.21~0.28; 0.19~0.29; and 0.25~0.33 during the period from 2019 to 2023, respectively; 0.23~0.39. Figure 6a shows that all the water samples in the study area were concentrated in the left-middle position of the model. The anionic Cl/(Cl+ HCO3) ratios of the river water samples were 0.19~0.42 and 0.16~0.66 during 2023 and 2024. The anionic Cl/(Cl + HCO3) ratios of the reservoir water samples were 0.17~0.35; 0.21~0.37; 0.22~0.35 from 2019 to 2023, respectively; 0.21~0.28; 0.23~0.35. Figure 6b demonstrates that 98% of aqueous samples occupy the lithogenesis-dominated domain within the Gibbs framework, characterized by central-left clustering. This distribution reflects the basin’s substantial meteoric recharge and limited evaporative concentration, fostering dilute hydrochemical facies. Collectively, these patterns substantiate silicate and carbonate weathering as the principal regulators of solute provenance in the study area, with minimal evaporitic influence.

4.5. Major Ion Sources

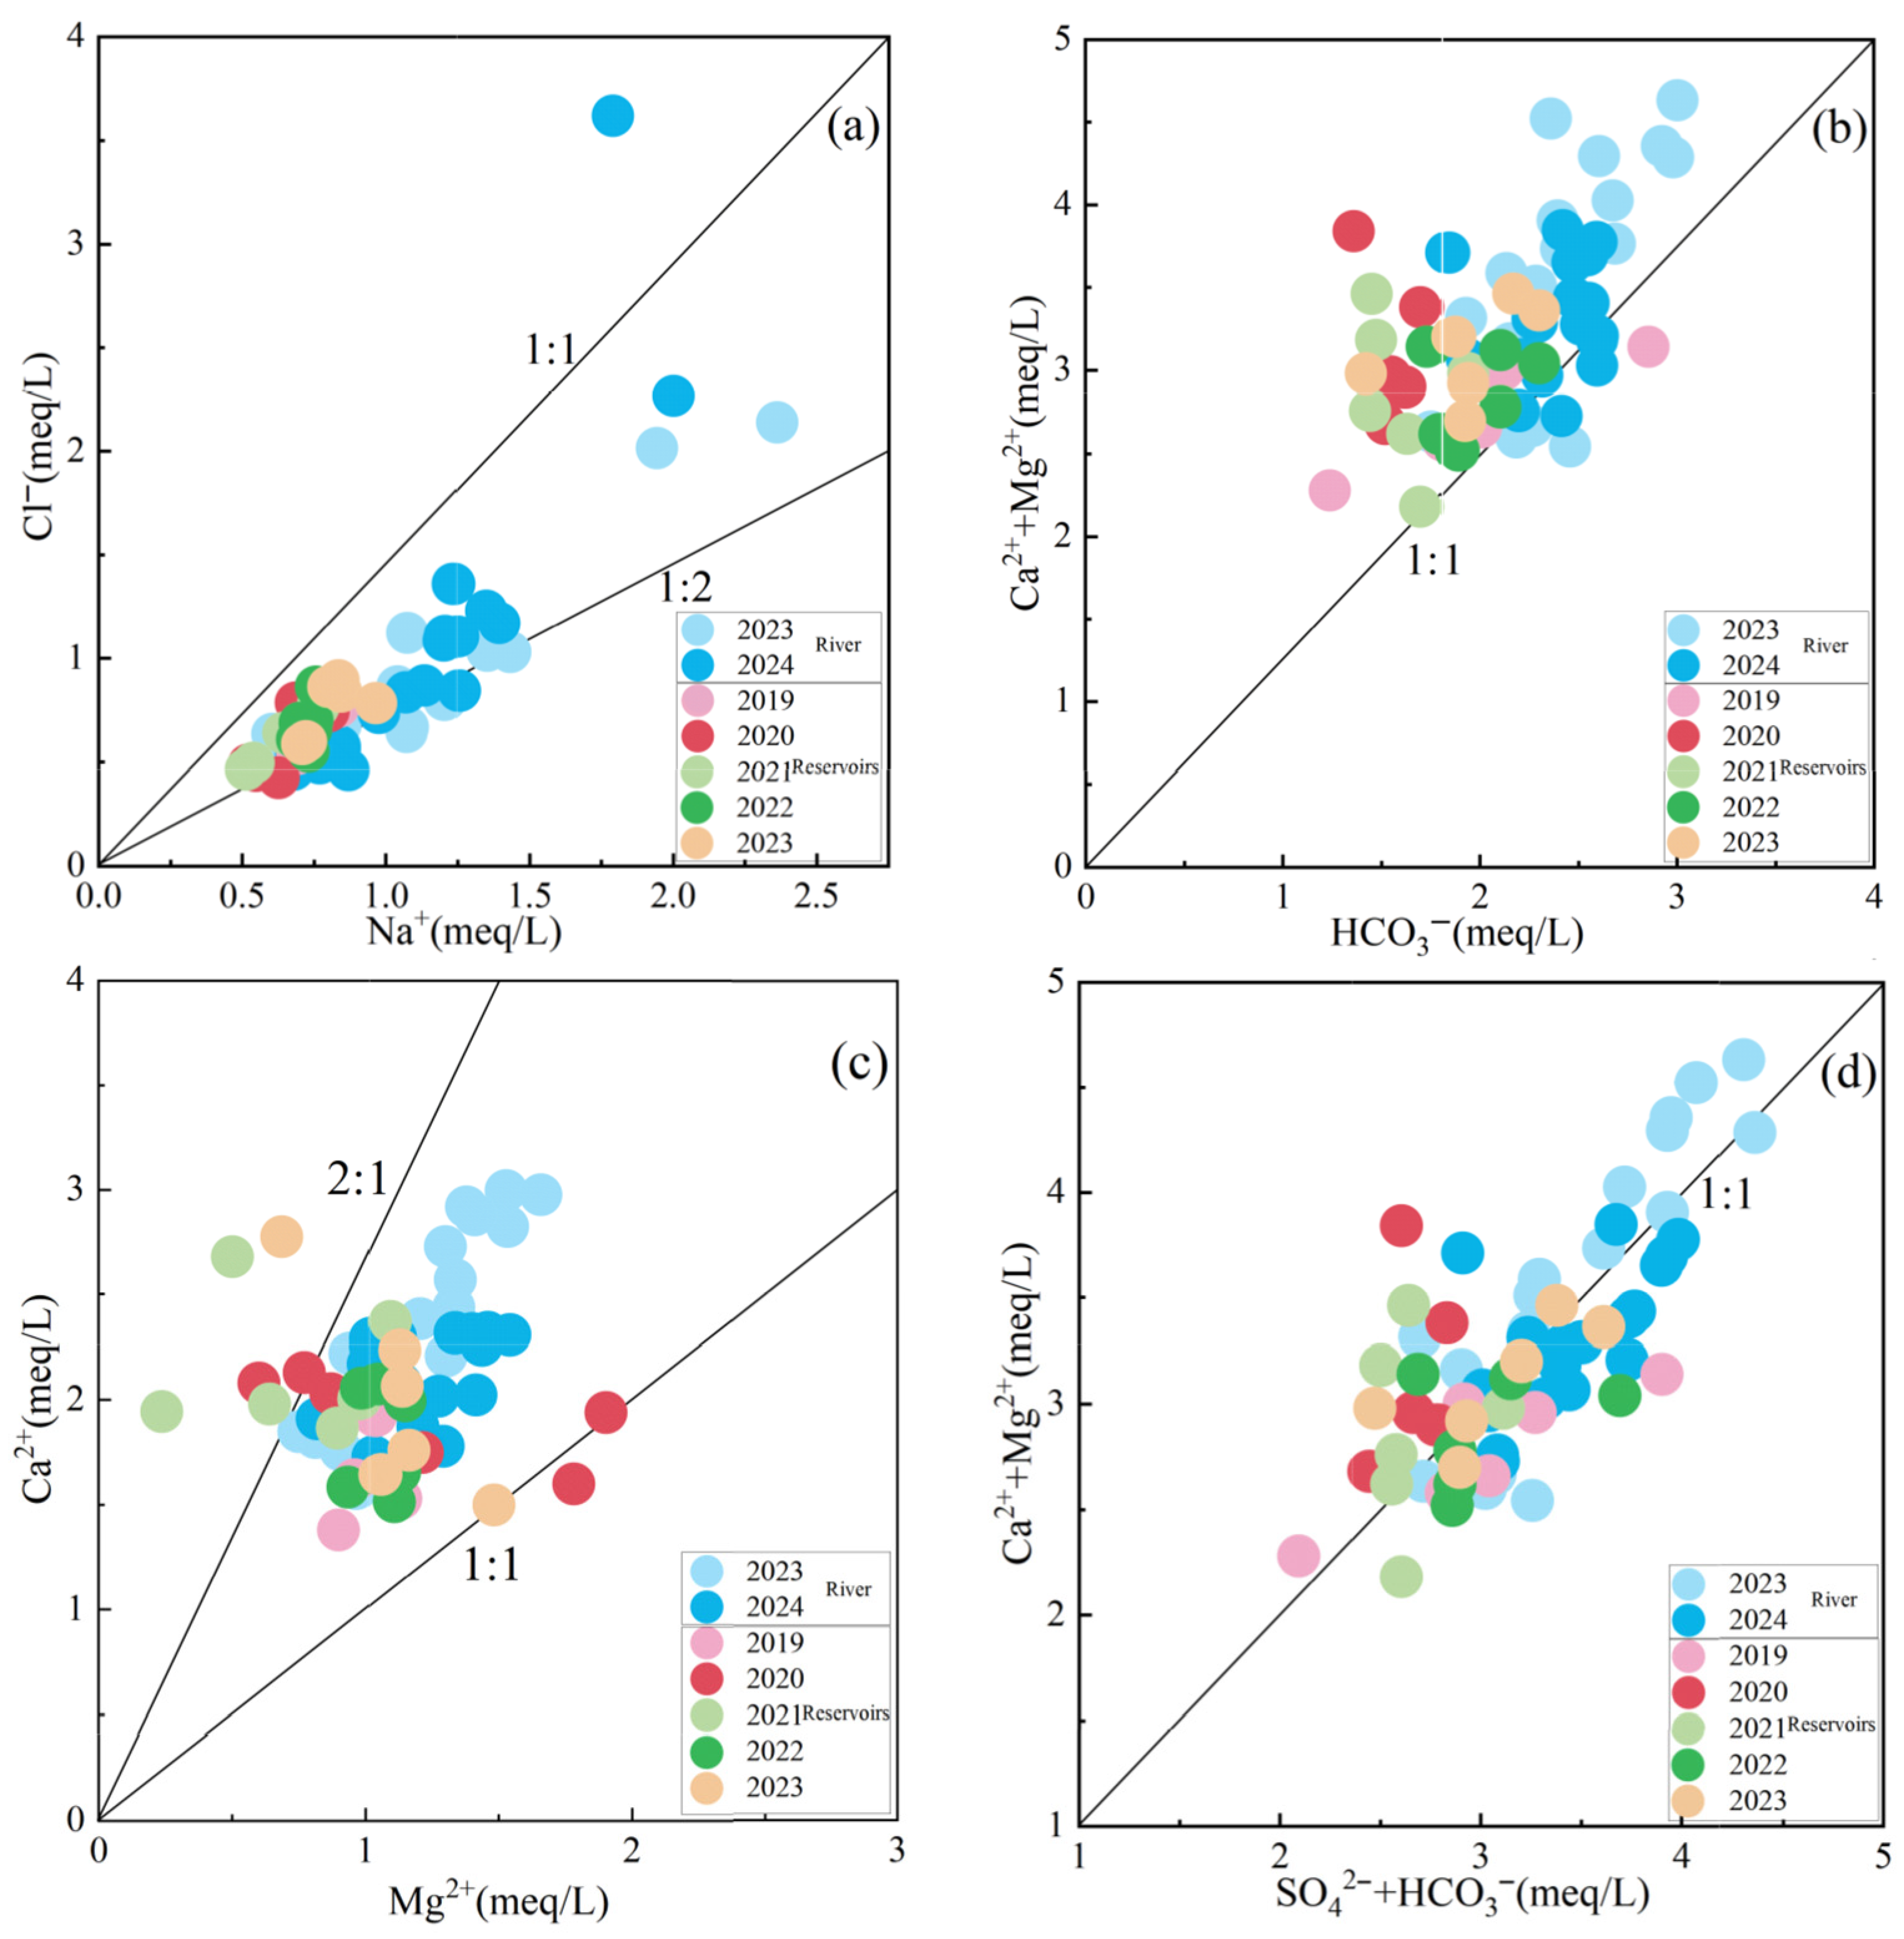
To further explore the origin of surface water hydrochemical constituents, they were analyzed in depth using milligram equivalence ratio diagrams for major ions. In surface water chemistry, differences in component concentration ratios can be used to characterize hydrochemical constituents. The source of Na+ can be determined by analyzing the Na+/Cl ratio in surface water. Molar Na+/Cl ratios exceeding unity demarcate halite dissolution as the dominant sodium source, whereas sub-unitary ratios signify preferential derivation from silicate hydrolysis [41]. Hydrochemical discriminants in Figure 7a reveal sub-unitary Na+/Cl ratios across most sampling sites, fingerprinting aluminosilicate weathering as the predominant sodium provenance. Concurrently, carbonate versus non-carbonate cation sourcing is resolved via (Ca2+ + Mg2+)/HCO3 milliequivalent ratios: values superjacent to the unit isoline indicate silicate and evaporite derivation of alkaline earth metals, whereas subjacent positioning denotes carbonate dissolution dominance [42]. Figure 7b demonstrates that surface water samples plot proximal to and above the (Ca2+ + Mg2+)/HCO3 = 1 line, indicating predominance of siliciclastic weathering and evaporite dissolution within the study basin. Figure 7c shows that the majority of the surface water samples are distributed between 1:1 and 2:1, and a few surface water samples are distributed below contour one, indicating that dissolution of silicate rocks or sulfate rocks is present in the study area [43]. Figure 7d shows that the surface water samples in the study area are distributed around (Ca2+ + Mg2+)/(SO42− + HCO3) = 1, which indicates that Ca2+ and Mg2+ are mainly from weathering of silicate rocks and evaporite salts [42]. Carbonate rock weathering constitutes a minor contributor to the dissolved ion budget. Collectively, solute provenance in the study basin is predominantly governed by incongruent weathering of silicate assemblages, carbonate mineral dissolution, and evaporite leaching.
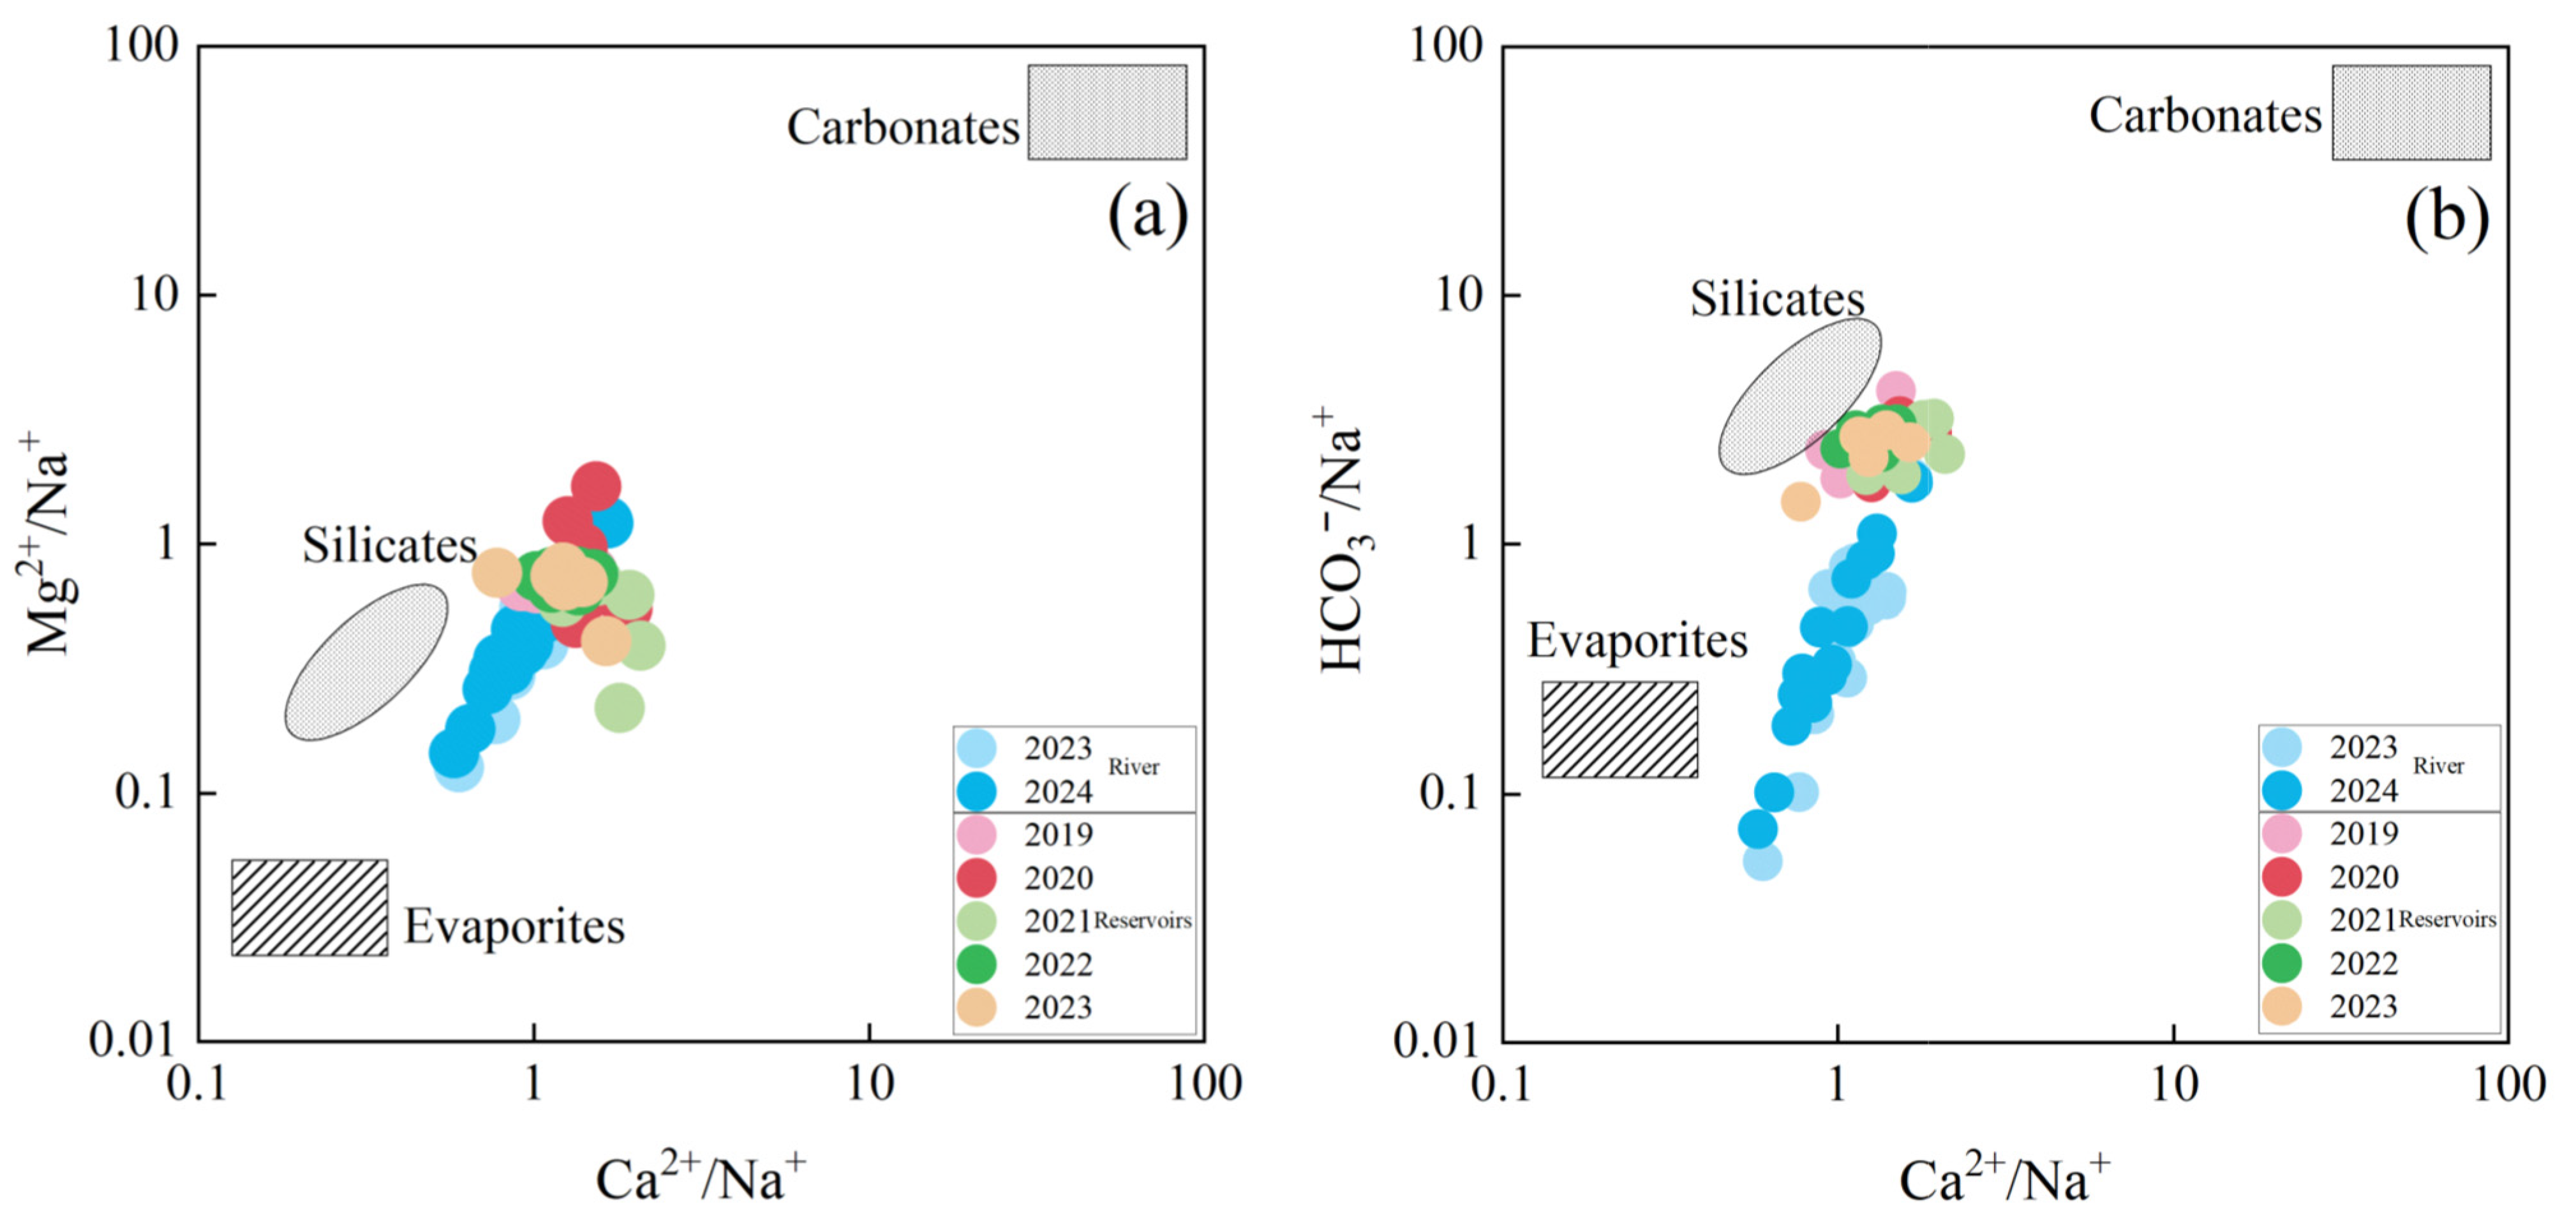
Surface water chemistry is principally governed by lithogenic weathering processes, wherein Ca2+ and Mg2+ are dominantly sourced from carbonate dissolution, silicate hydrolysis, and evaporite leaching, while Na+ and K+ derivation is principally attributed to halite dissolution and aluminosilicate weathering reactions. SO42− and Cl principally arise from evaporite dissolution, while HCO3 stems chiefly from carbonate and silicate weathering. Analysis of milligram equivalent ratios (Ca2+/Na+, Mg2+/Na+, HCO3/Na+) enables identification of rock weathering origins for Na+, Ca2+, and Mg2+ ions [44,45]. As shown in Figure 8, river water chemistry during 2023–2024 was predominantly controlled by silicate weathering, with carbonate weathering contributing substantially. Reservoir samples (2019–2023) cluster near silicate rock endmembers, confirming silicate weathering as the dominant control on surface water ion sources.

4.6. Characterization of Changes in the Content of Major Ions in Surface Water

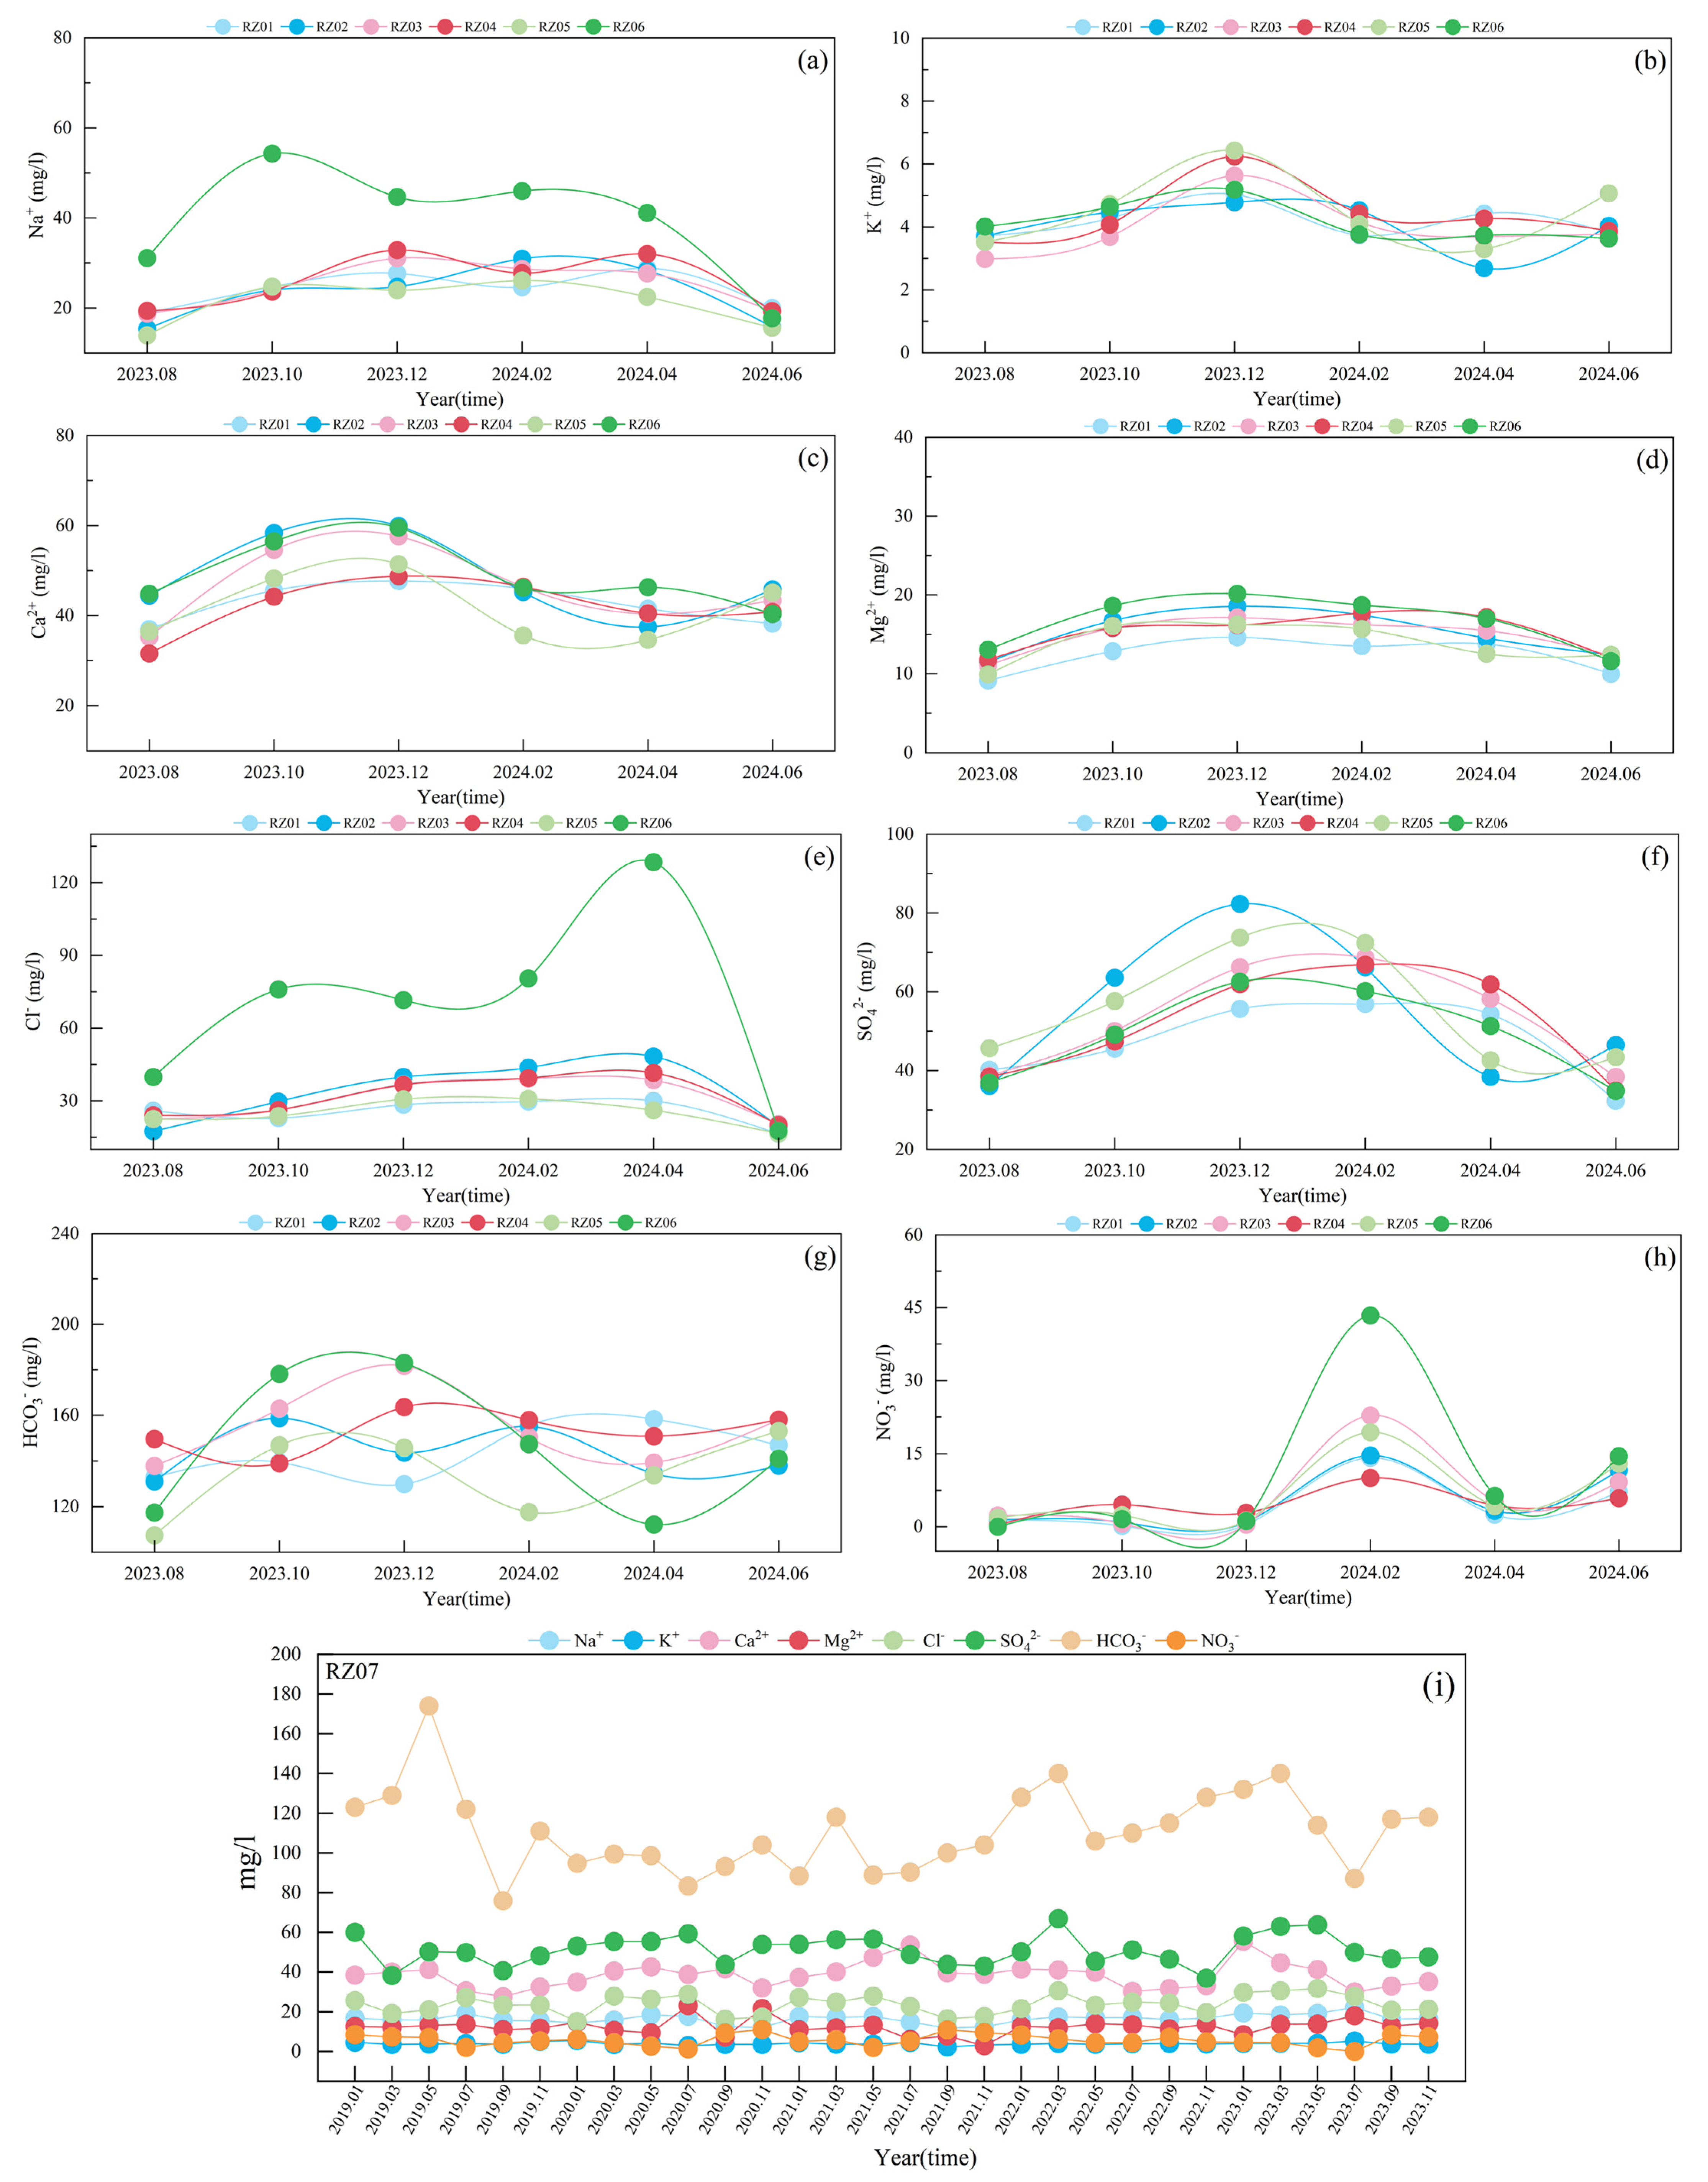
Systematic surface water surveillance facilitates prompt identification of hydrochemical trajectories and integrated appraisal of ecological status, thereby underpinning evidence-based decision-making for adaptive water resource governance and conservation frameworks [46]. This study analyzed 2019–2023 surface water data from six river monitoring sites (RZ01-RZ06) and one reservoir site (RZ07), with additional sampling from August 2023 to June 2024. Focusing on major ions, Figure 9 illustrates concentration dynamics in river systems: K+, Mg2+, and HCO3 exhibited minimal temporal variation, indicating stable conditions. Na+ and Cl concentrations remained steady at RZ01-RZ05 but showed significant fluctuations at RZ06, potentially linked to anthropogenic influences. NO3 concentrations demonstrated relative stability until 2023, followed by a transient increase and subsequent gradual decline across all sites. HCO3 concentrations displayed irregular temporal patterns without discernible trends. Ca2+ and SO42− concentrations increased gradually through December 2023 before declining, though RZ06 maintained stable levels during the initial period, possibly anthropogenic in origin. Reservoir data (Figure 9i) revealed pronounced HCO3 variability at RZ07, contrasting with the stable behavior of other ions. While no consistent seasonal patterns emerged, episodic peaks (e.g., SO42−) suggest intermittent environmental or anthropogenic drivers.

4.7. Evaluation of Drinking Water Quality

EWQI classifies surface waters within the study area into five distinct quality tiers (Excellent to very poor), as delineated in Table 3. Crucially, EWQI values exceeding 100 demarcate the threshold beyond which water is generally deemed unsuitable for potable use due to compromised chemical integrity [47,48].
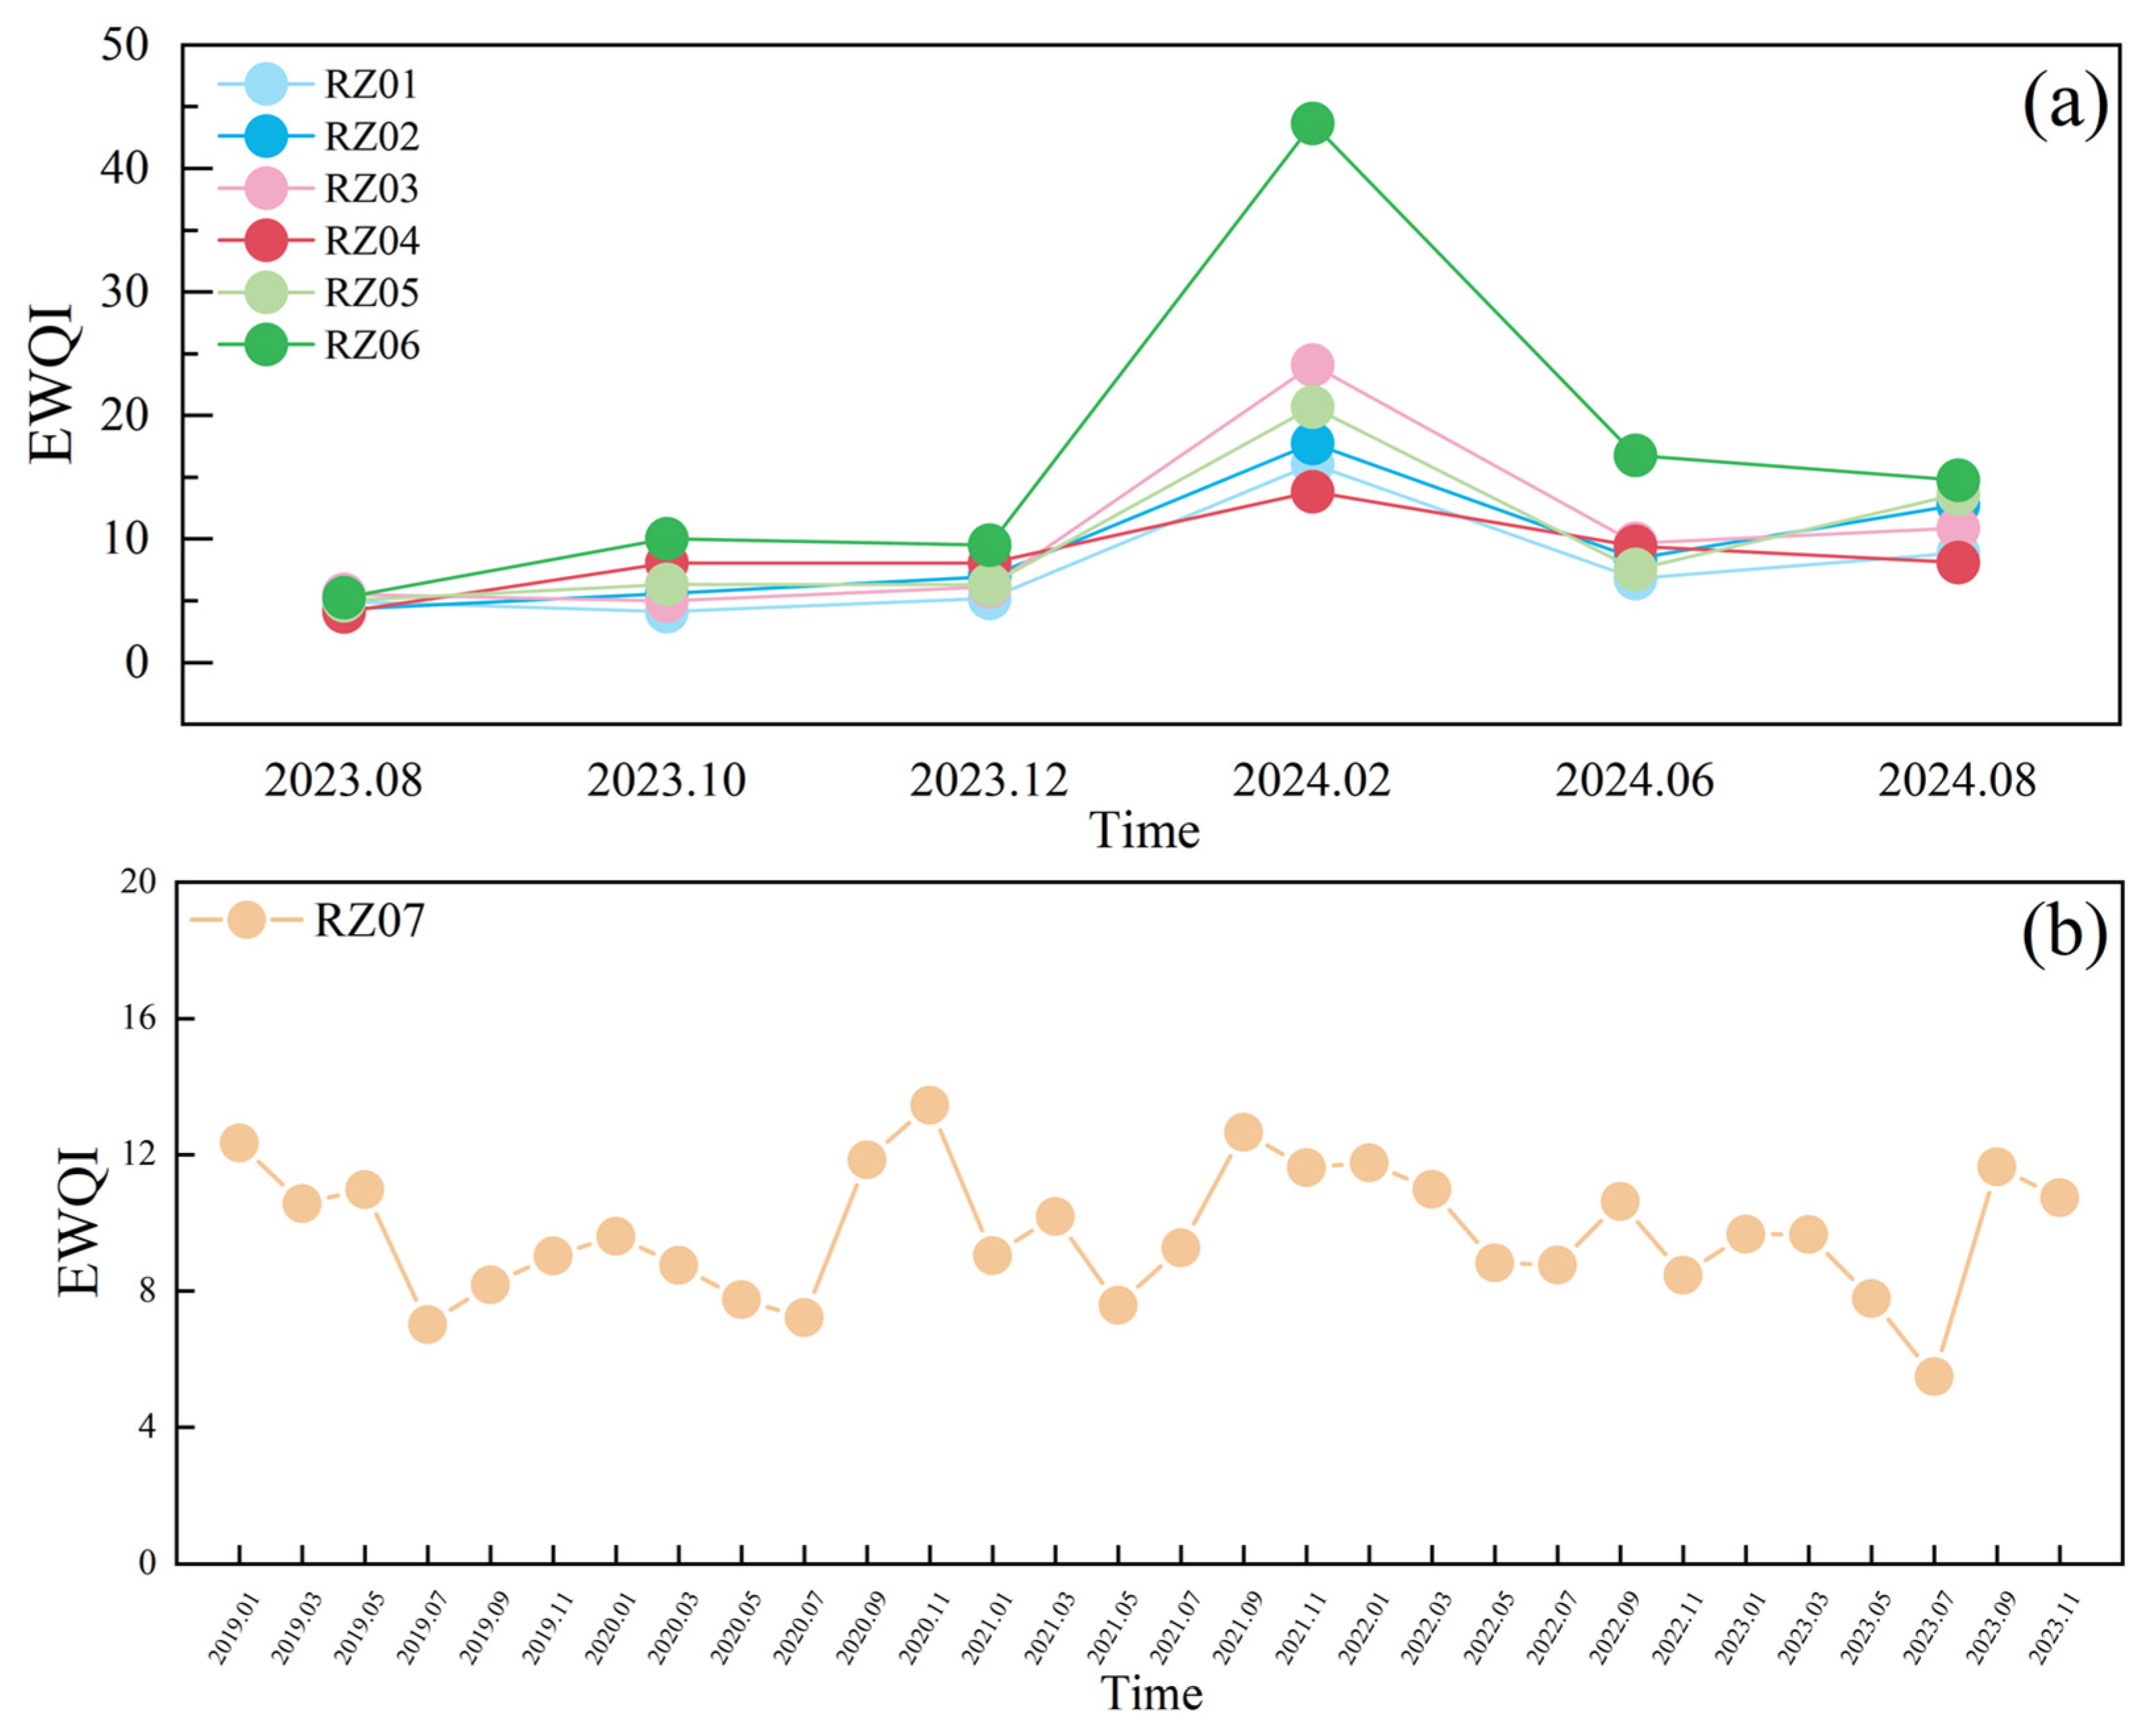
This study assessed surface water quality at seven monitoring sites (RZ01-RZ07) using the Environmental Water Quality Index (EWQI), based on comprehensive dynamic monitoring data. Results demonstrate EWQI values of 4.11–43.64 (mean = 10.4) for river sites RZ01-RZ06 and 5.49–13.46 (mean = 9.72) for reservoir site RZ07. 98.48% of samples (n = 66) met Type I water standards, while 1.52% (n = 1) corresponded to Type II. These findings indicate excellent overall water quality suitable for drinking purposes.
The EWQI temporal variation plot (Figure 10) displays water quality dynamics across monitoring sites during two periods: 2019–2023 and August 2023–August 2024. RZ01 and RZ03 exhibit synchronous fluctuations characterized by an initial increase, subsequent decline, and minor rebound, peaking in February 2024 when water quality remained predominantly favorable. RZ02, RZ05, and RZ06 demonstrate similar variation patterns, with mean EWQI values indicating slightly poorer water quality at RZ05 and RZ06. Notably, RZ06 shows the most pronounced fluctuations (peak ≈43), significantly exceeding other sites, potentially indicating special pollutant sources or natural influences. In contrast, RZ04 maintains relative stability with minimal variations. For reservoir site RZ07 (2019–2023), water quality displays moderate interannual variability without persistent trends: optimal conditions prevailed during 2019–2022 despite transient declines in 2020–2021. Seasonal analysis reveals greater fluctuations during spring (March–May) and autumn (September–November), likely attributable to precipitation patterns, temperature shifts, hydrological dynamics, and seasonal anthropogenic activities.

4.8. Evaluation of Irrigation Water Quality

Irrigation water quality critically influences crop growth and soil physicochemical properties. Excessive salinity may induce osmotic stress and phytotoxicity, while elevated sodium concentrations can trigger soil alkalinization [49]. Evaluation of the Fuzhi River Basin using four irrigation suitability indices (%Na, SAR, RSC, PI%) demonstrates excellent water quality across all sampling sites (Table 4). All river (n = 36) and reservoir (n = 30) samples achieved “Excellent” or “Suitable” classifications across all parameters, with no instances of “Unsuitable” ratings. These findings indicate exceptionally safe irrigation water for agricultural use, presenting negligible risks of sodium damage, alkalinization, or compromised soil permeability.
Electrical conductivity (EC) and sodium adsorption ratio (SAR) constitute essential agronomic metrics for diagnosing soil salinization and assessing irrigation water suitability. Extending this diagnostic paradigm, EC, SAR, and sodium percentage (Na%) were employed as integrated hydrochemical criteria for irrigation water quality evaluation in the present investigation. By employing the Wilcox diagramming [50,51] method and adhering to the USDA irrigation water quality classification standard (USSL diagram, 1954) [52,53], irrigation water classification maps (e.g., Figure 11a,b) were constructed. Complementing residual sodium carbonate (RSC) and permeability index (PI) assessments, these hydrochemical cartographies provide an integrated evaluation of surface water irrigation suitability across the study area. Riverine systems exhibited significantly higher electrical conductivity (EC: 435 ± 112 µS/cm; range: 241–686 µS/cm) relative to lacustrine environments (EC: 359 ± 68 µS/cm; range: 183–429 µS/cm). The results revealed that two samples in Figure 11b were categorized within the C1S1 zone, denoting an extremely low salinity hazard, whereas the remaining samples fell into the C2S1 zone. This indicates that the surface water in the study area complies with irrigation water quality standards and is suitable for agricultural irrigation. Notably, all samples in Figure 11a were distributed in zones classified as having “good water quality,” further confirming that the surface water can be directly utilized for irrigation purposes.

4.9. Optimized Management Strategies for Surface Water Resources as Urban Water Supply Sources

(1)
Monitoring indicates weakly alkaline surface water (pH7.3–9.78; mean 8.29–8.6). To prevent pipeline corrosion and scaling, implement an automated pH adjustment system using food-grade CO2 or dilute H2SO4 to maintain effluent pH at 7.0–8.5.
(2)
Significant spatiotemporal variability occurs in river water quality (e.g., RZ06 exhibited Cl and NO3peaks in April/February 2024, respectively, potentially linked to agricultural runoff and domestic sewage). Recommended actions: Install automatic Cl/NO3 monitoring upstream; implement soil testing and organic fertilizer programs; construct wastewater treatment facilities near RZ06.
(3)
Geochemical analysis confirms Rizhao Reservoir’s ionic sourcing from rock weathering. Despite minimal anthropogenic pollution, long-term contaminant accumulation requires vigilance. Mitigation measures: Establish vegetative buffers in upstream catchments; designate core protection zones; restrict quarrying/mining activities.
(4)
EWQI assessment verifies reservoir compliance with drinking standards, though seasonal and episodic pollution occurs. Establish: Multi-source water allocation framework; 2–3 backup reservoir systems; enhanced emergency response protocols.
(5)
Irrigation evaluations confirm surface water suitability without salinization risks. Optimization strategies: Substitute groundwater with surface sources; Implement crop-specific irrigation quotas; Prioritize water allocation for high-consumption crops; address groundwater depletion trends.

5. Conclusions

This study employed mathematical-statistical analyses, hydrochemical graphical methods, and water quality indices to characterize surface water hydrochemistry of Rizhao Reservoir, determine influencing factors, identify ion sources, and elucidate water quality conditions, with results demonstrating the following:
(1)
River water exhibited alkaline conditions (pH 7.63–9.78, mean = 8.6), with mean TDS (257.76 mg/L) and TH (172.54 mg/L) characteristic of freshwater systems. Dominant ions were Ca2+ (45.04 mg/L) and HCO3 (146 mg/L), confirming freshwater classification for most samples. Reservoir water (2019–2023) similarly showed alkalinity (pH 7.3–9.0, mean = 8.29), lower mean TDS (207.55 mg/L) and TH (147.17 mg/L), with identical dominant ions at reduced concentrations (Ca2 + =38.5 mg/L; HCO3 = 111.10 mg/L). Hydrochemical facies primarily comprised Ca-HCO3 and Ca-Mg-SO4-Cl types.
(2)
Rizhao Reservoir surface water hydrochemical characteristics of the main controlling factors for the weathering of rocks. The source of hydrochemical constituents is mainly related to the weathering and dissolution of silicate rocks, carbonate rocks, and evaporite salt rocks. The concentration of NO3 in surface water is relatively low (mean value), indicating that it is less affected by anthropogenic inputs.
(3)
River water displays greater parameter variability than reservoir water. Most monitoring points exhibited ion concentration peaks followed by declines, particularly at RZ06, where Cl (April 2024 peak) and NO3 (February 2024 peak) showed significant fluctuations. In contrast, RZ07 maintained relatively stable ion concentrations.
(4)
EWQI assessment confirms excellent reservoir water quality meeting drinking standards (seasonal variations notwithstanding). Irrigation suitability evaluation indicates all surface waters pose negligible salinization risk and require no pretreatment for agricultural use.

Author Contributions

Q.F.: Conceptualization, methodology, writing—original draft. Y.L.: Formal analysis, investigation, methodology. J.F.: Investigation, supervision, writing—review and editing. W.L.: Resources. Y.Z.: Resources. M.G.: Supervision, resources. L.Z.: Resources. B.Z.: Methodology. D.Z.: Resources. K.L.: Supervision. All authors have read and agreed to the published version of the manuscript.

Funding

This research was funded by the Basic Survey and Monitoring of Water Resources in the Rizhao Reservoir, grant number [DZG202402].

Data Availability Statement

The datasets used and/or analyzed during the current study are available from the corresponding author upon reasonable request.

Conflicts of Interest

The authors declare no competing interests.

References

  1. Khatri, N.; Tyagi, S. Influences of natural and anthropogenic factors on surface and groundwater quality in rural and urban areas. Front. Life Sci. 2015, 8, 23–39. [Google Scholar] [CrossRef]
  2. Akhtar, N.; Syakir, M.; Rai, S.; Saini, R.; Pant, N.; Anees, M.; Qadir, A.; Khan, U. Multivariate investigation of heavy metals in the groundwater for irrigation and drinking in Garautha Tehsil, Jhansi District, India. Anal. Lett. 2020, 53, 774–794. [Google Scholar] [CrossRef]
  3. Manjunatha, S.; Bobade, K.; Kudale, M. Pre-cooling technique for a thermal discharge from the coastal thermal power plant. Anal. Lett. 2015, 116, 358–365. [Google Scholar] [CrossRef]
  4. Parris, K. Impact of agriculture on water pollution in OECD countries: Recent trends and future prospects. Int. J. Water Resour. Dev. 2014, 27, 33–52. [Google Scholar] [CrossRef]
  5. Vardhan, K.H.; Kumar, P.S.; Panda, R.C. A review on heavy metal pollution, toxicity and remedial measures: Current trends and future perspectives. J. Mol. Liq. 2019, 290, 111197. [Google Scholar] [CrossRef]
  6. Coelho, L.M.; Rezende, H.C.; Coelho, L.M.; De Sousa, P.; Melo, D.; Coelho, N. Bioremediation of polluted waters using microorganisms. Adv. Bioremediat. Wastewater Polluted Soil 2015, 10, 60770. [Google Scholar]
  7. Li, H.; Yu, X.; Zhang, W.; Huan, Y.; Yu, J.; Zhang, Y. Risk assessment of groundwater organic pollution using hazard, intrinsic vulnerability, and groundwater value, Suzhou City in China. Expo. Health 2018, 10, 99–115. [Google Scholar] [CrossRef]
  8. Rasheed, H.; Altaf, F.; Anwaar, K.; Ashraf, M. Drinking Water Quality in Pakistan: Current Status and Challenges; Pakistan Council of research in water resources (PCRWR): Islamabad, Pakistan, 2021; p. 141. [Google Scholar]
  9. Taloor, A.K.; Pir, R.A.; Adimalla, N.; Ali, S.; Manhas, D.S.; Roy, S.; Singh, A.K. Spring water quality and discharge assessment in the Basantar watershed of Jammu Himalaya using geographic information system (GIS) and water quality Index (WQI). Groundw. Sustain. Dev. 2020, 10, 100364. [Google Scholar] [CrossRef]
  10. Dippong, T.; Resz, M.A. Heavy metal contamination assessment and potential human health risk of water quality of lakes situated in the protected area of Tisa, Romania. Heliyon 2024, 10, e28860. [Google Scholar] [CrossRef] [PubMed]
  11. Peters, N.E.; Meybeck, M.; Chapman, D.V. Effects of human activities on water quality. In Encyclopedia of Hydrological Sciences; John Wiley & Sons: Hoboken, NJ, USA, 2006. [Google Scholar] [CrossRef]
  12. Zhang, L.; Li, P.; He, X. Interactions between surface water and groundwater in selected tributaries of the Wei River (China) revealed by hydrochemistry and stable isotopes. Hum. Ecol. Risk Assess. Int. J. 2022, 28, 79–99. [Google Scholar] [CrossRef]
  13. Vatanpour, N.; Malvandi, A.M.; Hedayati Talouki, H.; Gattinoni, P.; Scesi, L.; Research, P. Impact of rapid urbanization on the surface water’s quality: A long-term environmental and physicochemical investigation of Tajan river, Iran (2007–2017). Environ. Sci. Pollut. Res. 2020, 27, 8439–8450. [Google Scholar] [CrossRef] [PubMed]
  14. Deng, S.; Li, C.; Jiang, X.; Zhao, T.; Huang, H. Research on Surface Water Quality Assessment and Its Driving Factors: A Case Study in Taizhou City, China. Water 2022, 15, 26. [Google Scholar] [CrossRef]
  15. Yan, T.; Shen, S.-L.; Zhou, A. Indices and models of surface water quality assessment: Review and perspectives. Environ. Pollut. 2022, 308, 119611. [Google Scholar] [CrossRef] [PubMed]
  16. Ndondo, G.R.N.; Boum, S.N.; Song, F.; Eyong, G.E.T.; Komba, D.E.; Nlend, B.; Etame, J.; Protection, E. Hydrogeochemical Characteristics and Quality Assessment of Surface Water in an Agricultural Area in Equatorial Africa: The Mungo River Basin, South West Cameroon, Central Africa. J. Geosci. Environ. Prot. 2021, 9, 164–181. [Google Scholar] [CrossRef]
  17. Ubuoh, E.; Nwogu, F.; Ossai-Abeh, E.; Ikwuemesi, J.; Oke, A.; Umoh, J. Evaluation of hydro-chemical facies and surface water quality dynamics using multivariate statistical approaches in Southern Nigeria. Sci. Rep. 2024, 14, 31600. [Google Scholar] [CrossRef] [PubMed]
  18. Liu, K.L.; Wang, Z.Z.; Cheng, L.; Zhang, L.L.; Du, H.H.; Tan, L.Y. Optimal operation of interbasin water transfer multireservoir systems: An empirical analysis from China. Environ. Earth Sci. 2019, 78, 238. [Google Scholar] [CrossRef]
  19. Song, H.Y.; Liu, J.Q.; Yin, P.; Zhang, Y. Distribution, enrichment and source of heavy metals in Rizhao offshore area, southeast Shandong Province. Mar. Pollut. Bull. 2017, 119, 175–180. [Google Scholar] [CrossRef] [PubMed]
  20. Lv, Y.; Li, X.; Yuan, J.; Tian, H.; Wei, T.; Wang, M.; Dai, Y.; Feng, J.; Zhang, Y.; Yang, P. Hydrogeochemical Signatures and Spatiotemporal Variation of Groundwater Quality in the Upper and Lower Reaches of Rizhao Reservoir. Water 2025, 17, 1659. [Google Scholar] [CrossRef]
  21. ISO/IEC 17025:2017; General Requirements for the Competence of Testing and Calibration Laboratories. International Organization for Standardization: Geneva, Switzerland; International Electrotechnical Commission: Paris, France, 2017.
  22. Singh, K.R.; Dutta, R.; Kalamdhad, A.S.; Kumar, B. Information entropy as a tool in surface water quality assessment. Environ. Earth Sci. 2019, 78, 15. [Google Scholar] [CrossRef]
  23. Nguyen, A.; Pham, N.; Tat, V.; Truong, H.; Vo, P. Application of Entropy weight in groundwater quality index (EWQI) and GIS for groundwater quality zoning in the Southeastern Coastal region, Vietnam. In Proceedings of the IOP Conference Series: Earth and Environmental Science, International Conference on Environment, Resources and Earth Sciences, Ho Chi Minh City, Vietnam, 1–5 December 2020; IOP Publishing: Bristol, UK, 2021. [Google Scholar]
  24. Zhang, Y.; Gao, S.; Hu, C.; Zhao, Z.; Gao, Z.; Liu, J. Hydrochemical assessment of groundwater utilizing statistical analysis, integrated geochemical methods, and EWQI: A case study of Laiwu region, North China. Environ. Monit. Assess. 2024, 196, 1222. [Google Scholar] [CrossRef] [PubMed]
  25. Kumar, P.S.; Augustine, C. Entropy-weighted water quality index (EWQI) modeling of groundwater quality and spatial mapping in Uppar Odai Sub-Basin, South India. Model. Earth Syst. Environ. 2022, 8, 911–924. [Google Scholar] [CrossRef]
  26. Latha, P. Evaluation of groundwater quality for domestic and irrigation purposes in a coastal alluvial aquifer using multivariate statistics and entropy water quality index approach: A case study from West Godavari Delta, Andhra Pradesh (India). Environ. Earth Sci. 2022, 81, 275. [Google Scholar] [CrossRef]
  27. GB 3838-2002; China National Standardization Administration. Environmental Quality Standards for Surface Water. China Environmental Science Press: Beijing, China, 2002.
  28. Misaghi, F.; Delgosha, F.; Razzaghmanesh, M.; Myers, B. Introducing a water quality index for assessing water for irrigation purposes: A case study of the Ghezel Ozan River. Sci. Total Environ. 2017, 589, 107–116. [Google Scholar] [CrossRef] [PubMed]
  29. Jalali, M. Groundwater geochemistry in the Alisadr, Hamadan, western Iran. Environ. Monit. Assess. 2010, 166, 359–369. [Google Scholar] [CrossRef] [PubMed]
  30. Bokhari, A.Y.; Khan, M.Z.A. Deterministic modeling of Al-Madinah Al-Munawarah groundwater quality using lumped parameter approach. J. King Abdul Aziz Univ. Earth Sci. 1992, 5, 89–107. [Google Scholar]
  31. Rawat, K.S.; Singh, S.K.; Gautam, S. Assessment of groundwater quality for irrigation use: A peninsular case study. Appl. Water Sci. 2018, 8, 233. [Google Scholar] [CrossRef]
  32. GB 5749-2022; Standards for Drinking Water Quality. State Administration for Market Regulation, Standardization Administration of the People’s Republic of China: Beijing, China, 2022.
  33. Piper, A.M. A graphic procedure in the geochemical interpretation of water-analyses. Eos Trans. Am. Geophys. Union 1944, 25, 914–928. [Google Scholar]
  34. Singh, K.K.; Tewari, G.; Kumar, S. Evaluation of groundwater quality for suitability of irrigation purposes: A case study in the Udham Singh Nagar, Uttarakhand. J. Chem. 2020, 2020, 6924026. [Google Scholar] [CrossRef]
  35. Marghade, D.; Malpe, D.B.; Subba Rao, N. Applications of geochemical and multivariate statistical approaches for the evaluation of groundwater quality and human health risks in a semi-arid region of eastern Maharashtra, India. Environ. Geochem. Health 2021, 43, 683–703. [Google Scholar] [CrossRef] [PubMed]
  36. Qu, J.; Lin, J.; Wang, J.; Yan, T.; Ren, K.; Zhou, J.; Li, Y. Analysis of the evolution and causes of groundwater chemistry after ecological water replenishment of the Jialu River, China. Sci. Rep. 2024, 14, 18759. [Google Scholar] [CrossRef] [PubMed]
  37. Eid, M.H.; Eissa, M.; Mohamed, E.A.; Ramadan, H.S.; Tamás, M.; Kovács, A.; Szucs, P. New approach into human health risk assessment associated with heavy metals in surface water and groundwater using Monte Carlo Method. Sci. Rep. 2024, 14, 1008. [Google Scholar] [CrossRef] [PubMed]
  38. Zhou, B.; Wang, H.; Zhang, Q.; Health, P. Assessment of the evolution of groundwater chemistry and its controlling factors in the Huangshui River Basin of northwestern China, using hydrochemistry and multivariate statistical techniques. Int. J. Environ. Res. Public Health 2021, 18, 7551. [Google Scholar] [CrossRef] [PubMed]
  39. Wang, S.; Chen, J.; Zhang, S.; Bai, Y.; Zhang, X.; Chen, D.; Hu, J. Groundwater hydrochemical signatures, nitrate sources, and potential health risks in a typical karst catchment of North China using hydrochemistry and multiple stable isotopes. Environ. Geochem. Health 2024, 46, 173. [Google Scholar] [CrossRef] [PubMed]
  40. Gibbs, R.J. Mechanisms controlling world water chemistry. Science 1970, 170, 1088–1090. [Google Scholar] [CrossRef] [PubMed]
  41. Chen, M.Y.; Feng, S.B. Hydrochemical Characteristics and Water Quality Evaluation of Surface Water in Chating Mining Area, Xuancheng, Anhui, China. Pol. J. Environ. Stud. 2022, 31, 5611–5620. [Google Scholar] [CrossRef] [PubMed]
  42. Yan, S.; Guo, H.; Yin, J.; Hu, H.; Cui, D.; Gao, B. Genesis of high hexavalent chromium groundwater in deep aquifers from loess plateau of Northern Shaanxi, China. Water Res. 2022, 216, 118323. [Google Scholar] [CrossRef] [PubMed]
  43. Yidana, S.M.; Bawoyobie, P.; Sakyi, P.; Fynn, O. Evolutionary analysis of groundwater flow: Application of multivariate statistical analysis to hydrochemical data in the Densu Basin, Ghana. J. Afr. Earth Sci. 2018, 138, 167–176. [Google Scholar] [CrossRef]
  44. Xiao, J.; Jin, Z.; Zhang, F.; Wang, J. Major ion geochemistry of shallow groundwater in the Qinghai Lake catchment, NE Qinghai-Tibet Plateau. Environ. Earth Sci. 2012, 67, 1331–1344. [Google Scholar] [CrossRef]
  45. Akshitha, V.; Balakrishna, K.; Udayashankar, H. Assessment of hydrogeochemical characteristics and saltwater intrusion in selected coastal aquifers of southwestern India. Mar. Pollut. Bull. 2021, 173, 112989. [Google Scholar] [CrossRef] [PubMed]
  46. Zhou, Y. Improved Estimates of the Spatial Distribution and Temporal Trends of Water Quality Parameters Using Geostatistical Data Fusion Methods; University of Michigan: Ann Arbor, MI, USA, 2013. [Google Scholar]
  47. Wei, S.M.; Zhang, Y.X.; Cai, Z.Z.; Bi, D.W.; Wei, H.H.; Zheng, X.F.; Man, X.B. Evaluation of groundwater quality and health risk assessment in Dawen River Basin, North China. Environ. Res. 2025, 264, 120292. [Google Scholar] [CrossRef] [PubMed]
  48. Verma, M.; Loganathan, V.A.; Bhatt, V. Development of entropy and deviation-based water quality index: Case of River Ganga, India. Ecol. Indic. 2022, 143, 109319. [Google Scholar] [CrossRef]
  49. Baï, R.; Kouame, I.K.; Kouassı, L.K.; Konan, S.K.; N’Cho, H. Assessment of the physicochemical quality of irrigation water and soil for sustainable irrigated rice cultivation: Case of irrigated perimeter of M’Bahiakro (central-east of Côte d’Ivoire). J. Environ. Prot. 2019, 10, 1536. [Google Scholar] [CrossRef]
  50. Wilcox, L. Classification and Use of Irrigation Waters; US Department of Agriculture: Washington, DC, USA, 1955. [Google Scholar]
  51. Etteieb, S.; Cherif, S.; Tarhouni, J. Hydrochemical assessment of water quality for irrigation: A case study of the Medjerda River in Tunisia. Appl. Water Sci. 2017, 7, 469–480. [Google Scholar] [CrossRef]
  52. Richards, L.A. Diagnosis and Improvement of Saline and Alkali Soils; US Government Printing Office: Washington, DC, USA, 1954. [Google Scholar]
  53. Srivastava, A.K.; Parimal, P. Source rock weathering and groundwater suitability for irrigation in Purna alluvial basin, Maharashtra, central India. J. Earth Syst. Sci. 2020, 129, 1. [Google Scholar] [CrossRef]
Figure 1. Spatial domain of the target reservoir system with georeferenced sampling locations. (a) Illustrates the location of Rizhao City within China. (b) Shows Rizhao City’s position in Shandong Province. (c) Map of the Rizhao Reservoir area and location of sampling sites.
Water 17 02224 g001
Figure 2. Surface water hydrochemical constituent statistics: (a) 2023–2024 river water; (b) 2019–2023 reservoir water.
Water 17 02224 g002
Figure 3. Comparison of TH and TDS water types.
Water 17 02224 g003
Figure 4. Reservoir and river water Piper diagram.
Water 17 02224 g004
Figure 5. Pearson correlation matrix for water quality parameters. Circle properties scale with |r|: large deep-blue: strong positive (r > 0.7, p < 0.05); small pale-yellow: negligible (|r| < 0.3, p > 0.05). (a) river water; (b) reservoir water.
Water 17 02224 g005
Figure 6. Gibbs diagram of river and reservoir water: (a) TDS vs. Na+/(Na+ + Ca2+); (b) TDS vs. Cl/(Cl + HCO3).
Water 17 02224 g006
Figure 7. Relationship between major ion ratios in the river and the reservoir water: (a) Cl vs. Na+, (b) (Ca2+ + Mg2+)/HCO3, (c) Ca2+ vs. Mg2+, (d) (Ca2+ + Mg2+)/(SO42− + HCO3).
Water 17 02224 g007
Figure 8. Ionic map of dominant geochemical processes: (a) Mg2+/Na+ vs. Ca2+/Na+ (silicate hydrolysis identification), (b) HCO3/Na+ vs. Ca2+/Na+ (carbonate equilibrium diagnostics).
Water 17 02224 g008
Figure 9. Dynamic curves of the content of major ions in river water and reservoir water. (ah) River water (i) Reservoir water.
Water 17 02224 g009
Figure 10. Temporal variation in surface water EWQI. (a) EWQI for river water; (b) EWQI for reservoir water.
Water 17 02224 g010
Figure 11. Irrigation water quality evaluation map of the study area: (a) Wilcox; (b) USSL.
Water 17 02224 g011
Table 1. Irrigation water suitability rating scale.
Evaluation ParametersClassification Reference ValuesApplicable GradeEvaluation ParametersClassification Reference ValuesApplicable Grade
%Na<20well suitedSAR<10well suited
20–40better suited10–18better suited
40–60suitability18–26suitability
60–80inconclusive>26unsuitable
>80unsuitable
RSC<1.25well suitedPI%>75I (well suited)
1.25–2.50suitability25–75II (suitability)
>2.50unsuitable<25III (unsuitable)
Table 2. Comparative hydrochemistry: ANOVA of river and reservoir waters.
Norm (Unit)Square SumMean SquareFSignificance
Ca2+ (mg/L)698.953698.95314.322<0.0003
Mg2+ (mg/L)79.28479.2846.8150.0112
K+ (mg/L)1.3321.3322.4380.1234
Na+ (mg/L)1611.7841611.78434.828<0.0000
HCO3 (mg/L)19,930.70119,930.70154.704<0.0000
SO42− (mg/L)16.32216.3220.1380.7116
Cl (mg/L)2330.2082330.2088.2900.0054
NO3 (mg/L)12.71412.7140.2880.5935
pH (/)1.5731.5735.9190.0178
TDS (mg/L)41,253.23941,253.23927.332<0.0000
TH (mg/L)10,533.74410,533.74418.547<0.0001
Table 3. EWQI classification map.
EWQILevelCategory
<25IExcellent
25~50IIGood
51~100IIIMedium
101~150IVPoor
>150VVery poor
Table 4. Evaluation of irrigation water quality in river and reservoir water.
ParametersRank ValueWater ClassificationNumber of Samples
RiverReservoirs
%Na<20Excellent620
20–40Good3010
40–60Permissible00
60–80Doubtful00
>80Unsuitable00
RSC<1.25Good3630
1.25–2.50Doubtful00
>2.50Unsuitable00
SAR0–6Good3630
6–9Doubtful00
>9unsuitable00
PI%>75Good00
25–75Suitable3630
<25Unsuitable00
Disclaimer/Publisher’s Note: The statements, opinions and data contained in all publications are solely those of the individual author(s) and contributor(s) and not of MDPI and/or the editor(s). MDPI and/or the editor(s) disclaim responsibility for any injury to people or property resulting from any ideas, methods, instructions or products referred to in the content.