Article

Valuating Hydrological Ecosystem Services Provided by Groundwater in a Dryland Region in the Northwest of Mexico

by
Frida Cital
,
J. Eliana Rodríguez-Burgueño
*,
Concepción Carreón-Diazconti
and
Jorge Ramírez-Hernández
Instituto de Ingeniería, Universidad Autónoma de Baja California, Calle de La Normal S/N and Boulevard Benito Juárez, Mexicali 21100, Mexico
*
Author to whom correspondence should be addressed.
Water 2025, 17(15), 2221; https://doi.org/10.3390/w17152221
Submission received: 10 June 2025 / Revised: 20 July 2025 / Accepted: 23 July 2025 / Published: 25 July 2025
(This article belongs to the Section Ecohydrology)

Abstract

Drylands cover approximately 41% of Earth’s land surface, supporting about 500 million people and 45% of global agriculture. Groundwater is essential in drylands and is crucial for maintaining ecosystem services and offering numerous benefits. This article, for the first time, analyses and valuates the hydrological ecosystem services (HESs) provided by groundwater in a region of the Colorado River Delta in Mexico, an area with uncertain economic impact due to water scarcity. The main water sources are the Colorado River and groundwater from the Mexicali and San Luis Rio Colorado valley aquifers, both of which are overexploited. Valuation techniques include surrogate and simulated market methods for agricultural, industrial, urban, and domestic uses, the shadow project approach for water conservation and purification cost avoidance, and the contingent valuation method for recreation. Data from 2013 to 2015 and 2020 were used as they are the most reliable sources available. The annual value of HESs provided by groundwater was USD 883,520 million, with water conservation being a key factor. The analyzed groundwater uses reflect differences in efficiency and economic value, providing key information for decisions on governance, allocation, conservation, and revaluation of water resources. These results suggest reorienting crops, establishing differentiated rates, and promoting payment for environmental services programs.

1. Introduction

Drylands cover 41% of the Earth’s land surface and are the habitat for approximately 500 million people and 45% of the agricultural lands [1]. These regions are considered the most impacted and vulnerable ecosystems to anthropogenic climate and land-use change, including water availability [1,2]; they have only 8% of the world’s renewable water supply [2]. The primary water source in drylands is groundwater, which provides drinking water for the population, for irrigating lands, and supports terrestrial ecosystems [3].
Water is essential to all forms of life and for human civilization; it is a fundamental driver for ecological processes [4] and plays a vital role in human well-being and the sustainable development of ecosystems and societies. One way to think of the potential benefits that water provides is in terms of ecosystem services (ESs) [5]. The benefits to people produced by the terrestrial ES effects on freshwater are known as freshwater ecosystem services [6] or hydrological ecosystem services (HESs) [7]; therefore, groundwater is a critical component providing some of the requirements necessary to maintain ESs [8], and although their protection generates multiple benefits [9], they are usually not considered in the context of ecosystem services [10].
Among the essential services that groundwater provides to humanity are the provision of water for domestic and agricultural use, geothermal water to produce energy, mitigation of floods and droughts, baseflow to maintain ecosystems and biodiversity, purification of water throughout the removal of contaminants by degradation processes, pathogens elimination, and others [11,12,13,14,15]. The provision of HESs is affected by the growing population, climate and land-use change, pollution, and agricultural, domestic, and industrial activities [16,17]. Each HES is defined by the attributes of quantity, quality, location, and timing of water flow [7].
The 1992 Dublin Principles recognized water as a public good with a social and economic value in all competing uses [18]. Economists express the benefits of water as monetary measures of the gains in well-being obtained from HESs, such as improving water quality, water supply, and others. Using a monetary unit to measure inputs and outputs enables comparisons of benefits with costs of investments or foregone values in alternative uses [5].
There are many definitions of the value of water; Briscoe [19] defines it as the maximum amount the consumer would be willing to pay (WTP) for the use of the resource; another definition of WTP is the net value after all associated costs that the user pays for a particular quantity and quality of water at a particular location at a particular time [5]. UNESCO [20] establishes the value of water in three main ways: the first as the exchange value related to the marketplace, the second as the utility, which refers to the use of a good or service, and the third as the appreciation of the emotional or spiritual value of the good or service; finally, Rogers, Silva [21] define it as the benefit to users, such as from returned flows and indirect and intrinsic values. In general, the economic values of water can be categorized, as shown in Figure 1.
Valuing water is a complex and contentious exercise owing to water’s physical, political, and economical characteristics, but it is necessary [22]. Expressing their value in monetary terms is an estimate of their benefit to society, benefits that would be lost if they were destroyed or gained if they were restored [23]. Understanding the economic value of water in its different uses thus becomes useful at different user levels, and a helpful indicator of how well the selected regime for water management and its performance [24]. For example, the HES valuation provides arguments to integrate ecosystem monetary values in water management decisions. However, some other criteria and considerations play an essential role, for instance, an ecosystem’s cultural or intrinsic value [25]. Some methods used to valuate HESs provided by groundwater are shown in Table 1.
The Colorado River (CR), a river with a transboundary basin, the largest in the southwestern U.S. and globally one of the most important, flows through Colorado, New Mexico, Nevada, Utah, Wyoming, Arizona, and California in the U.S., and Baja California and Sonora in Mexico. The CR basin has one of the highest uncertainties in terms of economic impact in the world in light of water scarcity [27].
The water of the CR, along its 2350 km length, is used to supply water for 40 million people, including 22 indigenous reservations, 2.2 million hectares of agricultural lands, 11 national parks, and other uses [28].
Hydraulic infrastructure of the CR abounds at almost every turn on the river’s fourteen dams in its channel and hundreds more on its tributaries; the two major reservoirs (Hoover and Glen Canyon dams) can hold four times the annual runoff of the river [29]. Otherwise, the water stress, the growing population, the increasing water demand, and the persistent drought conditions in the basin have changed the hydrological regimen in the river, which has led to water not draining into its delta (the Colorado River Delta [CRD]) regularly. Since the establishment of such hydraulic control, approximately 92% (720,000 ha) of wetlands and riparian areas supported by the river were lost; however, the 60,000 ha remaining serve as a habitat for resting waterbirds and landbirds that use the Pacific Flyway migratory route, and are used by about 31 million landbirds as nesting sites during the spring and fall [30]. As the main goal is to mitigate to some extent the environmental impacts in the CRD, binational cooperation between governmental institutions, NGOs, academia, and users has been developing [31]. Some examples of this binational cooperation are legal agreements such as Minutes 318, 319, and 323 that enforce the provision of water for environmental purposes and the establishment of five restoration sites along the CRD.
Previous investigations analyzed the ecosystem services provided by the Colorado River watershed, including the CRD, as listed below. López-Hoffman, Varady [32] analyzed the ESs provided by the All-American Canal, which is located at the border of California and Baja California; Kaval [33] made a review of the ESs provided by the Colorado River in the transboundary basin. At the CRD, Flessa [34] estimated the ecosystem value of water as approximately USD 260 million; years later, Sanjurjo and Islas [35] performed an economic valuation of the recreational activities, estimating between MXN 1.9 and 9 million (around USD 95,000 to 300,000). Also, Bark, Robinson [36], and Kerna, Colby [37], estimated the value of the cultural and recreational ESs provided by the environmental flows. Additionally, Lomelí [38] studied the ecosystem value of the Cienega de Santa Clara, a wetland located south of the CRD, and Cital, Ramírez-Hernández [39] analyzed the ESs provided by an agricultural drain in the Mexicali Valley.
One of the most important water sources for the arid region of Baja California and Sonora is groundwater, and the main administrative aquifers are the Mexicali Valley aquifer (MVA) and San Luis Río Colorado aquifer (SLRCA), which are overexploited and have an increasing water salinity, as are many others in semi-arid regions [40]. Despite the recognition of surface water ecosystem services in the Colorado River Delta, the ecosystem services specifically provided by groundwater in this transboundary region remain largely unquantified and understudied, particularly from an economic perspective. Most prior assessments have focused on environmental flows, wetlands, and recreational services linked to surface water bodies, leaving a critical gap in understanding the role of groundwater in sustaining both human and ecological systems. This article addresses that gap by analyzing and valuing the hydrological ecosystem services provided by groundwater in the Mexican portion of the CRD, using a methodological framework that combines surrogate and simulated market approaches. The results not only provide the first comprehensive valuation of groundwater HESs in the region but also offer a replicable approach for other semi-arid regions facing similar groundwater stress and governance challenges.

1.1. Study Area

The study area (Figure 2) is located in the northwest of Mexico, an arid region that forms part of the Sonoran Desert, in Baja California and Sonora, respectively, and covers a total of 3950 km2 (395,000 ha). It includes the administrative aquifers of Mexicali Valley and a portion of the SLRC, which constitute the official delimitation of the groundwater management unit in Mexico and form part of the transboundary geohydrological system of the Colorado River Delta [41]. The study area also encompasses the Colorado River 014 Irrigation District (DR014) and the Cienega de Santa Clara, with extreme temperatures, between 50 °C in summer and 0 °C in winter (122 °F and 0 °F); the annual mean precipitation is 76 mm/yr. A reference evapotranspiration of 1818 mm/yr has been reported [42]. Approximately 1.2 million people live in the study area; the main economic activities are agriculture and industry [43].

1.1.1. Hydrogeological Conditions

The present study is related to the unconfined detrital aquifer, MVA, located above a discontinuously altered hydrothermally impermeable layer, and beneath it lies a confined aquifer with a high temperature. The MVA lies in a tectonically subsiding basin influenced by fluvial, aeolian, and marine sedimentation [44,45]. It comprises unconsolidated Quaternary sediments with a depth ranging from 300 to 3000 m [46]. Their upper 200 m include alluvial, estuarine, and deltaic deposits from the Colorado River [47]. High-transmissivity sand and gravel are in the north and northeast portions of the study area. Granite, gneiss, and schist make up the low permeability limit of the Sierras Cucapá and El Mayor to the west and southwest [48]. The groundwater generally flows from northeast to southeast. Recharge primarily comes from seepage of irrigation infrastructure such as canals and drains [49,50].

1.1.2. Water Use

In the study area, there are two main water sources: (1) surface water from the Colorado River, and (2) groundwater from MVA and SLRCA aquifers. Figure 3 shows the groundwater uses; it can be observed that the main uses are agriculture and urban activities.
The primary user of groundwater is the DR014, which is compounded by 22 irrigation modules (Figure 2). DR014 is located within the study area; this district manages the agricultural and some of the rural water, and has 156,769 hectares of cultivated land. DR014 is one of the most important in the country because of the extensive cultivated area and the amount of water used [52]. The main crops cultivated in this irrigation district are wheat (Triticum aestivum), alfalfa (Medicago sativa), and cotton (Gossypium hirsutum) [53].
The second users are urban and industrial, which are administered by municipal water operating agencies in Mexicali, SLRC, and outside the watershed in Ensenada, Tecate, Tijuana, and Rosarito in Baja California, such as the State Water Commission of Public Services of Mexicali (CESPM) and the San Luis Río Colorado Drinking Water, Sewerage, and Sanitation Operator Agency (OOMAPAS). Also, to administer the water in the SLRC and Mexicali valleys, there are water committees for domestic, industrial, and commercial uses. Urban water use is the primary consumer in the SLRC Valley aquifer (Figure 3). The principal industries that use groundwater in the study area manufacture medical equipment, glass, and paper; other principal water uses are livestock, drinking water, and beverages [51].

2. Materials and Methods

The selection of valuation methods was based on both a literature review (Table 1) and the data availability and quality for the study area. HESs provided by the groundwater in the study area were valued using a method based on the surrogate and simulated market technique [54]. The first expresses the economic value of the ES through water shadow prices multiplied by the market value of the commodity produced (i.e., productivity), representing the marginal value produced and related to the efficiency gain from current reallocation [55]. While this approach is based on observed market behavior and reflects opportunity costs, it may also present certain limitations. For instance, shadow prices depend on assumptions made in the scenario or modeling process, and can vary significantly depending on the data quality, when models are used on the underlying economic model, or calibration parameters. Moreover, this method assumes fully rational and competitive markets, which may not always reflect the complexities of water use and allocation. These factors can introduce bias or uncertainty into the valuation, and the results should then be interpreted considering these methodological constraints.
In contrast, the simulated market technique expresses the economic value of ESs using the willingness to pay, which involves only one assessment method: the contingent valuation method. Although this method allows the inclusion of non-market value and preferences, it is also subject to well-documented biases, such as hypothetical, strategic, and information bias. These limitations can affect the accuracy and reliability of willingness to pay estimates, especially when respondents overstate or understate their true valuations due to the hypothetical nature of the scenarios. Therefore, the results derived from this method should be interpreted with caution and complemented with other valuation approaches when possible.
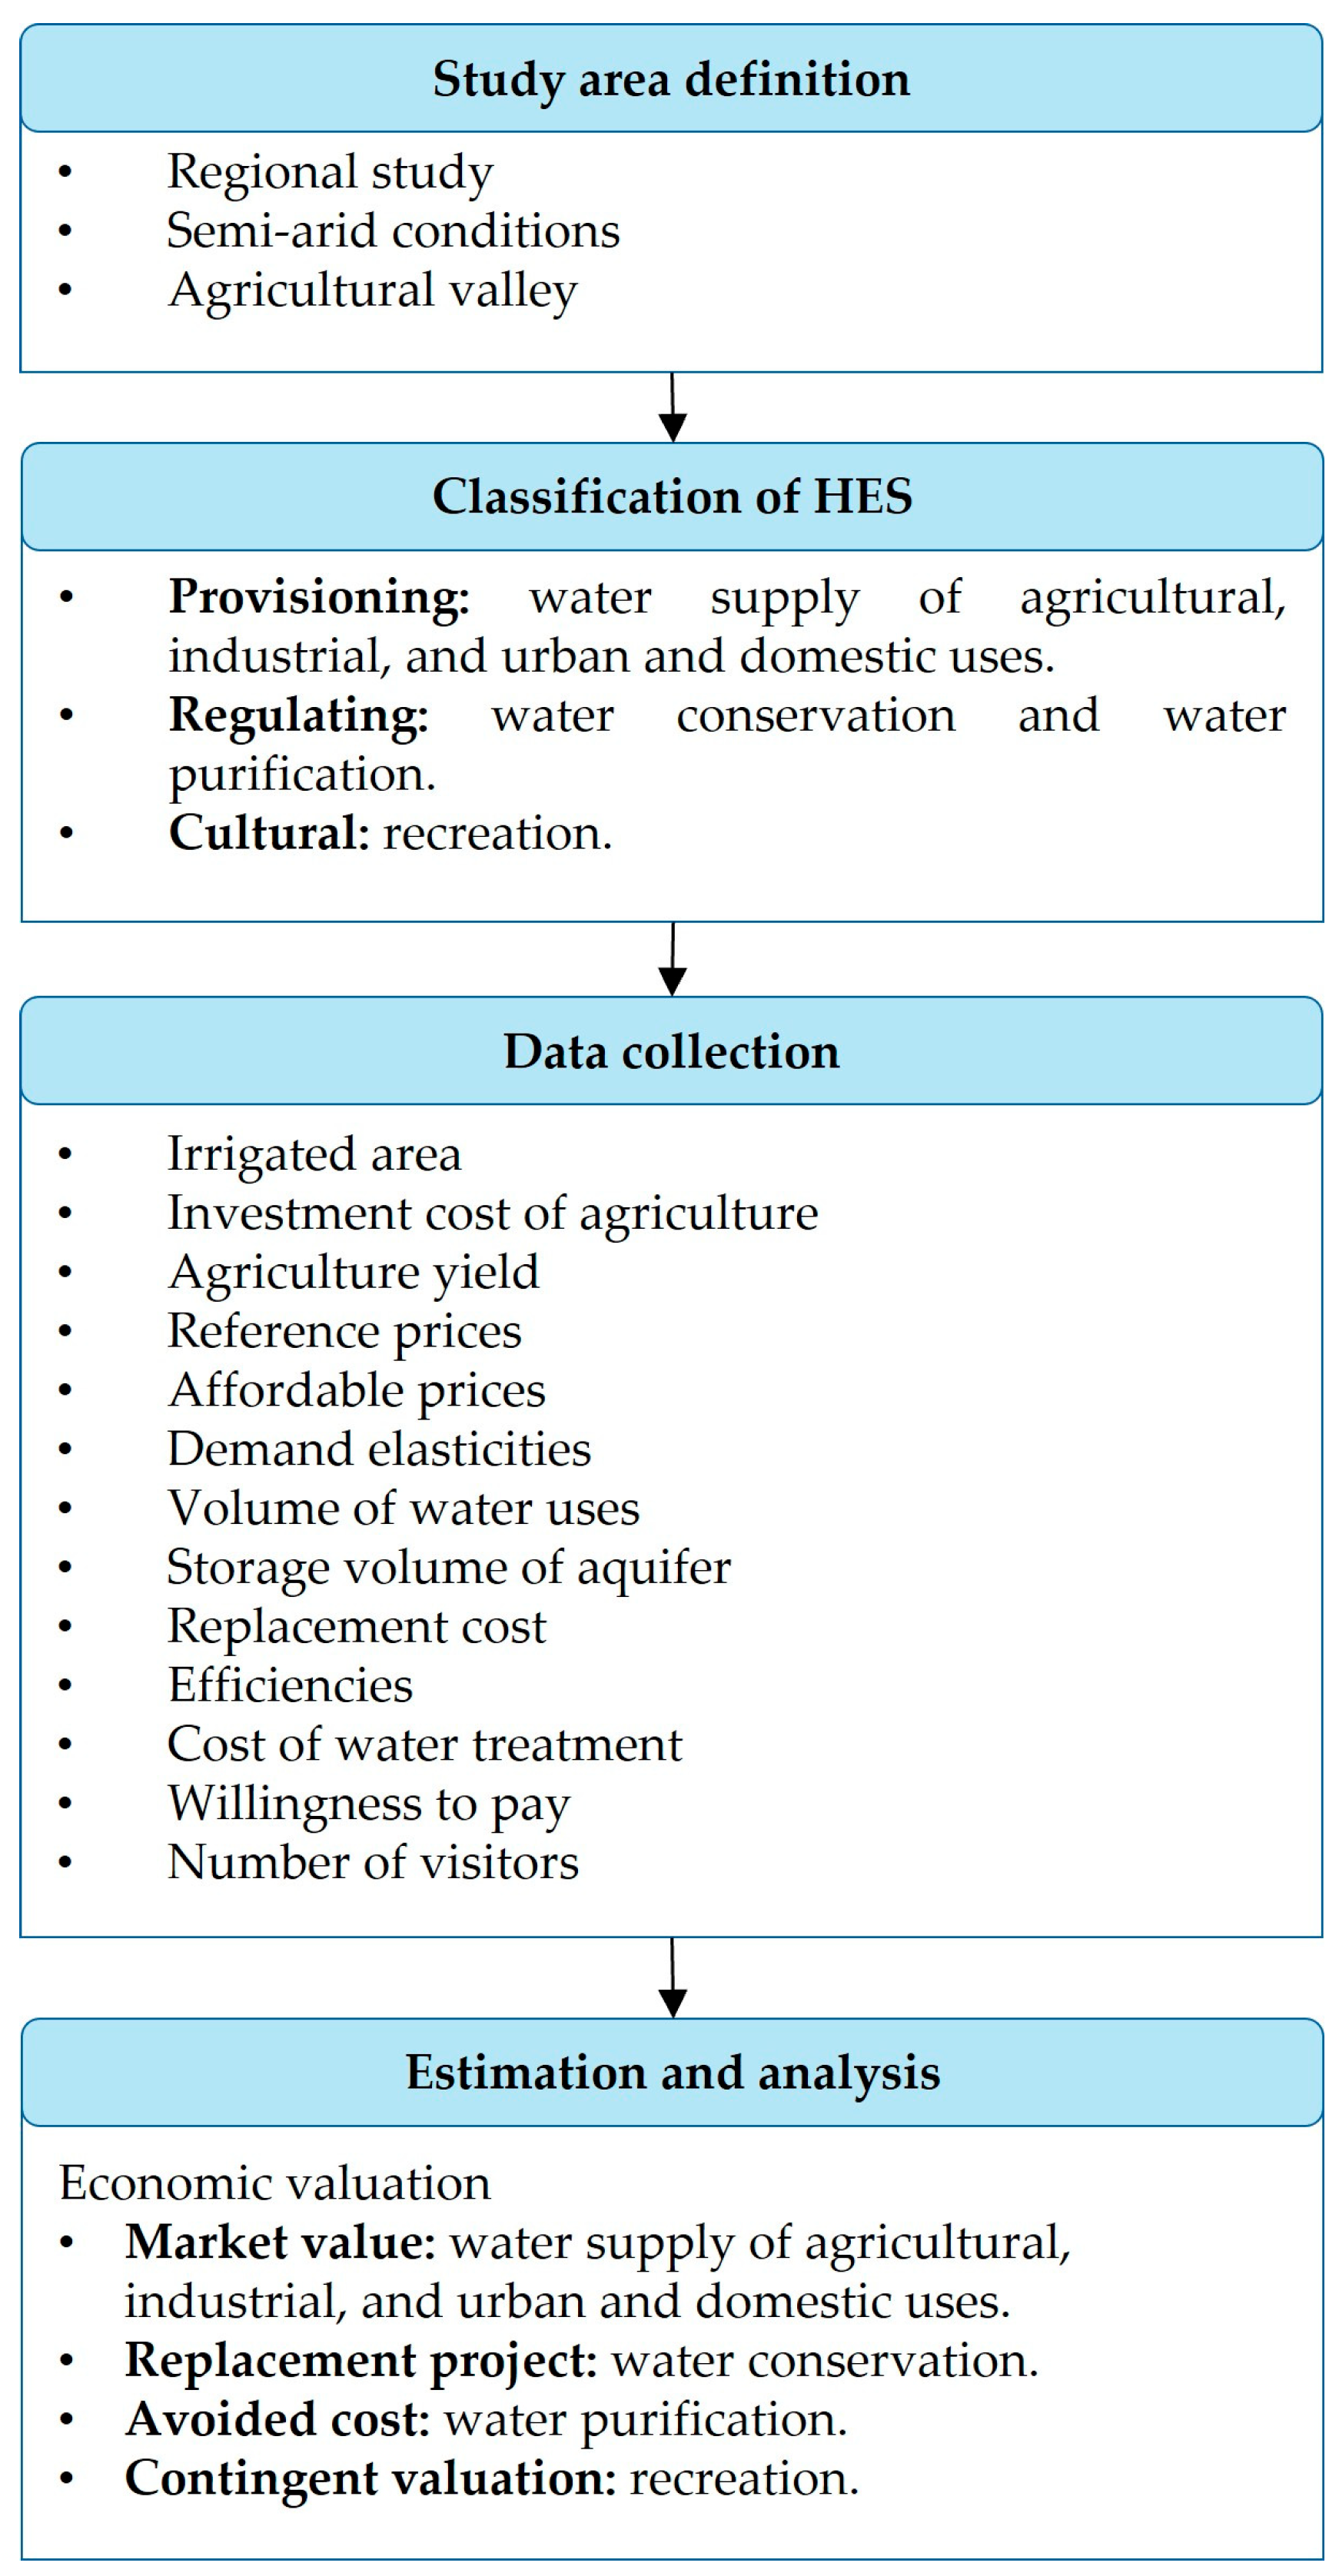
The suitable indicators used to assess the HESs are indicated in Table 2. The research framework of this study is presented in Figure 4.

2.1. Valuation Methods for Provisioning HESs

To understand the valuation of provisioning HESs in the study area, the water demand was classified by three end-uses: (1) agricultural, (2) industrial, and (3) urban and domestic.

2.1.1. Groundwater for Agricultural Use

The accurate valuation of irrigation water is of special interest because agriculture is the primary use of groundwater, and economic evaluation of proposed groundwater withdrawal regulations is of particular importance in numerous regions experiencing overdrafts [5], as is the case in the study area.
The production function for agriculture is applied to model the production of crops based on agricultural land, marketable inputs such as seed, fertilizers, pesticides, energy, and the water input (Equation (1)) [55].
Y = f A , P , W , e
where Y is the crop production (kg); A is the area of the agricultural land (ha); P is the vector of marketable inputs (dimensionless); W is the vector of water inputs (m3); e is the stochastic disturbance (dimensionless).
The economic value of the extracted groundwater was estimated using the market price with Equation (2), where V 1 is the value of groundwater for agricultural use (USD/m3), A 1 is the irrigated area (ha), P is the cost of agricultural products (USD), Y D is the agricultural production per unit of irrigated area (ton/ha), and C is the annual investment cost (USD).
V 1 = A 1 · P · Y D C
The data used in this study was taken from DR014 registers and corresponds to the 2013–2014 agricultural annual cycle. The valuation of groundwater for agricultural use was analyzed in three scales: (1) by irrigation district, (2) by irrigation module, and (3) by crop.
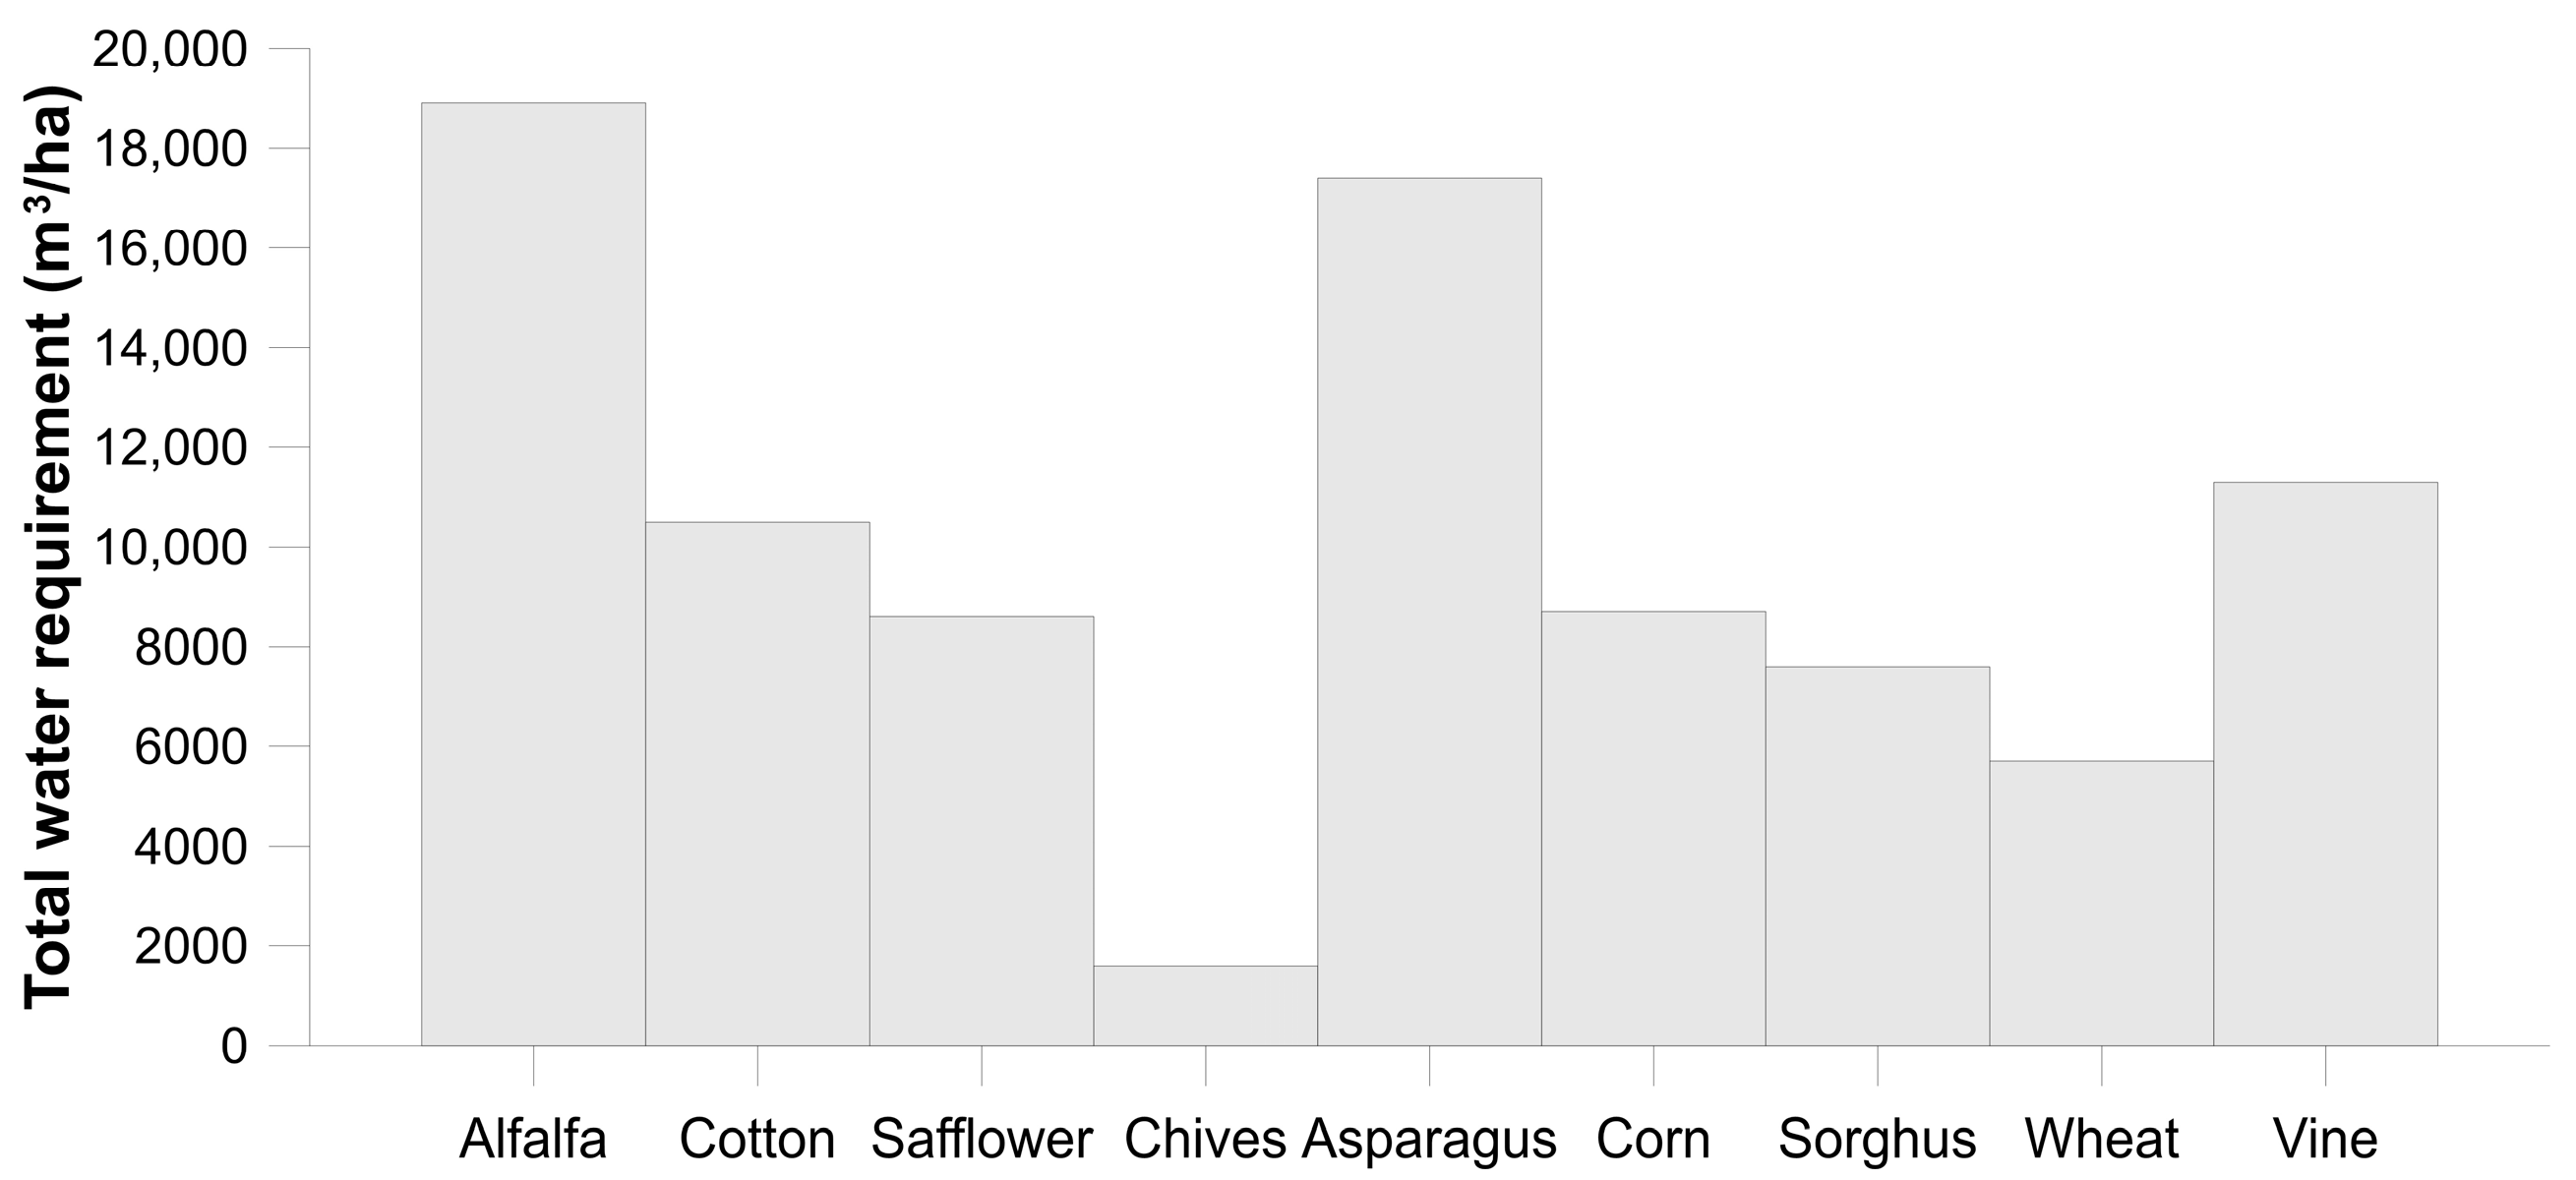
The fall–winter season comprises October to January; during this period the main crops cultivated are wheat (Triticum aestivum), safflower (Carthamus tinctorius), ryegrass (Lolium perenne), and chives (Allium schoenoprasum), among others. The spring–summer season corresponds to February to September; the crops considered in this season are cotton (Gossypium hirsutum), sorghum (Sorghum bicolor (L.) Moench.), corn (Zea mays), chives (Allium schoenoprasum), and others, such as dates (Phoenix dactylifera L.) and vegetables. The perennial crops were alfalfa (Medicago sativa), fruit, vine (Vitis vinifera), and bermuda (Cynodon dactylon). Local water needs estimation for these crops is shown in Figure 5.
The shadow value per crop was estimated by dividing the net value of the production (the cost of agricultural production minus the investment cost) per crop by the sum of the volume of groundwater applied in the 22 irrigation modules for each crop.

2.1.2. Groundwater for Industrial Use

According to Yang and Liu [14], the economic value of groundwater for industrial use approximates the average willingness to pay or the consumer’s surplus value, given in the following equation (Equation (3)):
V 2 = P 0 Q 1 P a P 0 n + 1 1 n + 1
where V 2 is the groundwater value for industrial use (USD/m3); P 0 is the reference price of water (USD/m3); P a is the affordable price of water (USD/m3); Q 1 is the volume of water use in the industry (m3); n is the demand elasticity of industrial water in the study area (dimensionless), which expresses the function between the quantity ( Q ) and is differentiable with respect to price ( P ) [57]. The demand elasticity ranges from −0.02 to −3.33; the wide range elasticity depends on data characteristics, the price schemes, and the estimation techniques [58]. The data used in this part of the study was from the CESPM, the Public Registry of Water Rights (REPDA by the Spanish acronym), and the Revenue State Law of Baja California for the year 2020.

2.1.3. Groundwater for Urban and Domestic Use

The economic value of the groundwater for urban uses was estimated using the consumer surplus as the willingness to pay for water [14] (Equation (4)):
V 3 = P 1 Q 2 P b P 1 n + 1 1 n + 1
where V 3 is the value of groundwater for the urban and domestic uses (USD/m3); P 1 is the reference price for the use (USD/m3); P b is the affordable price (USD/m3); Q 2 is the groundwater volume usage (m3); n is the demand of domestic water elasticity in the study area (dimensionless). The data used in our estimations were taken from CESPM, domestic use reports from the REPDA, and the Revenue Law of the State of Baja California for the year 2020.

2.2. Valuation Methods for Regulating HESs

2.2.1. Water Conservation

The economic value of the water conservation as HESs of the study area was estimated using the shadow project approach, which simulates the cost of a replacement project [59] to the HESs provided by the aquifer. For water conservation, the cost of the reservoir was used, simulating reservoirs that are capable of storing water as the aquifer. To estimate the storage volume of the aquifer, the hydraulic properties used by Rodríguez-Burgueño [60] were applied in Equation (5):
V 4 = Q 3 C 2
where V 4 is the value of the groundwater conservation HES (USD/m3); Q 3 is the volume of the groundwater stored in the study area (m3); C 2 is the cost of a reservoir that can store 1 m3 of water (USD).

2.2.2. Water Purification

The study area is under a contamination risk because it is in an agricultural valley where fertilizers and pesticides are applied on irrigation lands; these chemical components could infiltrate and provoke diffuse aquifer contamination. In addition to that, six wastewater (Table 3) primary treatment plants (WWTPs) that operate through a system of oxidation ponds and wetlands, discharge their effluents into surface water bodies such as agricultural drains and rivers that, in some portions, are connected to the aquifer.
To analyze water purification as an HES provided by the study area, data from the CESPM was used in Equation (6) proposed by Yang and Liu [14]:
V 5 = Q 4 f 1 C 3
where V 5 is the value of groundwater in the water purification ES (USD/m3); Q 4 is the volume of wastewater per year (m3/yr); f 1 is the losses in the pipeline (leakage rate, m3/yr); C 3 is the cost of 1 m3 of wastewater in the study area (USD).

2.3. Valuation Methods for Cultural HESs

Recreation

Due to agricultural return flows, the shallow groundwater table supports the riparian habitat in some areas of the DR014 and stagnant surface water in the river mainstem and low-elevation meanders, used for recreational purposes [62].
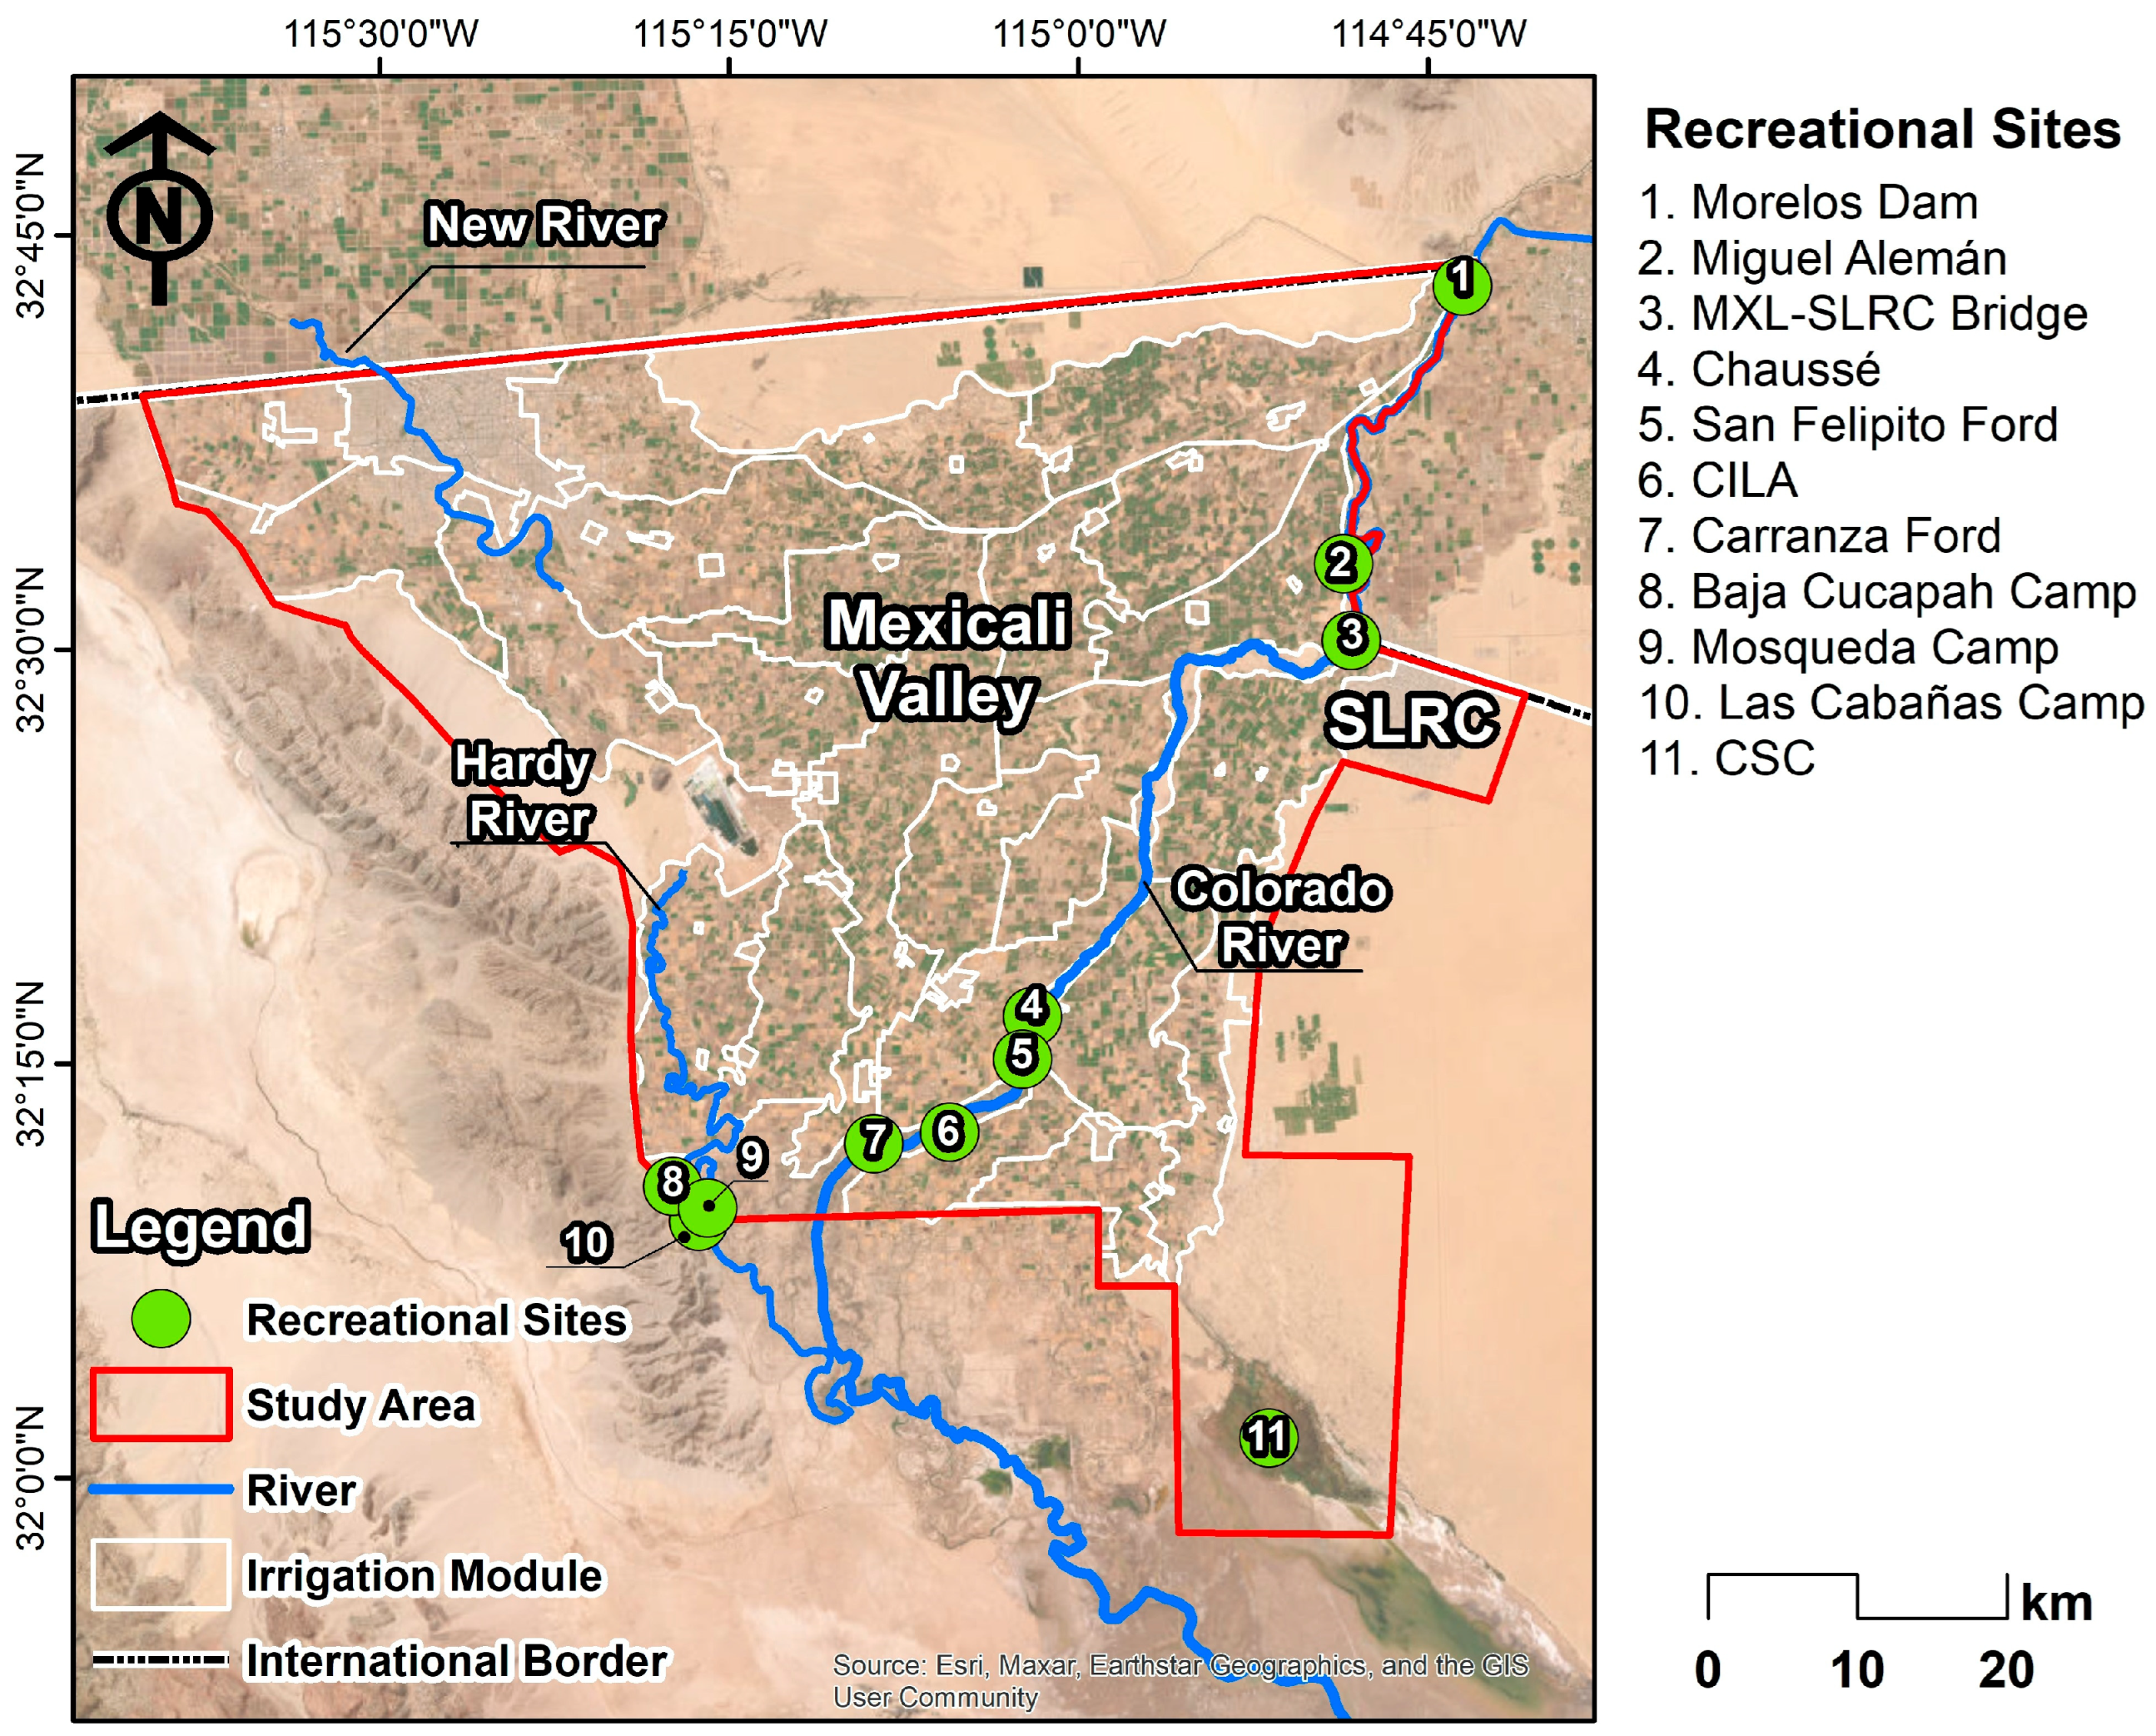
Recreational activities in the study area are of great significance for society in the CRD (Figure 6). Along the CR channel, local inhabitants use areas for aquatic activities, sports, bird watching, nature observation, and family gathering, such as Morelos Dam, San Felipito and Carranza fords, restoration sites such as Miguel Aleman, Chausse, Laguna Grande restoration complex, and others. Along the Hardy River, there are camping facilities visited by locals and tourists along both river margins. Some of these are Campo Mosqueda and Baja Cucapah; the visitors also spent the entire winter season in country houses. Another site that is used for recreation is the Cienega de Santa Clara wetland located in the southeast of the study area, close to the California Gulf, visited by locals and tourists for aquatic activities, hunting, bird watching, nature observation, and sport fishing.
The estimation of the recreational value of groundwater as HESs provided in the study area was carried out using the results of willingness to pay estimated by the contingent valuation method presented by Kerna, Colby [37], which were obtained from 584 surveys applied in low and high amenity sites in the study area; this result was multiplied by the number of inhabited houses in the study area according to the National Population and Housing Census conducted in 2020 by the National Institute of Statistics and Geography [43]. Morelos Dam and Cienega de Santa Clara amenity sites have no admission cost; in contrast, Mosqueda and Baja Cucapah camps have a cost to access them, and they offer restrooms, picnic tables, restaurants, and other services.

3. Results and Discussion

3.1. Provisioning Hydrological Ecosystem Services

3.1.1. Groundwater for Agricultural Use
The provision of groundwater for agriculture uses ( V 1 in the study area was estimated at USD 66 million for the 2013–2014 agricultural annual cycle. Table 4 shows the value of water per season and per unit of irrigated surface.
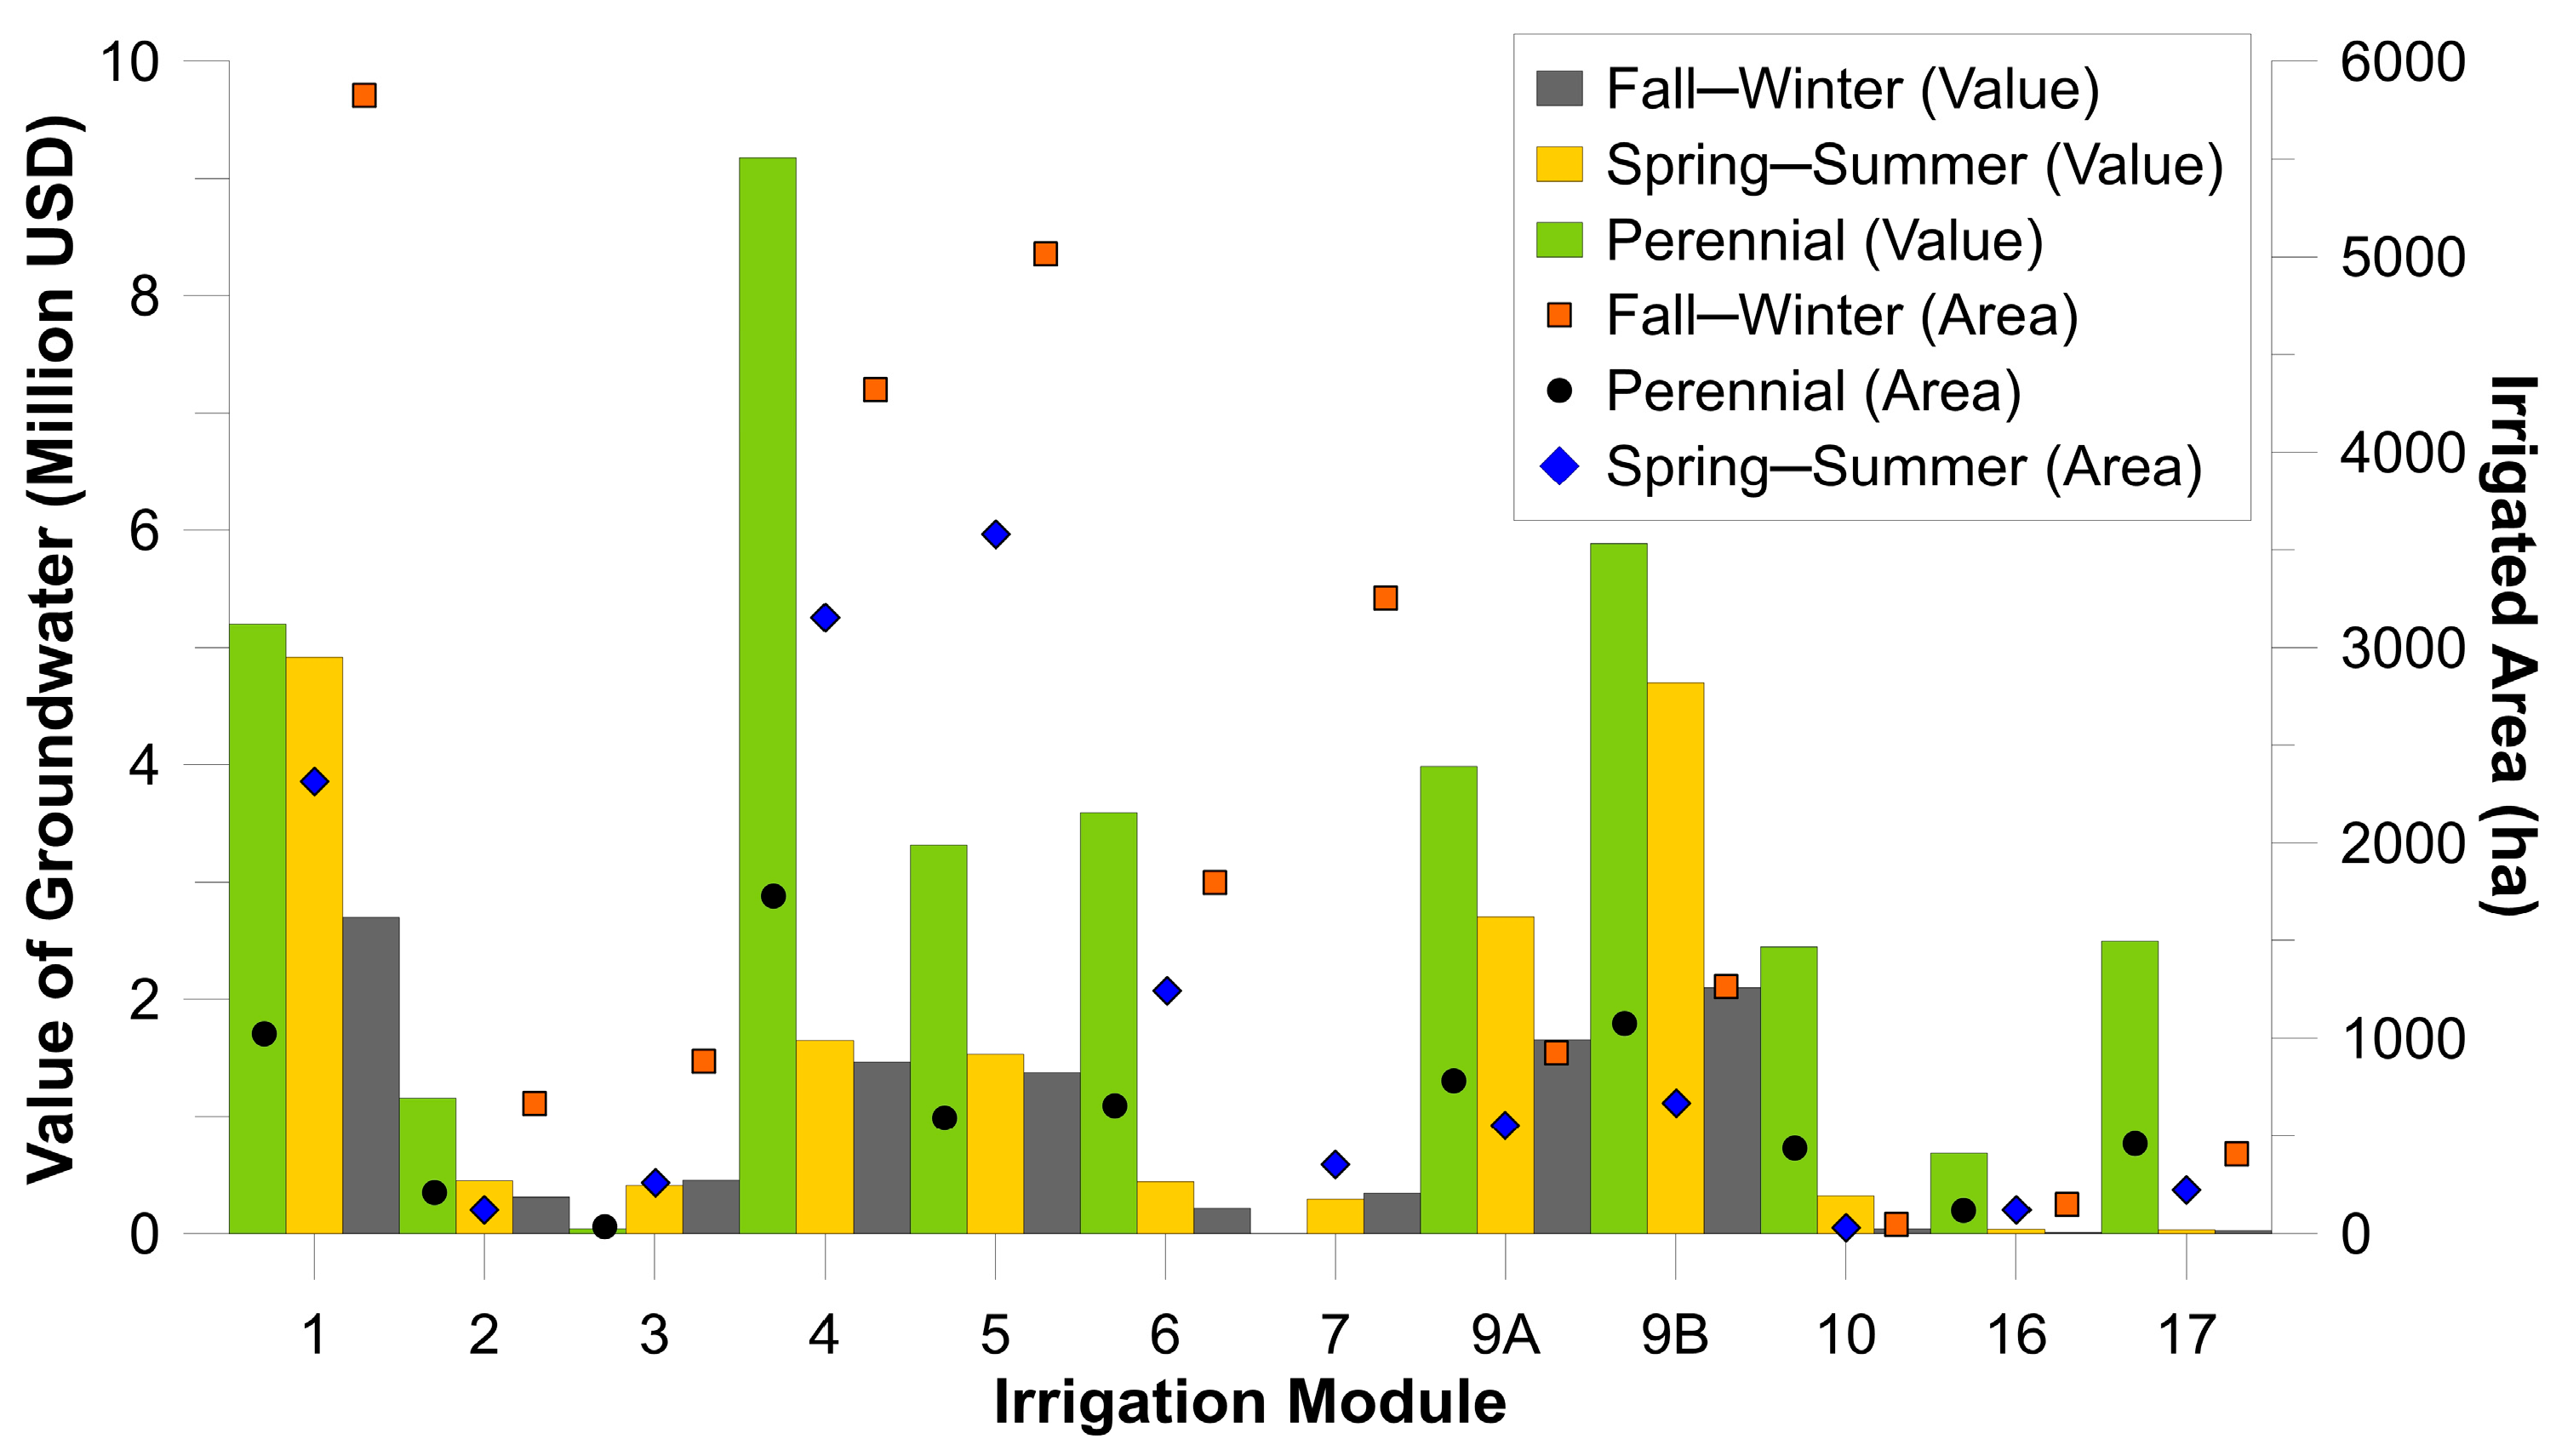
Figure 7 shows the agricultural irrigated area with groundwater (GW) and the value of GW per irrigation module and season. Modules 1, 4, 5, and 7 excel in irrigated areas during the fall–winter season; however, the value of groundwater is considerably lower (45, 11, 10, and 51%) than in other seasons with smaller irrigated areas. This was inferred to mean that the main crop (wheat) in the season has a mean rural price 87 times lower than other crops, such as cotton.
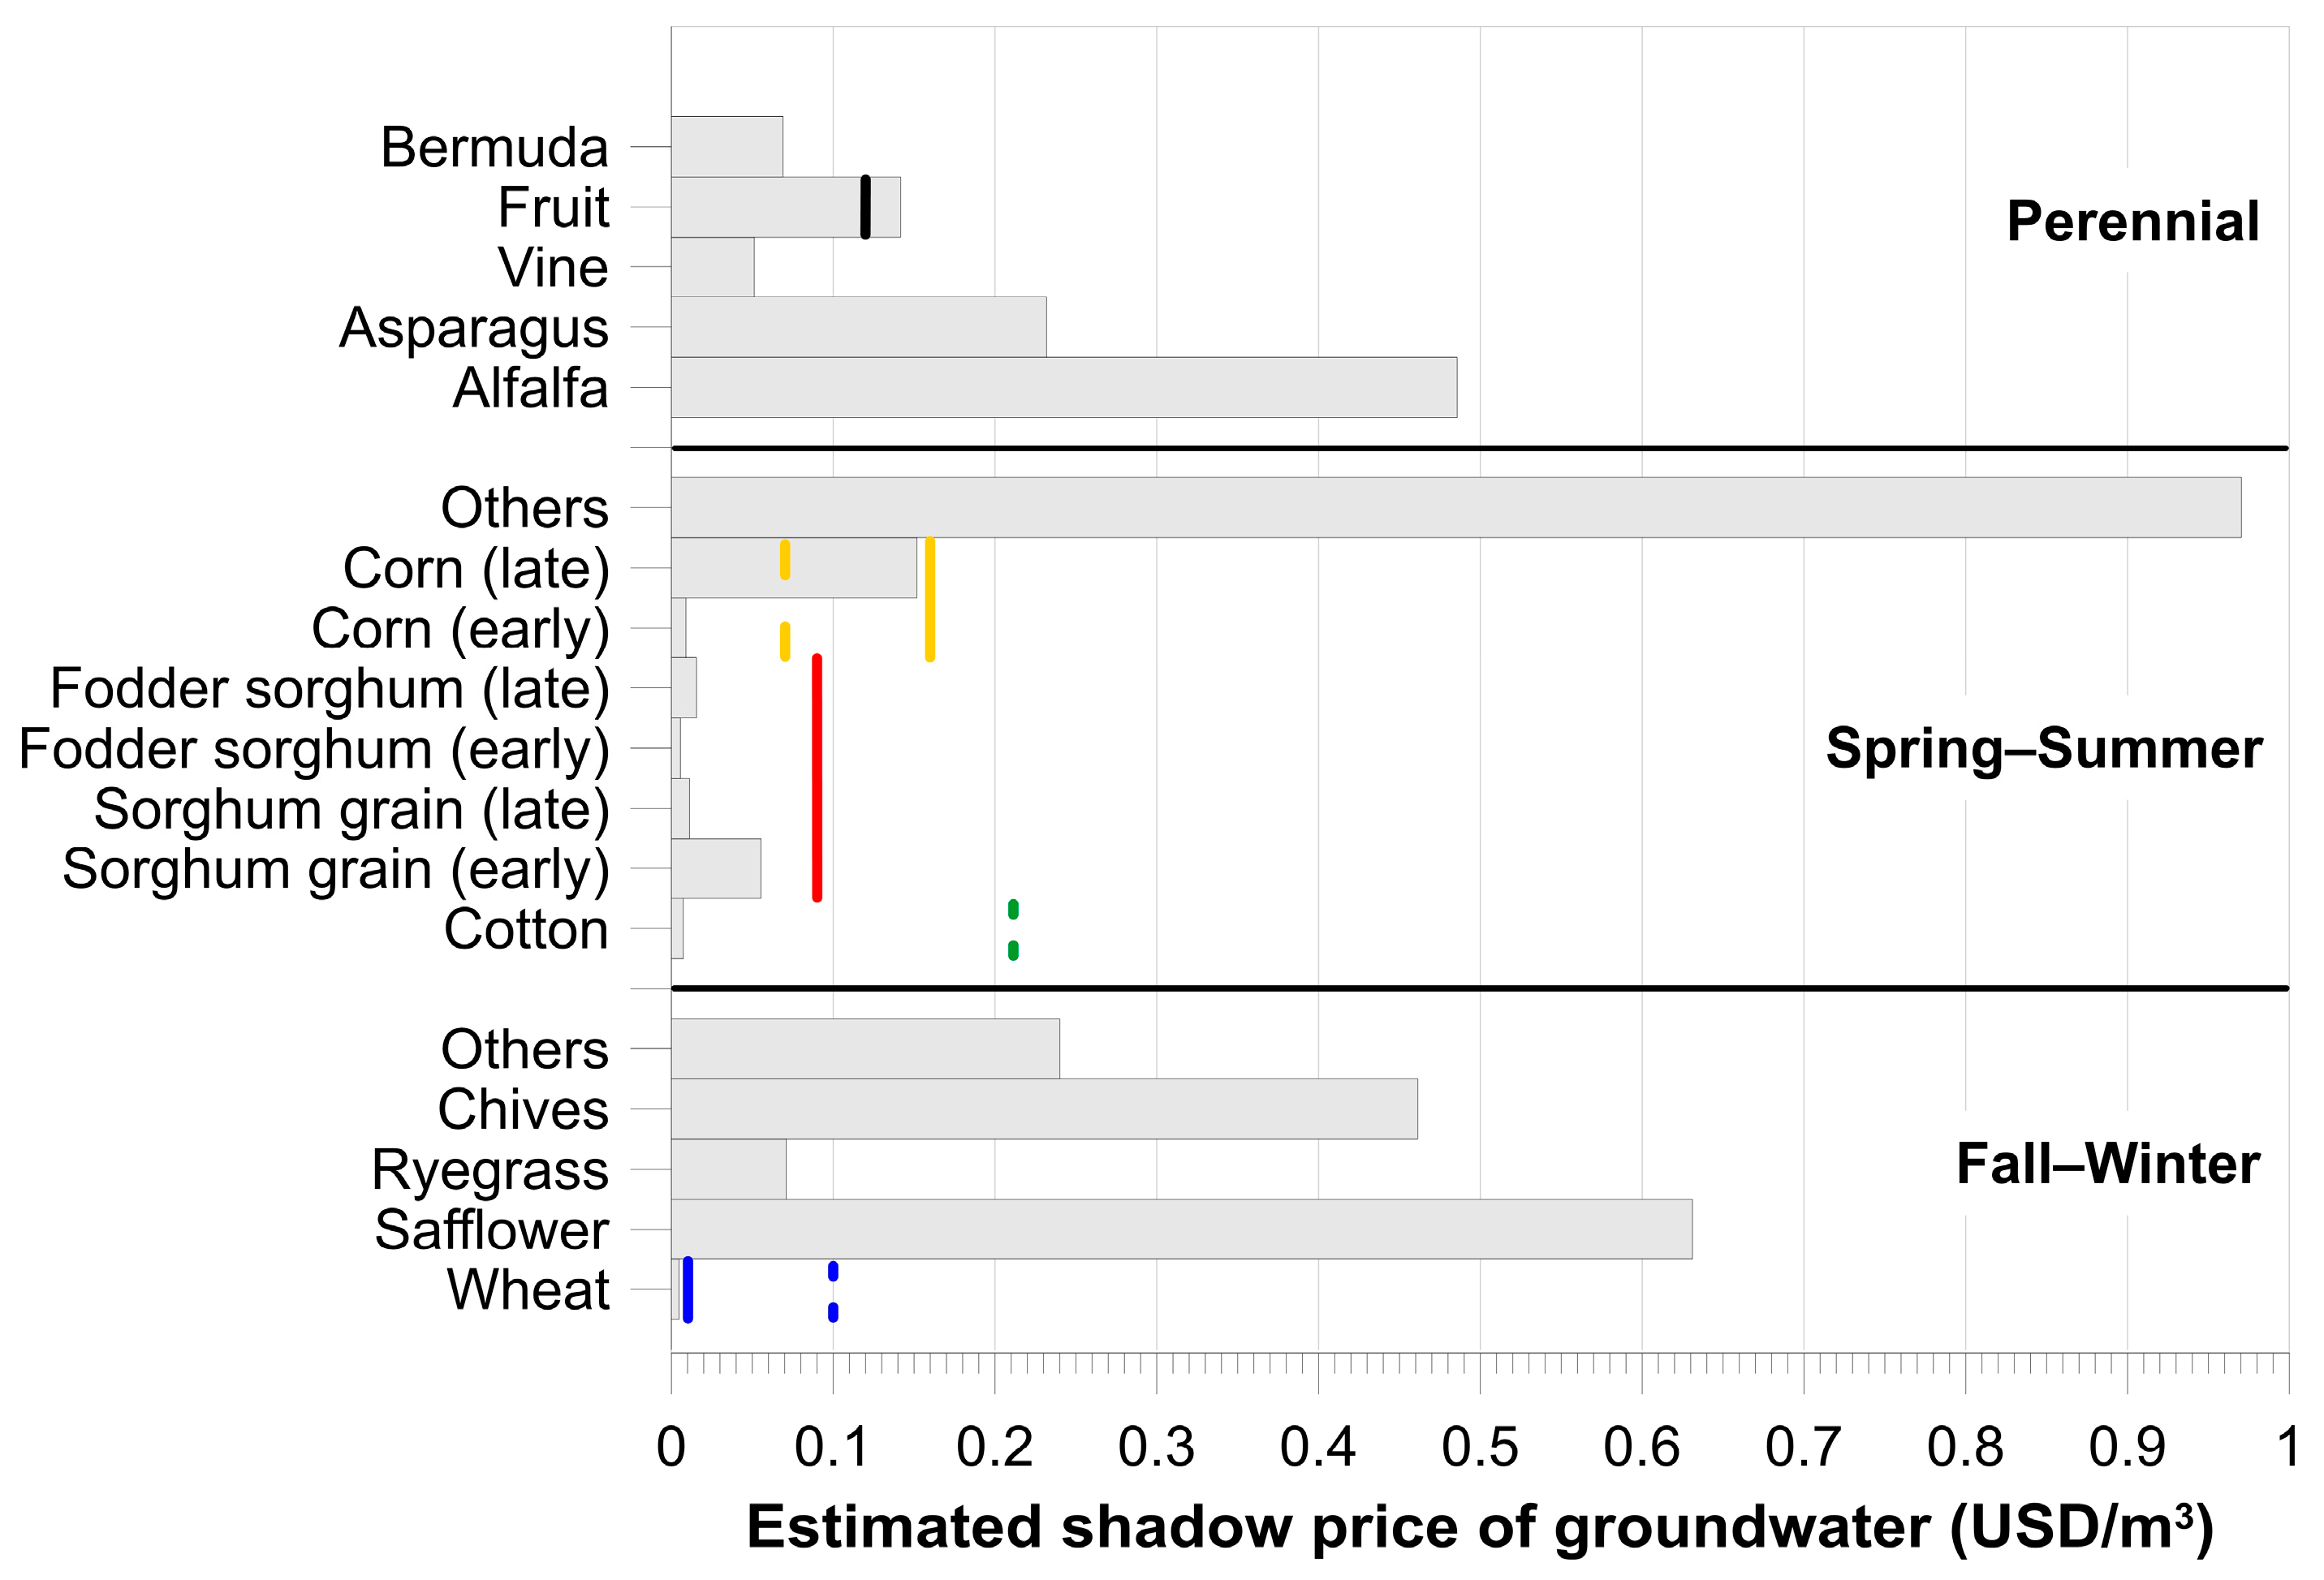
Figure 8 shows the shadow price of groundwater applied to grow the main crops cultivated in the study area for the 2013–2014 agricultural annual cycle, which is between USD/m3 0.005 and 0.97. These values are according to estimated reported values of water dedicated to irrigated agriculture from USD/m3 0.012 to 0.65 in Africa, USD/m3 0.017 to 2.01 in Asia, in Europe, USD/m3 0.12 to 0.17, and 0.01 to 0.25 in North America, including Canada, El Salvador, Honduras, Haiti, Mexico, Nicaragua, and the United States [24].
The lowest shadow price estimated of groundwater (Figure 8) was USD/m3 0.005, corresponding to wheat, which covers the largest surface (21,080 ha) in the study area. The shadow price estimated in this article is similar to that reported by Turner [26] for food grains and is slightly lower than the range reported by Bierkens, Reinhard [55] from USD/m3 0.007 to 0.22 for wheat in Mexico. This is in contrast to global estimations with higher wheat shadow prices, which are between USD/m3 0.03 and 0.06 [63]. The lower estimated price for wheat could be attributed to the low mean rural price and low rentability of this crop. This situation is largely sustained by longstanding schemes of direct and indirect subsidies such as guarantee prices, marketing support, and producer incentives, which have contributed to perpetuating patterns of water use that are inefficient from both economic and water conservation perspectives. The highest shadow prices of groundwater, up to USD/m3 0.97 (Figure 8), are for dates and vegetable production in the spring–summer season.
The shadow price of groundwater for irrigating corn was estimated at USD/m3 0.01 to 0.15 (Figure 8) in the study area, close to the USD/m3 0.16 reported as the mean global estimation by D’Odorico, Chiarelli [63], and to the USD/m3 0.14 by Williams, Al-Hmoud [64] for the Ogallala aquifer region. Concerning sorghum grain, the estimated shadow prices were USD/m3 0.06 and USD/m3 0.01 for early and late grains. The reported mean global estimations are slightly higher at USD/m3 0.09 [63].
Fodder sorghum crops demand the largest amount of groundwater volume per unit of irrigated area, with an estimated 32,200 m3/ha. This value not only accounts for the crop’s water requirements but also accounts for water losses during conveyance and field application, irrigation efficiency, and the additional water applied for washing salts from the soil, a common practice in semi-arid regions. These factors significantly increase the gross irrigation requirement beyond reference evapotranspiration. The estimated groundwater shadow price for fodder sorghum was USD/m3 0.01 (Figure 8). A similar price was found in corn and cotton, which use a large groundwater volume (18,740 and 17,182 m3/ha, respectively), and the groundwater shadow price is lower, at USD/m3 0.01 for both crops. Asparagus is the second crop with the highest water needs, using 21,800 m3/ha, but its shadow price was USD/m3 0.23, higher than fodder sorghum and cotton. On the other hand, safflowers use a small volume of groundwater per unit area (4833 m3/ha) compared to the other crops cultivated in the study area; the water shadow price was estimated at USD/m3 0.63.
In the case of the fruits, the shadow price was USD/m3 0.14 (Figure 8), slightly lower than the USD/m3 0.12 and 0.11 reported for apples and pears in the USA, respectively [65].
Figure 8. Shadow price of groundwater for the main crops of DR014. Bars show the values estimated in this article, per irrigation season and crop type. Lines indicate reference values of shadow prices estimated in Bierkens, Reinhard [55] (blue continuous line), Williams, Al-Hmoud [64] (blue and green dotted lines), D’Odorico, Chiarelli [63] (red and yellow continuous lines), and Frederick, VandenBerg [65] (black continuous line and yellow dotted line).
Water 17 02221 g008
The context of water scarcity in the Colorado River Basin has been intensified, as evidenced by the water conservation programs implemented (Minutes 319, 323, and 330) between Mexico and the United States. These provisions, linked to the Water Treaty, have resulted in reduced volumes allocated to Mexico during years of drought conditions, increasing pressure on groundwater use in the Mexicali Valley. The estimated shadow values for different crops represent a valuable tool to inform public policy decisions. For example, crops such as dates show a higher economic value of groundwater (USD/m3 0.97). In contrast, crops like wheat, fodder sorghum, corn, and cotton, all widely cultivated in the DR014, exhibit low shadow values (USD/m3 0.01) and have high water requirements.
These findings reinforce the need to reconsider agricultural support schemes and transition toward models that reward water use efficiency and recognize the ecosystem value of groundwater. Incorporating the shadow value of groundwater into management instruments can support the design of differentiated pricing, targeted subsidy schemes, and payment for ecosystem services programs aimed at conserving the resource and encouraging its strategic use. Moreover, it can serve as a key input for prioritizing crops with lower water footprints and higher added value, in line with regional goals for climate resilience and sustainability.

3.1.2. Groundwater for Industrial Use

The reference price of groundwater used for industrial purposes was USD 2.01 per m3, according to the prices established in the study area by CESPM, the affordable price was USD/m3 2.72, and the elasticity was −0.38 according to previous estimations [66]. The total estimated value of the 627,598 m3 of groundwater used by the industry located in the study area was USD 419,034 annually. The ice and water purification industry represents 47% of the groundwater value for industrial use.
The shadow price of groundwater for industrial use estimated in this article for 2020 was USD/m3 0.67, meaning the added value provided by each m3 used in the industry. Previous studies reported a wide range of the shadow values of groundwater for industrial use, which ranges from USD/m3 2.03 to 20.1 in the Valley of Mexico basin [67], USD/m3 0.01 to 6.94 in Asia, and USD/m3 0.01 to 0.28 in North America, including Mexico [24]. Shadow values for water in Canadian industries are between USD/m3 −0.37 and 1.04 [68].
The shadow price of groundwater estimated in the present document is under USD/m3 0.73 and USD/m3 0.91 reported in the Canadian and Chinese industries, respectively [14]. Lower values were reported in the Indian industry, where the value of industrial water is between USD/m3 0.02 and 0.41 [69]. These differences are attributed to the price of water in these regions and countries.

3.1.3. Groundwater for Urban and Domestic Use

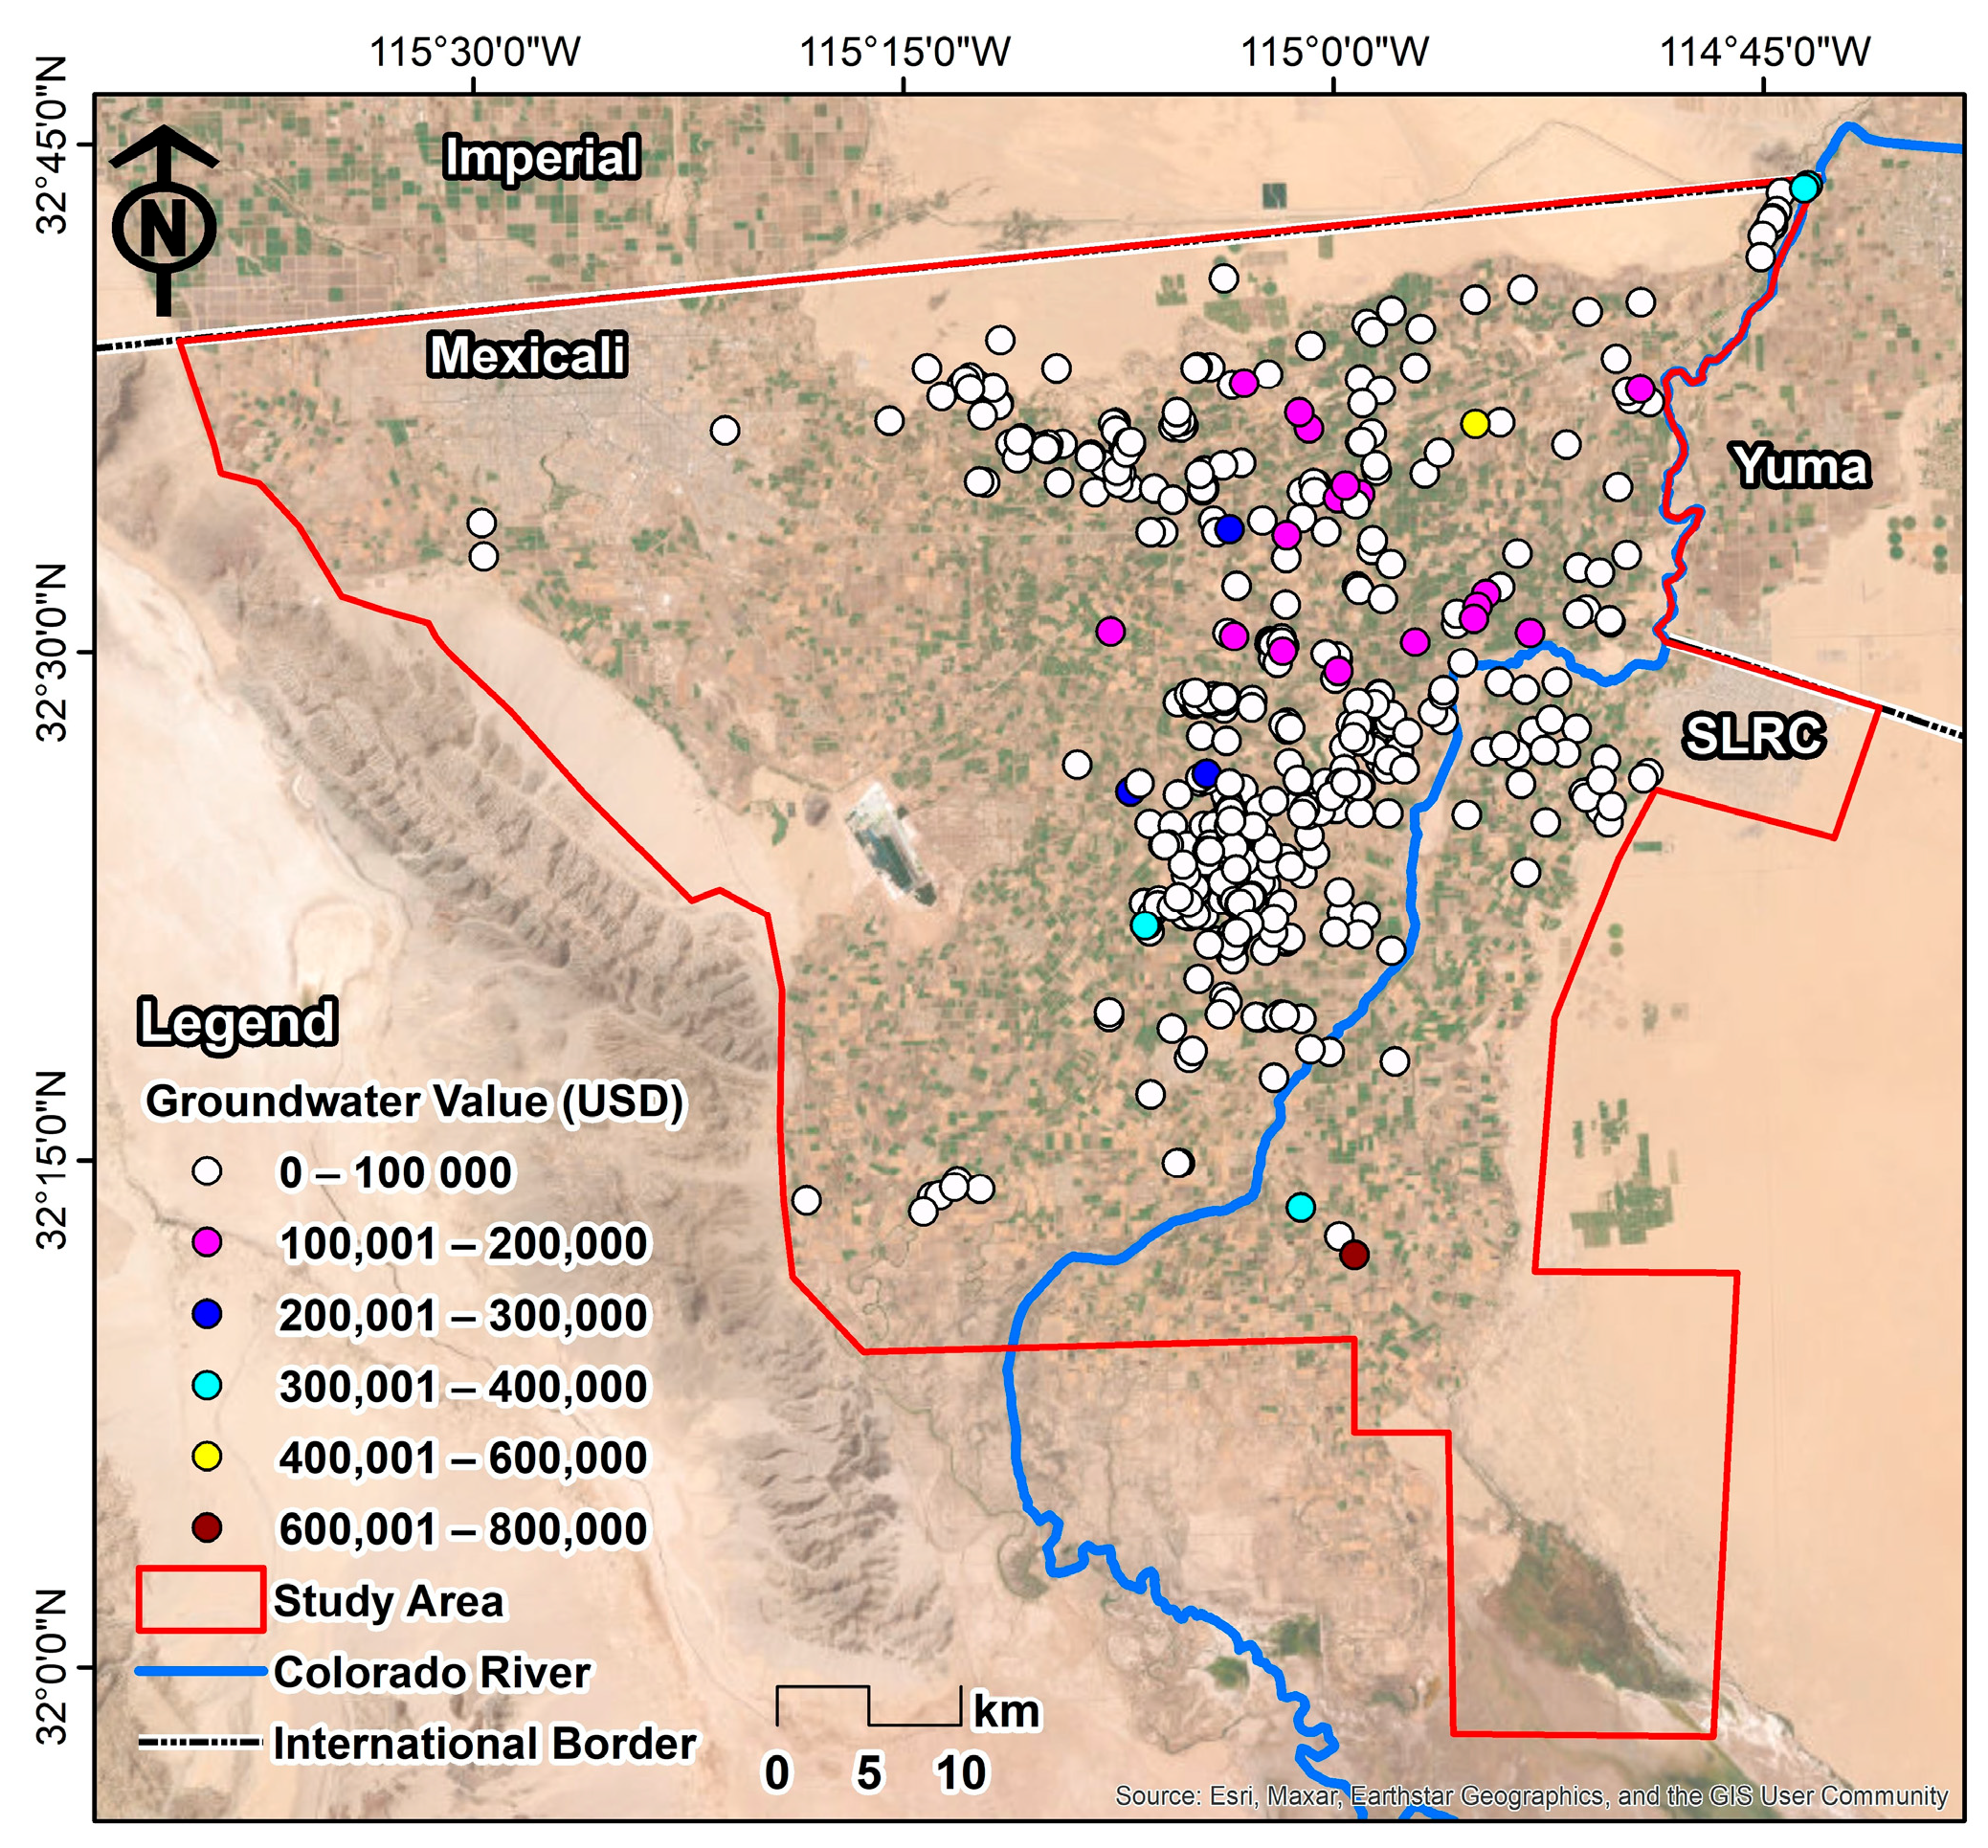
According to the REPDA, the annual volume granted for CESPM and water committees in the study area for urban and domestic uses is 9.6 million m3 per year. Figure 9 shows the wells registered in the REPDA, which extract groundwater for urban and domestic uses, indicating the estimated water value. The shadow price of groundwater for urban and domestic uses was estimated considering the price of water of USD/m3 0.53, the affordable price used was USD/m3 2.10, and the elasticity of −0.378 was estimated by CONAGUA [66].
The value of groundwater for urban and domestic use estimated in the present study is comparable to the range reported by Aylward, Seely [24] from USD/m3 0.25 to 1.84 for domestic use in North America, including Mexico. Therefore, the estimated value in this study is above the global estimation average value of USD/m3 0.58 [24] and the value estimated for China of USD/m3 0.83 [14].
Some authors have reported values for domestic uses, not considering other urban uses, from USD/m3 0.008 to 2.88 in Africa, from USD/m3 0.04 to 1.22 in Asia, USD/m3 0.52 to 0.86 in Europe, from 0.25 to 1.84 in North America, and USD/m3 0.41 to 1.01 in South America. Although our value estimations for urban and domestic uses are within all these ranges, a direct comparison is improper.
As expected, values estimated for “basic human needs” and for household uses, as municipal uses, are much higher than those for discretionary uses, such as water for irrigation or industry. An important finding is that people, even poor people in developing countries, value a reliable supply much more than intermittent, unpredictable supplies, which are the norm in developing countries [19].

3.2. Regulating Ecosystem Services

3.2.1. Water Conservation

The estimated groundwater storage in the study area has been estimated at 98,160 million m3, considering the first 100 m as a homogeneous and saturated layer, given that most of the wells extract groundwater at this depth, and using a specific yield of 0.20 according to previous investigations [60]. As a replacement project, the storage cost of 1 m3 of capacity is USD/m3 9; this cost accounts for the unit price of excavating moderately compacted soil, characteristic of the study area, and includes the transportation of the excavated material to an alternate location. In total, the estimated value of the water conservation in the study area is USD 883,440 million; in Handan City, China, it was USD 566 million for water conservation of 872 million m3 [14]. The difference is attributed to the cost of the reservoir (USD 9 vs. 0.59).

3.2.2. Water Purification

The total volume treated in the six WWTPs in the study area (Table 5) was 71.90 million m3 during 2020. The leakage estimate was 7.19 million m3 per year, considering a 90% efficiency of pipeline drainage. According to the CESPM [61] data, the price of wastewater treatment varies from USD/m3 0.01 to 0.07. The price of water purification as HESs in the study area was calculated for each WWTP (Table 5). The total value of this ecosystem service is USD/yr 111,100, which could be considered as the avoided cost of CESPM, since the water is not treated in its facilities due to losses occurring during conduction to the treatment plants. Instead, it is assumed that the aquifer performs the purification function.

3.3. Cultural Ecosystem Services

Recreation

Mexicali and its valley have 249,165 inhabited houses, while SLRC has 50,223. Considering each house as a family that visits one of the recreational sites almost once per year, and the WTP is USD 10 (mean value reported by Kerna, Colby [37]), the value of the groundwater as recreation HESs was USD 2,993,880 annually. This means the value of the groundwater was USD/house/yr 8.5, a figure consistent with the values reported in the literature (USD/house/yr 0.96 to 6102.69), for cultural services provided by drylands [70], such as the study area.
The total value of the hydrological ecosystem services provided by groundwater in the study area is USD 883,520.59 million annually. A summary of the annual value estimations carried out in this study is shown in Table 6.

4. Conclusions

Groundwater in the study area provides essential hydrological ecosystem services such as the following: (1) provisioning water for agricultural irrigation, industrial production, and urban and domestic uses; (2) water conservation and purification regulating services; and (3) cultural ecosystem services such as recreation. The total annual HES value estimated for groundwater of the study area was USD 883,520.59 million.
The perennial agricultural season has crops with the highest shadow groundwater value per surface area (USD/m3 5349). Wheat is the crop that has the major surface area in DR014 and has the lowest value of groundwater (USD/m3 0.005), and the higher value corresponds to other crops like dates and vegetables. Most estimated values per crop in this article are within the range reported in the literature.
The value of groundwater for urban and domestic uses was estimated at USD/m3 1.16, which can be attributed to the price of water for urban areas versus the agricultural uses determined by the operator agencies such as CESPM and OOMAPAS. This is interesting, considering that water is a human right and is an essential element for all forms of life, and that in the Mexican Water Law, people are the first users in the priority list. Considering a replacement project approach, water conservation is the HES provided by the study area with the highest value.
The limitations of this study stem from the availability and consistency of the data used, particularly those related to agricultural irrigation, which constrained the temporal comparability of groundwater-related values. The three types of HESs were estimated to use the most comprehensive and reliable datasets available; however, due to data scarcity, these datasets correspond to different time periods. This limitation restricts the ability to analyze fluctuations within a unified temporal framework. Moreover, the lack of comparable studies conducted in semi-arid regions limits the potential for comparison and hinders a broader contextualization of the results. This highlights the need for further research focused on semi-arid regions to enhance the generalizability and robustness of such analyses. Additional studies are also required to expand the scope of valuation, including the use of updated methodologies such as remote sensing technologies, estimates of groundwater value by industry type, the intergenerational values, assessments of user perceptions, willingness to pay, and surveys aimed at evaluating the cultural ecosystem services currently provided in the study area. The valuation realized in the present article contributes to improving a basis for science-based decision-making as an input in land use planning, as a first approach for the payment of ecosystem services, as well as for establishing measures for the protection, restoration, and management of ecosystems or fee charges in case of their damage.
The economic valuation of groundwater’s ecosystem services in the study area presented in this article provides actionable insights for water governance, informing policy instruments such as crop substitution programs, incentive schemes for high-efficiency irrigation, and differentiated tariffs aligned with ecosystem service values. This can be a standard metric for decision-makers and stakeholders in water management to improve water sustainability, as this resource is scarce. Based on our findings, one of the key recommendations is to prioritize groundwater use for crops with higher economic value and lower water demand, such as switching wheat for dates, since these need less water and have more groundwater value. The change in cultivated crops in the study area implies that the decision-makers and stakeholders collaborate to choose the crop types based on the crop’s requirements, the availability and quality of the water, and the investment and the governmental projects to promote these paradigm shifts.
Furthermore, our findings can support integrating ecosystem service valuation into land-use planning, the incorporation of the value of groundwater into the water-use conservation plans designed for drought and scarcity conditions, and payment for ecosystem service schemes, strengthening conservation and equitable allocation strategies.
Although limitations exist, especially on data consistency across time periods, this analysis lays a foundation for evidence-based groundwater governance in semi-arid regions. Future work should include improved temporal datasets, user perception surveys, industry-specific valuation, and remote sensing tools to refine and expand these studies and their policy applications.

Author Contributions

Conceptualization, F.C. and J.E.R.-B.; formal analysis, F.C.; funding acquisition, J.E.R.-B.; investigation, F.C., J.E.R.-B. and J.R.-H.; methodology, F.C., J.E.R.-B. and C.C.-D.; writing—original draft, F.C., J.E.R.-B. and C.C.-D.; writing—review and editing, F.C., J.E.R.-B., C.C.-D. and J.R.-H. All authors have read and agreed to the published version of the manuscript.

Funding

This research was funded by CONACYT, grant number 763422, the Babbitt Dissertation Fellowship from the Lincoln Institute of Land Policy, and the Universidad Autónoma de Baja California.

Data Availability Statement

The original contributions presented in this study are included in the article. Further inquiries can be directed to the corresponding author.

Acknowledgments

During the preparation of this manuscript, the authors used ChatGPT 4o for the purposes of language improvement. The authors have reviewed and edited the output and take full responsibility for the content of this publication.

Conflicts of Interest

The authors declare no conflicts of interest.

Abbreviations

The following abbreviations are used in this manuscript:
HESshydrological ecosystem services
ESsecosystem services
CRColorado River
CRDColorado River Delta
DR014Colorado River 014 Irrigation District
SWsurface water
GWgroundwater
NGOsnon-governmental organizations
MVAMexicali Valley aquifer
SLRCASan Luis Río Colorado aquifer
CESPMState Water Commission of Public Services of Mexicali
OOMAPASSan Luis Río Colorado Drinking Water, Sewerage, and Sanitation Operator Agency
REPDAPublic Registry of Water Rights

References

  1. Burrell, A.L.; Evans, J.P.; De Kauwe, M.G. Anthropogenic climate change has driven over 5 million km2 of drylands towards desertification. Nat. Commun. 2020, 11, 3853. [Google Scholar] [CrossRef] [PubMed]
  2. Millennium Ecosystem Assessment. Ecosystems and Human Well-Being: Synthesis; Island Press: Washington, DC, USA, 2005. [Google Scholar]
  3. Huang, F.; Zhang, Y.; Zhang, D.; Chen, X. Environmental Groundwater Depth for Groundwater-Dependent Terrestrial Ecosystems in Arid/Semiarid Regions: A Review. Int. J. Environ. Res. Public Health 2019, 16, 763. [Google Scholar] [CrossRef] [PubMed]
  4. Chapin, F.S.; Matson, P.A.; Vitousek, P.M. The Ecosystem Concept. In Principles of Terrestrial Ecosystem Ecology; Springer: New York, NY, USA, 2011; pp. 3–22. [Google Scholar]
  5. Young, R.A.; Loomis, J.B. Determining the Economic Value of Water: Concepts and Methods; Routledge: New York, NY, USA, 2014. [Google Scholar]
  6. Postel, S.; Carpenter, S. Freshwater ecosystem services. In Nature’s Services: Societal Dependence on Natural Ecosystems; Island Press: Washington, DC, USA, 1997; Volume 195. [Google Scholar]
  7. Brauman, K.A.; Daily, G.C.; Duarte, T.K.E.; Mooney, H.A. The Nature and Value of Ecosystem Services: An Overview Highlighting Hydrologic Services. Annu. Rev. Environ. Resour. 2007, 32, 67–98. [Google Scholar] [CrossRef]
  8. Bergkamp, G.; Cross, K. Groundwater and ecosystem services: Towards their sustainable use. In Proceedings of the International Symposium on Groundwater Sustainability, Alicante, Spain, 24–27 January 2006; InterAcademy Panel: Trieste, Italy, 2006; pp. 177–193. [Google Scholar]
  9. Hérivaux, C.; Grémont, M. Valuing a diversity of ecosystem services: The way forward to protect strategic groundwater resources for the future? Ecosyst. Serv. 2019, 35, 184–193. [Google Scholar] [CrossRef]
  10. Herman, J.S.; Culver, D.C.; Salzman, J. Groundwater ecosystems and the service of water purification. Stan. Envtl. LJ 2001, 20, 479. [Google Scholar]
  11. CGIAR Research Program on Water, Land and Ecosystems (WLE). Groundwater and Ecosystem Services: A framework for Managing Smallholder Groundwater-Dependent Agrarian Socio-Ecologies—Applying an Ecosystem Services and Resilience Approach; International Water Management Institute (IWMI): Colombo, Sri Lanka, 2015; p. 25. [Google Scholar] [CrossRef]
  12. Griebler, C.; Avramov, M. Groundwater ecosystem services: A review. Freshw. Sci. 2015, 34, 355–367. [Google Scholar] [CrossRef]
  13. Griebler, C.; Avramov, M.; Hose, G. Groundwater Ecosystems and Their Services: Current Status and Potential Risks. In Atlas of Ecosystem Services: Drivers, Risks, and Societal Responses; Schröter, M., Bonn, A., Klotz, S., Seppelt, R., Baessler, C., Eds.; Springer International Publishing: Cham, Switzerland, 2019; pp. 197–203. [Google Scholar]
  14. Yang, X.; Liu, J. Assessment and Valuation of Groundwater Ecosystem Services: A Case Study of Handan City, China. Water 2020, 12, 1455. [Google Scholar] [CrossRef]
  15. Favretto, N.; Stringer, L.C.; Dougill, A.J.; Dallimer, M.; Perkins, J.S.; Reed, M.S.; Atlhopheng, J.R.; Mulale, K. Multi-Criteria Decision Analysis to identify dryland ecosystem service trade-offs under different rangeland land uses. Ecosyst. Serv. 2016, 17, 142–151. [Google Scholar] [CrossRef]
  16. Dodds, W.K.; Perkin, J.S.; Gerken, J.E. Human Impact on Freshwater Ecosystem Services: A Global Perspective. Environ. Sci. Technol. 2013, 47, 9061–9068. [Google Scholar] [CrossRef] [PubMed]
  17. Lin, J.; Huang, J.; Prell, C.; Bryan, B.A. Changes in supply and demand mediate the effects of land-use change on freshwater ecosystem services flows. Sci. Total Environ. 2021, 763, 143012. [Google Scholar] [CrossRef] [PubMed]
  18. ICWE (International Conference on Water and the Environment). The Dublin Statement on Water and Sustainable Development. In Proceedings of the International Conference on Water and the Environment, Dublin, Ireland, 26–31 January 1992; p. 70. [Google Scholar]
  19. Briscoe, J. Water as an economic good: The idea and what it means in practice. In Proceedings of the 16th International Congress on Irrigation and Drainage, Cairo, Egypt, 15–22 September 1996. [Google Scholar]
  20. UNESCO. The United Nations World Water Development Report 2021 Valuing Water; UNESCO: Paris, France, 2021; p. 206. [Google Scholar]
  21. Rogers, P.; Silva, R.d.; Bhatia, R. Water is an economic good: How to use prices to promote equity, efficiency, and sustainability. Water Policy 2002, 4, 1–17. [Google Scholar] [CrossRef]
  22. Garrick, D.E.; Hall, J.W.; Dobson, A.; Damania, R.; Grafton, R.Q.; Hope, R.; Hepburn, C.; Bark, R.; Boltz, F.; De Stefano, L.; et al. Valuing water for sustainable development. Science 2017, 358, 1003–1005. [Google Scholar] [CrossRef] [PubMed]
  23. de Groot, R.; Brander, L.; van der Ploeg, S.; Costanza, R.; Bernard, F.; Braat, L.; Christie, M.; Crossman, N.; Ghermandi, A.; Hein, L.; et al. Global estimates of the value of ecosystems and their services in monetary units. Ecosyst. Serv. 2012, 1, 50–61. [Google Scholar] [CrossRef]
  24. Aylward, B.; Seely, H.; Hartwell, R.; Dengel, J. The Economic Value of Water for Agricultural, Domestic and Industrial Uses: A Global Compilation of Economic Studies and Market Prices; UN FAO: Bend, OR, USA, 2010; p. 46. [Google Scholar]
  25. Emerton, L.; Bos, E. Value. Counting Ecosystems as an Economic Part of Water; IUCN: Gland, Switzerland; Cambridge, UK, 2004; p. 88. [Google Scholar]
  26. Turner, R.K. Economic Valuation of Water Resources in Agriculture: From the Sectoral to a Functional Perspective of Natural Resource Management; Food & Agriculture organization: Rome, Italy, 2004; Volume 27. [Google Scholar]
  27. Dolan, F.; Lamontagne, J.; Link, R.; Hejazi, M.; Reed, P.; Edmonds, J. Evaluating the economic impact of water scarcity in a changing world. Nat. Commun. 2021, 12, 1915. [Google Scholar] [CrossRef] [PubMed]
  28. USBR (US Deparment of the Interior, Bureau of Reclamation). Colorado River Basin Water Supply and Demand Study Executive Summary; U.S. Deparment of the Interior, Bureau of Reclamation: Washington, DC, USA, 2012; p. 34.
  29. Best, A. Hydraulic Empire Sharing a Legacy, Carving a Future for the Colorado River. Land Lines, 14 December 2018; 6. [Google Scholar]
  30. DeLuca, W.V.; Meehan, T.; Seavy, N.; Jones, A.; Pitt, J.; Deppe, J.L.; Wilsey, C.B. The Colorado River Delta and California’s Central Valley are critical regions for many migrating North American landbirds. Condor Ornithol. Appl. 2021, 123, duaa064. [Google Scholar] [CrossRef]
  31. Rivera-Torres, M.; Gerlak, A.K. Evolving together: Transboundary water governance in the Colorado River Basin. Int. Environ. Agreem. Politics Law Econ. 2021, 21, 553–574. [Google Scholar] [CrossRef] [PubMed]
  32. López-Hoffman, L.; Varady, R.G.; Flessa, K.W.; Balvanera, P. Ecosystem services across borders: A framework for transboundary conservation policy. Front. Ecol. Environ. 2010, 8, 84–91. [Google Scholar] [CrossRef]
  33. Kaval, P. Ecosystem Service Valuation of the Colorado River Basin: A Literature Review and Assessment of the Total Economic Value of the Colorado River Basin; The Nature Conservancy: Washington, DC, USA, 2011. [Google Scholar]
  34. Flessa, K.W. Ecosystem services and the value of water in the Colorado River delta and Estuary, USA and Mexico: Guidelines for mitigation and restoration. In Proceedings of the International Seminar on Restoration of Damaged Lagoon Environments, Matsue, Japan, 10–11 January 2004. [Google Scholar]
  35. Sanjurjo, R.E.; Islas, C.I. Valoración económica de la actividad recreativa en el río Colorado. Región Y Soc. 2007, 9, 26. [Google Scholar] [CrossRef]
  36. Bark, R.H.; Robinson, C.J.; Flessa, K.W. Tracking cultural ecosystem services: Water chasing the Colorado River restoration pulse flow. Ecol. Econ. 2016, 127, 165–172. [Google Scholar] [CrossRef]
  37. Kerna, A.; Colby, B.; Zamora, F. Cultural and Recreational Values for Environmental Flows in Mexico’s Colorado River Delta. Water Econ. Policy 2017, 03, 1650035. [Google Scholar] [CrossRef]
  38. Lomelí, M.A. Ecohidrología de la Ciénega de Santa Clara: Adaptación al Cambio Climático y su Valor Ecosistémico. Ph.D. Thesis, Universidad Autónoma de Baja California, Mexicali, Mexico, 2016. [Google Scholar]
  39. Cital, F.; Ramírez-Hernández, J.; García-Hernández, J.; García-Leyva, G.; Rodríguez-Burgueño, J.E.; Ramírez-Barreto, M.E. Ecosystem services (ES) provided by ditches in a desert agricultural valley. Ecol. Eng. 2022, 174, 106462. [Google Scholar] [CrossRef]
  40. Famiglietti, J.S. The global groundwater crisis. Nat. Clim. Chang. 2014, 4, 945–948. [Google Scholar] [CrossRef]
  41. Ramírez-Hernández, J. Las aguas subterráneas transfronterizas del delta del río Colorado, un reto para la cooperación. In Visiones Contemporáneas de la Cooperación y la Gestión Del Agua en la Frontera México-Estados Unidos; Castro Ruiz, J.L., Cortez Lara, A., Sánchez Munguía, V., Eds.; El Colegio de la Frontera Norte: Tijuana, Mexico, 2021; pp. 177–211. [Google Scholar]
  42. CDWR. References Evapotranspiration Zones; California Department of Water Resources: Sacramento, CA, USA, 2012; p. 4. [Google Scholar]
  43. INEGI. Censo de Población y Vivienda 2020; Geografía, I.N.D.E.Y., Ed.; INEGI: Aguascalientes, Mexico, 2020. [Google Scholar]
  44. Ramírez-Hernández, J.; Hinojosa-Huerta, O.; Peregrina-Llanes, M.; Calvo-Fonseca, A.; Carrera-Villa, E. Groundwater responses to controlled water releases in the limitrophe region of the Colorado River: Implications for management and restoration. Ecol. Eng. 2013, 59, 93–103. [Google Scholar] [CrossRef]
  45. Elders, W.A.; Rex, R.W.; Robinson, P.T.; Biehler, S.; Meidav, T. Crustal Spreading in Southern California. Science 1972, 178, 15–24. [Google Scholar] [CrossRef] [PubMed]
  46. Ariel. Estudio Hidrogeológico Completo de Los Acuíferos del Valle de Mexicali, B.C. y Mesa de San Luis, Son; Comisión Nacional del Agua: Mexico City, Mexico, 1968; p. 138. [Google Scholar]
  47. Siem, M.E. The Structure and Petrology of Sierra El Mayor, Northeastern Baja California, Mexico. Master’s Thesis, San Diego State University, San Diego, CA, USA, 1992. [Google Scholar]
  48. Pacheco, M.; Martín-Barajas, A.; Elders, W.; Espinosa-Cardeña, J.M.; Helenes, J.; Segura, A. Stratigraphy and structure of the Altar basin of NW Sonora: Implications for the history of the Colorado River delta and the Salton trough. Rev. Mex. Cienc. Geológicas 2018, 23, 1–22. [Google Scholar]
  49. Makdisi, R.; Truesdell, A.; Thompson, J.; Coplen, T.; Sanchez, J. Chemical evolution of Mexicali Valley groundwater. In Proceedings of the 4th Symposium on the Cerro Prieto Geothermal Field, Guadalajara, Jalisco, Mexico, 10–12 August 1982. [Google Scholar]
  50. Payne, B.R.; Quijano, L.; Carlos Latorre, D. Environmental isotopes in a study of the origin of salinity of groundwater in the Mexicali Valley. J. Hydrol. 1979, 41, 201–215. [Google Scholar] [CrossRef]
  51. REPDA. Registro Público de Derechos de Agua. Acuíferos Valle de Mexicali y Valle de San Luis Río Colorado, Sonora; Agua, C.N.D., Ed.; Registro Público de Derechos de Agua: Mexico City, Mexico, 2021. [Google Scholar]
  52. CONAGUA. Estadísticas Agrícolas de Los Distritos de Riego, Año Agrícola 2017–2018; Agua, C.N.D., Ed.; CONAGUA: Mexico City, Mexico, 2019. [Google Scholar]
  53. SEDAGRO. Programa de Georreferenciación de Cultivos. Informe de Resultados del Recorrido de Campo del Valle de Mexicali, 2018; Secretaría de Desarrollo Agropecuario: Mexicali, Mexico, 2018. [Google Scholar]
  54. Baxter, W.T. Depreciation; Sweet & Maxwell: London, England, 1971; p. 182. [Google Scholar]
  55. Bierkens, M.F.P.; Reinhard, S.; de Bruijn, J.A.; Veninga, W.; Wada, Y. The Shadow Price of Irrigation Water in Major Groundwater-Depleting Countries. Water Resour. Res. 2019, 55, 4266–4287. [Google Scholar] [CrossRef]
  56. Guzmán, R.S.; Valenzuela, S.P.; Féliz, V.P.; Jimenéz, T.A.; Ruiz, C.S. Necesidades Hídricas de Los Principales Cultivos en Baja California; INIFAP, Ed.; INIFAP: Mexicali, Mexico, 2009. [Google Scholar]
  57. Espey, M.; Espey, J.; Shaw, W.D. Price elasticity of residential demand for water: A meta-analysis. Water Resour. Res. 1997, 33, 1369–1374. [Google Scholar] [CrossRef]
  58. Garrone, P.; Grilli, L.; Marzano, R. Price elasticity of water demand considering scarcity and attitudes. Util. Policy 2019, 59, 100927. [Google Scholar] [CrossRef]
  59. Pearce, D.W.; Pretty, J.N. Economic Values and the Natural World; Earthscan: London, UK, 1993. [Google Scholar]
  60. Rodríguez-Burgueño, J.E. Modelación Geohidrológica Transitoria de la Relación Acuífero-Río de la Zona FFCC-Vado Carranza Del Río Colorado Con Propósito de Manejo de la Zona Riparia. Master’s Thesis, Universidad Autónoma de Baja California, Mexicali, Mexico, 2012. [Google Scholar]
  61. CESPM. Indicadores Sistema de la Ciudad de Mexicali. Comparativo General; Comisión Estatal de Servicios Públicos de Mexicali: Mexicali, Mexico, 2021. [Google Scholar]
  62. Pitt, J.; Kendy, E. Shaping the 2014 Colorado River Delta pulse flow: Rapid environmental flow design for ecological outcomes and scientific learning. Ecol. Eng. 2017, 106, 704–714. [Google Scholar] [CrossRef]
  63. D’Odorico, P.; Chiarelli, D.D.; Rosa, L.; Bini, A.; Zilberman, D.; Rulli, M.C. The global value of water in agriculture. Proc. Natl. Acad. Sci. USA 2020, 117, 21985–21993. [Google Scholar] [CrossRef] [PubMed]
  64. Williams, R.B.; Al-Hmoud, R.; Segarra, E.; Mitchell, D. An estimate of the shadow price of water in the southern Ogallala Aquifer. J. Water Resour. Prot. 2017, 9, 289–304. [Google Scholar] [CrossRef]
  65. Frederick, D.K.; VandenBerg, T.; Hanson, J. Economic Values of Freshwater in the United States; Resources for the Future; AgEcon Search: Washington, DC, USA, 1996; p. 36. [Google Scholar]
  66. CONAGUA. Estudio de Determinación de la Demanda en Ensenada, Mexicali y Tijuana; Comisión Nacional del Agua: Mexico City, Mexico, 1999. [Google Scholar]
  67. Revollo-Fernández, D.A.; Rodríguez-Tapia, L.; Morales-Novelo, J.A. Economic value of water in the manufacturing industry located in the Valley of Mexico Basin, Mexico. Water Resour. Econ. 2020, 30, 100138. [Google Scholar] [CrossRef]
  68. Dachraoui, K.; Harchaoui, M.T. Water Use, Shadow Prices and the Canadian Business Sector Productivity Performance; Statistics Canada, Micro-Economic Analysis Division, Eds.; Statistics Canada: Ottawa, ON, Canada, 2004; p. 28. [Google Scholar]
  69. Kumar, S.; Managi, S. Industrial Water Demand and Shadow Price. In The Economics of Sustainable Development: The Case of India; Managi, S., Kumar, S., Eds.; Springer: New York, NY, USA, 2009; pp. 167–181. [Google Scholar]
  70. Schild, J.E.M.; Vermaat, J.E.; de Groot, R.S.; Quatrini, S.; van Bodegom, P.M. A global meta-analysis on the monetary valuation of dryland ecosystem services: The role of socio-economic, environmental and methodological indicators. Ecosyst. Serv. 2018, 32, 78–89. [Google Scholar] [CrossRef]
Figure 1. Categories associated with the economic values of water. Data from UNESCO [20].
Water 17 02221 g001
Figure 2. Location of study area. Numbers on the map indicate the irrigation module. SW: surface water; GW: groundwater; DR014: Colorado River 014 Irrigation District; CRD: Colorado River Delta.
Water 17 02221 g002
Figure 3. Percentage distribution of groundwater concessions by use type in the study area. Total water concession: MVA= 883.28 hm3/yr; SLRC= 166.71 hm3/yr. Data from REPDA [51].
Water 17 02221 g003
Figure 4. Research framework of HES valuation in the study area.
Water 17 02221 g004
Figure 5. Total water requirement per crop cycle. Data from Guzmán, Valenzuela [56].
Water 17 02221 g005
Figure 6. Recreational sites in the study area.
Water 17 02221 g006
Figure 7. Groundwater’s irrigated area and its estimated value per irrigation module. In the columns are the estimated value for three irrigation seasons (fall–winter, spring–summer, and perennial); the symbols represent the irrigated area for each season.
Water 17 02221 g007
Figure 9. Shadow groundwater value for urban and domestic uses for the well registered in the REPDA.
Water 17 02221 g009
Table 1. Methods to valuate HESs provided by groundwater. Adapted from Turner [26].
Valuation MethodDescriptionDirect Use ValuesIndirect Use ValuesNon-Use ValuesGood or ES
Market analysis and market-based transactions Used where market prices of outputs and inputs are available. Marginal productivity net of human effort/cost. Could also be approximated using the market price of a close substitute. Includes transactions in water rights. May require shadow prices *.xx Provision of water; erosion, flood, and storm protection; improve water and air quality; recreation; scientific purposes; regulation of climate
Residual imputation and variantsBudget analysis used to estimate return attributable to water. Water is treated as one in the production of a good. The total returns are calculated; all non-water expenses are subtracted. Change in net return from marketed goods: a form of (dose-response) market analysis.xx Provision of water; erosion, flood, and storm protection; improve water and air quality; recreation; scientific purposes; regulation of climate
Hedonic price methodDerive an implicit price for an environmental good from analysis of goods for which market exists that incorporate environmental characteristics.xx Provision of water; erosion, flood, and storm protection; improve water and air quality; scientific purposes
Travel cost methodCosts incurred in reaching a recreation site as a proxy for the value of recreation. Expenses differ between sites (or for the same site over time) with different environmental attributes.xxxRecreation; scientific purposes
Contingent valuation method (CVM)Construction of a hypothetical market by direct surveying of a sample of individuals and aggregation to encompass the relevant population. Problems of potential biases.xxxProvision of water; erosion, flood, and storm protection; improve water and air quality; recreation; scientific purposes; regulation of climate
Replacement/costs savingsPotential expenditures incurred in replacing or restoring the function that is lost; for instance, using substitute facilities or “shadows projects”. A total value approach; important ecological, temporal, and cultural dimensions.xxxProvision of water; erosion, flood, and storm protection; improve water and air quality; recreation; scientific purposes; regulation of climate
Notes: * shadow price is considered in this article as the value used in social or public economic analysis when the water market price is unknown or judged not to be an appropriate measure of economic value [5].
Table 2. Classification of HESs provided by groundwater and their indicators. Adapted from Yang and Liu [14].
Service TypesService Indicators
ProvisioningWater supply (domestic, industrial, agricultural, and power generation activities)
RegulatingWater conservation
Air regulation
Water purification
CulturalRecreation
Table 3. Wastewater treatment plants in the study area. Data from CESPM [61].
WWTPCapacity (L/s)Discharge Effluent
Mexicali I1300International drain (New River)
Las Arenitas840Hardy River
Los Algodones20Agricultural drain
Cd. Morelos30Álamo Canal
Km. 4370Agricultural drain
Km. 5720Agricultural drain
Table 4. Value of groundwater provision for agricultural uses per season during the 2013–2014 agricultural annual cycle.
SeasonCultivated
Surface (ha)
Total Market
Value (USD Million)
Value Per
Surface Area (USD/ha)
Fall–Winter24,55711435
Spring–Summer12,610171386
Perennial7099385349
Total44,266661494
Table 5. Value of the HESs of water purification per WWTP.
WWTPValue of Water Purification (USD/yr)
Mexicali I45,096
Las Arenitas37,086
Los Algodones4131
Cd. Morelos6197
Km. 4314,459
Km. 574131
Table 6. Value of the HESs estimated for the study area.
Type of ESHES
Groundwater Uses
Total Annual
Value (USD Million)
ProvisioningAgriculture66
Industry0.42
Urban and domestic11.07
RegulatingConservation883,440
Water purification0.11
CulturalRecreation2.99
Total883,520.59
Disclaimer/Publisher’s Note: The statements, opinions and data contained in all publications are solely those of the individual author(s) and contributor(s) and not of MDPI and/or the editor(s). MDPI and/or the editor(s) disclaim responsibility for any injury to people or property resulting from any ideas, methods, instructions or products referred to in the content.