Article

Bacterial Communities Respond to Spatiotemporal Fluctuation in Water Quality and Microcystins at Lake Taihu

1
College of Life and Environmental Science, Wenzhou University, Wenzhou 325035, China
2
National and Local Joint Engineering Research Center of Ecological Treatment Technology for Urban Water Pollution, Wenzhou University, Wenzhou 325035, China
3
Disaster Prevention Research Institute, Kyoto University, Gokasho, Uji 611-0011, Kyoto, Japan
4
Faculty of Agriculture, Saga University, Saga 840-8502, Saga, Japan
*
Author to whom correspondence should be addressed.
Water 2025, 17(15), 2222; https://doi.org/10.3390/w17152222
Submission received: 14 June 2025 / Revised: 19 July 2025 / Accepted: 21 July 2025 / Published: 25 July 2025
(This article belongs to the Section Biodiversity and Functionality of Aquatic Ecosystems)

Abstract

Microbial communities are crucial to maintaining the ecological health of lakes, but their response to water quality and eutrophication is poorly understood. This study analyzed seasonal variation in the effect of water quality parameters on microbial community structure and function at southern Lake Taihu. We observed poor water quality in autumn (low dissolved oxygen concentration and water transparency) with severe eutrophication (high in nitrogen, phosphorus, and microcystins). Microcystins were a major indicator of water quality that affected total phosphorus and dissolved oxygen concentrations. Redundancy analysis revealed that total nitrogen, total phosphorus, nitrate, ammonium, and microcystins, temperature, and dissolved oxygen all significantly influenced the microbial community. Microbial co-occurrence networks revealed significant seasonal variations, with autumn and winter exhibiting a more complex structure than other seasons. Additionally, we identified microcystin-sensitive microbial species as eutrophication indicators; they are involved in bacterial community components and metabolic function and fluctuate under seasonal changes to water quality. In conclusion, our findings provide insight into the relationship between water quality and microbial communities, offering an empirical basis for improving the sustainable management of Lake Taihu.

1. Introduction

Accelerating industrialization and agricultural modernization worldwide has resulted in an upsurge of contaminants [1,2,3], including fertilizers and pesticides, that are discharged into natural water bodies [4,5,6,7]. The resulting eutrophication has led to phytoplankton and algal proliferation, with cyanobacteria blooms in lakes being one of the most visually apparent results [8,9].
One example in China is Lake Taihu (30°55′40′′–31°32′58′′ N; 119°52′32′′–120°36′10′′ E) [10,11], located at the core of the Yangtze River Delta. With an average depth of 1.9 m, the lake substrate is dominated by carbonate and clastic sediments that prevent seasonal stratification [12]. As the third largest freshwater lake in China (surface area 2338 km2), it is fed by a complex river network and surrounded by major cities such as Shanghai, Suzhou, Nanjing, and Wuxi [13]. Rapid economic development in these urban areas around Lake Taihu has caused the heavy input of exogenous pollutants (e.g., nitrogen, phosphorus, antibiotics, heavy metals) from domestic, industrial, and agricultural wastewater [14,15], severely deteriorating water quality [16]. Seasonal variation in the environment and human activities may also exacerbate eutrophication during certain periods of the year, as the amount of exogenous pollutants fluctuates [17,18,19]. These significant spatiotemporal fluctuations in Lake Taihu make it an ideal place for studying the responses of bacterial community structure and function to habitat changes.
The production of toxic metabolites from microbial blooms caused by eutrophication is a health hazard to humans and aquatic organisms [20]. Notably, the genus Microcystis dominates many cyanobacterial blooms [21,22] and can be divided into toxic and non-toxic varieties based on the ability to produce microcystins (MCs). These compounds are released into the water after cell lysis and can harm other organisms by inducing protein dysregulation, metabolism disorder, DNA damage and cell apoptosis [23,24]. Thus, the long-term monitoring of MCs and other water quality variables is essential to managing pollution in water bodies such as Lake Taihu. While previous studies have focused on the impact of high concentrations of pollutants on bacterial communities in laboratory conditions, reports about the spatiotemporal variation in microbial community and the assembly processes within natural aquatic ecosystems remain largely limited. Therefore, this study looked into how microcystins and environmental factors affect the growth and maintenance of bacterial communities in natural water bodies.
In this study, a typical eutrophic water area, southern Lake Taihu, was selected, and we determined the seasonal and spatial distribution of water quality parameters, microbial communities, and environmental factors. We then analyzed the influence of the environment and microcystins on bacterial community structure and metabolic function, as well as how the microbial communities themselves interacted with each other under changing conditions. These results should provide a basis for developing the effective management and control of pollutant sources in different areas of Lake Taihu. More broadly, this work could improve our understanding of how water quality influences microbial communities and ecological functions in lake ecosystems.

2. Materials and Methods

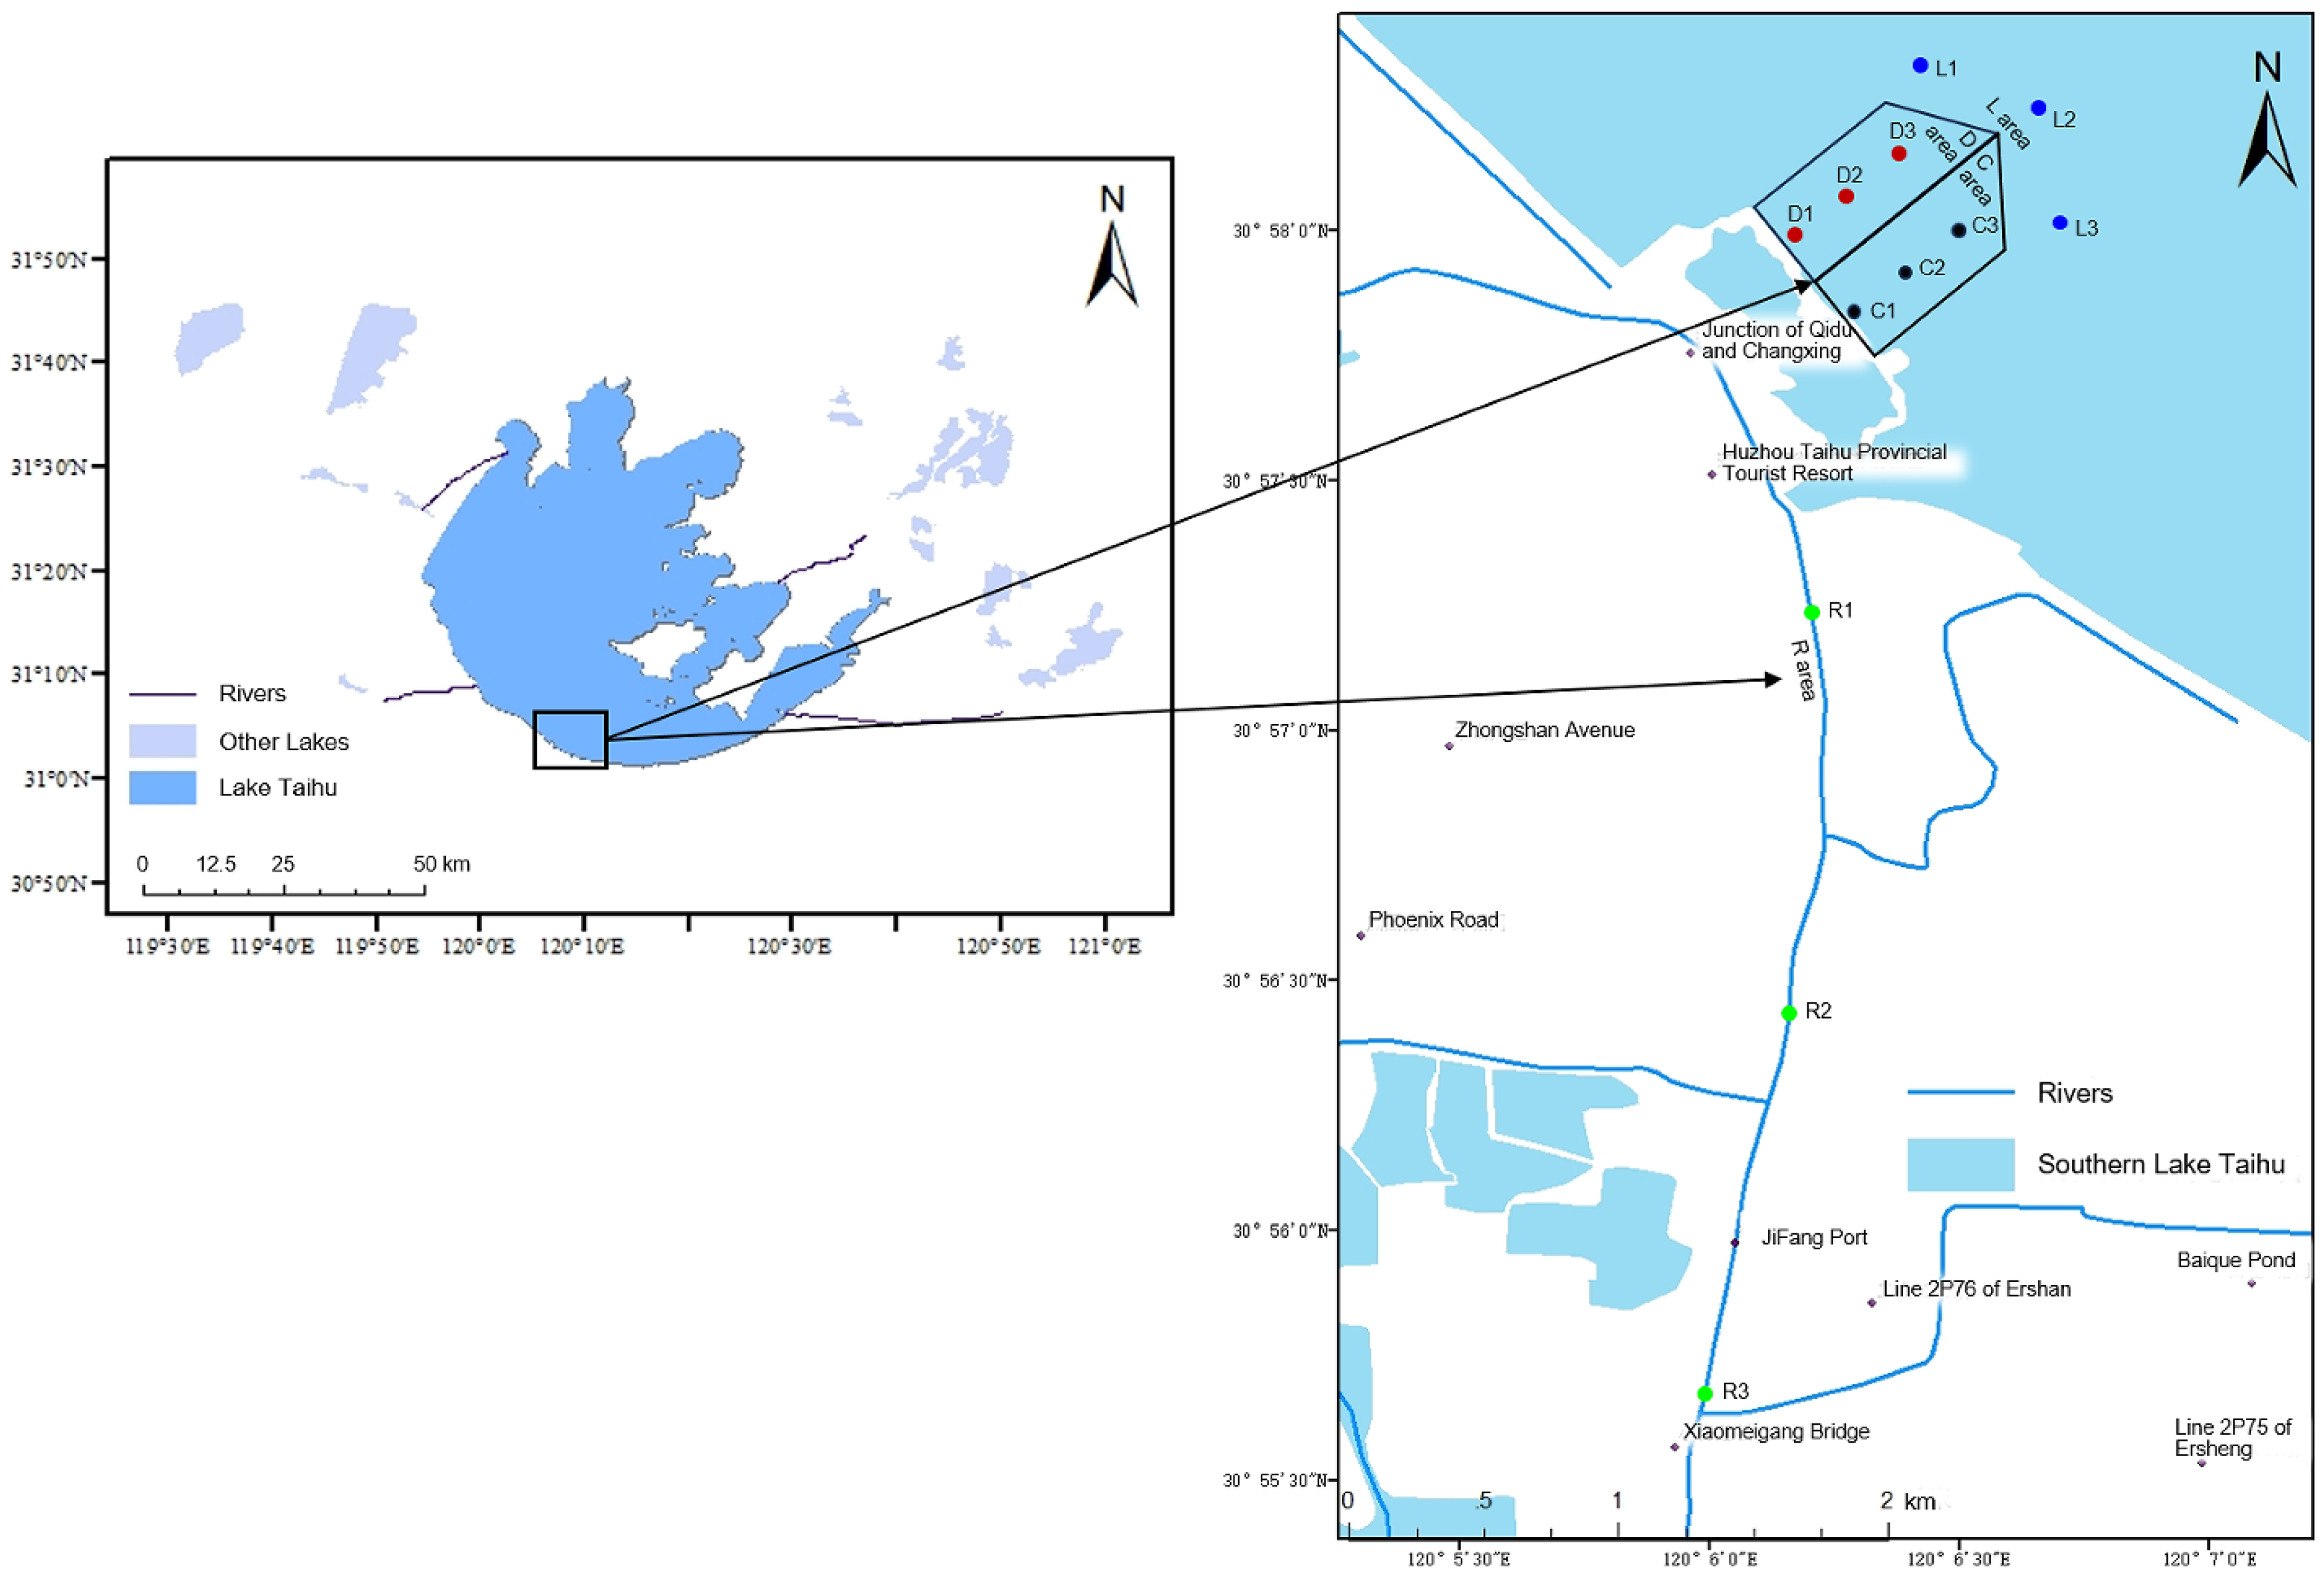
2.1. Study Area and Sample Collection

To comprehensively assess environmental and microcystin distribution patterns, this study implemented a systematic sampling design across southern Lake Taihu. Four distinct survey areas were strategically selected to represent different hydrological conditions: two closed water areas (C and D; total combined area: 22,500 m2), one open water area (L), and one river-influenced area (R). Within each area, three replicate sampling sites were established (totaling 12 sites; Figure 1), following established protocols for eutrophication monitoring in Chinese lakes [25]. To ensure representative sampling, parallel water samples from each survey area were composited prior to analysis. Field sampling was conducted ten times between April 2022 and March 2023, encompassing all seasonal variations: spring (March–May), summer (June–August), autumn (September–October), and winter (from December to February). At each sampling event, overlying water samples (1 L) were collected from approximately 0.5 m below the surface. Samples were immediately transferred to sterile bags (BKMAM Biotechnology Co. Ltd., Changde, China), maintained at 4 °C in insulated containers during transport, and processed within 6 h of collection. Laboratory processing involved sample division for microbiological characterization analysis and physicochemical parameter measurement, bacterioplankton collection via vacuum filtration (500 mL; Qingdao Jingcheng Instrument Co., Ltd., Qingdao, Chian) through 0.22 μm pore-size polycarbonate membranes (47 mm diameter; Millipore, Merck KGaA, Darmstadt, Germany), and the long-term preservation of filter membranes at −80 °C for subsequent DNA extraction.

2.2. Analysis of Physicochemical Properties

A portable multi-parameter tester (Hydrolab Logger DS5X, HACH, Shanghai, China) was used for field measurements of dissolved oxygen (DO), pH, electrical conductivity (EC), oxidation–reduction potential (ORP), chlorophyll-a (Chl-a), and temperature. Total nitrogen (TN), nitrate (NO3-N), nitrite (NO2-N), ammonium (NH4+-N), total phosphorus (TP), and phosphate (PO43−-P) were measured in triplicate following the Chinese national standard (GB3838–2002) [26].

2.3. Analysis of Microcystins

Microcystins were measured using enzyme-linked immunosorbent assays (ELISAs). Toxin concentrations were monitored using commercial microplate kits for MCs (detection limit 0.01 μg/L, Beacon Analytical Systems Inc., Portland, ME, USA). Extracellular MC (EMC) concentrations were determined directly after passing the filtrate through a Whatman GF/C filter (Cytiva, Shanghai, China). For total MCs (TMCs), water samples were first thawed and refrozen seven times and then ultrasonically pulsed to release toxins from the cells before being filtered through a GF/C filter. Intracellular MCs (IMCs) were obtained by subtracting EMCs from total TMCs. The measurements followed manufacturer recommendations and were performed in triplicate. Sample absorption was then analyzed with an ELISA plate reader (Multiskan GO, ThermoFisher Scientific Inc., Shanghai, China) at 450 nm.

2.4. DNA Extraction and Illumina Sequencing

The total DNA of microbial communities for four survey areas was extracted in triplicate from membrane filters using an OMEGA Soil DNA Kit (D5625-01, Omega Bio-Tek, Norcross, GA, USA). Extracted DNA concentration and purity were determined in a NanoDrop 2000 UV-vis spectrophotometer (Thermo Scientific, Wilmington, NC, USA). The V3–V4 regions of bacterial 16S rRNA were amplified with PCR (GeneAmp 9700, ABI, ThermoFisher Scientific Inc., Shanghai, China), using universal primers 338F (5′-ACTCCTACGGGAGGCAGCAG-3′) and 806R (5′-GGACTACHVGGGTWTCTAAT-3′) [11,27,28].
The thermocycling protocol was as follows: 98 °C for 30 s; 27 cycles of 98 °C for 15 s, 50 °C for 30 s, and 72 °C for 30 s; and 72 °C for 5 min. The reaction volume was 25 μL, containing 5× Reaction Buffer, 5× High GC Buffer, 10 mM of dNTPs, 10 μM of each of forward and reverse primer, Q5 high-fidelity DNA Polymerase, BSA, and 10 ng of template DNA. Reactions were performed in triplicate. Amplicons were purified from a 2% agarose gel using an AxyPrep DNA Gel Extraction Kit (Axygen, ThermoFisher Scientific Inc., Shanghai, China), quantified in a BioTek FLx800 Fluorescence Microplate Reader (Invitrogen, ThermoFisher Scientific Inc., Shanghai, China), and pooled for library preparation with a TruSeq Nano DNA LT Library Prep Kit (Illumina, San Diego, CA, USA). Sequencing was performed by Shanghai Personalbio Technology Co., Ltd. (Shanghai, China) using Illumina NovaSeq.
After splitting reads from MiSeq sequencing, the sequence noise reduction method (DADA2) in QIIEM2 (v.2019.4) was used for filtering and splicing high-quality double-end reads. Cleaned sequences were clustered into amplicon sequence variants (ASVs) in UPARSE (v.7.0.1090), under a 97% sequence similarity threshold. A representative sequence per ASV was run against SILVA (Release 138). To avoid mistaken alignments, taxonomic classifications were doublechecked against reference prokaryotes. After discarding unclassified ASVs, filtered sequences were normalized to limit sequencing biases and allow for comparisons of community variation. Taxa were split into rare (relative abundance < 0.01%), abundant (>1%), and moderate (between 0.01% and 1%).

2.5. Co-Occurrence Network Analysis

A co-occurrence network, based on the relative abundances of bacterial ASVs in all samples, was constructed using the “SpiecEasi” and “Sparcc” package in R (version 4.4.1). A set of network-level topological properties (average path length, graph density, average clustering coefficient, average degree, and modularity), as well as the node-level topological properties (degree, betweenness centrality, closeness centrality, and eigenvector centrality), were calculated using the “igraph” package in R (version 4.4.1) [29]. The co-occurrence network was visualized using the Gephi software (version 0.9.2) [30].

2.6. Statistical Analysis

Statistical analyses were performed using R (version 4.4.1; R Foundation for Statistical Computing, Vienna, Austria), Origin (version 2022b; OriginLab Corporation, Northampton, MA, USA), and SPSS Statistics (version 25; IBM Corporation, New York, NY, USA), and a p-value < 0.05 was considered statistically significant. All the data were checked for normality (Shapiro–Wilk and Kolmogorov–Smirnov tests) before statistical analysis, and the results indicated that some datasets deviated from normal distribution (p < 0.05); therefore, non-parametric statistical methods were selected for statistical analysis in this study.
The following bacterial community structure indices (alpha diversity) were calculated for ASVs: diversity (Shannon and Simpson), abundance (Chao and observed species), bacterial evenness (Pielou’s evenness), phylogenetic diversity (Faith’s PD), and coverage (Good’s coverage). Seasonal and spatial differences in alpha diversity and bacterial community abundance were examined using the Kruskal–Wallis test followed by Dunn’s post-hoc test for pairwise comparisons. Spearman correlation analysis was conducted to identify relationships between bacterial phyla/genera and environmental factors. Non-metric multidimensional scaling (NMDS) analysis and principal coordinate analysis (PCoA) based on the Bray-Curtis distance matrix and principal component analysis (PCA) and orthogonal partial least squares discriminant analysis (OPLS-DA) based on the species abundance matrix (Euclidean distance) were carried out using the “vegan” and “muma” package in R (version 4.4.1). Seasonal variations in bacterial communities were determined with linear discriminant analysis effect size (LEfSe). Potential microbial function was predicted using PICRUSt2, while metabolic capacity was calculated with a standardized ASV table based on the Kyoto Encyclopedia of Genes and Genomes (KEGG) [31]. Variation partitioning analysis (VPA) was used to verify the relative importance of temporal and environmental components in explaining the variation in microbial community composition [32,33,34]. Redundancy analysis (RDA), carried out using the “vegan” package in R (version 4.4.1), was utilized to find the distinct clusters among environmental parameters and evaluate the potential effect of environmental parameters and microcystins on bacterial communities and metabolic function.

3. Results

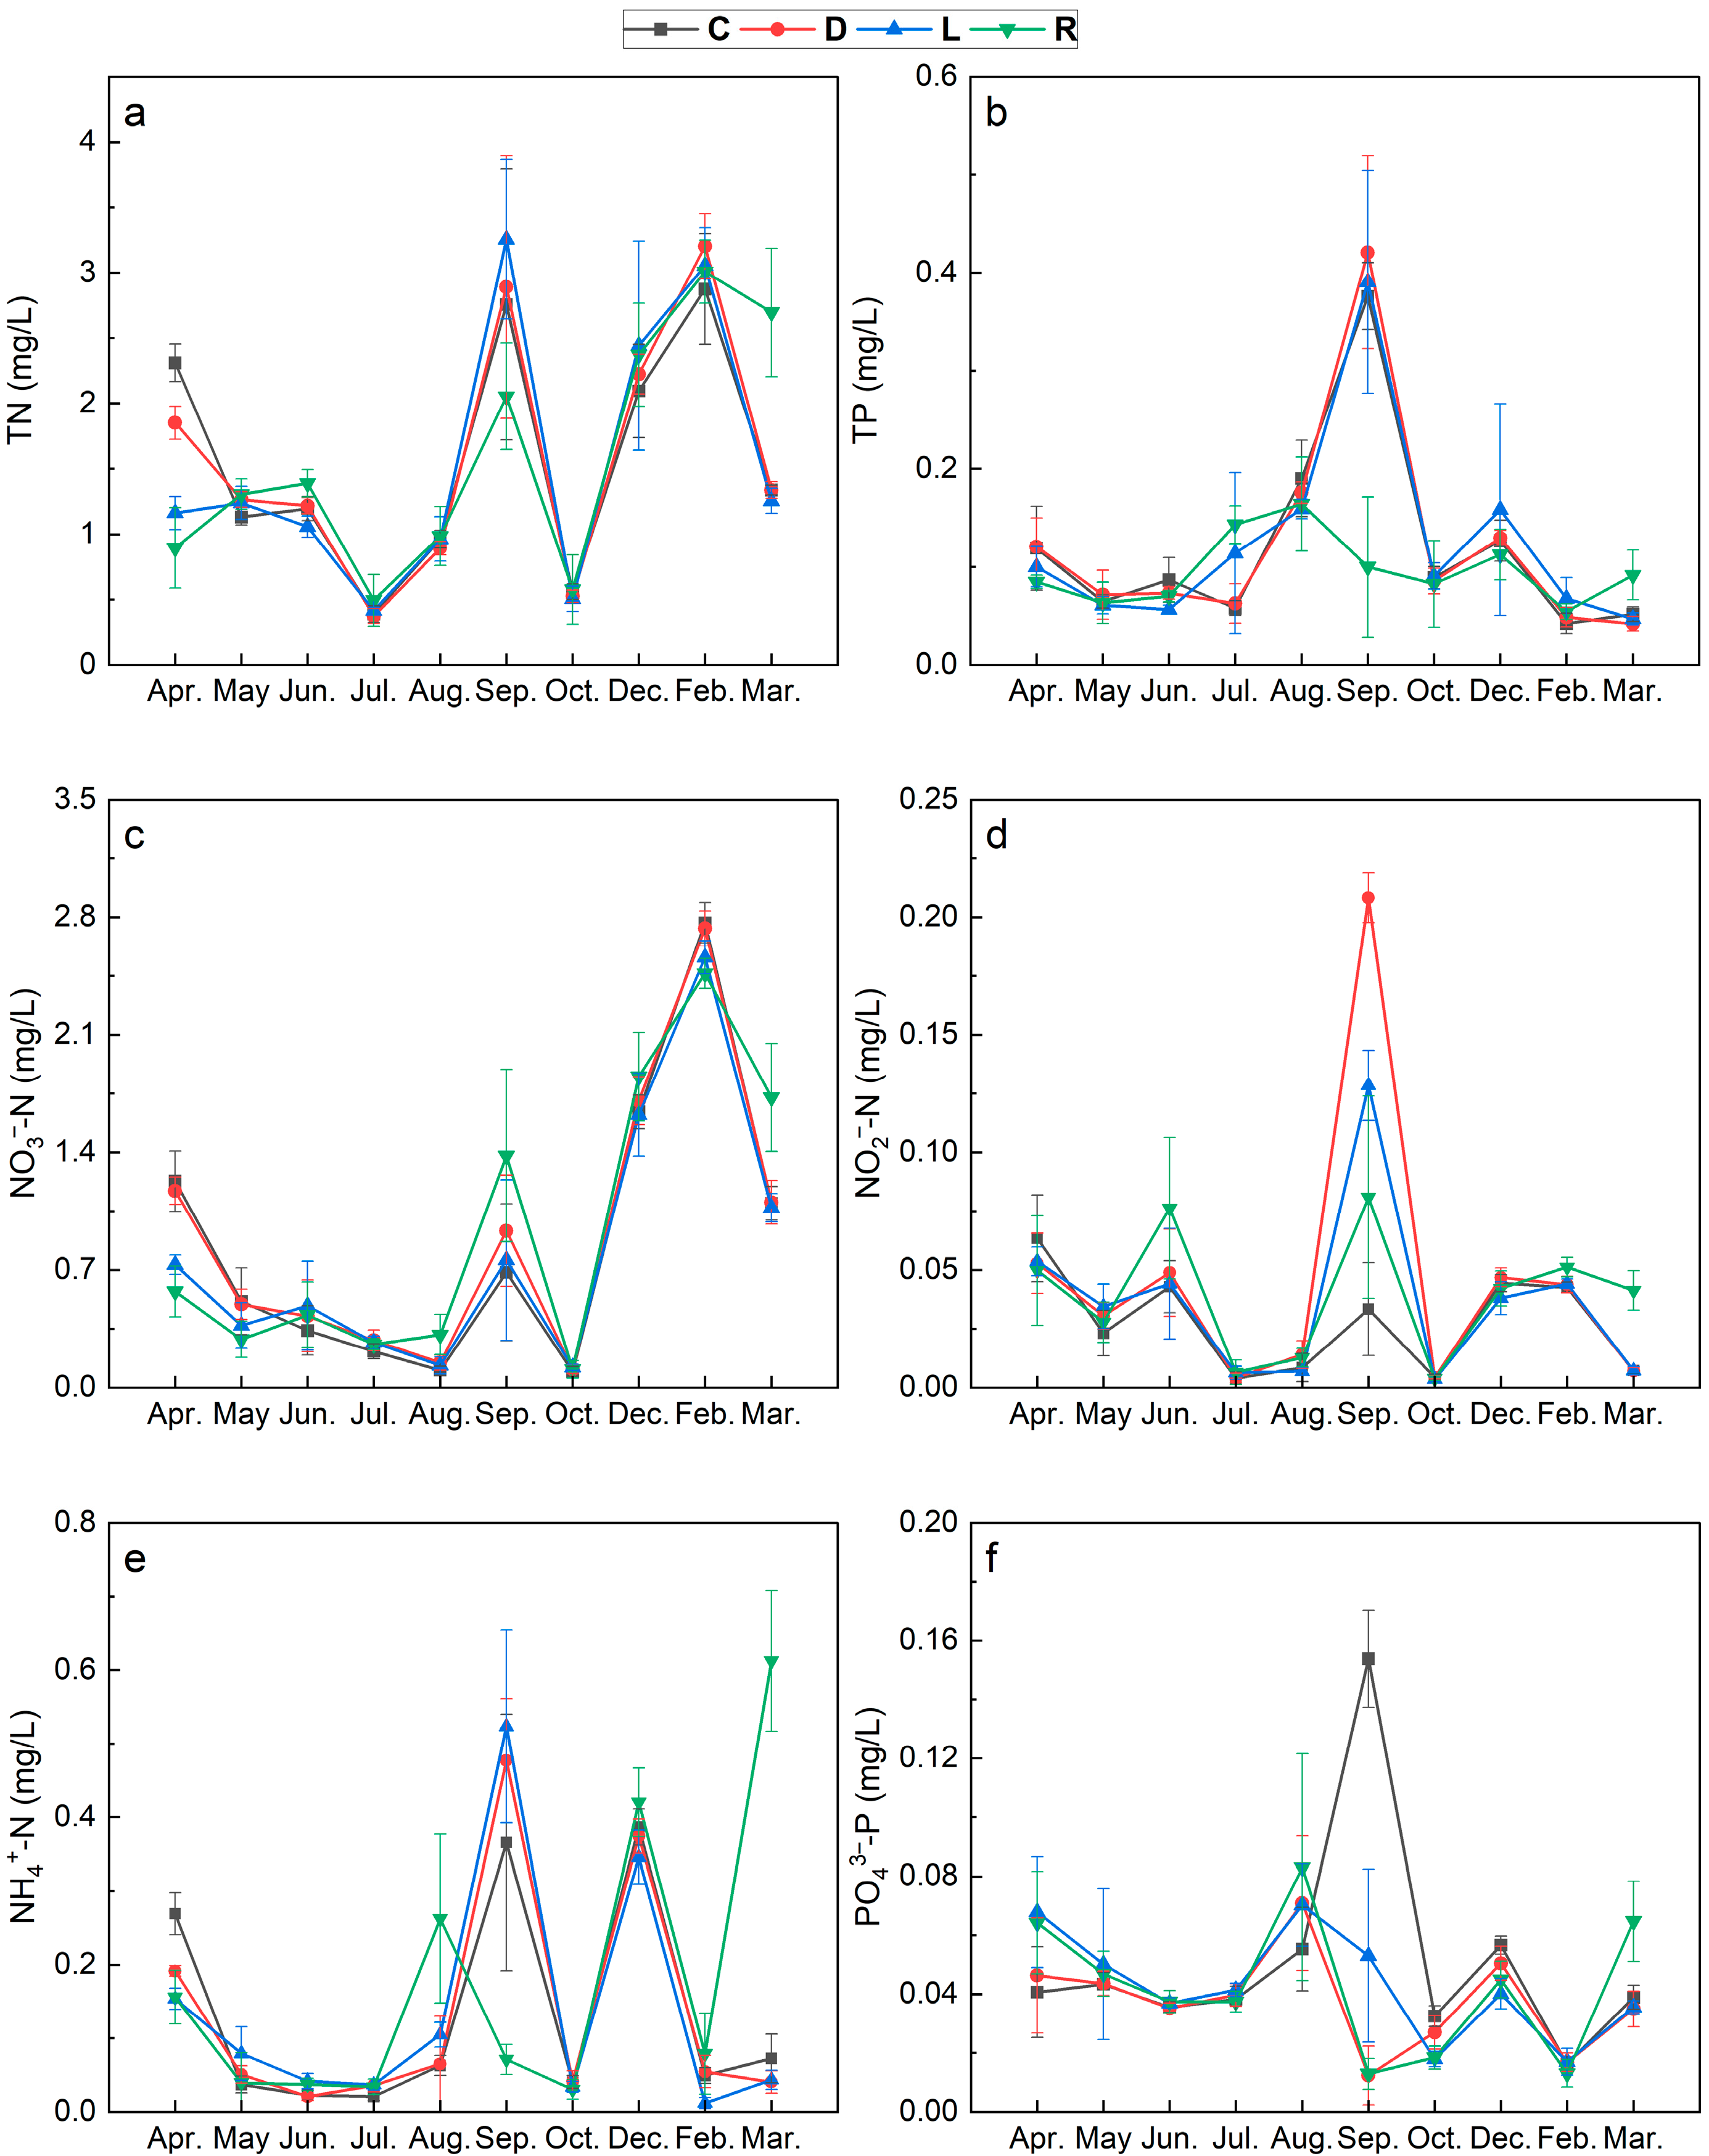
3.1. Spatiotemporal Variation in Environmental Factors in the Overlying Water

Water temperature fluctuated between 8.3 and 32.5 °C, being warmest in July and coldest in December (Figure 2a). The EC value generally trended upward, fluctuating between 219.33 and 434.33 µS/cm (Figure 2b). The ORP value fluctuated greatly in autumn (September and October) and winter (December and February), with a range of 41.67–458.78 mV (Figure 2c). The range for DO was 6.00–11.70 mg/L, with a maximum in winter (February) and minimum in autumn (September) (Figure 2d). The pH range was 7.02–9.83 (Figure 2e). Water transparency ranged between 4 and 64 cm, peaking during spring (May) and dropping to its lowest value during autumn (September) (Figure 2f). PCA revealed that seasonal variations in water quality parameters were primarily captured by the first principal component (PC1), which explained 75.59% of the total variance (Figure S1a).
Nitrogen and phosphorus nutrients exhibited distinct seasonal patterns across survey areas (Figure 3). TN concentrations ranged from 0.373 to 3.256 mg/L, showing a general decline during spring and summer followed by considerable fluctuations in autumn and winter, when peak values were observed at all areas (Figure 3a). TP concentrations (0.042–0.421 mg/L) peaked in September at all areas except R (Figure 3b). Nitrogen species displayed seasonal maxima at different periods: NO3-N (0.103–2.767 mg/L) peaked in February (winter) at all areas (Figure 3c), NO2-N (0.004–0.208 mg/L) reached maximum levels in September (autumn) (Figure 3d), and NH4+-N (0.012–0.523 mg/L) showed peaks in September and December at all areas except R, where the maximum occurred in March (spring) (Figure 3e). PO43−-P concentrations varied from 0.012 to 0.154 mg/L, exhibiting a general downward trend at all areas except C (Figure 3f). Notably, the R area demonstrated significantly higher concentrations of all measured nutrients (TN, TP, NO3-N, NO2-N, NH4+-N, and PO43−-P) in March compared to other areas (Dunn’s test, p < 0.05). PCA revealed that 88.68% of the seasonal variation (summer vs. winter) in water quality parameters was explained by PC1 (Figure S1b).

3.2. Spatiotemporal Variation in MC Concentrations of Overlying Water

Seasonal variations in EMC and IMC concentrations were observed across the survey areas (C, D, L, and R). In spring, concentrations ranged from 0.020 ± 0.001 to 0.037 ± 0.002 μg/L (EMC) and 0.006 ± 0.0003 to 0.191 ± 0.010 μg/L (IMC). Summer levels increased to 0.043 ± 0.002 to 0.191 ± 0.010 μg/L (EMC) and 0.039 ± 0.002 to 0.389 ± 0.019 μg/L (IMC), while winter concentrations decreased to 0.031 ± 0.002 to 0.072 ± 0.003 μg/L (EMC) and 0.007 ± 0.0003 to 0.088 ± 0.004 μg/L (IMC). Autumn saw a significant increase in EMC and IMC concentrations to 1.080 ± 0.054 and 99.003 ± 4.950 μg/L during September (Dunn’s test, p < 0.01) (Figure 4). Furthermore, IMC concentrations were around 28 times greater than EMC concentrations. This increase reflected a large-scale cyanobacteria bloom in survey areas in autumn. During this outbreak, the distribution of TMC in the four survey areas were highest in the C area (mean = 50.216 ± 2.511 μg/L) > R area (43.162 ± 2.158 μg/L) > D area (13.731 ± 0.687 μg/L) > L area (2.837 ± 0.142 μg/L). The peak concentration (99.717 ± 4.986 μg/L) occurred in the C area during September. Seasonal analysis revealed significantly lower EMC concentrations in spring versus summer and autumn (Dunn’s test, p < 0.01), while IMC and TMC concentrations peaked in autumn, showing significant increases compared to spring and winter periods (Dunn’s test, p < 0.01).

3.3. Correlations Between MCs and Environmental Factors

Our correlation analysis revealed significant relationships between microcystin variants and environmental factors. IMCs showed positive correlations with TP (Spearman, p < 0.01) and water temperature (Spearman, p < 0.05) but negative correlations with NO3-N (Spearman, p < 0.01), DO (Spearman, p < 0.05), and water transparency (Spearman, p < 0.05). Similarly, EMCs were positively correlated with TP (Spearman, p < 0.01) and water temperature (Spearman, p < 0.05) but negatively correlated with DO (Spearman, p < 0.05). TMCs demonstrated positive correlations with TP (Spearman, p < 0.01) and water temperature (Spearman, p < 0.05) but negative correlations with NO3-N (Spearman, p < 0.01), water transparency (Spearman, p < 0.05), and DO (Spearman, p < 0.05) (Table 1). These results indicate that water temperature, DO, TP, and NO3-N were the primary environmental drivers of microcystin dynamics. All microcystin variants responded consistently to these factors, showing positive responses to elevated water temperature and TP concentrations but negative responses to increased DO and NO3-N levels.

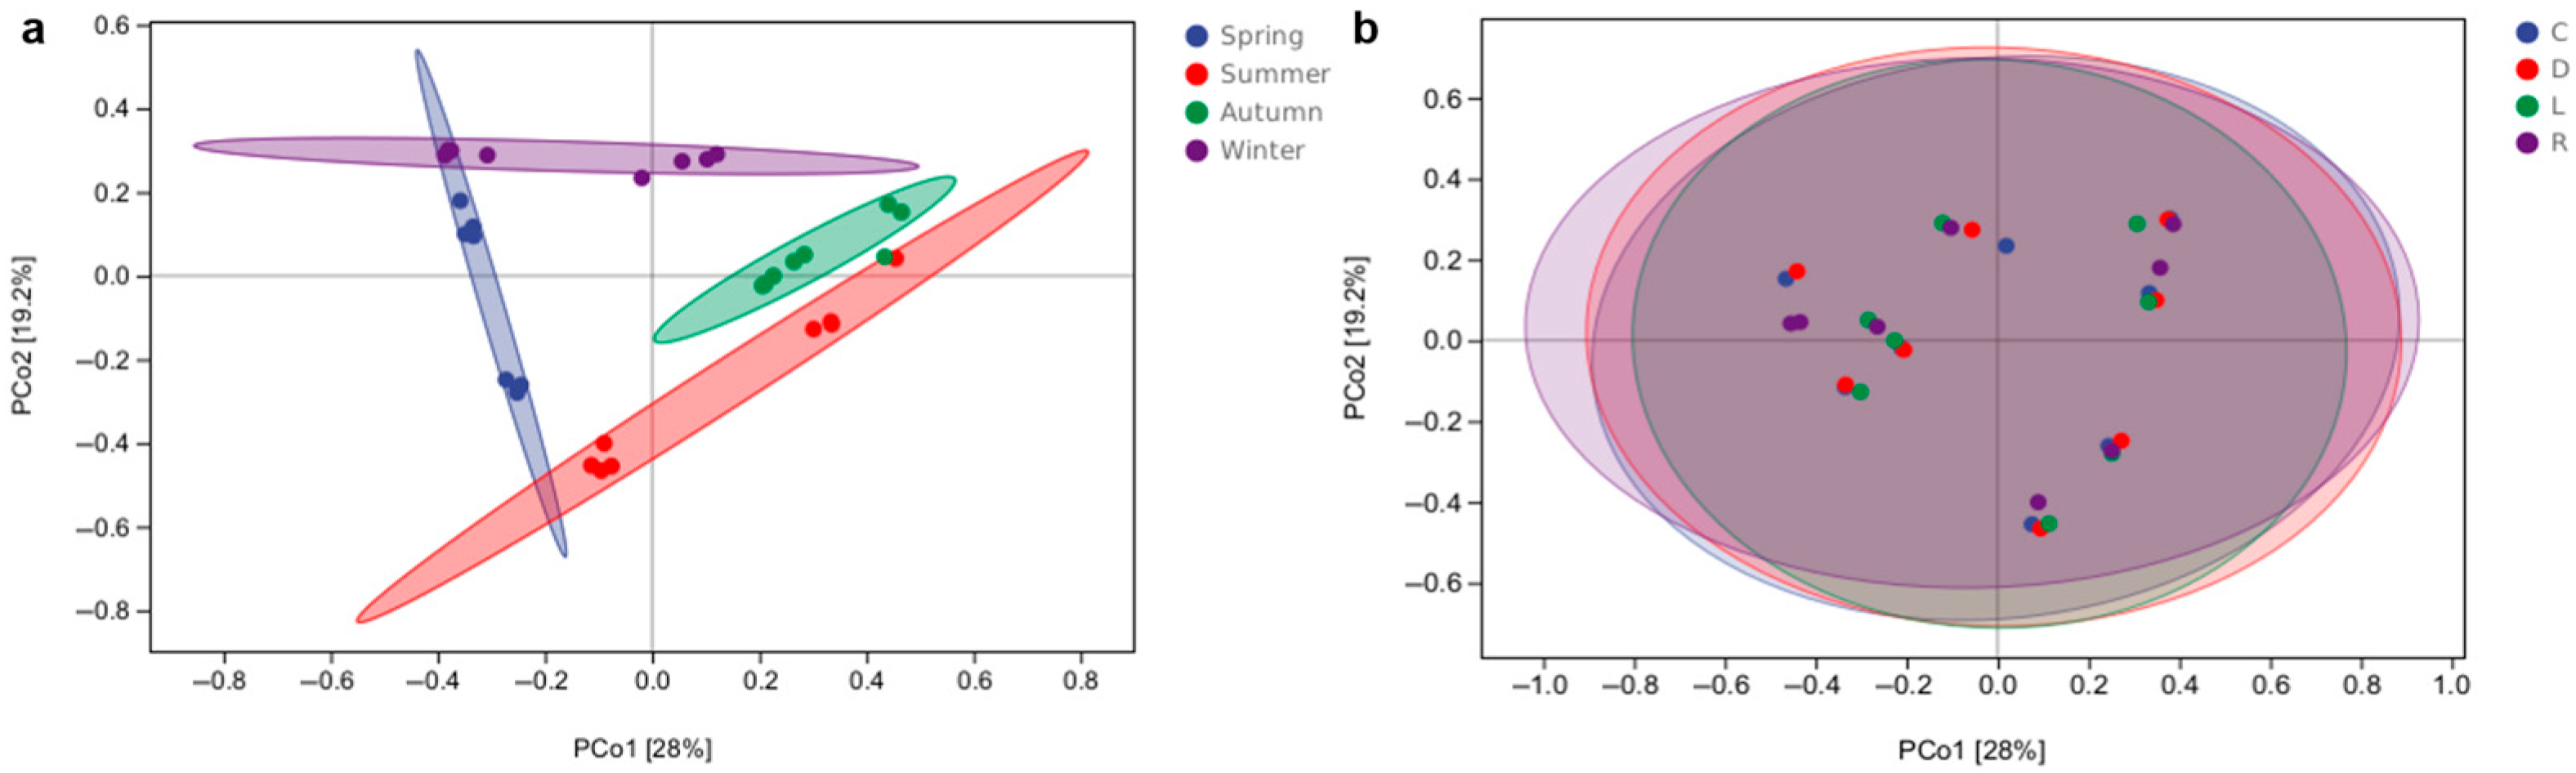
3.4. Alpha and Beta Diversity of Bacterial Communities in Overlying Water from Southern Lake Taihu

Illumina 16S rRNA gene sequencing detected 2100835 bacterial sequences that yielded 64281 ASVs. Alpha diversity indices had good coverage, indicating that pyrosequencing results were a good representation of bacterial communities (Figure S2; Table S1). Our analysis revealed significant seasonal variations in diversity indices (the Kruskal–Wallis H test, p < 0.05; Figure 5), though no significant spatial differences were observed among areas. Bacterial richness (Chao1) and coverage showed marked seasonal fluctuations, with significant differences between autumn and winter across all survey areas (Dunn’s test, p < 0.05; Figure 5, Tables S2–S4). The winter samples from the C area exhibited the highest bacterial richness (1968.660 ± 667.254), while autumn samples from the L area showed the lowest richness (930.553 ± 24.845). Conversely, coverage was highest in autumn samples from the L area (0.995 ± 0.002) and lowest in winter samples from the R area (0.985 ± 0.002). Significant seasonal differences in bacterial diversity (Shannon) and evenness were observed between spring and autumn (Dunn’s test, p < 0.05; Figure 5, Tables S2–S4). The highest diversity (8.521 ± 0.062) and evenness (0.796 ± 0.016) both occurred in spring samples from the R area, while the lowest values for these metrics (6.031 ± 0.298 and 0.602 ± 0.011, respectively) were recorded in autumn samples from the same area.
Only 327 amplicon sequence variants (ASVs; 1.92% of 16,996 total) were shared across all four seasons, representing a substantially smaller core microbiome than the 2731 ASVs (16.07%) that were common to all survey areas (Figure S3). Seasonal analysis revealed spring contained the highest number of unique ASVs (4494), followed sequentially by winter (3730), summer (3135), and autumn (2813). Spatially, the L area harbored the greatest ASV richness (3168), with subsequent distribution across areas as follows: the R area (3109) > C area (2971) > D area (2639). Beta diversity analysis (PCoA) demonstrated the strong seasonal structuring of bacterial communities (ANOSIM: R = 0.66, p = 0.002; Figure 6a), accounting for 47.2% of the variation along principal coordinates 1 and 2. In contrast, spatial differences were nonsignificant (ANOSIM: R = −0.12, p = 0.963; Figure 6b).
In terms of relationships with environmental factors, Chao1, observed species, and Faith-pd indices were positively correlated with conductivity (Spearman, ρ = 0.432, 0.505, and 0.697, and p < 0.05, 0.01, and 0.01, respectively) and NH4+-N (Spearman, ρ = 0.571, 0.576, 0.630, respectively; all p < 0.01) but negatively correlated with temperature (Spearman, ρ = −0.575, −0.500, and −0.464, respectively; all p < 0.01). Notably, these indices exhibited differential responses to nitrogen and phosphorus nutrients. Chao1 was positively correlated with NO3-N (Spearman, ρ = 0.578, p < 0.01) and TN (Spearman, ρ = 0.443, p < 0.01), observed species correlated positively with NO3-N (Spearman, ρ = 0.461, p < 0.01), and Faith-pd correlated positively with PO43−-P (Spearman, ρ = 0.459, p < 0.01). The Shannon and Simpson diversity indices showed positive correlations with transparency (Spearman, ρ = 0.548 and 0.529, respectively; both p < 0.01) but negatively correlated with EMCs (Spearman, ρ = −0.351 and −0.0.342, respectively; both p < 0.05), IMCs (Spearman, ρ = −0.378 and −0.354, respectively; both p < 0.05), and TMCs (Spearman, ρ = −0.398 and −0.365, respectively; both p < 0.05). Additionally, the Simpson index was negatively correlated with both pH (Spearman, ρ = −0.431, p < 0.05) and TP (Spearman, ρ = −0.410, p < 0.05). In contrast, Good’s coverage index showed an inverse pattern, being positively correlated with temperature (Spearman, ρ = 0.584, p < 0.01) but negatively correlated with conductivity (Spearman, ρ = −0.409, p < 0.05), NH4+-N (Spearman, ρ = −0.639, p < 0.01), NO3-N (Spearman, ρ = −0.633, p < 0.01), and TN (Spearman, ρ = −0.548, p < 0.01) (Figure S4).

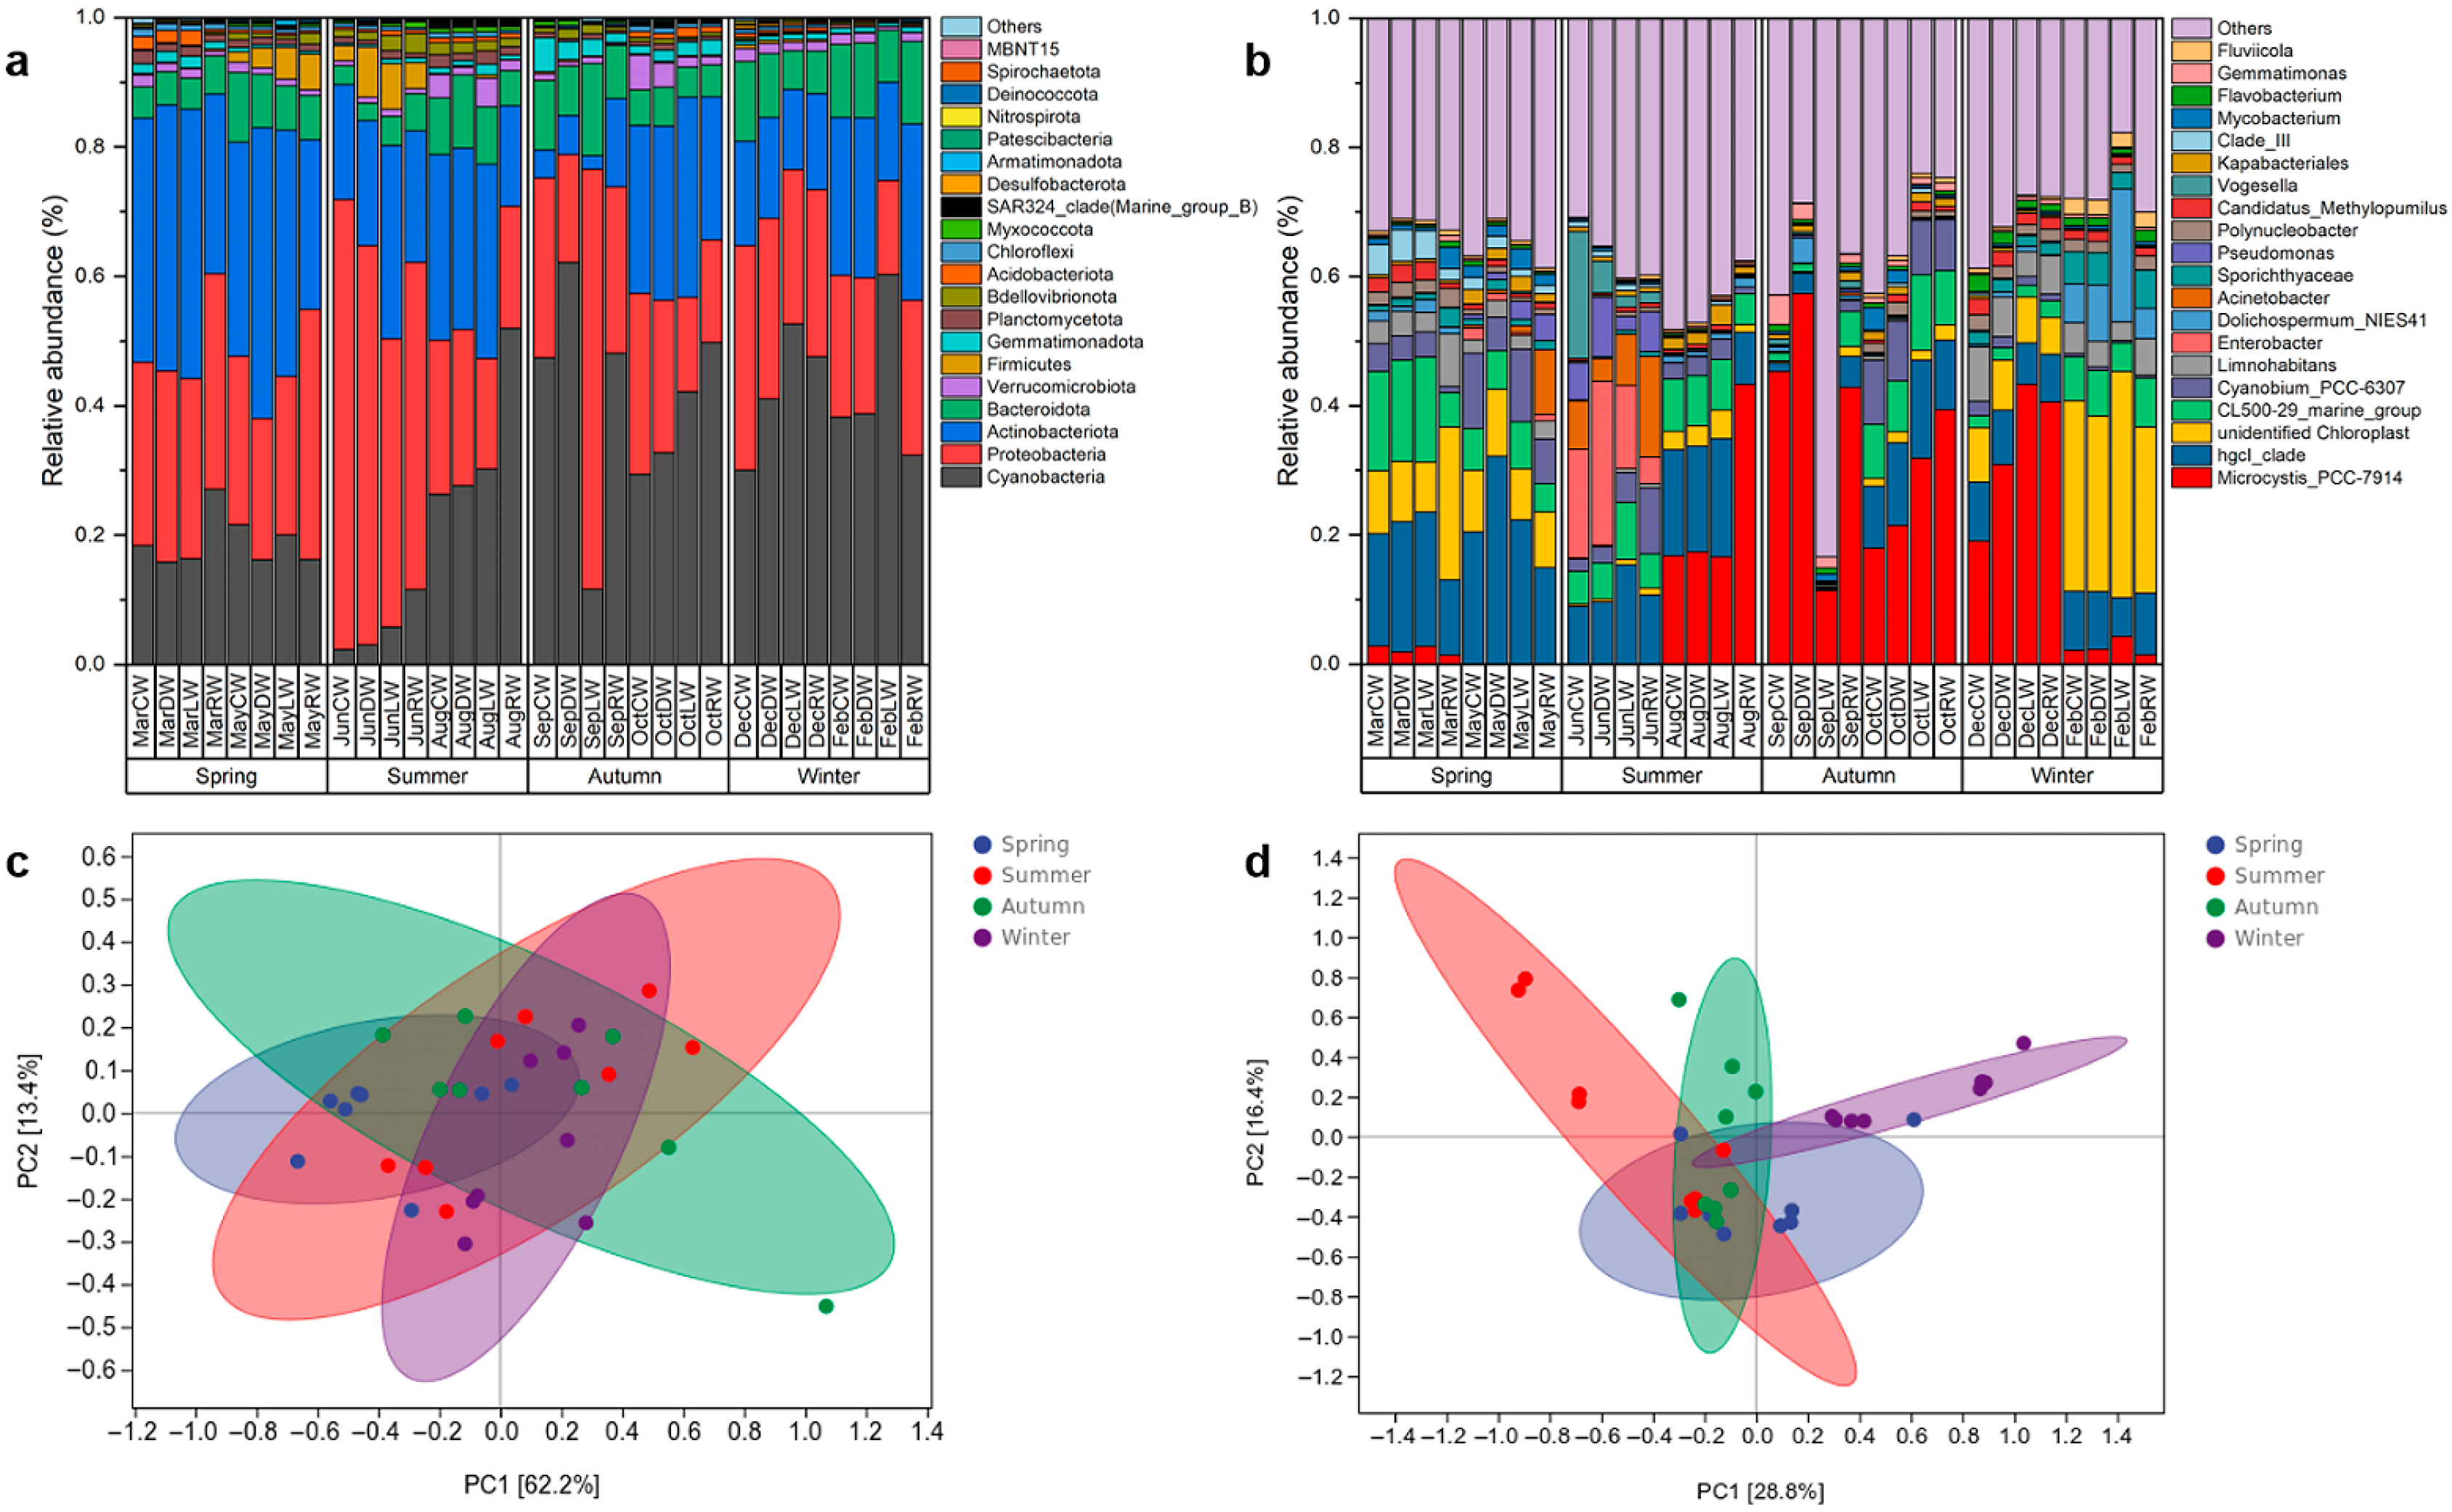
3.5. Composition of Bacterial Communities in Overlying Water

For each sample, the top 20 most abundant bacterial phyla and genera were analyzed to generate cylindrical accumulation plots (Figure 7a,b). Orthogonal projections to latent structures discriminant analysis (OPLS-DA) revealed significant seasonal variations in taxonomic composition (Figure 7c,d), with interpretation rates of 75.6% for phyla and 45.2% for genera. Dominant phyla exhibited distinct spatiotemporal patterns, Cyanobacteria (2.31–62.16%) and Bacteroidota (2.71–14.27%) peaked in autumn and winter, Proteobacteria (14.49–69.53%) dominated summer communities, and Actinobacteriota (2.09–44.93%) were most abundant in spring (Figure 7a). Key genera showed pronounced variability: Microcystis PCC7914 (0.01–57.34%) and Cyanobium PCC6307 (0.13–11.65%) represented Cyanobacteria, the hgcl clade (0.22–32.15%) and CL500-29 marine group (0.22–16.24%) were widespread, and unidentified chloroplasts (0.20–34.97%) represented the species capable of photosynthesis.
Statistical analysis using Kruskal–Wallis with Dunn’s post hoc test revealed significant seasonal variations in bacterial community composition. Cyanobacteria demonstrated significantly higher abundance during autumn and winter compared to spring and summer (Dunn’s test, p < 0.05), a pattern that correlated with elevated nitrogen and phosphorus concentrations observed in September, December, and February. Several bacterial phyla exhibited distinct seasonal patterns that may serve as eutrophication indicators. Actinobacteriota peaked in spring (Dunn’s test, p < 0.01), Gemmatimonadota showed highest abundance in autumn (Dunn’s test, p < 0.05), Planctomycetota dominated in spring and summer (Dunn’s test, p < 0.01), Chloroflexi were most abundant in spring (Dunn’s test, p < 0.01), Desulfobacterota and Spirochaetota proliferated in summer (Dunn’s test, p < 0.01) (Figure S5; Tables S5–S7). At the genus level, we observed that Microcystis PCC7914 abundance mirrored Cyanobacteria patterns, peaking in autumn (Dunn’s test, p < 0.05). The Hgcl clade and Cyanobium PCC6307 were significantly more abundant in spring (Dunn’s test, p < 0.01 and p < 0.05, respectively), while unidentified chloroplasts, Limnohabitans and Polynucleobacter showed higher abundance in spring and winter (Dunn’s test, p < 0.05). Sporichthyaceae and Kapabacteriales maintained substantial populations across spring, summer, and autumn (Dunn’s test, p < 0.05). Mycobacterium was abundant in spring and autumn (Dunn’s test, p < 0.05), while Flavobacterium dominated in autumn and winter (Dunn’s test, p < 0.05) (Figure S5; Tables S8–S10).
KEGG pathway analysis revealed conserved functional profiles across seasons, with minimal temporal variation in metabolic potential (Figure S6). The bacterial communities exhibited strong functional stability, and metabolism (81.2–82.4%) consistently dominated, followed by genetic information processing (2.91–3.03%) and cellular processes (0.80–1.00%). In particular, amino acid metabolism (12.81–13.26%), carbohydrate metabolism (12.64–13.25%), and the metabolism of cofactor and vitamin (12.68–13.89%) pathways dominated, indicating stable biogeochemical processing capacity despite seasonal taxonomic shifts observed previously.

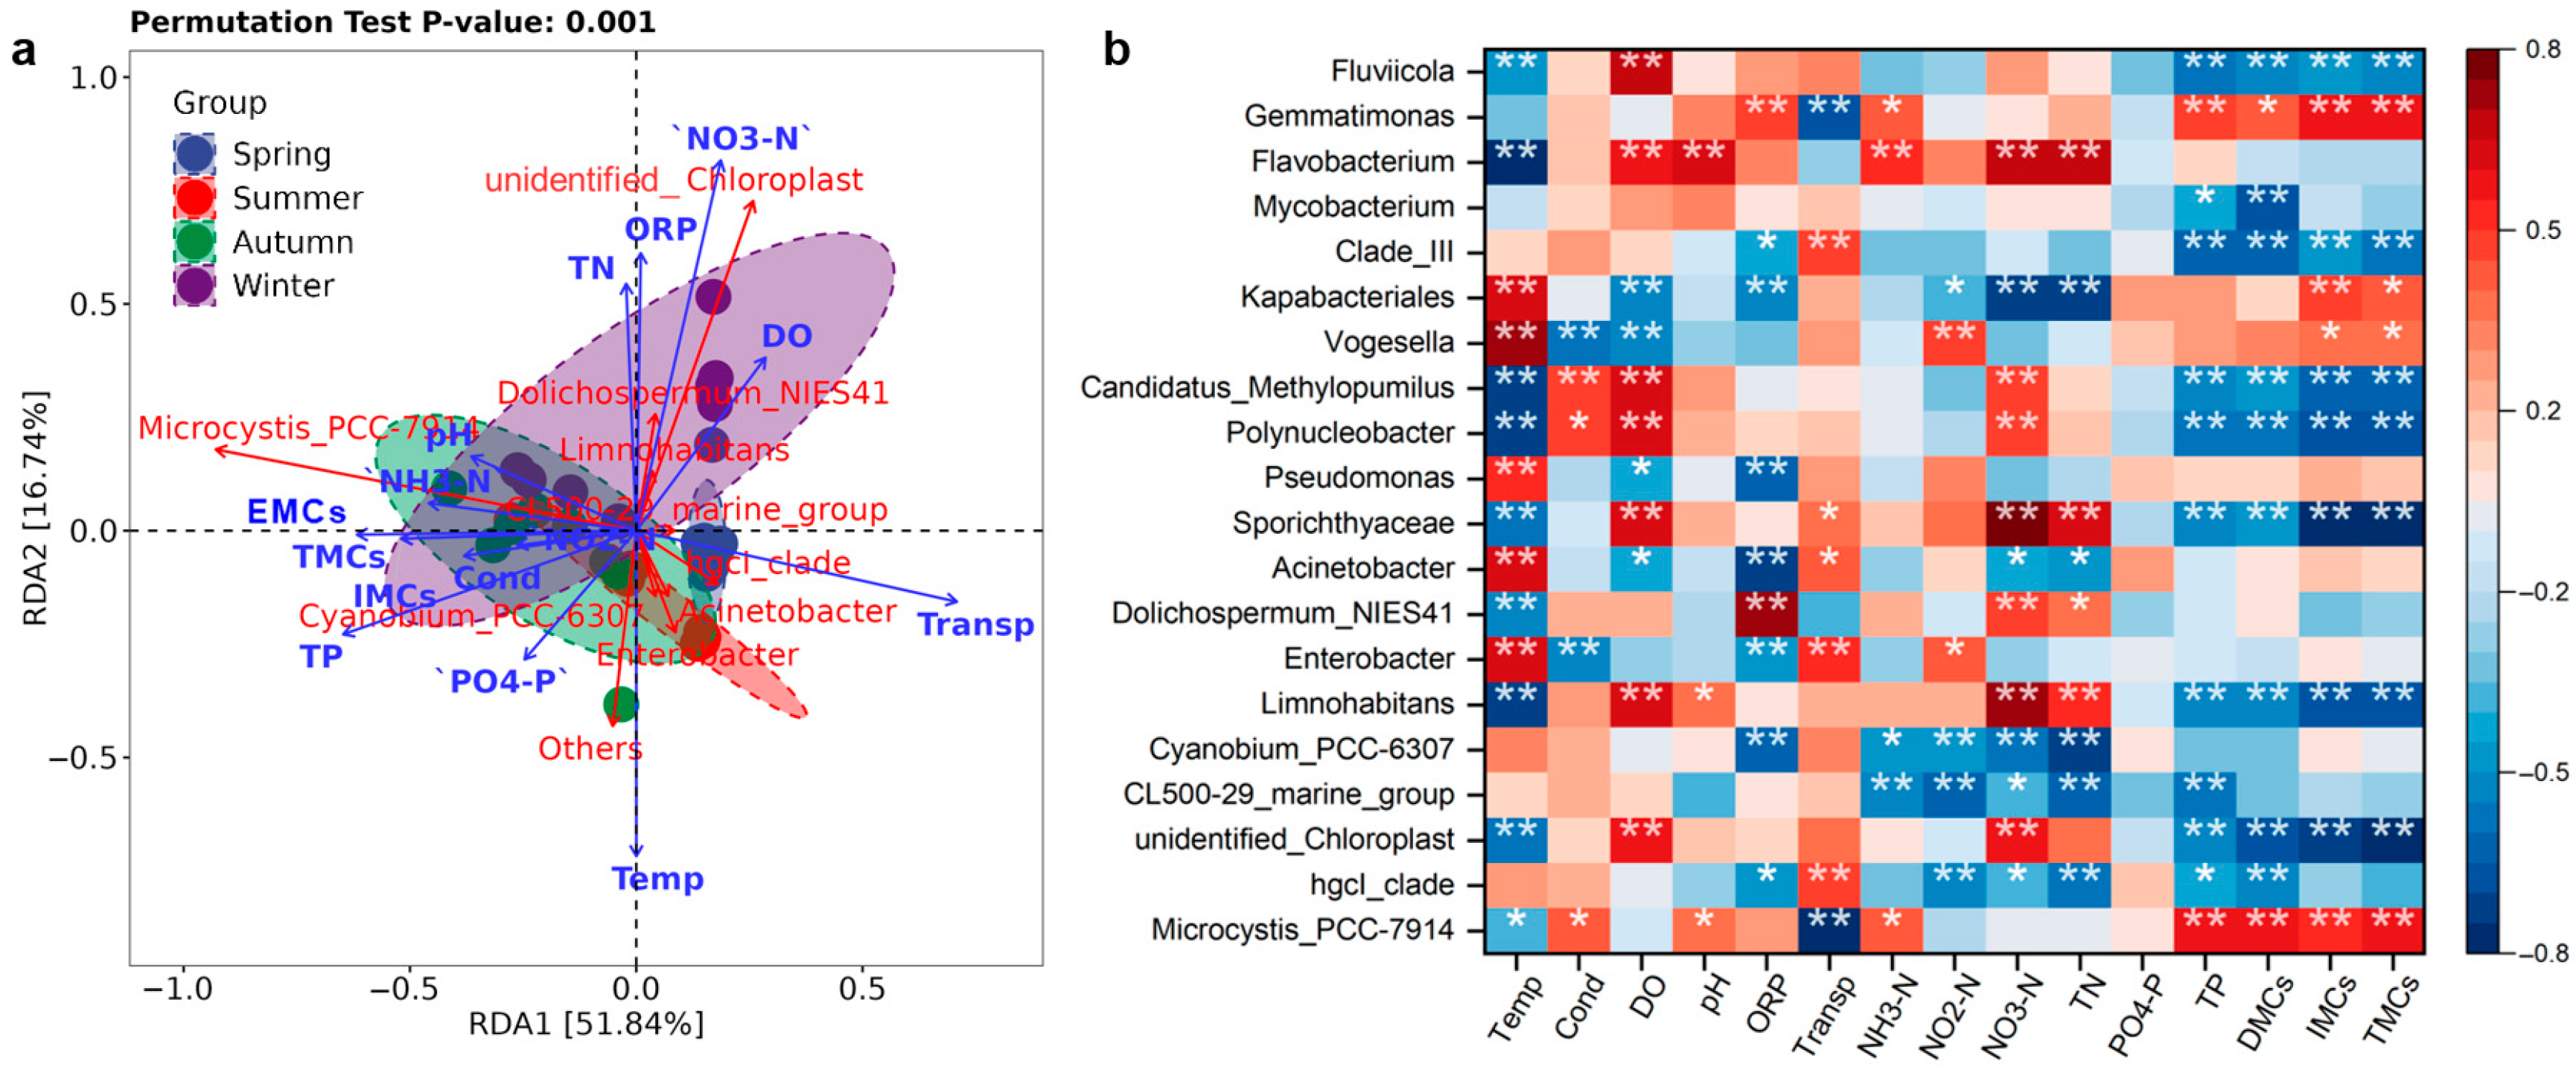
3.6. Analysis of Factors Influencing Bacterial Communities

The results of the VPA revealed differential contributions of environmental parameters versus microcystins (MCs) in shaping bacterial communities. Environmental parameters explained significantly greater functional variance than MCs (R2 = 0.70% vs. 0.07%; p < 0.05), the combined model accounted for 0.02% of total functional variation, and residual variance (0.21%) suggested unmeasured drivers or stochastic processes (Figure S7a). Similarly, correlation analysis revealed that environmental factors had a greater effect on diversity indices than MCs (Figure S4).
We selected the top 50 most abundant genera across all areas and seasons for RDA with environmental parameters (temperature, pH, DO, ORP, conductivity, water transparency, TN, NO3-N, NO2-N, NH4+-N, TP, and PO43−-P) and microcystins (IMCs, EMCs, and TMCs) (Figure 8a). All environmental parameters significantly affected bacterial communities (the permutation test, p < 0.01) (Figure 8a). Additionally, temperature, transparency, NO3-N, TP, TMCs, IMCs, and EMCs were key contributors to bacterial community abundance (Envfit test, p < 0.01) (Figure 8a; Table S11).
Next, we performed Spearman’s correlation analysis to assess relationships between the top 20 dominant genera (across all areas and seasons) and environmental parameters, including microcystins (MCs) (Figure 8b). The analysis revealed distinct response patterns among bacterial genera. Unidentified chloroplasts, Limnohabitans, Sporichthyaceae, Polynucleobacter, and candidatus Methylopumilus showed significant positive correlations with NO3-N (Spearman, ρ = 0.571, 0.0.740, 0.816, 0.458, and 0.449, respectively; all p < 0.01) but negatively correlated with TP (Spearman, ρ = −0.530, −0.490, −0.517, −0.556, and −0.514, respectively; all p < 0.01) and MCs (Spearman, ρ = −0.728, −0.625, −0.672, −0.621, and −0.582, respectively; all p < 0.01). Additionally, clade III and Fluviicola exhibited negative correlations with both TP (Spearman, ρ = −0.589 and −0.570, respectively; both p < 0.01) and MCs (Spearman, ρ = −0.536 and −0.483, respectively; both p < 0.01), suggesting their potential role in MC degradation. In contrast, Microcystis PCC7914 and Gemmatimonas demonstrated positive correlations with TP (Spearman, ρ = 0.596 and 0.486, respectively; both p < 0.01) and MCs (Spearman, ρ = 0.559 and 0.508, respectively; both p < 0.01), suggesting these genera are a potential producer of MCs. Notably, elevated TP concentrations appeared to promote Microcystis PCC7914 growth and enhance MC production, confirming the observed positive TP-MC relationship.

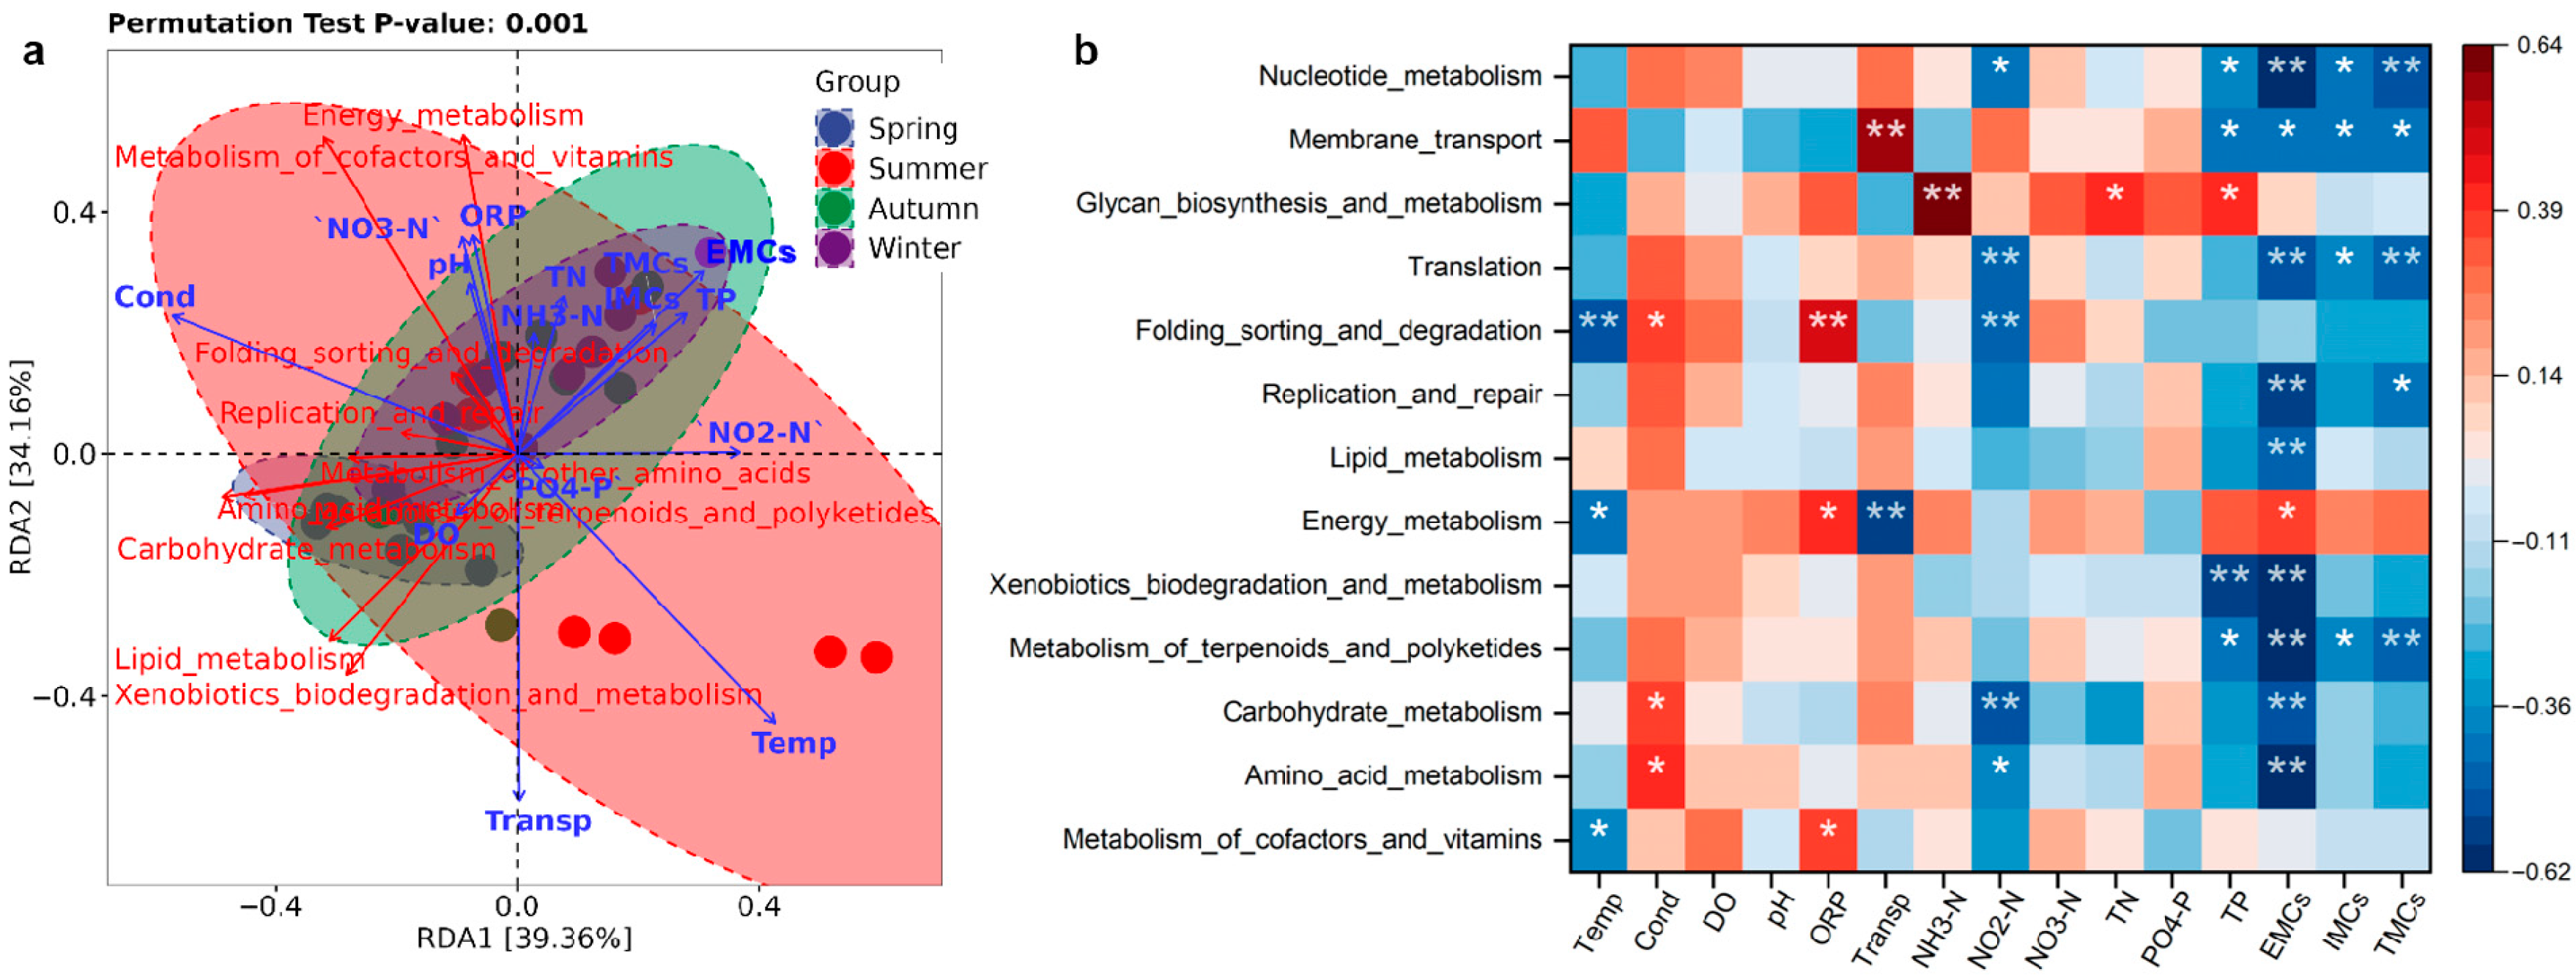
3.7. Factors Influencing Bacterial Metabolic Functions

The results of the VPA revealed differential contributions of environmental parameters versus microcystins (MCs) in shaping bacterial metabolic function. Environmental parameters explained significantly greater functional variance than MCs (R2 = 0.68% vs. 0.29%; p < 0.05), with no significant interactive effects observed. The minimal explained variance (0.16% residual) indicated dominant unmeasured drivers or stochastic processes (Figure S7b). We then performed RDA using the dominant KEGG metabolic pathways enriched by the top 50 most abundant bacteria (across all areas and seasons), environmental parameters, and MCs (Figure 9a). Both environmental parameters and MCs influenced metabolic functions (the permutation test, p < 0.01). Of the environmental variables, temperature, transparency, and conductivity had significant effects (the Envfit test, p < 0.01), and all three MC variants (IMCs, EMCs, and TMCs) had significant effects (the Envfit test, p < 0.05) (Figure 9a; Table S12).
We then investigated whether the top 15 most enriched secondary metabolic pathways were correlated with environmental parameters or MCs (Figure 9b). Among environmental parameters, ORP, transparency, and TP were the most influential elements on potential metabolic function (Spearman, p < 0.01). Additionally, all MC variants were negatively correlated with terpenoid and polyketide metabolism, replication and repair, translation, membrane transport, and nucleotide metabolism (Spearman, ρ = −0.474, −0.440, −0.448, −0.426, abd −0.527, respectively; p < 0.05). Amino acid metabolism, carbohydrate metabolism, xenobiotic biodegradation and metabolism, and lipid metabolism were negatively correlated with EMCs (Spearman, ρ = −0.592, −0.519, −0.589, and −0.454, respectively; p < 0.01), while energy metabolism was positively correlated with EMCs (Spearman, ρ = 0.363, p < 0.05). Amino acid metabolism, carbohydrate metabolism, replication and repair, folding sorting and degradation, translation, and nucleotide metabolism were negatively correlated with NO2-N (Spearman, ρ = −0.387, −0.492, −0.446, −0.449, −0.475, and −0.419, respectively; p < 0.05). Terpenoid and polyketide metabolism, xenobiotic biodegradation and metabolism, membrane transport, and nucleotide metabolism were negatively correlated with TP (Spearman, ρ = −0.431, −0.543, 0.423, and 0.381, respectively; p < 0.05), while glycan biosynthesis and metabolism were positively correlated with TP (Spearman, ρ = 0.404, p < 0.05).

3.8. Seasonal Variation in Bacterial Co-Occurrence Networks

Co-occurrence networks per season across sampling areas were constructed and seasonal variations in multiple topological properties of bacterial communities were found (Figure 10; Table 2). In autumn, the bacterial community network consisted of 76 nodes that can be clustered into three modules. In winter, the network had 64 nodes (four modules); in spring, 60 nodes (four modules); and in summer, 54 nodes (four modules). To visualize temporal variation in biotic interactions, we generated subnetworks per season across survey areas (Figure 10). Bacterial community networks exhibited pronounced temporal variation that was reflected by changing network modules over time. The average degree, graph density, and average clustering coefficient of the bacterial community network generally increased and were higher in autumn and winter than in spring and summer (Z-test, p < 0.05; Table 2). Autumn exhibited the highest average degree and average clustering coefficient (i.e., the most complex bacterial network).

4. Discussion

We uncovered predominantly IMCs (96.7 ± 2.7%) when investigating MC composition at our four survey areas. The concentrations of IMCs in autumn far exceeded the World Health Organization (WHO) threshold for MCs in drinking water (1 μg/L) [35], and it was also much higher than the standard threshold of MCs in landscape water bodies (20 μg/L) at the C, D and L areas of southern Lake Taihu [36]. Additionally, we observed elevated TMC concentrations at the C area that was likely related to an outbreak of cyanobacteria blooms in September. During this outbreak, overall IMC concentrations were significantly higher than EMC concentrations, whereas EMC concentration outstripped IMC concentration in winter, possibly because water temperature decreased in winter and led to the death and rupture of cyanobacteria cells, and the leakage of IMCs increased EMC concentrations. Previous research on the variation in IMCs and EMCs in reservoirs found that their source was primarily toxin-producing cyanobacteria (e.g., Microcystis) [37]. The measured TMC concentrations in our study were lower than those reported in previous studies. This discrepancy may be attributed to seasonal environmental changes: winter water temperature reductions significantly increased DO levels (Spearman, ρ = −0.705, p < 0.01), which likely suppressed the growth of toxic strains [38], and higher water transparency in summer further inhibited toxic strain proliferation (Spearman, ρ = −0.458, p < 0.01), collectively contributing to reduced TMC concentrations.
In addition to biological factors such as cyanobacteria, abiotic environmental factors such as nitrogen and phosphorus (TN, NO3-N, and TP) also exert a strong influence on aquatic MC concentrations [39,40]. Here, we demonstrated that the key factors affecting MC concentrations were water temperature, DO, TP, and NO3-N. Specifically, MCs responded positively to increases in water temperature and TP concentration but negatively to increases in DO and NO3-N. Our results are partially consistent with previous research on Lake Dianchi [41], the Yanghe reservoir [42], and Lake Taihu [43], which identified a positive correlation between MCs and nitrogen and phosphorus nutrients and water temperature but a negative correlation with DO. In line with this relationship, Microcystis PCC7914 was most abundant in autumn, responding to elevated agricultural non-point source pollution in land near Lake Taihu that increased TP, TN, and NH4+-N concentrations. Its dominance is a clear indicator that Lake Taihu is experiencing eutrophication.
Changes in species composition and diversity reflect community response to environmental disturbances, providing insight into ecosystem health and stability [44,45]. In this study, the alpha diversity of bacterial communities and relative abundance of major bacterial taxa exhibited significant seasonal variation. Alpha diversity was lower in autumn compared to other seasons, suggesting that eutrophication-induced cyanobacterial blooms competitively excluded most other microbial taxa and dominated the ecological niche. Moreover, the seasonal temperature decline in autumn further reduced bacterial richness and diversity.
Cyanobacteria are the primary indicator of lake eutrophication [46]. In particular, Bacteroidota are sensitive to various pollutants, including nitrate, ammonia, and feces [47]. Here, we confirmed that Cyanobacteria and Bacteroidota were abundant under conditions of excessive nitrogen and phosphorus nutrients during autumn and winter. However, Cyanobacteria showed greater temporal variability than Bacteroidota. We also noted high Actinobacteriota abundance in spring. This outcome is in line with previous research demonstrating that Actinobacteriota are more abundant in industrial areas related to steroid conversion and industrial wastewater treatment, such as Lake Taihu [48].
The distinct characteristics of dominant bacterial genera and species in each season are a sign of the strong influence of surrounding environmental factors (e.g., water sources, pollution). At the genus level, the distribution of unidentified chloroplasts showed similar patterns to Cyanobacteria, with higher abundance in winter and a negative response to decreasing water temperature. While the Hgcl clade, the CL500-29 marine group, and Cyanobium PCC6307 have been associated with nutrient-rich waters like Taohuatan Lake and Hancheng Lake [49,50,51], our findings demonstrated their seasonal predominance in spring, with abundance inversely related to declining nitrogen and phosphorus levels. Differential microbial adaptability to environmental factors results in distinct community characteristics that suit specific habitats [48,52].
Bacterial community distribution varied temporally but not spatially. However, multiple studies have demonstrated that the relationship between bacterial communities and aquatic physicochemical factors leads to different spatial distributions [53,54]. While we did not find a similar spatial variation, the temporal variation we observed is likely also due to fluctuations in environmental factors. Additionally, different regions may have similar bacterial community distribution because of a hydrodynamic “diffusion effect” [55,56,57]; this phenomenon may explain the similar spatial distribution of bacterial communities across different areas in Lake Taihu. Furthermore, the research area of this study was focused on southern Lake Taihu, which may have affected the interpretation of the spatial variation in bacterial community distribution. It is necessary to incorporate more research sites and sedimental analysis indicators of bacterial communities in response to spatiotemporal fluctuation in a water environment in future research.

5. Conclusions

This study investigated the key factors influencing differences in bacterial communities from the overlying water of Lake Taihu. Alpha diversity indices exhibited distinct seasonal patterns, primarily driven by temperature, conductivity, transparency, MCs, NH4+-N, NO3-N, and TN. While phylum-level composition remained stable (dominated by Cyanobacteria, Proteobacteria, Actinobacteriota, and Bacteroidota), genus-level dynamics revealed significant correlations: Microcystis PCC7914 showed strong positive associations with TP and MCs, whereas unidentified chloroplasts and the hgcl clade demonstrated negative correlations with these parameters. The primary environmental drivers shaping community structure were temperature, DO, ORP, NO3-N, TN, TP, and MCs, resulting in marked temporal variation and particularly complex interaction networks during autumn and winter. Bacterial metabolic function was predominantly influenced by temperature, conductivity, transparency, NO2-N, TP, and MCs. A notable limitation was the exclusive focus on southern Lake Taihu, precluding an assessment of lake-wide spatial dynamics. Future research should incorporate broader spatial sampling to fully characterize bacterial community variation and predict aggregation patterns. These findings establish specific bacterial taxa as reliable bioindicators for water quality monitoring, providing a scientific basis for developing targeted eutrophication management strategies to promote the ecological sustainability of Lake Taihu.

Supplementary Materials

The following supporting information can be downloaded at https://www.mdpi.com/article/10.3390/w17152222/s1, Figure S1: Principal component analysis (PCA) plot of environmental factors. (a) water quality parameters; (b) nitrogen and phosphorus nutrients. Figure S2: Sparse curve of bacterial genera in overlying water from southern Lake Taihu. Mar, March; Jun, June; Aug, August; Sep, September; Oct, October; Dec, December; Feb, February; CW, water samples of C area; DW, water samples of D area; LW, water samples of L area; RW, water samples of R area. Figure S3: Venn diagram of bacterial ASVs from overlying water samples of southern Lake Taihu. (a) seasons; (b) areas. Figure S4: Spearman correlations between environmental factors and alpha bacterial diversity. *, p < 0.05, **, p < 0.01. Figure S5: Difference analysis of bacterial communities at the phylum level (a) and genus level (b). *, p < 0.05, **, p < 0.01; Kruskal–Wallis with Dunn’s post hoc test. Figure S6: PICRUSt2 predictions of KEGG metabolic pathways enriched by bacterial communities in overlying water. Figure S7: Proportion of variance explained by environmental factors and microcystins (MCs) on bacterial community structure (a) and KEGG metabolic pathways (b). Table S1: Alpha diversity indices of bacterial community based on the 16S rRNA gene sequence. Table S2: Normality test of alpha diversity indices. Table S3: Kruskal–Wallis test of alpha diversity indices. Table S4: Dunn’s post hoc test of alpha diversity indices. Table S5: Normality test of bacterial communities at the phylum level. Table S6: Kruskal–Wallis test of bacterial communities at the phylum level. Table S7: Dunn’s post hoc test of bacterial communities at the phylum level; Table S8: Normality test of bacterial communities at the genus level. Table S9: Kruskal–Wallis test of bacterial communities at the genus level. Table S10: Dunn’s post hoc test of bacterial communities at the genus level. Table S11: RDA of environmental parameters and dominant genera. Table S12: RDA of environmental parameters and dominant KEGG metabolic pathways.

Author Contributions

Conceptualization, Methodology, Data Curation, Visualization, Formal analysis, Writing—Original Draft, D.X.; Investigation, Data Curation, X.M., S.K.; Conceptualization, Methodology, Funding Acquisition, Supervision, A.H., Y.I.; Writing—Review and Editing, T.H., M.Z. All authors have read and agreed to the published version of the manuscript.

Funding

This research was funded by the National Key Research and Development Program of China (grant numbers 2018YFE0103700).

Data Availability Statement

Data can be obtained from the author upon reasonable request.

Acknowledgments

We thank all members of the hydrosphere research group of the College of Life and Environmental Science, Wenzhou University, China, for their assistance during this study.

Conflicts of Interest

The authors declare no conflicts of interest.

Abbreviations

ASVs, amplicon sequence variants; Chl-a, chlorophyll-a; DO, dissolved oxygen; EC, electrical conductivity; EMCs, extracellular microcystins; IMCs, intracellular microcystins; KEGG, Kyoto Encyclopedia of Genes and Genomes; LEfSe, linear discriminant analysis effect size; MCs, microcystins; NMDS, non-metric multidimensional scaling; NO3-N, nitrate; NO2-N, nitrite; NH4+-N, ammonium; ORP, oxidation–reduction potential; OPLS-DA, orthogonal partial least squares discriminant analysis; PO4+-P, phosphate; PCA, principal component analysis; PCoA, principal coordinate analysis; RDA, redundancy analysis; TMCs, total microcystins; TN, total nitrogen; TP, total phosphorus; VPA, variation partitioning analysis.

References

  1. Awual, M.R. An efficient composite material for selective lead(ii) monitoring and removal from wastewater. J. Environ. Chem. Eng. 2019, 7, 103087. [Google Scholar] [CrossRef]
  2. Kubra, K.T.; Salman, M.S.; Hasan, M.N.; Islam, A.; Hasan, M.M.; Awual, M.R. Utilizing an alternative composite material for effective copper(ii) ion capturing from wastewater. J. Mol. Liq. 2021, 336, 116325. [Google Scholar] [CrossRef]
  3. Salman, M.S.; Hasan, M.N.; Kubra, K.T.; Hasan, M.M. Optical detection and recovery of Yb(iii) from waste sample using novel sensor ensemble nanomaterials. Microchem. J. 2021, 162, 105868. [Google Scholar] [CrossRef]
  4. Awual, M.R. Novel conjugated hybrid material for efficient lead(ii) capturing from contaminated wastewater. Mater. Sci. Eng. 2019, 101, 686–695. [Google Scholar] [CrossRef] [PubMed]
  5. Hasan, M.M.; Shenashen, M.A.; Hasan, M.N.; Znad, H.; Salman, M.S.; Awual, M.R. Natural biodegradable polymeric bioadsorbents for efficient cationic dye encapsulation from wastewater. J. Mol. Liq. 2021, 323, 114587. [Google Scholar] [CrossRef]
  6. Kubra, K.T.; Salman, M.S.; Hasan, M.N.; Islam, A.; Teo, S.H.; Hasan, M.M.; Sheikh, M.C.; Awual, M.R. Sustainable detection and capturing of cerium(iii) using ligand embedded solid-state conjugate adsorbent. J. Mol. Liq. 2021, 338, 116667. [Google Scholar] [CrossRef]
  7. Kubra, K.T.; Salman, M.S.; Znad, H.; Hasan, M.N. Efficient encapsulation of toxic dye from wastewater using biodegradable polymeric adsorbent. J. Mol. Liq. 2021, 329, 115541. [Google Scholar] [CrossRef]
  8. Zhang, Y.; Zhang, H.; Chang, F.; Xie, P.; Liu, Q.; Duan, L.; Wu, H.; Zhang, X.; Peng, W.; Liu, F. In-situ responses of phytoplankton to graphene photocatalysis in the eutrophic lake Xingyun, southwestern China. Chemosphere 2021, 278, 130489. [Google Scholar] [CrossRef] [PubMed]
  9. Liu, L.; Dong, Y.; Kong, M.; Zhou, J.; Zhao, H.; Tang, Z.; Zhang, M.; Wang, Z. Insights into the long-term pollution trends and sources contributions in Lake Taihu, China using multi-statistic analyses models. Chemosphere 2020, 242, 125272. [Google Scholar] [CrossRef] [PubMed]
  10. Wu, B.; Dai, S.; Wen, X.; Qian, C.; Luo, F.; Xu, J.; Wang, X.; Li, Y.; Xi, Y. Chlorophyll-nutrient relationship changes with lake type, season and small-bodied zooplankton in a set of subtropical shallow lakes. Ecol. Indic. 2022, 135, 108571. [Google Scholar] [CrossRef]
  11. Zhang, J.; Ding, X.; Guan, R.; Zhu, C.; Xu, C.; Zhu, B.; Zhang, H.; Xiong, Z.; Xue, Y.; Tu, J.; et al. Evaluation of different 16S rRNA gene V regions for exploring bacterial diversity in a eutrophic freshwater lake. Sci. Total Environ. 2018, 618, 1254–1267. [Google Scholar] [CrossRef] [PubMed]
  12. Zheng, R.; Li, P.; Bai, Q.; Li, Q.; Hao, Z.; Yu, S.; Cai, Y.; Liu, J. Spatial distribution, temporal variations and source of titanium dioxide nanoparticles in Taihu Lake, China. Sci. Total Environ. 2024, 951, 175481. [Google Scholar] [CrossRef] [PubMed]
  13. Xiong, J.; Lin, C.; Cao, Z.; Hu, M.; Xue, K.; Chen, X.; Ma, R. Development of remote sensing algorithm for total phosphorus concentration in eutrophic lakes: Conventional or machine learning? Water Res. 2022, 215, 118213. [Google Scholar] [CrossRef] [PubMed]
  14. Wu, T.; Zhu, G.; Wang, Z.; Zhu, M.; Xu, H. Seasonal dynamics of odor compounds concentration driven by phytoplankton succession in a subtropical drinking water reservoir, southeast China. J. Hazard. Mater. 2022, 425, 128056. [Google Scholar] [CrossRef] [PubMed]
  15. Gao, M.; Xu, C.; Yang, S.; Li, B. Investigating the effects of inflow river water quality on lake nutrient-concentration variations: A case study in Gehu Lake, China. Mar. Freshw. Res. 2023, 74, 865–876. [Google Scholar] [CrossRef]
  16. Chen, J.; Liu, X.; Chen, J.; Jin, H.; Wang, T.; Zhu, W.; Li, L. Underestimated nutrient from aquaculture ponds to Lake Eutrophication: A case study on Taihu Lake Basin. J. Hydrol. 2024, 630, 130749. [Google Scholar] [CrossRef]
  17. Song, N.; Jiang, H. Coordinated photodegradation and biodegradation of organic matter from macrophyte litter in shallow lake water: Dual role of solar irradiation. Water Res. 2020, 172, 115516. [Google Scholar] [CrossRef] [PubMed]
  18. Liu, S.; Hou, J.; Suo, C.; Chen, J.; Liu, X.; Fu, R.; Wu, F. Molecular-level composition of dissolved organic matter in distinct trophic states in Chinese lakes: Implications for eutrophic lake management and the global carbon cycle. Water Res. 2022, 217, 118438. [Google Scholar] [CrossRef] [PubMed]
  19. Sun, Z.; Luo, J.; Xu, Y.; Zhai, J.; Cao, Z.; Ma, J.; Qi, T.; Shen, M.; Gu, X.; Duan, H. Coordinated dynamics of aquaculture ponds and water eutrophication owing to policy: A case of Jiangsu province, China. Sci. Total Environ. 2024, 927, 172194. [Google Scholar] [CrossRef] [PubMed]
  20. Zhang, J.; Wang, Z.; Song, Z.; Xie, Z.; Li, L.; Song, L. Bioaccumulation of microcystins in two freshwater gastropods from a cyanobacteria-bloom plateau lake, Lake Dianchi. Environ. Pollut. 2012, 164, 227–234. [Google Scholar] [CrossRef] [PubMed]
  21. Zuo, J.; Hu, L.; Shen, W.; Zeng, J.; Li, L.; Song, L.; Gan, N. The involvement of α—Proteobacteria Phenylobacterium in maintaining the dominance of toxic Microcystis blooms in lake Taihu, China. Environ. Microbiol. 2020, 23, 1066–1078. [Google Scholar] [CrossRef] [PubMed]
  22. Yancey, C.E.; Mathiesen, O.; Dick, G.J. Transcriptionally active nitrogen fixation and biosynthesis of diverse secondary metabolites by dolichospermum and aphanizomenon-like cyanobacteria in western lake Erie microcystis blooms. Harmful Algae 2023, 124, 102408. [Google Scholar] [CrossRef] [PubMed]
  23. Tanvir, R.U.; Hu, Z.; Zhang, Y.; Lu, J. Cyanobacterial community succession and associated cyanotoxin production in hypereutrophic and eutrophic freshwaters. Environ. Pollut. 2021, 290, 118056. [Google Scholar] [CrossRef] [PubMed]
  24. Ren, X.; Mao, M.; Feng, M.; Peng, T.; Long, X.; Yang, F. Fate, abundance and ecological risks of microcystins in aquatic environment: The implication of microplastics. Water Res. 2024, 251, 121121. [Google Scholar] [CrossRef] [PubMed]
  25. Jin, X.; Tu, Q. Survey Specification for Lake Eutrophication, 2nd ed.; China Environmental Science: Beijing, China, 1990. [Google Scholar]
  26. GB3838-2002; The Surface Water Environmental Quality Standard. China Environmental Science Press: Beijing, China, 2002. (In Chinese)
  27. Fadrosh, D.W.; Ma, B.; Gajer, P.; Sengamalay, N.; Ott, S.; Brotman, R.M.; Ravel, J. An improved dual-indexing approach for multiplexed 16S rRNA gene sequencing on the Illumina MiSeq platform. Microbiome 2014, 2, 6. [Google Scholar] [CrossRef] [PubMed]
  28. Zeng, Q.; An, S. Identifying the biogeographic patterns of rare and abundant bacterial communities using different primer sets on the Loess Plateau. Microorganisms 2021, 9, 139. [Google Scholar] [CrossRef] [PubMed]
  29. Duan, L.; Li, J.; Yin, L.; Luo, X.; Ahmad, M.; Fang, B.; Li, S.; Deng, Q.; Wang, P.; Li, W. Habitat-dependent prokaryotic microbial community, potential keystone species, and network complexity in a subtropical estuary. Environ. Res. 2022, 212, 113376. [Google Scholar] [CrossRef] [PubMed]
  30. Chen, J.; Zhang, J.; Wang, C.; Wang, P.; Gao, H.; Zhang, B.; Feng, B. Nitrate input inhibited the biodegradation of erythromycin through affecting bacterial network modules and keystone species in lake sediments. J. Environ. Manag. 2024, 355, 120530. [Google Scholar] [CrossRef] [PubMed]
  31. Ma, S.; Qiao, L.; Liu, X.; Zhang, S.; Zhang, L.; Qiu, Z.; Yu, C. Microbial community succession in soils under long-term heavy metal stress from community diversity-structure to KEGG function pathways. Environ. Res. 2022, 214, 113822. [Google Scholar] [CrossRef] [PubMed]
  32. Buttigieg, P.L.; Ramette, A. A guide to statistical analysis in microbial ecology: A community-focused, living review of multivariate data analyses. FEMS Microbiol. Ecol. 2014, 90, 543–550. [Google Scholar] [CrossRef] [PubMed]
  33. Gu, Z.; Liu, K.; Pedersen, M.W.; Wang, F.; Chen, Y.; Zeng, C.; Liu, Y. Community assembly processes underlying the temporal dynamics of glacial stream and lake bacterial communities. Sci. Total Envrion. 2021, 761, 143178. [Google Scholar] [CrossRef] [PubMed]
  34. Lai, J.; Zou, Y.; Zhang, J.; Peres-Neto, P.R. Generalizing hierarchical and variation partitioning in multiple regression and canonical analyses using the rdacca.hp R package. Methods Ecol. Evol. 2022, 13, 782–788. [Google Scholar] [CrossRef]
  35. Edition, F. Guidelines for Drinking-Water Quality; 4th edition incorporating the first and second addenda; World Health Organization: Genevan, Switzerland, 2022; pp. 430–433. [Google Scholar]
  36. Chorus, I.; Welker, M. Toxic Cyanobacteria in Water: A Guide to Their Public Health Consequences, Monitoring and Management; Taylor & Francis Group: London, UK, 2021. [Google Scholar]
  37. Cai, J.; Li, Q.; Pang, Y.; Yang, X. Relationship between extra-cellular microcystin and intra-cellular microcystin. J. Hydraul. Eng. 2009, 40, 328–334. [Google Scholar]
  38. Yu, L.; Zhu, G.; Kong, F.; Li, S.; Shi, X.; Zhang, M.; Yang, Z.; Xu, H.; Zhu, M. Spatiotemporal characteristics of microcystin variants composition and associations with environmental parameters in Lake Chaohu, China. J. Lake Sci. 2019, 31, 700–713. [Google Scholar] [CrossRef]
  39. Shu, X.; Xie, L.; Wang, X.; Yao, L.; Xue, Q.; Li, J. Vertical distribution characteristics of microcystin concentration in water and sediment of Meiliang Bay, Lak Taihu. J. Lake Sci. 2019, 31, 976–987. [Google Scholar]
  40. Wang, Y.; Guo, X.; Lu, S.; Song, D.; Jiang, Y.; Yang, L. Spatial distribution, related environmental factors and health risk assessment of microcystins in Lake Qilu, a eutrophic plateau lake. J. Lake Sci. 2024, 36, 52–63. [Google Scholar] [CrossRef] [PubMed]
  41. Bao, Z. The Temporal and Spatial Variation of Aquatic Phytoplankton and Microcystin in Dianchi Lake and the Removal of Microcystin with Bacteria. Master’s Thesis, Yunnan University, Kunming, China, 2012. [Google Scholar]
  42. Wang, M.; Liu, X.; Chen, Q.; Yi, Q.; Liu, Z. Spatio-temporal distribution of microcystins and microcystin-producing cells in the Yanghe Reservoir. Acta Sci. Circumstantiae 2017, 37, 1307–1315. [Google Scholar] [CrossRef]
  43. Wang, J.; Zou, H.; Zhang, Q.; Chen, L.; Wang, Z. Spatial and temporal distribution of microcystin in Taihu Lake. Res. Environ. Sci. 2014, 27, 696–703. [Google Scholar]
  44. Zeng, J.; Jiao, C.; Zhao, D.; Xu, H.; Huang, R.; Cao, X.; Yu, Z.; Wu, L. Patterns and assembly processes of planktonic and sedimentary bacterial community differ along a trophic gradient in freshwater lakes. Ecol. Indic. 2019, 106, 105491. [Google Scholar] [CrossRef]
  45. Xu, H.; Zhao, D.; Zeng, J.; Jiao, C.; Yu, Z.; Wu, Q.L. Distinct successional patterns and processes of free-living and particle-attached bacterial communities throughout a phytoplankton bloom. Freshw. Biol. 2020, 65, 1363–1375. [Google Scholar] [CrossRef]
  46. Ma, J.; Qin, B.; Paerl, H.W.; Brookes, J.D.; Hall, N.S.; Shi, K.; Zhou, Y.; Guo, J.; Li, Z.; Xu, H.; et al. The persistence of cyanobacterial (Microcystis spp.) blooms throughout winter in Lake Taihu, China. Limnol. Oceanogr. 2016, 61, 711–722. [Google Scholar] [CrossRef]
  47. Dowd, S.E.; Callaway, T.R.; Wolcott, R.D.; Sun, Y.; McKeehan, T.; Hagevoort, R.G.; Edrington, T.S. Evaluation of the bacterial diversity in the feces of cattle using 16S rDNA bacterial tag-encoded FLX amplicon pyrosequencing (bTEFAP). BMC Microbiol. 2008, 8, 125. [Google Scholar] [CrossRef] [PubMed]
  48. Yang, C.; Zeng, Z.; Zhang, H.; Gao, D.; Wang, Y.; He, G.; Liu, Y.; Wang, Y.; Du, X. Distribution of sediment microbial communities and their relationship with surrounding environmental factors in a typical rural river, Southwest China. Environ. Sci. Pollut. Res. 2022, 29, 84206–84225. [Google Scholar] [CrossRef] [PubMed]
  49. Hou, T.; Liu, J.; Yao, Y.; Chen, K.; Mao, C.; Zhang, J.; Li, Z.; Zhang, K.; Yang, P. Regulation and microbial response mechanism of nitric oxide to copper-containing swine wastewater treated by Pistia stratiotes. Environ. Pollut. 2024, 359, 124560. [Google Scholar] [CrossRef] [PubMed]
  50. Zhao, T.; Hu, H.; Chow, A.T.; Chen, P.; Wang, Y.; Xu, X.; Gong, Z.; Huang, S. Evaluation of organic matter and nitrogen removals, electricity generation and bacterial community responses in sediment microbial fuel cell coupled with Vallisneria natans. J. Environ. Chem. Eng. 2023, 11, 110058. [Google Scholar] [CrossRef]
  51. He, H.; Sun, N.; Li, L.; Zhou, H.; Yang, X.; Ai, J.; Yang, X.; Hu, C.; Wang, D.; Zhang, W. Enhanced removal of biolabile oxygen depleted dissolved organic matter by coagulation-adsorption process improves biological stability of reclaimed water. Chem. Eng. J. 2024, 500, 157156. [Google Scholar] [CrossRef]
  52. Serrana, J.M.; Li, B.; Watanabe, K. Cross-taxa assessment of species diversity and phylogenetic structure of benthic communities in a dam-impacted river undergoing habitat restoration. Sci. Total Environ. 2025, 958, 177886. [Google Scholar] [CrossRef] [PubMed]
  53. Li, Y.; Ma, J.; Shen, X.; Li, X.; Zhang, R.; Niu, Y.; Cui, B. Quantitative effects of anthropogenic and natural factors on the spatial distribution of heavy metals and bacterial communities in sediments of the Pearl River Delta. Environ. Technol. Innov. 2024, 35, 103648. [Google Scholar] [CrossRef]
  54. Peng, S.; Bi, R.; Liu, J.; Cui, J.; Fu, X.; Xiao, X.; Li, R.; Jiang, Z.; Xu, S.; Zhang, C.; et al. Spatial distribution of bacteria in response to phytoplankton community and multiple environmental factors in surface waters in Sanggou Bay. Mar. Environ. Res. 2025, 204, 106912. [Google Scholar] [CrossRef] [PubMed]
  55. Portas, A.; Carriot, N.; Ortalo-Magné, A.; Damblans, G.; Thiébaut, M.; Culioli, G.; Quillien, N.; Briand, J.F. Impact of hydrodynamics on community structure and metabolic production of marine biofouling formed in a highly energetic estuary. Mar. Environ. Res. 2023, 192, 106241. [Google Scholar] [CrossRef] [PubMed]
  56. Wang, H.; Zhang, W.; Li, Y.; Gao, Y.; Niu, L.; Zhang, H.; Wang, L. Hydrodynamics-driven community coalescence determines ecological assembly processes and shifts bacterial networks stability in river bends. Sci. Total Environ. 2023, 858, 159772. [Google Scholar] [CrossRef] [PubMed]
  57. Li, Y.; Chen, J.; Wang, L.; Wang, D.; Niu, L.; Zheng, J. Hydrodynamic disturbance and nutrient accumulation co-shape the depth-dependent prokaryotic community assembly in intertidal sediments of a mountainous river estuary. J. Hydrol. 2025, 651, 132580. [Google Scholar] [CrossRef]
Figure 1. The distribution of sampling sites in southern Lake Taihu. C1–C3, sampling sites in C area; D1–D3, sampling sites in D area; L1–L3, sampling sites in L area; R1–R3, sampling sites in R area.
Water 17 02222 g001
Figure 2. Spatiotemporal variations in standard water quality indicators in the overlying water column of southern Lake Taihu. (a) Water temperature; (b) electrical conductivity (EC); (c) oxidation–reduction potential (ORP); (d) dissolved oxygen (DO); (e) pH; (f), transparency (SD). C and D, closed water areas; L, open water area; R, river area.
Water 17 02222 g002
Figure 3. Spatiotemporal variations in nitrogen and phosphorus nutrients in the overlying water column of southern Lake Taihu. (a) Total nitrogen (TN); (b) total phosphorus (TP); (c) nitrate (NO3-N); (d) nitrite (NO2-N); (e) ammonium (NH4+-N); (f) phosphate (PO43−-P). C and D, closed water areas; L, open water area; R, river area.
Water 17 02222 g003
Figure 4. Spatiotemporal variations in MC concentrations in the overlying water column of southern Lake Taihu. IMCs, intracellular microcystins; EMCs, extracellular microcystins; TMCs, total microcystins. **, Dunn’s test, p < 0.01.
Water 17 02222 g004
Figure 5. Spatiotemporal variations in alpha diversity indices of bacteria in the overlying water column of southern Lake Taihu. (a) seasons; (b) areas. Center lines, box bounds, and whiskers represent the median, interquartile range (IQR) and 1.5 × IQR, respectively. p, overall differences between spatiotemporal groups (the Kruskal–Wallis test); * and **, significant pairwise comparisons (Dunn’s post-hoc test; *, p < 0.05, **, p < 0.01).
Water 17 02222 g005
Figure 6. Principal coordinate analysis (PCoA) of bacterial amplicon sequence variants (ASVs) in the overlying water column of southern Lake Taihu. (a) seasons; (b) areas.
Water 17 02222 g006
Figure 7. Bacterial community structure and OPLS-DA at phylum (a,c) and genus (b,d) levels. Mar, March; Jun, June; Aug, August; Sep, September; Oct, October; Dec, December; Feb, February; CW, water samples of C area; DW, water samples of D area; LW, water samples of L area; RW, water samples of R area.
Water 17 02222 g007
Figure 8. Redundancy analysis (a) and Spearman correlation analysis (b) of bacterial genera with environmental factors and MCs. *, p < 0.05, **, p < 0.01.
Water 17 02222 g008
Figure 9. Redundancy analysis (a) and Spearman correlation analysis (b) of bacterial metabolic function with environmental factors and MCs. *, p < 0.05, **, p < 0.01.
Water 17 02222 g009
Figure 10. Molecular ecological network and node partitioning. Only nodes with clustering coefficient > 0 are displayed for networks in (a) spring, (b) summer, (c) autumn and (d) winter. Node color indicates different modules. Node size reflects within-module degree.
Water 17 02222 g010
Table 1. Results of Spearman’s correlations between MCs and environmental factors.
FactorsTMCsEMCsIMCs
Water temperature0.381 *0.345 *0.369 *
EC0.2340.1370.23
DO−0.327 *−0.379 *−0.316 *
pH0.087−0.1170.104
ORP0.110.2050.057
Water transparency−0.335 *−0.26−0.336 *
TN−0.273−0.099−0.287
TP0.613 **0.624 **0.574 **
NO3-N−0.555 **−0.279−0.573 **
NO2-N−0.1350.015−0.146
NH4+-N0.1170.120.128
PO43−-P0.1340.1370.159
Notes: *, p < 0.05; **, p < 0.01; EC, electrical conductivity; DO, dissolved oxygen; ORP, oxidation–reduction potential; TN, total nitrogen; TP, total phosphorus.
Table 2. Topological properties of molecular ecological networks in four areas across four seasons.
Topological ParametersTopological ParametersSpringSummerAutumnWinter
ContextTotal nodes60547664
Total edges3864701166816
Network overviewAverage degree12.917.430.7 *25.5 *
Average weighted degree10.614.326.2 *21.3 *
Network diameter7586
Graph density0.20.30.4 *0.4 *
Connected components1211
Community detectionModularity0.40.30.20.3
Statistical inference885.81125.72002.41654.2
Node overviewAverage clustering coefficient0.60.70.8 *0.7 *
Edge overviewAverage path length2.41.92.01.9
Note: *, significant differences between the four seasons (Z-test, p < 0.001).
Disclaimer/Publisher’s Note: The statements, opinions and data contained in all publications are solely those of the individual author(s) and contributor(s) and not of MDPI and/or the editor(s). MDPI and/or the editor(s) disclaim responsibility for any injury to people or property resulting from any ideas, methods, instructions or products referred to in the content.

