Article

The Seasonal and Cross-Shore Distribution of Beach Litter Along Four Sites on the Northern Adriatic Coast (Ferrara, Italy)

by
Joana Buoninsegni
1,*,
Giorgio Anfuso
2,*,
Francisco Asensio-Montesinos
2,
Elena Marrocchino
1 and
Carmela Vaccaro
1
1
Department of Environmental Sciences and Prevention, University of Ferrara, Via Saragat 1, 44122 Ferrara, Italy
2
Department of Earth Sciences, Faculty of Marine and Environmental Sciences, University of Cádiz, Polígono Río San Pedro s/n, 11510 Puerto Real, Cadiz, Spain
*
Authors to whom correspondence should be addressed.
Water 2025, 17(15), 2173; https://doi.org/10.3390/w17152173
Submission received: 20 June 2025 / Revised: 15 July 2025 / Accepted: 16 July 2025 / Published: 22 July 2025
(This article belongs to the Section Oceans and Coastal Zones)

Abstract

This study investigated the presence and distribution of macrolitter along four beach sites on the Ferrara coast, North-eastern Italy. At each site, monitoring campaigns were conducted from summer 2023 to summer 2024 to assess seasonal and cross-shore fluctuations of litter items and their relations with local geomorphological features. Following the Marine Strategy Framework Directive, 5627 litter items were collected, with an average density of 0.61 ± 0.23 items/m2. Plastic was the dominant material, representing 94% of the total. The Clean Coast Index (CCI) was applied to evaluate beach cleanliness, seasonal patterns, and cross-shore litter distribution. Although the sites were generally classified as “Clean”, CCI values revealed a progressive decline in cleanliness from summer to spring. Litter was especially accumulated in the upper backshore and at the dune foot. All macrolitter items were classified by material, typology, and usage category to identify potential sources of release, following the Joint List of Litter Categories for Marine Macrolitter Monitoring. The “Top 10” of the most collected items was compiled per each site, season, and geomorphological zone. The results underscore the relevance of high-resolution monitoring programs to support the development of targeted management strategies for effective beach litter mitigation.

1. Introduction

Coastal areas represent relevant natural environments that contribute to a large number of important ecological, societal, and economic functions [1,2,3,4]. Beaches, dune ridges, salt marshes, and mangrove swamps constitute breeding and feeding areas for fishes, crustaceans, mammals, and birds and support numerous rural economies, e.g., due to salt harvesting and shellfish collection activities. These transitional zones between land and sea also serve as natural buffer areas that protect adjacent coastal ecosystems and human settlements from erosion and flooding associated with storms and hurricanes [5,6,7], whose effects are enhanced by climate change-related processes [8,9,10]. Additionally, these zones absorb nutrients and pollutants generated by land-based activities that drain to the sea via rivers and streams [11].
Coastal areas also have relevant economic value because of aquaculture and fishing, agricultural, tourism, industrial, and trade activities [12,13,14]. Sandy beaches have especially great economic relevance in the 20th century, when coastal visitors started to consider them ideal places for rest and relaxation, and therefore, beaches became a highly valued resource for aesthetic, cultural, economic, and historical reasons [15,16,17]. Coastal tourism is one of the world’s largest industries, and beaches play a major role in this market [18], since visitors are especially interested in enjoying the “Sun, Sea and Sand (3S) market”. Several authors have carried out a large number of inquiries in different European countries, with five parameters being identified as of utmost significance to coastal visitors, i.e., safety, facilities, water quality, scenery, and litter [19,20]. This paper deals with the latter.
Marine litter accumulation on beaches is strongly related to both natural and human variables. Litter arrives in seas and oceans worldwide, originating from land-based (ca. 80%) and marine-based (ca. 20%) sources [21,22]. Waste generated from land-based activities is transported to the sea by rivers, runoff waters, and winds or is abandoned by visitors on the beach. Marine-borne litter, which is linked to offshore installations and different shipping, fishing, and port activities, is discarded or accidentally lost into the sea [23,24,25,26].
When litter enters the ocean, most of it (ca. 70%) accumulates at the sea bottom, 15% remains on the water surface and column, and 15% is deposited in coastal environments [27]. On sandy beaches, litter has great mobility and variability [28] but tends to be trapped in dunes, salt marshes, mangrove swamps [29], and within protection structures [30]. The accumulation of litter on beaches has several different negative effects: it represents a hazard to swimmers and divers and a risk for beach users, who may suffer cuts or abrasion injuries [31,32], and it greatly affects beaches’ aesthetic quality, especially the presence of unattractive items, e.g., condoms; tampons; or medical waste such as syringes, vials, etc. The presence of such items affects recreational beach use, resulting in a loss of recreational beach attractiveness and tourism [33,34].
Litter also seriously impacts coastal and marine wildlife in different ways, especially because of plastic items that, on average, represent 60–80% of total marine litter due to their great durability and low rates of recovery [35,36,37].
According to the International Coastal Cleanup [38], lost or abandoned fishing gear and plastic bags are the most dangerous items to marine wildlife because fish, invertebrates, birds, reptiles, amphibians, and mammals may become entangled and/or mistake the items for food. The intentional or unintentional ingestion of plastic bags, food wrappers, and other items may produce internal ulcers, abrasions, bleeding, and/or digestive tract blockage [39]. Further, marine organisms are affected by chemicals linked to plastic items, which include plastic compounds, additives employed during the production process, and toxics adsorbed from seawater due to plastic’s long dispersal time in marine environments. Such toxics include persistent organic pollutants (POPs), heavy metals, polycyclic aromatic hydrocarbons (PAHs), polychlorinated biphenyls (PCBs), etc. [40,41,42]. All of the above compounds may accumulate in tissues of marine organisms, causing alterations in metabolic processes, endocrine disruption, and behavioral changes [43]. Lastly, plastic items, due to their great floatability and dispersal time in the marine environment, can act as vectors for the dispersal of invasive species [44,45]. Due to all the issues described above, plastic pollution is considered, after climate change, the second most relevant global environmental issue [46].
Regarding marine litter monitoring programs, most beach litter studies compare different beaches and/or seasons [28,29,47,48,49]. Few studies have investigated the beach litter distribution in relation to cross-shore coastal morphologies [50]. Several authors argue that the cross-shore distribution of litter is primarily driven by meteorological and marine conditions, such as waves, currents, and wind [25,50,51,52]. Corbau and colleagues highlighted the relevance of the interactions between eco-geomorphological features and hydrodynamic processes and recorded litter accumulation up to the storm berm and even within the dune vegetation zone [53].
The present study aims to investigate the seasonal and cross-shore distribution of macro beach litter along the coastline of Ferrara Province (Emilia-Romagna Region, North-eastern Italy). This area is frequently visited by tourists year-round, especially in the summer and on sunny days, due to its easy accessibility from nearby urban centers.

2. Study Area

The study area has significant ecological, tourist, and economic relevance. Fishing, aquaculture, agriculture, and hunting play crucial roles in the local economy. In 2023, the Emilia-Romagna Region produced 2,860,618 tons of municipal waste, 77.2% of which was collected for recycling (i.e., 19% paper, 8% plastic, 11% glass and metals, 3% construction materials, and 1% textiles), and 22.8% of which was undifferentiated waste (92% of which was incinerated, 5% was bio-stabilized, and 3% was landfilled) [54]. The coastal area examined in this study is located in the province of Ferrara (Emilia-Romagna Region), along the Italian side of the Northern Adriatic Sea, and south of the Po River Delta. The Po River is the most prominent Italian river, 675 km in length and with an average annual flow rate of approximately 1500 m3/s [55] (Figure 1). The Delta’s configuration is the result of different transformations due to natural forces and human activities that took place over the last millennia [56,57]. The Po Delta is divided into five main branches (Maistra, Pila, Tolle, Gnocca, and Po di Goro), presents a high risk of flooding because it is located below sea level, and relies on a continuous pumping operation to stay dry [58]. The area is especially sensitive to strong depressions from the Atlantic Ocean and/or prolonged southeastern winds, which prevent rivers from discharging into the Adriatic Sea [59]. In the Adriatic Sea, two dominant wind regimes drive the general circulation [60,61,62,63]: the Bora blows from the NE, giving rise to a SW coastal current; the Scirocco blows from the SE, giving rise to a NW coastal current and causing local sea level rise and associated flooding at Sacca di Goro. Additionally, river discharges and the Delta’s morphology significantly alter nearby coastal circulation [64,65,66].
The Delta’s coastal areas are typically characterized by sandy spits and barrier islands, with well-developed dune systems and gently sloping, sandy beaches [67]. Extensive wetlands and lagoon areas are constituted by Sacca di Goro and Valli di Comacchio. The Sacca di Goro, classified as a wetland of international importance, receives freshwater from the Po di Volano and Po di Goro rivers. Water exchanges with the Adriatic Sea occur through the main mouth and a network of periodically dredged inlets [65]. The Reno River supplies the Valli di Comacchio, a transitional brackish environment where water exchange is mostly artificially regulated by a system of sluices [68].
The study area is located within the Emilia-Romagna Regional Park of the Po Delta and includes Sites of Community Importance (SCIs) and Special Protection Areas (SPAs) of the Natura 2000 Network that were established under the Birds and Habitats Directives. This study assessed the distribution of beach litter across four seasons over the course of a one-year monitoring program at four sampling sites along the Ferrara coast (Figure 1). The cross-shore distribution of litter is related to the beach’s geomorphological features.

2.1. Goro Sampling Site

The Sacca di Goro is located in the southern part of the Po Delta and was formed in the 19th century. It is a lagoon comprising 35 km2, with an average depth of 1.5 m and a water volume of 51 × 106 m3 [63]. It is part of the Natura 2000 network, SCI–SPA IT4060005. This transitional environment, where freshwater meets seawater, is influenced by subsidence processes and receives freshwater inputs from the Po di Volano, the Canal Bianco, and the Po di Goro (Figure 1). Coastal drift transports fluvial and marine sediments and is influenced by prevailing winds, which cause transport to predominantly occur in an east–west direction along the Goro’s sandy spit [69,70] (Figure 1). The lagoon is one of the most important European sites for clam farming (Ruditapes philippinarum). However, rising temperatures, algal blooms, and the presence of invasive species, such as the blue crab (Callinectes sapidus), are putting increasing pressure on the local economy [71,72,73]. For this study, the internal northern beach of Sacca di Goro was selected (Figure 1a). It is backed by a rip-rap revetment and is quite small (714.24 m2), consisting of only a foreshore area, i.e., it does not feature a dry beach area.

2.2. Volano Sampling Site

The Volano sand spit is an area of erosion essentially linked to sediment supplies from the Reno River, Po di Goro, and Po di Volano (Figure 1). The spit is oriented parallel to the shoreline in a SW-NE direction and encloses the Sacca di Goro. The area contains two Natura 2000 SCI-SPA sites (IT4060005 and IT4060007). Numerous clam farms are located in the waters off the Volano spit. For this study, the southern beach of the Volano spit was selected because it shows the geomorphological zones of interest (Figure 1b).

2.3. Estensi Sampling Site

The Estensi sampling site consists of a well-developed beach and dune environment backed by the Valli di Comacchio (Figure 1). The Lido degli Estensi settlement is developed on coastal paleo-dunes, which reflect the eastward progress of the shoreline over the last few centuries. The Estensi site is located approximately 50 m south of the jetty at the mouth of the Porto Garibaldi harbor channel (Figure 1c), which interrupts longshore transport, forming a wide beach (>100 m). This is an accreting beach situated between other eroding beaches (i.e., Volano and Spina), exhibiting a clear distinction in its various geomorphological zones.

2.4. Spina Sampling Site

The Spina sampling site is located north of the Reno River mouth and is backed by the Valli di Comacchio (Figure 1). The site is rich in environments and ecosystems of significant conservation value [74], and it is part of the Po Delta Regional Park and the Natura 2000 Network (SCI-SPA IT4060003). Beyond the dune system are two internationally significant wetlands designated under the Ramsar Convention: Riserva Statale Sacche di Bellocchio and Valli Residue di Comacchio. However, the selected site is highly anthropized, limited to the north by a promontory artificially maintained through the placement of sandbags and wooden groins. Additionally, artificial structures have been installed to stabilize the dunes in the southern edge. Despite these human influences, the sampled beach retains its key geomorphological zones of interest (Figure 1d).

3. Materials and Methods

3.1. Survey Method

All surveys were conducted in accordance with the methodology outlined in the TG10 guidance document, “Guidance on Monitoring of Marine Litter in European Seas”, [75] created for the European Marine Strategy Framework Directive, with minor adjustments to the dimensions of the sampling units. Each unit was surveyed four times at seasonal intervals between July 2023 and July 2024 in order to collect and identify all macro beach litter, ranging in size from 2.5 to 50 cm [23,47,76]. Sampling sites were selected based on their proximity to ports, harbors, river mouths, urban coastal areas, and tourist destinations, or consisted of remote locations. All of them met the following criteria [47]: a minimum longshore length of 100 m, low to moderate slope (~1.5–4.5°), direct exposure to the sea (i.e., not fronted by breakwaters or other protective structures), and accessible year-round.
Exposed beach litter was collected within a standard sampling unit consisting of a 100-m-long sector parallel to the shoreline, divided into 10-m-long transects. The width of the sampling unit perpendicular to the shoreline depends on local conditions and beach profile characteristics. When necessary, it was further subdivided into five sub-transects based on local geomorphological features and slope gradients [77]. The different geomorphological zones surveyed were named as follows (Figure 1): swash zone (SZ), lower backshore (LB), upper backshore (UB), dune foot (DF, i.e., the seaward slope of the foredune), and dune crest (DC, i.e., the crest of the foredune). Their boundaries were gathered with a Leica GS16 dGPS (Leica Geosystems S.p.A., Muzza di Cornegliano Laudense, Lodi, Italy) and georeferenced according to the WGS 84 UTM 32 N coordinate system. At the Estensi site, the beach had an extensive cross-shore extension (>100 m), so a reduced longshore sampling unit, consisting of a 10-m-wide beach sector, was investigated (Figure 1c).

3.2. Data Collection and Processing

Four seasonal surveys were carried out for each site during summer and autumn of 2023 and winter and spring of 2024. Unfortunately, the beach initially identified for the Spina site (and sampled in summer 2023) was inaccessible in autumn 2023. Data collected in summer 2023 at Spina were discarded, and a new sampling site was selected and sampled in autumn 2023 and in winter, spring, and summer of 2024 (Figure 1d). All sites were sampled between 9 a.m. and 6 p.m., and the field operator covered the entire selected area by moving parallel to the coastline. All beach litter was collected in separate bags according to the geomorphological beach zones.
Each collected item was identified and categorized according to the “Macro Marine Litter Master List” [23,47,76]. This method is easy to apply, accurate, and takes into account 166 item categories included in eight litter macro categories. The density of beach litter items per square meter was calculated, and then the beach’s cleanliness status was evaluated using the Clean Coast Index (CCI, Table 1) [78,79].
Weight-based measurements were not considered in this study, as the weight of items can be greatly affected by various factors, as noted by other authors [48,80]. For example, collected items may contain liquids of various origins, be covered by sediments or biofouling, or be saturated with seawater.
To correlate the litter distribution with sea state throughout the entire survey period, wave parameters were obtained from the Regional Agency for Prevention, Environment and Energy (ARPAE) of Emilia-Romagna. The data consist of four daily average significant wave height values recorded by the Nausicaa2 wave buoy off the coast of Cesenatico (Ravenna, Italy).
A “Top 10” list of litter items was obtained for each site, season, and geomorphological zone investigated in order to identify the most frequently occurring items [81]. Determining the exact source of beach litter is often complex and uncertain [82]. For this reason, all litter items were classified by use categories according to the “Joint List of Litter Categories for Marine Macrolitter Monitoring” [83]. This list uses a hierarchical system to classify items by function and allows for the addition of new categories if needed, simplifying data grouping for further analysis. The system uses a specific code to identify the following use categories: agriculture-related (AG), aquaculture-related (AQ), building- and construction-related (CO), clothing (CL), fisheries-related (FI), food consumption-related (FC), hunting-related (HU), medical-related (MD), personal hygiene- and care-related (HY), recreation-related (RE), smoking-related (SM), undefined use (NN), and vehicle-related (VK). Items associated with fishing and aquaculture activities can be unequivocally attributed to marine-based sources. It is not easy to determine the exact origin of the release of all other categories. A conversion was carried out to align the categories used in the Master List with the more detailed categories provided in the Joint List. However, the Joint List does not account for certain items from the Macro Litter Master List identified during this study, such as items within the “Artificial polymer materials” macro category with dimensions < 2.5 cm (“G75—Plastic/polystyrene pieces 0–2.5 cm”; “G78—Plastic pieces 0–2.5 cm”; “G81—Polystyrene pieces 0–2.5 cm”). Therefore, to ensure comprehensive data acquisition and in accordance with the Joint List-Manual for the application of the classification system [83], three new items were added. The new codes, J9902, J9903, and J9904, were used to identify items previously associated with codes G75, G78, and G81. All of these new codes were assigned to the NN use category.

3.3. Statistical Analyses

To verify the possible differences in litter abundance among sites, seasons, and geomorphological zones, a Kruskal-Wallis test was conducted using R Studio (version 2025.05.0+496) [84] and non-parametric multidimensional scaling (nMDS), executed with PRIMER V.6 + PERMANOVA (Plymouth Marine Laboratory, Plymouth, UK). In this representation, data points correspond to samples, and their spatial separation reflects the observed degree of dissimilarity [85]. As a supplementary classification approach to the nMDS, cluster analyses were also implemented. Prior to this, the raw data were normalized by converting item counts per beach to density values (items/m2), and a fourth-root transformation was applied due to the characteristics and value distribution of the data. All statistical evaluations were conducted using a significance threshold of α = 0.05.

4. Results and Discussion

4.1. Beach Litter Abundance and Composition

In each season, a total amount of 9236 m2 of beach surface was surveyed at the selected sites, and 5627 macro beach litter items were collected (Table 2): 509 items at Goro (0.71 items/m2); 2258 items at Volano (0.94 items/m2); 495 items at Estensi (0.47 items/m2); 2365 items at Spina (0.47 items/m2). Based on the average number of items collected across the four seasonal surveys at each site, the CCI application enabled the classification of all sites as “Clean” (Goro, CCI = 3.56; Volano, CCI = 4.69; Estensi, CCI = 2.33; Spina, CCI = 2.34).
The greatest abundance of litter (Table 2) was observed at Volano in spring 2024 (0.47 items/m2) and the lowest at Spina in summer 2024 (0.07 items/m2), despite an increase in beach users during the survey period. The results obtained at Volano are consistent with previous studies conducted at the same site in spring 2015, which reported a litter density of 0.57 items/m2 [86]. Studies conducted along the Spanish coast and the Moroccan Mediterranean coast demonstrated a correlation between tourist influx and an increase in beach litter [48,87,88,89,90]. However, the results of the summer survey at the Spina site suggest that the diminished presence of litter during the summer is primarily due to beach-cleaning initiatives, which are typically implemented from June to September. Other authors conducting comparative studies across multiple beaches in the Adriatic-Ionian macro-region have reported similar findings [47]; these authors observed the lowest litter densities on beaches in Bosnia-Herzegovina, which are regularly cleaned by adjacent hotel resorts, compared to other surveyed sites (Albania, Croatia, Greece, Italy, Montenegro, and Slovenia). The Spina site is located in front of a four-star campsite, suggesting that beach cleaning operations were likely conducted with greater attention during the summer.
The average litter density observed in this study (0.61 items/m2 ± 0.16 SD) (Table 2) is higher than the values reported in other studies conducted on the Northern Italian Adriatic coast (from 0.30 to 0.35 items/m2) [47,91]. The beach litter density in the Mediterranean Sea varies considerably: 0.2 items/m2 were found along the Albanian Adriatic and Ionian coastlines [92,93], 0.05–0.06 items/m2 were recorded for the Moroccan and Greek Mediterranean regions [87,94], and 0.12 items/m2 were found along the Alicante Spanish coast [48]. Table 3 summarizes the average litter densities recorded in this study and values reported in other investigations conducted in the Mediterranean Sea. The mean litter abundance collected along the Istanbul coast (Marmara Sea, Turkey) was 5.50 ± 4.46 items/m2 [95], which is much higher than the values reported in this paper. A recent citizen science study across 12,000 km of the eastern Pacific coast of Latin America (Mexico, Guatemala, El Salvador, Costa Rica, Panama, Colombia, Ecuador, Peru, and Chile) reported densities ranging from 0.46 to 2.26 items/m2 [96]. The observed data suggest that the beach litter abundance depends on a combination of local environmental factors (e.g., sea state and coastal morphology) and anthropogenic factors (e.g., human behavior and waste management strategies) [97,98,99,100,101,102,103,104].
According to the “Macro Marine Litter Master List” [23,47,76], the beach litter composition collected over the course of a year can be referred to as belonging to one of eight macro categories of materials: artificial polymer materials, rubber, cloth/textile, paper/cardboard, processed/worked wood, metal, glass/ceramics, unidentified materials and/or chemicals. These macro categories correspond to 112 item categories. On average, 39 different categories were recorded per beach, indicating a relatively high degree of diversity.
Plastic accounted for 93.89% of all items collected across the four sampling sites. Other major material categories (glass/ceramics, textiles, rubber, paper, processed wood, metal, and unidentified/chemical substances) were minimally represented (<4%, Figure 2e). This pattern is consistent with previous studies conducted in the Adriatic Sea, the Mediterranean Basin, and other locations worldwide [47,81,87,114,115,116,117,118,119,120]. Plastics are estimated to comprise 60–80% of all marine debris, reaching or exceeding 95% in certain regions [35,36]. For example, plastics have been reported to comprise over 94% of total debris along the Croatian coast [108] and along the beaches of Central Vietnam [121], further emphasizing the ubiquity and persistence of plastic pollution in diverse coastal environments.
The litter composition varied from site to site, with substantial differences in material types (Figure 2). One exception of particular relevance was recorded at the Goro site in autumn 2023, when glass fragments accounted for 42% of the total litter, probably due to the recent breakage of one or more glass objects.
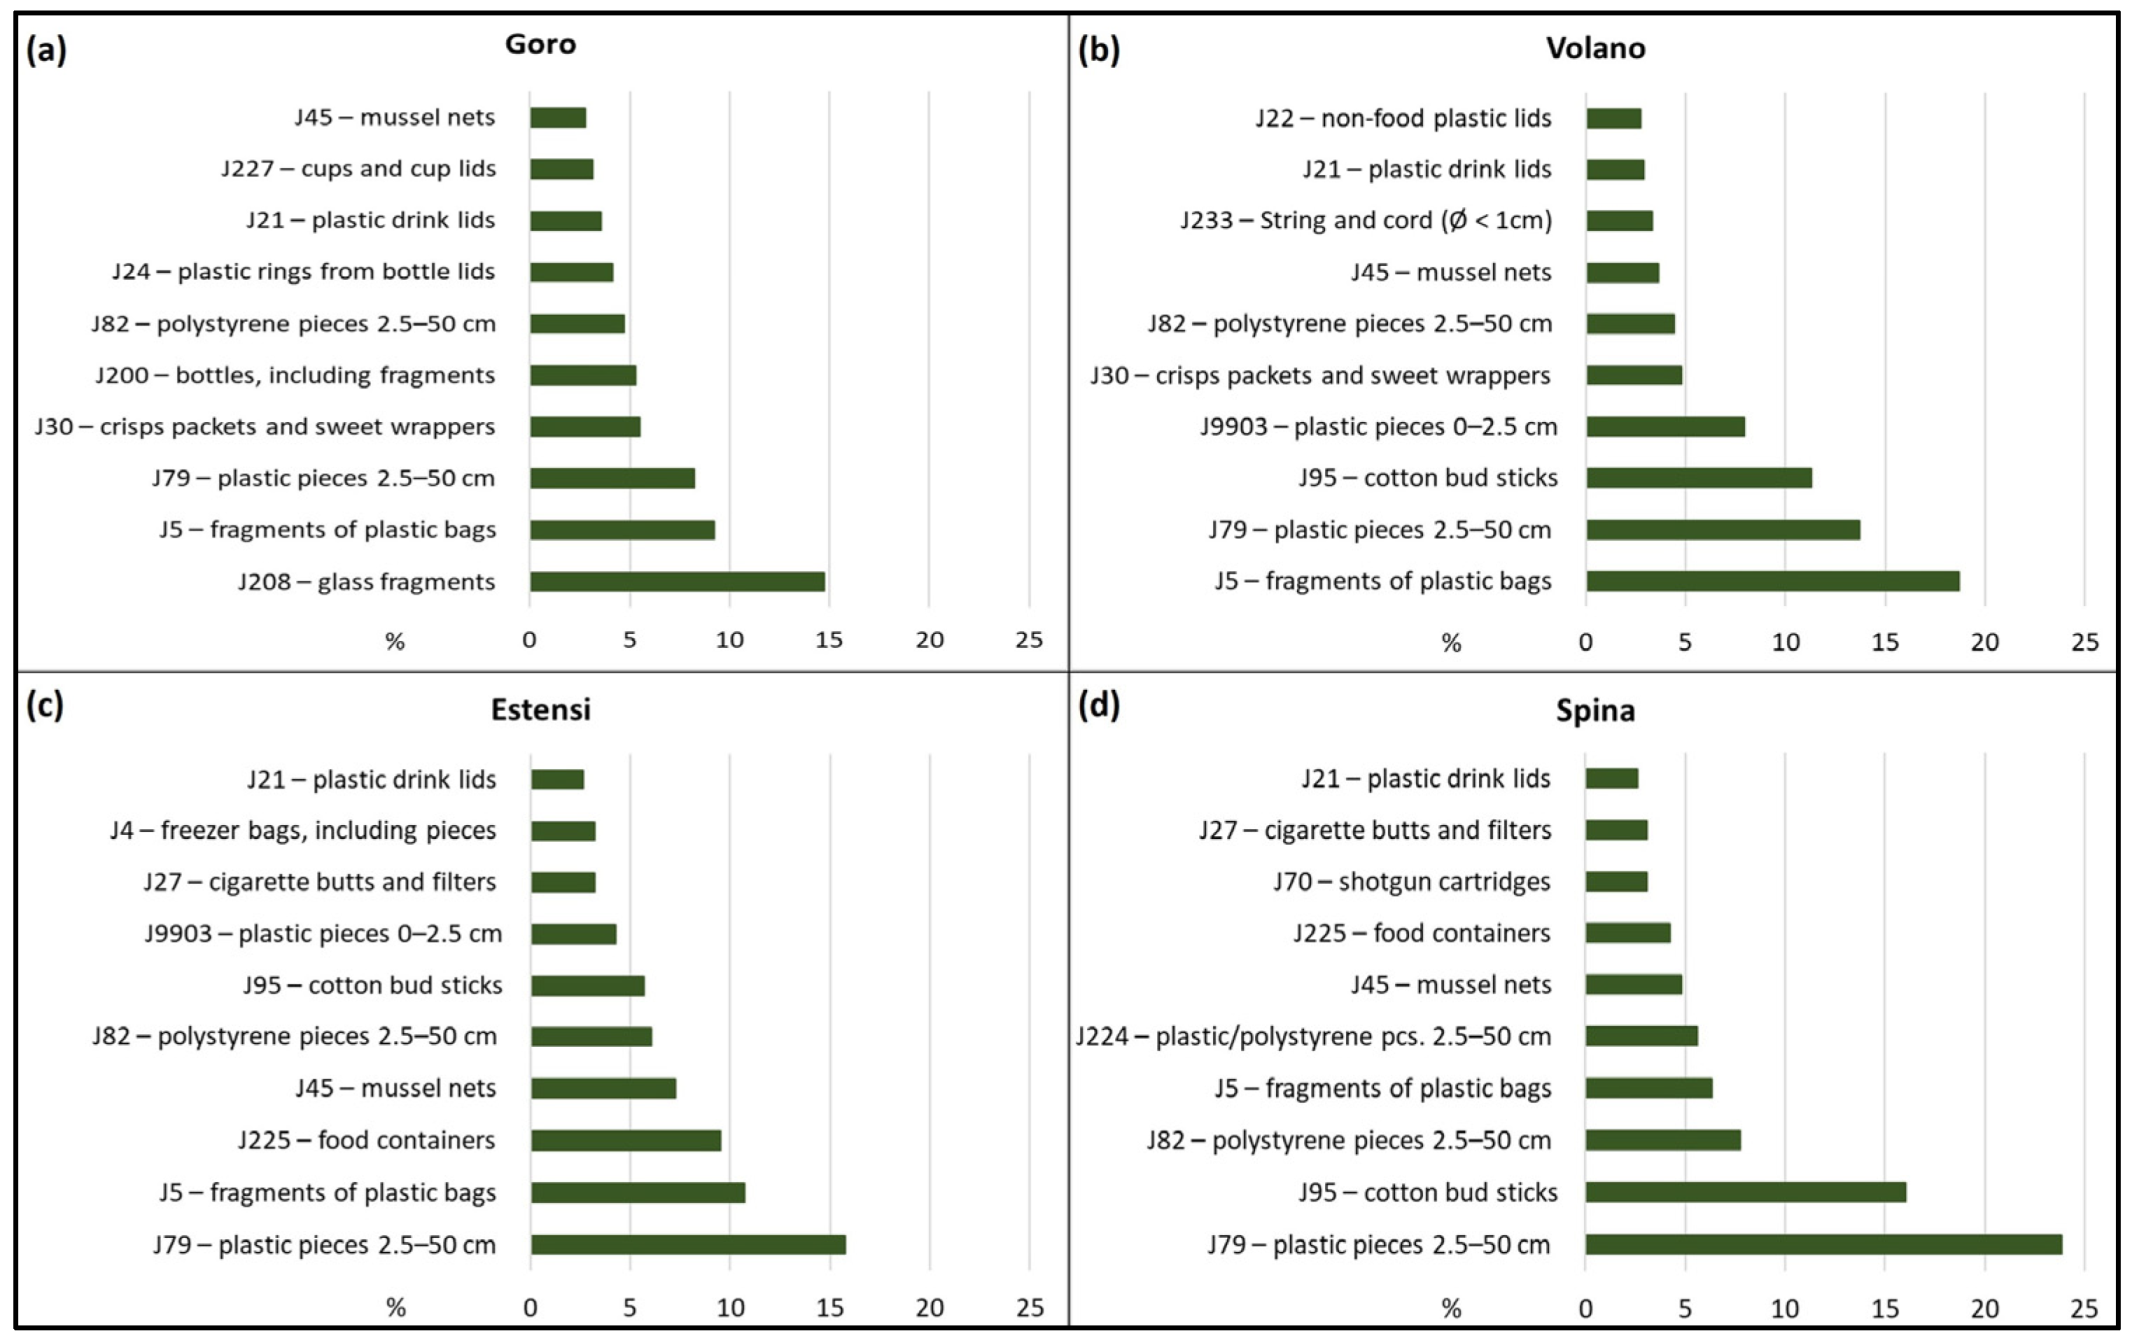
Based on the “Joint List of Litter Categories for Marine Macrolitter Monitoring” [83], a list of the “top 10” collected items was compiled, considering all surveys and sites. The list included 2.5–50 cm plastic pieces (J79, 18%); fragments of plastic bags (J5, 12%); cotton bud sticks (J95, 12%); 2.5–50 cm polystyrene pieces (J82, 6%); mussel nets (J45, 4%); 0–2.5 cm plastic pieces (J9903, 4%); food containers (J225, 3%); 2.5–50 cm plastic/polystyrene pieces (J224, 3%); plastic drink lids (J21, 3%); cigarette butts and filters (J27, 3%). The composition of the top 10 items varied across the four surveyed sites, as illustrated in Figure 3, and coincided with observations reported in similar studies [37,47,48,81,114,119,120,122,123].
The top 10 items included undefined use (NN, 59%), personal hygiene and care-related (HY, 18%), food consumption-related (FC, 13%), aquaculture-related (AQ, 6%), and smoking-related (SM, 4%). Notably, all of the top 10 items observed at Goro are composed of plastic materials. Figure 4 shows a bar chart that considers all collected items and provides a clear visual comparison of how different usage categories contribute to the overall litter composition.
The undefined use category comprises the largest proportion of litter (NN, 55%). These items include plastic pieces, fragments of plastic bags, and polystyrene pieces, which, in accordance with other studies [28,124,125], are among the most abundant and are often the result of larger objects’ fragmentation. Identifying the sources of environmental release and implementing effective management strategies for this group of items remains a complex challenge [47,90]. Food consumption-related items (FC, 15%) also constitute a substantial portion of the total debris. This group includes single-use items such as food containers, plastic and polystyrene pieces, and plastic drink lids. Many of these items are widely produced and used [126] and likely originate from land-based sources, being transported via rivers to the coastal environment. Additionally, poor waste disposal practices by beach users contribute to their frequent occurrence along shorelines [94]. Food-related single-use items account for approximately 36% of global plastic production [127]. Although this study’s classification was based on usage categories rather than source attribution, it is important to note that the determination of the land-based or marine-based origin of beach litter is challenging [82]. The source of litter items is often uncertain due to the overlapping pathways through which debris reaches coastal environments. Only debris directly associated with fishing and aquaculture activities can be confidently assigned to a marine origin, and the origin of other items remains ambiguous. For example, commonly collected items, such as cigarette butts (J27) or sweet wrappers (J30), may come from direct deposition by beach users or from improper waste disposal at sea by passengers on vessels. Nevertheless, categorizing by usage type allows for an analysis of potential release pathways and provides useful information to support targeted management strategies, aligning with the recommendations of the “Joint List of Litter Categories for Marine Macrolitter Monitoring” [83]. Another notably represented category at the investigated sites is personal hygiene- and care-related litter (HY, 13%). Cotton bud sticks made of plastic materials accounted for 94% of the items in this category, despite the fact that their production and sale in non-biodegradable form has been banned in Italy since 1 January 2019 (Italian Law 232/2016), aligning with EU Directive 2019/904, which aims to reduce single-use plastic products. The presence of significant quantities of these items may be attributed to legacy pollution, i.e., they were released and accumulated prior to the national ban’s enforcement. Previous studies [82,128,129] suggest that personal hygiene-related items often enter coastal and marine environments through improper disposal in domestic sewage systems and sewage overflows. Inefficient wastewater treatment is a major pathway for their release [28,91,130]. The prevalence of litter associated with improper sewage disposal also raises concerns about the potential co-occurrence of fecal coliforms and their implications for human health [123,131]. Despite the widespread presence in the area of fishing and aquaculture activities, related items were poorly represented (4% each). These values are lower than those previously reported for the Adriatic-Ionian macro-region, where fishing and aquaculture debris accounted for approximately 14%, especially along Italian coasts [47]. These findings are encouraging and may reflect the outcomes of transnational initiatives implemented in recent years, including the stakeholder engagement projects and awareness campaigns aimed at reducing marine litter from fishing and aquaculture activities. The remaining use-related categories (SM, HU, CO, MD, RE, AG, and CL) were marginally represented (<4%), though some seasonal increases were observed and will be discussed later.

4.2. Seasonal Variation

The amount of litter varied from place to place and according to the season (Figure 5). At three of the four sites investigated (Goro, Volano, and Spina), the percentage of litter collected in the summer was similar, representing approximately 15% of the total amount collected throughout the year. At Goro, 50% of the total litter was collected in autumn 2023, while only 12% was collected in winter 2024. At Volano, 50% of the litter was collected in spring 2024. Overall, the highest abundance of litter was observed in spring (Figure 5). A substantial reduction in mean contamination levels occurred during summer, followed by an increase throughout autumn and winter. This trend is primarily due to periodic beach cleaning activities, including mechanical cleaning by local municipalities and manual cleaning by volunteers, which occur more frequently between June and September.
The density of litter items was calculated for each sampling site and seasonal survey, and the CCI was applied to evaluate the overall cleanliness status of the beach (Table 2). The Goro site was classified as “Clean” during summer 2023 and spring 2024 (CCI = 2.18 and 3.30, respectively), “Moderately clean” in autumn 2023 (CCI = 7.11), and “Very clean” in winter 2024 (CCI = 1.65). The Volano site was classified as “Clean” during summer and autumn 2023 and winter 2024 (CCI ranged from 2.68 to 3.64), but was “Moderately clean” in spring 2024 (CCI = 9.43). A previous study conducted at Volano in spring 2015 classified it as “Dirty” (CCI = 11.4) [86]. The Estensi site was predominantly classified as “Clean” in summer and autumn 2023 (CCI = 2.17 and 2.19, respectively) and in spring 2024 (CCI = 3.11), but it was classified as “Very clean” in winter 2024 (CCI = 1.87). The Spina site was classified as “Clean” during the samplings carried out in autumn 2023 and winter and spring 2024 (i.e., CCI = 2.47 to 2.88), but it was classified as “Very clean” in summer 2024 (CCI = 1.43). As observed by different authors, the CCI varies significantly both spatially and temporally. Previous investigations at Boccasette Beach, located on the northern coastline of the Po Delta in Italy [91], classified the beach as “Moderately clean” in November and December 2019; the same beach, sampled in February and June 2020, was classified as “Clean”, but it reverted to “Moderately clean” in October 2020. Along the Istanbul coast (Marmara Sea, Turkey), four beaches were predominantly classified as “Dirty” or “Extremely dirty”, with lower CCI values observed during autumn and winter [95]. An 18-year assessment of the effectiveness of Israel’s “Clean Coast” program showed that the average CCI value was higher in winter (i.e., 4.8) than in other seasons (CCI = 4.6) [132]. Surveys of fourteen Mediterranean beaches in Morocco revealed a minimal average difference in CCI between autumn and spring (1.00 ± 0.68 and 0.86 ± 0.73, respectively), enabling the classification of 87.5% of the beaches as “Very clean” and 12.5% as “Clean” [87]. However, it is challenging to make seasonal comparisons with other CCI studies due to the frequent reporting of only average values across each study area without precise indications of their seasonal variations.
Previous studies [25,133] have shown that environmental conditions play a significant role in the redistribution of litter. Once introduced into the marine environment, litter accumulates along the shoreline, carried by wave action and wind [52]. This is particularly evident from October to May, when beach users are scarce and manual and mechanical cleaning activities are reduced or absent. During these months, environmental factors primarily govern the distribution of beach litter. The surface cyclonic circulation of the Adriatic Sea significantly influences the transport and distribution of marine litter along the Italian coastline [134]. Sampling activities were carried out under various wave conditions, and maximum wave height values ranged between 0.10 and 1.75 m (Figure 6). The yearly mean wave height was 0.65 m, with maximum average values ranging from 2.54 m in summer to 4.08 m in spring. As illustrated in Figure 6, the most energetic event occurred around mid-April, producing the highest recorded wave.
According to a public notice issued on 24 July 2024 by the Po River Basin Authority (https://www.adbpo.it/fiume-po-la-disponibilita-idrica-e-ai-massimi-storici/, accessed on 30 June 2025), the highest average monthly discharge values were recorded at the Pontelagoscuro monitoring station (Ferrara) in March and June of 2024 (3174 and 2926 m3/s, respectively). Near-peak values were also observed in April and May and are likely primarily attributed to seasonal snowmelt. Due to the significant inflows from the Po River basin during this period, it is reasonable to conclude that increased amounts of litter were carried by rivers into the marine environment and subsequently dispersed along the coast by wind and waves.
Compared to the general pattern observed across all sites and surveys, seasonal variations reveal few differences in the composition or use of the items most frequently collected (Figure 7).
During the summer, a relative increase in smoking-related debris (SM, 7%) and fisheries-related litter (FI, 4%) was observed alongside a proportional decrease in items classified as having an undefined use (NN, 42%). These findings suggest that direct human activities, particularly recreational beach use and coastal fishing, have a greater influence on the composition of summer litter (Figure 7a). As previously mentioned, a distinct departure from the typical plastic-only composition was recorded in autumn due to the presence of glass fragments at Goro (Figure 7b). The presence of personal hygiene-related items (HY, 16%) increased, as did hunting-related debris (HU, 3%), likely due to land-based seasonal activities. Plastic items became predominant again during the winter (Figure 7c), with a proportional increase in personal hygiene products (HY, 14%) and food consumption-related items (FC, 11%). Due to the low beach attendance during this season, the collected litter likely originated from land-based sources. It was then transported to the coast by riverine processes and stranded on the beach by marine currents. This reflects the importance of wastewater discharges and overflows as sources of litter. An increase in plastic bag fragments (J5, 20%) was observed during the spring (Figure 7d) and originated from seasonal riverine inputs or the redistribution of previously accumulated litter along the shoreline. Wave data recorded during the spring period support the latter hypothesis, as the highest mean wave height (4.08 m) was observed during this time. These high-energy wave conditions likely promoted the resuspension and transport of debris toward the monitored sites, contributing to the accumulation of lightweight and easily transportable items, such as plastic bag fragments. The distribution of use-related categories remained consistent with the trends observed in other seasons. The undefined use category (NN) predominated at 46%, followed by personal hygiene (HY) and food consumption (FC) items at 10% each. These seasonal patterns highlight the diversity of sources and transport mechanisms of beach litter and reflect the interplay between human activities and environmental processes throughout the year.
The presence of smoking-related items, specifically cigarette butts and filters (J27), has been widely documented as one of the most common forms of beach litter pollution on a global scale [37,48,49,122,135,136,137,138,139]. Previous studies in the Emilia-Romagna and Veneto Regions identified cigarette butts as the most prevalent item (22.9%) [86]. Similar studies on the German and Lithuanian coasts reported values ranging from 12% to 19%, depending on visitor density and beach maintenance programs [140]. In contrast, a Portuguese site with few beachgoers and no clean-up initiatives showed a negligible presence of such items (0.1%) [141]. Several authors have proposed that the prevalence of cigarette butts may serve as an indicator of beach management efficiency, environmental awareness, and recreational pollution [142,143,144]. In this study, a clear summer peak was observed (J27, 7%), but smoking-related items were surprisingly limited overall, possibly reflecting growing public awareness and successful local mitigation efforts.
Regarding fishing-related debris, which was primarily detected during the summer, it is notable that the summer sampling occurred in July, before the professional fishing closure in August to restore the natural habitat. Despite the prevalence of fishing activity in the study area, only 3% of the collected items were fishing-related, which may seem anomalous. However, similar low proportions have been observed along the Iranian coast of the Strait of Hormuz, where fishing debris comprised only 2% of marine litter despite intensive local fishing activity [145]. Similarly, on São Vicente island (Cape Verde), where fisheries are a mainstay of the local economy, fishing-related litter constituted only 13–30% of beach debris [119].
The presence of shotgun cartridges (J70) detected in autumn is likely associated with the start of the 2023–2024 hunting season in Emilia-Romagna, which spanned from mid-September to late January. The study area is located in the Po Delta, a Ramsar-listed wetland and popular waterfowl hunting destination. Therefore, it is reasonable to attribute these items to hunting activities conducted in back-dune areas or nearby coastal zones. Seasonal variation in cartridge abundance has also been noted on the Danish beaches, with lower values from July to December and higher values in the first half of the year [146]. Shotgun cartridges, which are typically associated with coastal game hunting, were consistently recorded across multiple surveys on a Portuguese beach, where they were among the most common types of litter [141].
The Kruskal-Wallis test was employed to assess the variability of litter abundance across the four sites. It revealed a significant pattern at the Goro site (p < 0.05). When comparing litter abundance within each site across different seasons, significant variations were observed at Goro and Volano (p < 0.005 and p < 0.01, respectively). Estensi and Spina showed no significant seasonal differences (p > 0.5). 
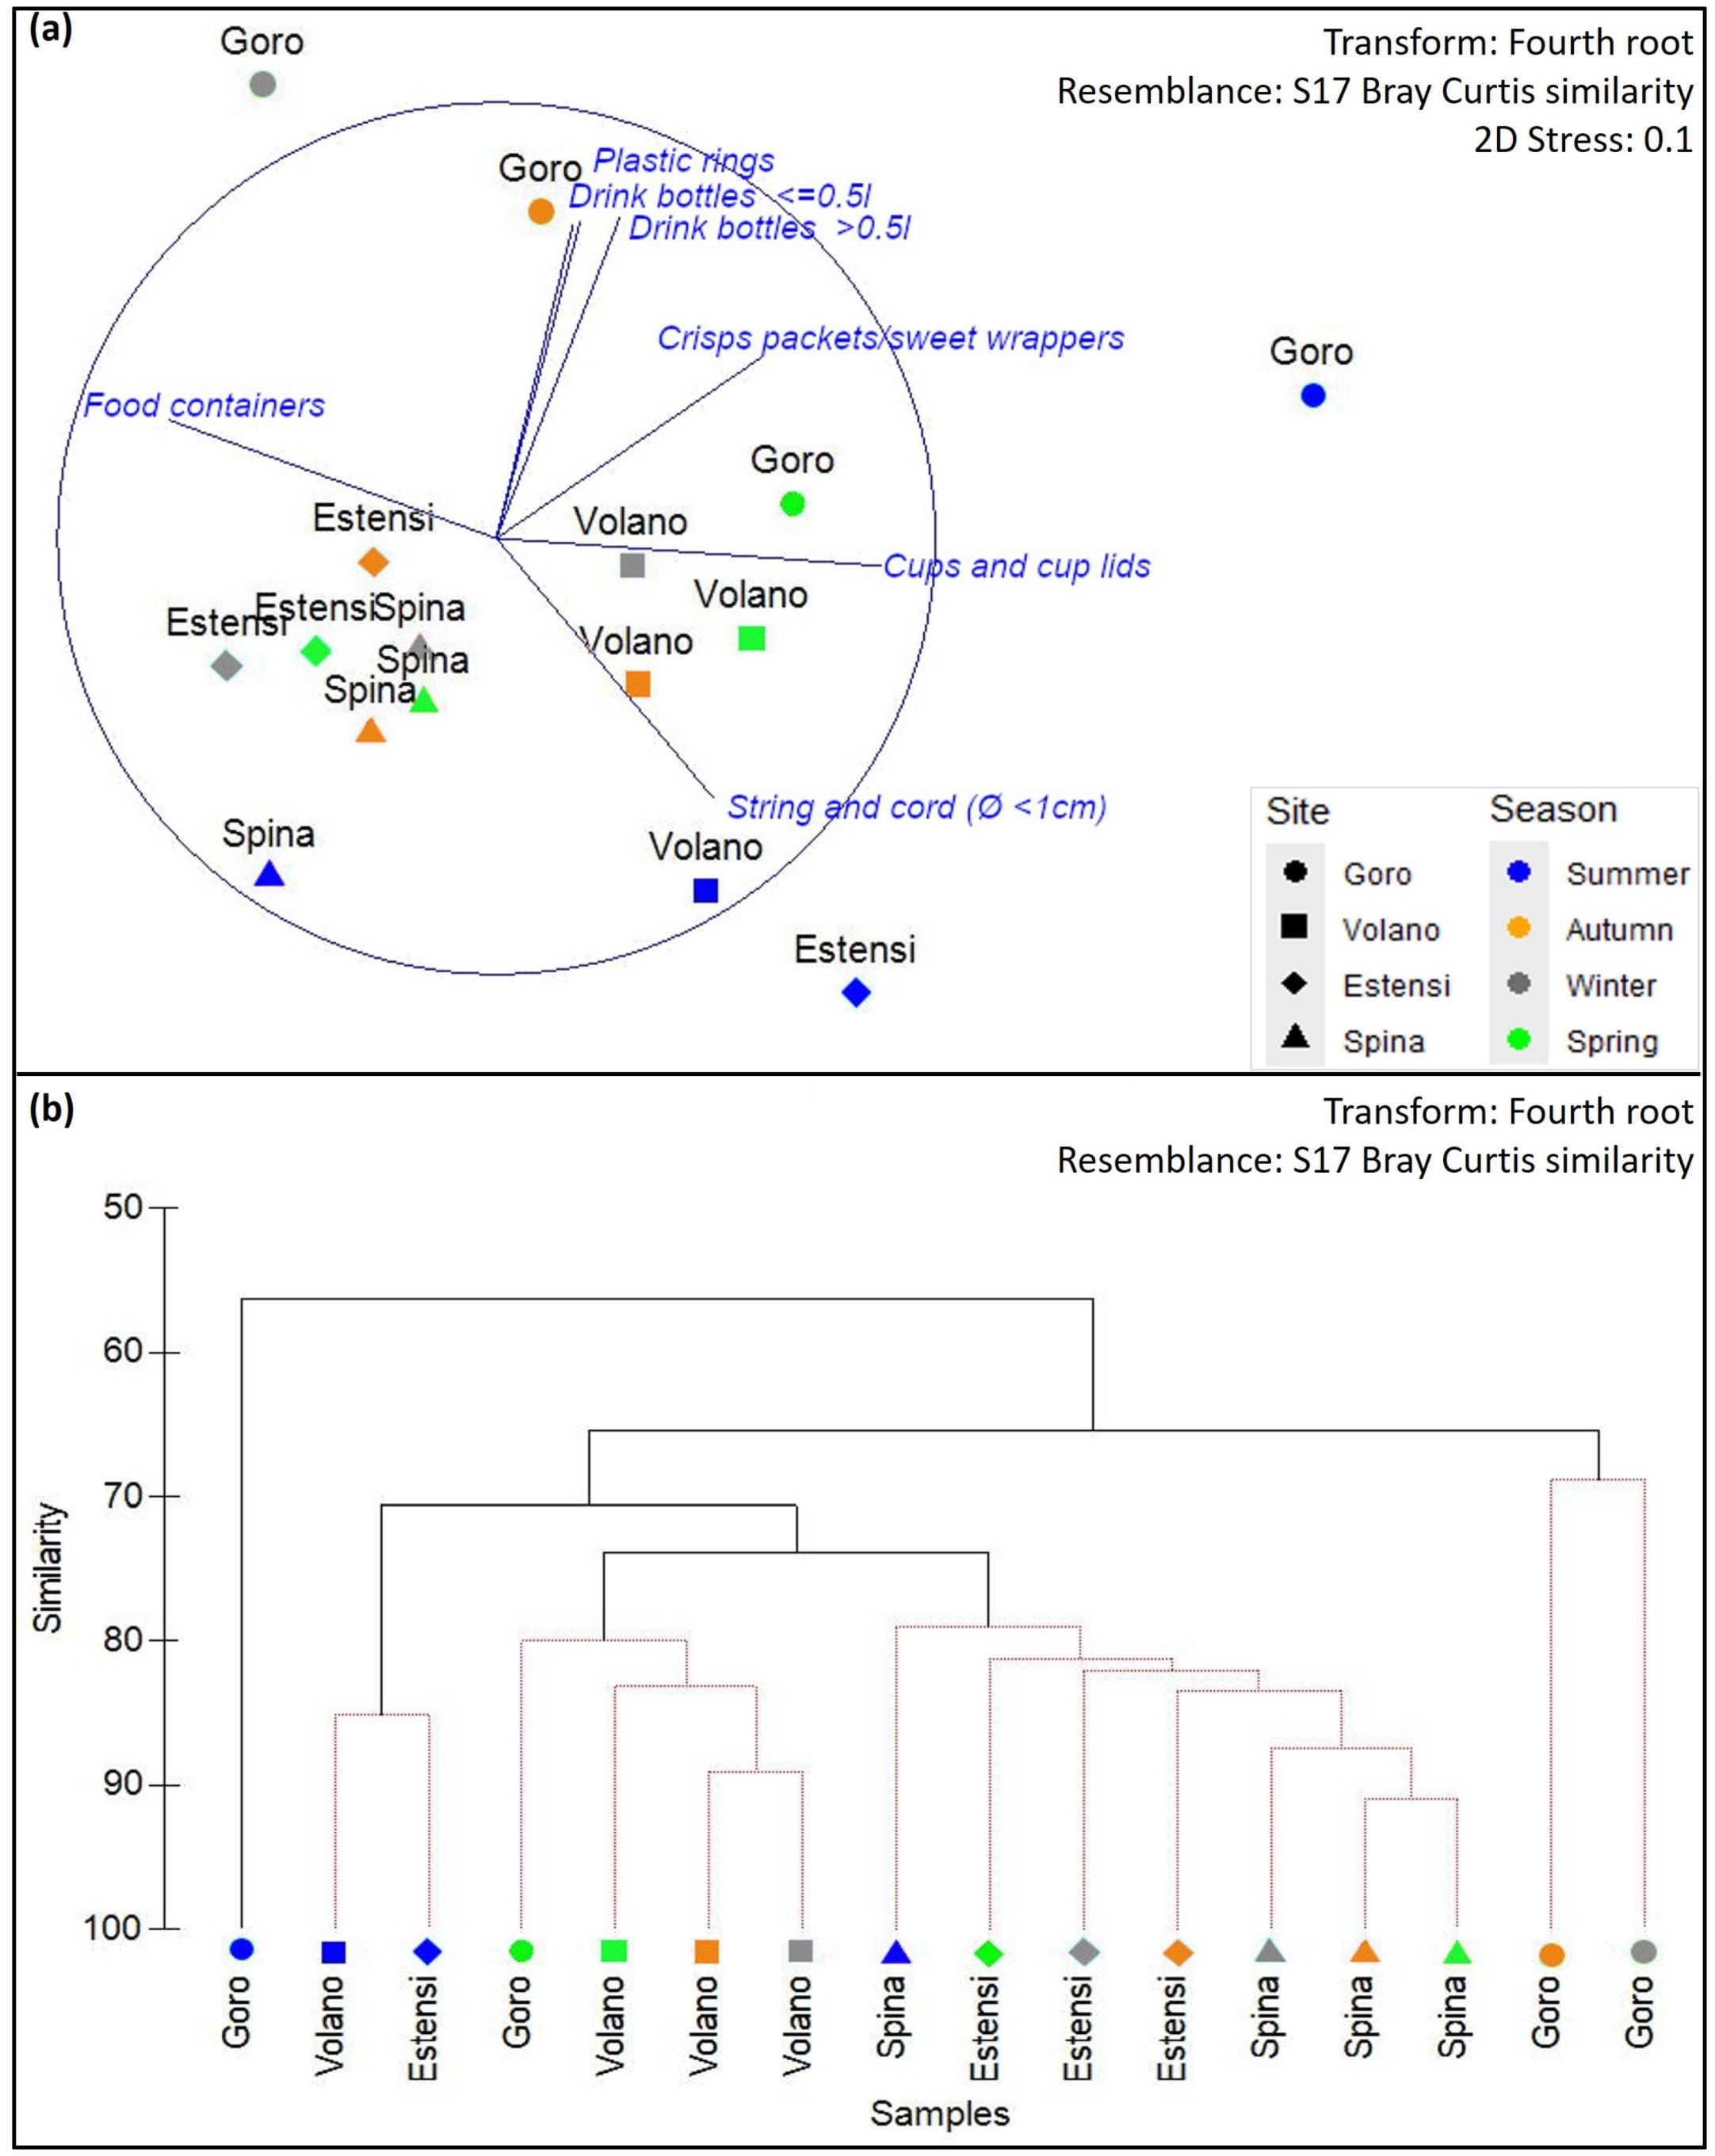
Figure 5 shows outliers in the seasonal litter distribution. The non-metric multidimensional scaling analysis (nMDS) revealed clear groupings by season and site based on litter abundance (expressed as items/m2). The orientation of the vectors in the nMDS plot (Figure 8a) reflects the distribution of the most characteristic litter items for each site. Greater distances between points on the plot reflect greater differences in litter composition. All differences/similarities are also apparent in the cluster analysis (Figure 8b). Although the analysis was performed on the entire dataset, for illustrative purposes, the most pronounced seasonal differences observed between sites are highlighted below, referring only to the top 10 items per site and season. For example, the Spina site exhibited similar trends in autumn, winter, and spring, as reflected by the close proximity of the respective points in Figure 8. The summer evaluation appears distinct and reflects a notable divergence from the group. Items that contributed to this distinction include cigarette butts and filters (J27), plastic rings from drink bottles (J24), and strings and cords less than 1 cm in diameter (J233). These items were present in the summer but absent in the other seasons. Additionally, cotton bud sticks (J95) were recorded at a density of 0.01 items/m2 in summer, compared to an average of 0.07 items/m2 across the other seasons. A similar trend was observed at Volano (Figure 8), where the highest densities of plastic fragments measuring 0–2.5 cm (J9903, 0.03 items/m2) were recorded in summer and were sparsely represented during the other seasons (mean value: 0.01 items/m2). Cigarette butts (J27, 0.01 items/m2) and freezer bags, including fragments (J4, 0.01 items/m2), were recorded in summer but were rare or absent in the other seasons. The difference is even more pronounced at Estensi (Figure 8), where the top 10 in the summer includes several categories not recorded in any other season: freezer bags and fragments (J4), strings and cords less than 1 cm in diameter (J233), non-food plastic lids (J22), and plastic cups and cup lids (J227). Summer also saw a relative increase in the abundance of small plastic fragments (0–2.5 cm, J9903) and cigarette butts (J27), which were poorly represented or absent in the other seasons. The Goro site works differently throughout the year, as reflected by the distances between the points in Figure 8, which reflect variations in the litter categories, highlighting a high degree of temporal variability in litter composition. Notably, the litter items represented in Figure 8a belong to categories related to beach users (e.g., food containers—J225; sweet wrappers—J30) and fishing activities (e.g., strings and cords—J233). All of the litter items represented in the graph have positive buoyancy, which allows them to be easily transported by rivers, waves, and currents and to freely move among nearby beaches, as suggested by Asensio-Montesinos et al. [147] and Ciufegni et al. [90]. Figure 8a shows that drink bottles (J7 and J8) are characteristic of the autumn survey at Goro. Crisp packets and sweet wrappers (J30) are characteristic of spring and autumn at Goro. Plastic cups and lids (J227) are common at Volano in winter and spring and at Goro in spring. Strings and cords (J233) are common at Volano in autumn and summer and at Estensi in summer.

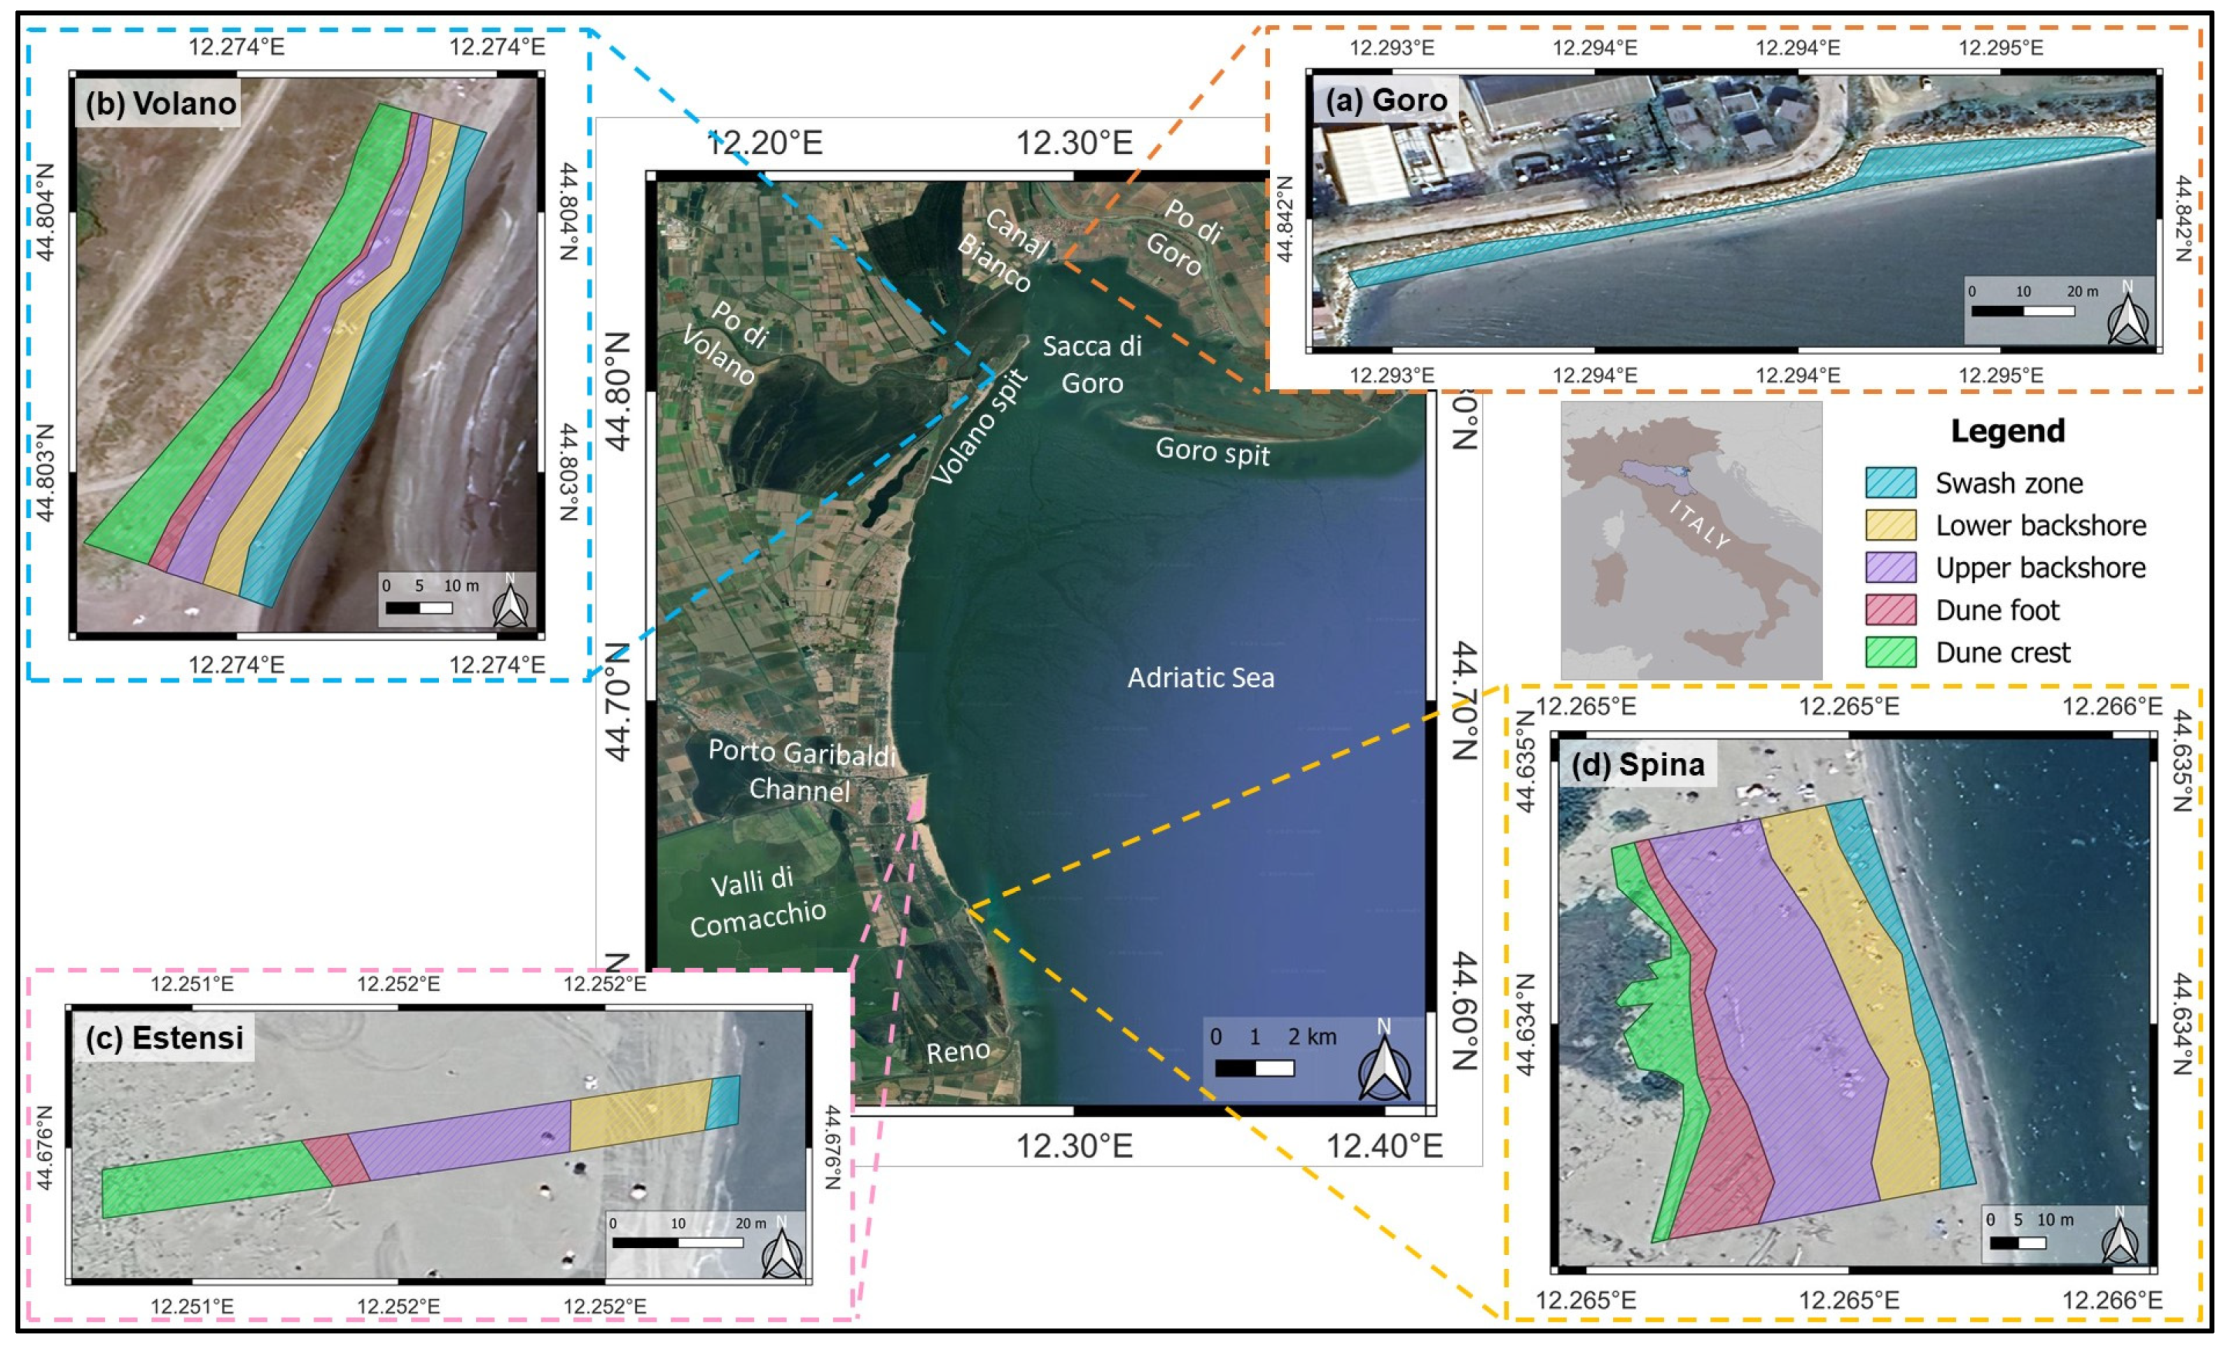
4.3. Cross-Shore Variation

Regarding the cross-shore distribution of litter, it should be noted that at the Goro site, only the SZ was identified. At the Volano, Estensi, and Spina sites, five geomorphological zones of interest (SZ, LB, UB, DF, and DC) were distinguished. In addition, a few observations must be made:
During autumn 2023 at the Volano site, the beach profile differed significantly from that observed in other seasons. Therefore, it was not possible to distinguish between the LB and UB zones. This condition was likely associated with the sea state, which exhibited wave peaks between 1.5 and 2.5 m during the days preceding the sampling (Figure 6). All items from the backshore were allocated to the LB, and the UB data were reported as not available (NA). To determine the density of collected items (and related CCI) within the backshore, the total item count was normalized to the entire sampled area (by summing the area of the two zones).
During mechanical cleaning operations in the study area, it is a common practice to relocate large trunks and stranded vegetation to the base of the dune in order to clear the beach zones that are typically used by visitors, such as the SZ and the backshore. This procedure results in the relocation of sediments, beach litter, and organic debris at the foot of the dune. This contributes to a rise in the dune crest and an increase in the dune foot slope. In this context, during summer 2024, only a few litter items were collected at Spina along the DF, and the DC was inaccessible and could not be surveyed (NA).
In all other instances where no items were found in a given zone, the corresponding density and CCI values were reported as 0 (i.e., LB at Spina in winter 2024 and at Estensi in summer 2023; DC at Volano in summer 2023).
The average density and CCI calculated for each zone are summarized in Table 4. A chromatic scale was applied to enable the quick identification of the five beach cleanliness categories: light blue for “Very clean”, green for “Clean”, yellow for “Moderately clean”, orange for “Dirty”, and red for “Extremely dirty”.
In summary (Table 4), considering all the samples collected, it can be concluded that the SZ was generally classified as “Clean” (0.12 items/m2, CCI = 2.25, 14.61%), the LB was classified as “Very clean” (0.08 items/m2, CCI = 1.55, 10.52%), the UB was classified as “Moderately clean” (0.29 items/m2, CCI = 5.75, 40.43%), the DF was classified as “Dirty” (0.51 items/m2, CCI = 10.25, 24.45%), and the DC was classified was classified as “Clean” (0.10 items/m2, CCI = 1.77, 9.99%). At Volano, Estensi, and Spina, and in cases where the different geomorphological zones could be distinguished, the calculated densities revealed a clear general cross-shore trend, with lower litter abundance in the SZ and LB, an increasing accumulation from the UB to the DF, and a decrease at the DC. However, the averaged litter density and CCI results tend to mask seasonal and site-specific patterns (Appendix A).
Other authors who analyzed litter distribution along the sea-to-land gradient of Italian coasts in the Southern Adriatic and Ionian Seas have also observed similar trends; their findings indicate that beach litter predominantly accumulates in the supratidal zone (backshore) and at the dune foot rather than in the intertidal zone [148,149,150]. Further investigations along the Spanish, Korean, and Japanese coasts generally indicate that most litter accumulates beyond the strandline [49,89,130,151,152]. Other authors assert that the backshore zone is more contaminated than the intertidal zone [153,154,155].
An interesting finding of the cross-shore CCI analysis is that the UB and DF zones determine overall beach cleanliness. The transport of beach litter, which is mainly driven by marine weather forcing, likely facilitates its accumulation in these areas. This suggests that targeted cleaning interventions, aimed at reducing the presence of items in these zones, could substantially improve beach cleanliness. Summer 2024 sampling at the Spina site supports this observation, revealing the lowest item density and the lowest CCI values recorded at the UB and DF zones (Table 2, Table A4). During the above survey, an accumulation of large trunks, branches, sediments, and debris was observed near the dune, which likely reduced the number of items collected in the other beach zones. However, to ensure that the presence of beach litter is addressed effectively, rather than merely masked, it would be more beneficial to conduct targeted manual collections of beach litter before relocating large trunks and other residues toward the dune. As demonstrated in prior studies, the presence of beach litter is frequently underestimated because commonly employed methodologies do not account for buried litter within sediments, which remains concealed until subsequent re-exposure [98,156,157,158]. Coastal erosion has been shown to unearth buried litter from dune systems and other coastal environments in both the short and long term [159]. Another study observed that eroded dunes on the Portuguese Atlantic coast released a sand layer contaminated with marine debris that subsequently dispersed onto the beach [160]. Moreover, overwash events appear to influence the accumulation and distribution of beach litter. This suggests a parallel trend between the fate of the litter and eroded sediments. These materials are redistributed within the coastal system through overwash, dune landslides, and flooding [161]. Further investigation is needed to determine how much litter is trapped or concealed by common coastal management practices, such as relocating sediments, trunks, and debris at the dune foot. It is also necessary to ascertain whether these practices contribute to the reappearance of litter in the absence of mechanical cleaning or during adverse marine weather events. In the present study, all visible macro beach litter items were collected according to the guidelines of the selected sampling protocol [23,47,75,76]. When partially buried items were encountered, they were extracted from the sediment and included in the collection. However, it is important to acknowledge that commonly used monitoring methodologies primarily focus on surface debris and therefore tend to underestimate the actual quantity and potential environmental impact of litter in coastal environments. This concealed fraction of debris may persist in the sediment for extended periods, gradually degrading and releasing microplastics and other hazardous substances into the environment. Furthermore, buried litter complicates recovery efforts, hinders visual detection, and may mislead public perception of beach cleanliness. Future studies could develop and integrate complementary investigative methods, such as sediment sieving or core sampling, to provide a more thorough assessment of beach pollution.
Comparing the general litter composition across all sites and surveys to the patterns observed within each geomorphological zone reveals compositional and functional differences, reflecting the influence of distinct spatial sources and processes (Figure 9).
The SZ exhibited a distinctive profile characterized by the inclusion of non-plastic materials (Figure 9a), most notably glass fragments, which accounted for 22% of the top 10 collected items. This anomaly is primarily attributable to the autumnal survey at the Goro site. Additionally, 75% of the top 10 items in this zone fall into the undefined use category (NN), and the remaining 25% fall into the food consumption category (FC). This suggests a more direct influence from human activities, such as recreational beach use. The LB’s composition closely aligns with patterns typically observed across the full dataset. All of the top 10 items in the LB are made of plastic materials (Figure 9b). However, the LB showed slightly reduced dominance of items in the undefined use category (NN, 44%) and an increased presence of items in the personal hygiene (HY, 12%), aquaculture (AQ, 3%), and smoking-related (SM, 3%) categories (Figure 9b). This composition suggests a mixed input from both marine and terrestrial sources, reflecting the UB’s transitional position within the coastal system. The UB presented a further shift, with a notable increase in personal hygiene-related items (HY, 14%) and hunting-related debris (HU), such as shotgun cartridges, which accounted for 3% of the most collected items (Figure 9c). The undefined use category remained relevant but was comparatively lower (NN, 39%), indicating the contribution of diverse sources, likely from inland and seasonal activities. The presence of aquaculture-related items (AQ, 5%) further highlights the complexity of litter pathways in this zone. In the DF, personal hygiene items (HY, 17%) and aquaculture-related items (AQ, 7%) predominated, with items of undefined use accounting for 38% of the total (NN). The presence of shotgun cartridges (J70, 3%; Figure 9d) was consistent with that observed in the UB, suggesting the influence of similar inland sources. While the overall composition consisted of plastic material, the balanced representation across usage categories indicates a broader spectrum of litter inputs. The DC was characterized by a predominance of lightweight plastic items (Figure 9e), including a notably high percentage of plastic bag fragments (J5, 19%) and polystyrene pieces (J82, 13%). The undefined use category was highest in this zone (NN, 48%), though substantial amounts of food-related (FC, 11%), personal hygiene (HY, 8%), and aquaculture-related (AQ, 6%) debris were also present. The exclusive presence of plastic materials and the overrepresentation of items easily transported by wind imply that this zone acts as a long-term sink, capturing debris redistributed from lower beach areas. The cross-shore distribution of litter items highlights the dynamic and compartmentalized nature of beach litter accumulation, which is influenced by human activities, environmental transport mechanisms, and the spatial structure of the beach-dune system.
Consistent with findings reported in Korea [152], Japan [151], Spain [49], and along the North African coasts of the Strait of Gibraltar [88], most of the litter observed in this study was concentrated in the upper areas of the beach (UB and DF). Similarly, a monitoring campaign conducted in the Tuscany Region (Italy) using UAV technology revealed high concentrations of debris near the dune foot [162]. Numerous studies have documented variations in beach litter accumulation according to coastal geomorphology, elevation, or the presence of vegetation [154,163,164,165,166,167,168,169]. Plastics tend to accumulate at higher elevations, where supratidal vegetation can trap debris beyond the area affected by tides [114,166,169]. However, such patterns are not always consistent, partly due to the difficulty of identifying beach lines, which are often altered by the burial or displacement of litter [98,170]. Debris typically reaches the shore in successive, linear accumulation bands ranging from the most recent swash line to the high tide mark and a sequence of older deposition lines up to the storm berm [171,172]. As observed in the present study, storm events may flood the entire width of the beach, allowing water to reach the backshore and transport not only buoyant items but also previously buried materials that are exhumed [88]. Similarly, a Danish study showed that the buoyancy of shotgun cartridges (including wads) plays a key role in their cross-shore distribution. While wads remain afloat and disperse more widely, cartridges tend to sink and accumulate sediments. They re-emerge only once the metallic parts have significantly corroded, unless they are fully embedded in the substrate [146]. Smaller items exhibit greater spatial variability than larger ones, with distribution patterns strongly influenced by local conditions and seasonal fluctuations [98,166,168,173]. A multi-year analysis conducted along the Australian coast revealed that debris density and size increased from the waterline toward the backshore. This indicates that the backshore is a major deposition area, particularly for large items [154]. According to some authors, this trend is due to the selective burial of smaller items in the backshore zone [165]. Lastly, Olivelli and colleagues observed a significant correlation between debris density, wind, and Stokes drift [154]: wind redistributes stranded litter across the different geomorphological zones of the beach, and stronger waves during storms drive debris further up to the backshore. These authors also emphasized that the debris presence in the lower beach sections is not solely attributable to direct deposition by beachgoers but also to marine and wind-driven transport preceding further aeolian redistribution inland. Overall, the present findings align with the prior evidence, further emphasizing the role of coastal morphology and environmental conditions in litter accumulation.
The Kruskal-Wallis test, non-metric multidimensional scaling (nMDS), and cluster analysis were applied to the normalized dataset and grouped by geomorphological zones, but no statistically significant results were obtained, likely due to the high variability in item categories and the generally low litter densities observed.

5. Conclusions

Like other regions of the Mediterranean, the Adriatic coast is significantly affected by beach litter pollution. Local environmental and anthropogenic conditions influence litter density and distribution. This study examined seasonal and cross-shore variations in litter composition on four beaches along the Northern Adriatic coastline in the Province of Ferrara (Italy): Goro, Volano, Estensi, and Spina. Plastic was the predominant component of all collected litter, accounting for up to 94% of the total. The analysis of the top 10 items proved to be a valuable approach for identifying the most common types of litter and allowing for detailed comparisons across sites, seasons, and geomorphological zones. This targeted ranking approach facilitated the recognition of spatial and temporal patterns in beach litter composition, supporting the identification of potential sources and site-specific pressures. The most prevalent usage categories were undefined use (NN), food consumption-related (FC), and personal hygiene and care-related (HY). Despite the widespread presence of commercial fishing and aquaculture activities in the study area, litter attributable to these economic sectors was poorly represented (4% each). The composition and sources of litter in the Adriatic Sea are similar to those observed along other Mediterranean coasts in that they are dominated by plastic materials and specific anthropogenic inputs. Litter density values observed in this study suggest that management strategies implemented at the European, regional, and local levels are beginning to yield the desired results. The Clean Coast Index (CCI) showed a gradual decline in beach conditions from summer to spring. This trend appears to be linked to the regular cleaning activities carried out between June and September, which coincide with the bathing season. To complement the efforts of local beach managers during the summer months, additional cleaning operations could be considered between October and May, even at a monthly frequency. The values of litter abundance observed in the upper backshore (UB) and dune foot (DF) zones are usually high and determine the overall beach cleanliness. This suggests that cleaning these zones in the study area could be a valuable management tool. According to the evidence proposed in this study, an effective strategy to prevent beach pollution could involve promoting large-scale citizen science campaigns aimed at (i) enhancing public awareness and knowledge of beach litter issues, (ii) improving waste management at the source through strengthened recycling efforts, and (iii) upgrading wastewater treatment infrastructure to prevent the discharge of litter via domestic sewage systems and sewer overflows. The proposed management measures aim to reduce the likelihood that improperly disposed of waste will enter the coastal environment. These measures will reinforce ongoing efforts to reduce beach litter and support the sustainable management of coastal ecosystems. While this study focused on the seasonal, longshore, and cross-shore monitoring of macro beach litter, microplastic pollution (items < 5 mm) in coastal sediments is a well-recognized, significant, and growing environmental issue. In addition to the risks of ingestion and bioaccumulation by marine organisms, microplastics can alter the physical and chemical properties of sediments, which can lead to ecotoxicological risks. Therefore, given that a substantial proportion of the beach litter collected at the surveyed sites consisted of plastic items smaller than 2.5 cm, future studies should incorporate microplastics investigations. This integrated approach would provide a more thorough evaluation of coastal pollution by considering both visible and less conspicuous fractions of beach litter.

Author Contributions

Conceptualization, J.B. and G.A.; methodology, J.B.; software, F.A.-M. and J.B.; validation, J.B., G.A., F.A.-M., E.M. and C.V.; formal analysis, J.B.; investigation, J.B.; resources, C.V.; data curation, J.B.; writing—original draft preparation, J.B.; writing—review and editing, G.A.; visualization, J.B. and G.A.; supervision, G.A., E.M. and C.V.; project administration, J.B.; funding acquisition, C.V. All authors have read and agreed to the published version of the manuscript.

Funding

This research was funded by the National Recovery and Resilience Plan (NRRP), Mission 04 Component 2 Investment 1.5—NextGenerationEU, call for tender n. 3277 dated 30 December 2021. Award Number: 0001052 dated 23 June 2022.

Data Availability Statement

The dataset is available upon request from the authors.

Acknowledgments

The authors gratefully acknowledge two anonymous reviewers for their positive feedback and constructive suggestions. Special thanks go to Ruggero Evangelista for his help in the macrolitter census and processing. This work is a contribution to the Andalusia (Spain) PAI research Group RNM-373 “Goesciences”.

Conflicts of Interest

The authors declare no conflicts of interest. The funders had no role in the design of the study; in the collection, analyses, or interpretation of data; in the writing of the manuscript; or in the decision to publish the results.

Abbreviations

The following abbreviations are used in this manuscript:
AGAgriculture-related.
AQAquaculture-related.
CCIClean Coast Index.
CLClothing.
COBuilding and construction-related.
DCDune crest.
DFDune foot.
FCFood consumption-related.
FIFisheries-related.
HUHunting-related.
HYPersonal hygiene and care-related.
LBLower backshore.
MDMedical-related.
NANot available data.
NENorth-East.
NNUndefined use.
nMDSNon-parametric multidimensional scaling.
NWNorth-West.
RERecreation-related.
SCISites of Community Importance.
SDStandard Deviation.
SESouth-East.
SWSouth-West.
SMSmoking-related.
SPASpecial Protection Areas.
SZSwash zone.
UBUpper backshore.
VKVehicle-related.

Appendix A

A more detailed, cross-shore, and site-by-site analysis allowed for the identification of the specific beach zones where the highest local accumulation of litter occurred.
At the Goro site (Table A1), the SZ was classified as “Clean” in summer 2023 and spring 2024 (0.11 and 0.17 items/m2, CCI = 2.18 and 3.30 respectively), “Moderately clean” in autumn 2023 (0.36 items/m2, CCI = 7.11), and “Very clean” in winter 2024 (0.08 items/m2, CCI = 1.65). The clean state of the beach is probably due to the limited sampling area (714.24 m2), the narrow cross-shore width, the presence of a rip-rap revetment in the backshore, and the high local relevance of wave run-up.
Table A1. Density and CCI calculated for the Goro site for each season and geomorphological zone. To facilitate interpretation of the table, a chromatic scale was applied, enabling quick identification of the beach cleanliness categories: light blue for “Very clean”, green for “Clean”, and yellow for “Moderately clean”.
ZoneSZ
Area (m2)714.24
DensitySummer 230.11
Autumn 230.36
Winter 240.08
Spring 240.17
CCISummer 232.18
Autumn 237.11
Winter 241.65
Spring 243.30
At the Volano site (Table A2), the SZ was classified as “Very clean” during all sampling activities (density ranged from 0.00 to 0.09 items/m2, with CCI values between 0.03 and 1.90). The UB was classified as “Moderately clean” in summer 2023 (0.26 items/m2, CCI = 5.27), “Dirty” in winter 2024 (0.61 items/m2, CCI = 12.15), and “Extremely dirty” in spring 2024 (1.11 items/m2, CCI = 22.16). The DF was classified as “Moderately clean” in summer 2023 (0.42 items/m2, CCI = 8.34), “Dirty” in autumn 2023 and winter 2024 (0.80 and 0.66 items/m2, CCI = 15.98 and 13.16 respectively), and “Extremely dirty” in spring 2024 (2.16 items/m2, CCI = 43.11). The LB and DC were classified as “Clean” or “Very clean” between the seasons. A clear trend of litter accumulation was evident across all seasons, increasing from SZ to DF and subsequently reducing at DC. Specifically, observations at the DF zone during autumn, winter, and spring reflect hydrodynamic conditions during sampling activities and the preceding days. During these periods, wave peaks ranging from 1.5 to 2.5 m were recorded (Figure 6). The intensity of this wave action likely contributed to the transport and subsequent accumulation of litter in this sector. The significant accumulation of litter observed during the spring survey may also be attributed to increased discharge from the Po River basin. Finally, at the Volano site, a progressive trend in litter accumulation and an associated worsening of the CCI index were observed from summer (when cleaning operations are carried out) to the following spring. Intermediate litter density and associated CCI values were observed in autumn and winter.
Table A2. Density and CCI calculated for the Volano site for each season and geomorphological zone. To facilitate interpretation of the table, a chromatic scale was applied, enabling quick identification of the beach cleanliness categories: light blue for “Very clean”, green for “Clean”, yellow for “Moderately clean”, orange for “Dirty”, and red for “Extremely dirty”.
ZoneSZLBUBDFDC
Area (m2)611.37479.03447.57170.26701.55
DensitySummer 230.090.160.260.420.00
Autumn 230.020.10 1NA 20.800.18
Winter 240.000.030.610.660.06
Spring 240.030.181.112.160.25
CCISummer 231.903.175.278.340.00
Autumn 230.361.94 1NA 215.983.51
Winter 240.030.5012.1513.161.20
Spring 240.563.5122.1643.114.90
Notes: 1 The UB density and related CCI for the Volano site in autumn 2023 include data from the entire backshore. For this reason, the density was calculated by comparing the number of items found to the sum of the area between zones LB and UB. 2 NA indicates “not available” data, as the corresponding zones were not sampled for the reasons described in the text.
At the Estensi site (Table A3), SZ, LB, and DC were classified as “Very clean”, with some exceptions. In spring 2024, SZ was categorized as “Moderately clean” (0.32 items/m2, CCI = 6.50), and LB and DC were classified as “Clean” in winter 2024 (0.16 items/m2, CCI = 3.17) and spring 2024 (0.11 items/m2, CCI = 2.11). Across all sampling activities, UB remained “Clean” (density: 0.10–0.22 items/m2; CCI: 2.02–4.38). DF was predominantly classified as “Moderately clean,” though a shift to “Clean” was observed during winter 2024 (0.21 items/m2, CCI = 4.27). An increasing trend in litter accumulation from SZ towards UB and DF, followed by a decrease at DC, was evident at the Estensi site. However, exposure to specific hydrodynamic conditions at the Estensi site during spring sampling activities (Figure 6) may have contributed to the increase in items at the SZ and DF.
Table A3. Density and CCI calculated for the Estensi site for each season and geomorphological zone. To facilitate interpretation of the table, a chromatic scale was applied, enabling quick identification of the beach cleanliness categories: light blue for “Very clean”, green for “Clean”, and yellow for “Moderately clean”.
ZoneSZLBUBDFDC
Area (m2)49.25233.18356.0470.29351.50
DensitySummer 230.080.000.170.340.07
Autumn 230.040.020.170.370.07
Winter 240.080.160.100.210.02
Spring 240.320.040.220.340.11
CCISummer 231.620.003.486.831.42
Autumn 230.810.343.437.401.31
Winter 241.623.172.024.270.40
Spring 246.500.864.386.832.11
The distinct geomorphological zones at the Spina site are generally classified as “Very clean” and/or “Clean” across all seasons, with a few exceptions, where the site was “Moderately clean” (Table A4). These exceptions include SZ in winter 2024 (0.25 items/m2, CCI = 5.08) and DF in autumn 2023 and spring 2024 (0.39 and 0.27 items/m2, CCI = 7.80 and 5.48, respectively). As observed at other sites, Spina surveys exhibited an increasing trend in litter accumulation from SZ toward UB and DF, followed by a decrease at DC. This pattern was particularly noticeable during autumn 2023 and spring 2024 sampling events. However, an unusual increase in litter was observed at SZ during winter 2024, which could be correlated with the sea state conditions observed during or immediately prior to the sampling activities (Figure 6).
Table A4. Density and CCI calculated for the Spina site for each season and geomorphological zone. To facilitate interpretation of the table, a chromatic scale was applied enabling quick identification of the beach cleanliness categories: light blue for “Very clean”, green for “Clean”, and yellow for “Moderately clean”.
ZoneSZLBUBDFDC
Area (m2)476.441081.962217.40704.72571.32
DensityAutumn 230.000.060.110.390.11
Winter 240.250.000.210.140.07
Spring 240.040.080.130.270.05
Summer 240.130.120.060.05NA 1
CCIAutumn 230.001.162.257.802.28
Winter 245.080.004.202.841.40
Spring 240.761.682.645.480.98
Summer 242.562.311.290.94NA 1
Notes: 1 NA indicates “not available” data, as the corresponding zones were not sampled for the reasons described in the text.

References

  1. European Commission. Eurosion Project. In Living with Coastal Erosion in Europe. Results from the Eurosion Study; Doody, P., Ferreira, M., Lombardo, S., Lucius, I., Misdorp, R., Niesing, H., Salman, A., Smallegange, M., Eds.; European Commission: Luxembourg, 2005; pp. 1–57. [Google Scholar]
  2. Millennium Ecosystem Assessment. Ecosystems and Human Well-Being: Synthesis; Island Press: Washington, DC, USA, 2005; pp. 1–155. [Google Scholar]
  3. European Commission. Study on Specific Challenges for a Sustainable Development of Coastal and Maritime Tourism in Europe—Final Report; Publications Office: Luxembourg, 2016; pp. 1–348. [Google Scholar]
  4. Finkl, C.W. The Last Beach by Orrin H. Pilkey and J. Andrew Cooper. J. Coast. Res. 2016, 32, 225. [Google Scholar] [CrossRef]
  5. Goldenberg, S.B.; Landsea, C.W.; Mestas-Nuñez, A.M.; Gray, W.M. The Recent Increase in Atlantic Hurricane Activity: Causes and Implications. Science 2001, 293, 474–479. [Google Scholar] [CrossRef]
  6. Anfuso, G.; Loureiro, C.; Taaouati, M.; Smyth, T.; Jackson, D. Spatial Variability of Beach Impact from Post-Tropical Cyclone Katia (2011) on Northern Ireland’s North Coast. Water 2020, 12, 1380. [Google Scholar] [CrossRef]
  7. EGU General Assembly. Coastal Zone Geomorphological Interactions: Natural versus Human-Induced Driving Factors. In Proceedings of the EGU 2020, Online, 4–8 May 2020. [Google Scholar]
  8. Criado-Aldeanueva, F.; Del Río Vera, J.; García-Lafuente, J. Steric and Mass-Induced Mediterranean Sea Level Trends from 14 Years of Altimetry Data. Glob. Planet. Change 2008, 60, 563–575. [Google Scholar] [CrossRef]
  9. Tsimplis, M.; Spada, G.; Marcos, M.; Flemming, N. Multi-Decadal Sea Level Trends and Land Movements in the Mediterranean Sea with Estimates of Factors Perturbing Tide Gauge Data and Cumulative Uncertainties. Glob. Planet. Change 2011, 76, 63–76. [Google Scholar] [CrossRef]
  10. Antonioli, F.; De Falco, G.; Lo Presti, V.; Moretti, L.; Scardino, G.; Anzidei, M.; Bonaldo, D.; Carniel, S.; Leoni, G.; Furlani, S.; et al. Relative Sea-Level Rise and Potential Submersion Risk for 2100 on 16 Coastal Plains of the Mediterranean Sea. Water 2020, 12, 2173. [Google Scholar] [CrossRef]
  11. Conrad, E.; Cassar, L.F. People and Landscape, the Pan-European Biological and Landscape Diversity Strategy. Coming in from the Cold. In Perspectives on Landscapes; Institute of Earth Systems, University of Malta: La Valeta, Malta, 2010. [Google Scholar]
  12. Erlandson, J.M.; Fitzpatrick, S.M. Oceans, Islands, and Coasts: Current Perspectives on the Role of the Sea in Human Prehistory. J. Isl. Coast. Archaeol. 2006, 1, 5–32. [Google Scholar] [CrossRef]
  13. Anthony, E.; Sabatier, F. Coastal Stabilization Practice in France. Pitfalls of Shoreline Stabilization. Coast. Res. Libr. 2012, 3, 303–321. [Google Scholar]
  14. Griggs, G. Human Settlement of the Coastal Zone. In Coasts in Crisis: A Global Challenge; University of California Press: Berkeley, CA, USA, 2017. [Google Scholar]
  15. Corbin, A. El Territorio Del Vacío: Occidente y la Invención de la Playa; Editorial Mondadori: Barcelona, Spain, 1993. [Google Scholar]
  16. Nelson, C.; Morgan, R.; Williams, A.T.; Wood, J. Beach Awards and Management. Ocean Coast. Manag. 2000, 43, 87–98. [Google Scholar] [CrossRef]
  17. Rubio, D. Gestión Integral de Playas. In Agencia Valenciana de Turismo; Editorial Sintesis: Madrid, Spain, 2005. [Google Scholar]
  18. Houston, J.R. The Economic Value of America’s Beaches. Shore Beach 2024, 92, 33–43. [Google Scholar] [CrossRef]
  19. Dodds, R.; Kelman, I. How Climate Change Is Considered in Sustainable Tourism Policies: A Case of The Mediterranean Islands of Malta and Mallorca. Tour. Rev. Int. 2008, 12, 57–70. [Google Scholar] [CrossRef]
  20. Williams, A.T.; Micallef, A. Beach Management: Principles and Practice, 1st ed.; Earthscan: London, UK, 2009. [Google Scholar]
  21. Bergmann, M. Marine Anthropogenic Litter; Springer International Publishing AG: Cham, Switzerland, 2015; ISBN 978-3-319-16509-7. [Google Scholar]
  22. Sheavly, S.B.; Register, K.M. Marine Debris & Plastics: Environmental Concerns, Sources, Impacts and Solutions. J. Polym. Environ. 2007, 15, 301–305. [Google Scholar] [CrossRef]
  23. European Commission. Guidance on Monitoring of Marine Litter in European Seas; Scientific and Technical Research Series; Joint Research Centre Institute for Environment and Sustainability: Luxembourg, 2013; pp. 1–128. [Google Scholar]
  24. Portman, M.E.; Brennan, R.E. Marine Litter from Beach-Based Sources: Case Study of an Eastern Mediterranean Coastal Town. Waste Manag. 2017, 69, 535–544. [Google Scholar] [CrossRef] [PubMed]
  25. Prevenios, M.; Zeri, C.; Tsangaris, C.; Liubartseva, S.; Fakiris, E.; Papatheodorou, G. Beach Litter Dynamics on Mediterranean Coasts: Distinguishing Sources and Pathways. Mar. Pollut. Bull. 2018, 129, 448–457. [Google Scholar] [CrossRef] [PubMed]
  26. Agarwala, N.; Saengsupavanich, C. Oceanic Environmental Impact in Seaports. Oceans 2023, 4, 360–380. [Google Scholar] [CrossRef]
  27. UNEP. Marine Litter, an Analytical Overview; UNEP: Nairobi, Kenya, 2005. [Google Scholar]
  28. Ciufegni, E.; Anfuso, G.; Gutiérrez Romero, J.C.; Asensio-Montesinos, F.; Rodríguez Castle, C.; González, C.J.; Álvarez, O. Spatial and Temporal Deposition Rate of Beach Litter in Cadiz Bay (Southwest Spain). Sustainability 2024, 16, 1010. [Google Scholar] [CrossRef]
  29. Bolívar-Anillo, H.J.; Asensio-Montesinos, F.; Reyes Almeida, G.; Solano Llanos, N.; Sánchez Moreno, H.; Orozco-Sánchez, C.J.; Villate Daza, D.A.; Iglesias-Navas, M.A.; Anfuso, G. Litter Content of Colombian Beaches and Mangrove Forests: Results from the Caribbean and Pacific Coasts. JMSE 2023, 11, 250. [Google Scholar] [CrossRef]
  30. Sanitwong-Na-Ayutthaya, S.; Saengsupavanich, C.; Ariffin, E.H.; Ratnayake, A.S.; Yun, L.S. Environmental Impacts of Shore Revetment. Heliyon 2023, 9, e19646. [Google Scholar] [CrossRef]
  31. Williams, A. Definitions and Typologies of Coastal Tourism Beach Destinations. In Disappearing Destinations: Climate Change and Future Challenges for Coastal Tourism; Jones, A.T., Phillips, M., Eds.; CABI: Wallingford, Oxfordshire, UK, 2011; pp. 47–65. ISBN 978-1-84593-548-1. [Google Scholar]
  32. Williams, A.T.; Pond, K.; Ergin, A.; Cullis, M.J. The Hazards of Beach Litter. In Coastal Hazards; Coastal Research Library; Springer: Dordrecht, The Netherlands, 2013; Volume 1000, ISBN 978-94-007-5233-7. [Google Scholar]
  33. Philipp, S.F. Racial Differences in the Perceived Attractiveness of Tourism Destinations, Interests, and Cultural Resources. J. Leis. Res. 1993, 25, 290–304. [Google Scholar] [CrossRef]
  34. Krelling, A.P.; Williams, A.T.; Turra, A. Differences in Perception and Reaction of Tourist Groups to Beach Marine Debris That Can Influence a Loss of Tourism Revenue in Coastal Areas. Mar. Policy 2017, 85, 87–99. [Google Scholar] [CrossRef]
  35. Gregory, M.R.; Andrady, A.L. Plastics in the Marine Environment. In Plastics and the Environment; Andrady, A.L., Ed.; Wiley: New York, NY, USA, 2003; pp. 379–401. ISBN 978-0-471-09520-0. [Google Scholar]
  36. OSPAR Commission. Monitoring of Marine Litter in the Ospar Region. In Ospar Pilot Project on Monitoring Marine Beach Litter; OSPAR Commission: London, UK, 2007; pp. 1–75. [Google Scholar]
  37. Simeonova, A.; Chuturkova, R. Marine Litter Accumulation along the Bulgarian Black Sea Coast: Categories and Predominance. Waste Manag. 2019, 84, 182–193. [Google Scholar] [CrossRef]
  38. Ocean Conservancy. 30th Anniversary Internationale Ocean Cleanup; International Coastal Cleanup; Ocean Conservancy: Washington, DC, USA, 2016; pp. 1–28. [Google Scholar]
  39. Wright, E.L.; Black, C.R.; Cheesman, A.W.; Turner, B.L.; Sjögersten, S. Impact of Simulated Changes in Water Table Depth on Ex Situ Decomposition of Leaf Litter from a Neotropical Peatland. Wetlands 2013, 33, 217–226. [Google Scholar] [CrossRef]
  40. Rochman, C.M.; Hentschel, B.T.; Teh, S.J. Long-Term Sorption of Metals Is Similar among Plastic Types: Implications for Plastic Debris in Aquatic Environments. PLoS ONE 2014, 9, e85433. [Google Scholar] [CrossRef] [PubMed]
  41. Hahladakis, J.N.; Velis, C.A.; Weber, R.; Iacovidou, E.; Purnell, P. An Overview of Chemical Additives Present in Plastics: Migration, Release, Fate and Environmental Impact during Their Use, Disposal and Recycling. J. Hazard. Mater. 2018, 344, 179–199. [Google Scholar] [CrossRef] [PubMed]
  42. Savoca, D.; Arculeo, M.; Barreca, S.; Buscemi, S.; Caracappa, S.; Gentile, A.; Persichetti, M.F.; Pace, A. Chasing Phthalates in Tissues of Marine Turtles from the Mediterranean Sea. Mar. Pollut. Bull. 2018, 127, 165–169. [Google Scholar] [CrossRef]
  43. Anderson, J.C.; Park, B.J.; Palace, V.P. Microplastics in Aquatic Environments: Implications for Canadian Ecosystems. Environ. Pollut. 2016, 218, 269–280. [Google Scholar] [CrossRef]
  44. Bryan, S.E.; Cook, A.G.; Evans, J.P.; Hebden, K.; Hurrey, L.; Colls, P.; Jell, J.S.; Weatherley, D.; Firn, J. Rapid, Long-Distance Dispersal by Pumice Rafting. PLoS ONE 2012, 7, e40583. [Google Scholar] [CrossRef]
  45. Gall, S.C.; Thompson, R.C. The Impact of Debris on Marine Life. Mar. Pollut. Bull. 2015, 92, 170–179. [Google Scholar] [CrossRef]
  46. Lee, J.; Lee, J.S.; Jang, Y.C.; Hong, S.Y.; Shim, W.J.; Song, Y.K.; Hong, S.H.; Jang, M.; Han, G.M.; Kang, D.; et al. Distribution and Size Relationships of Plastic Marine Debris on Beaches in South Korea. Arch. Environ. Contam. Toxicol. 2015, 69, 288–298. [Google Scholar] [CrossRef]
  47. Vlachogianni, T.; Fortibuoni, T.; Ronchi, F.; Zeri, C.; Mazziotti, C.; Tutman, P.; Varezić, D.B.; Palatinus, A.; Trdan, Š.; Peterlin, M.; et al. Marine Litter on the Beaches of the Adriatic and Ionian Seas: An Assessment of Their Abundance, Composition and Sources. Mar. Pollut. Bull. 2018, 131, 745–756. [Google Scholar] [CrossRef]
  48. Asensio-Montesinos, F.; Anfuso, G.; Randerson, P.; Williams, A.T. Seasonal Comparison of Beach Litter on Mediterranean Coastal Sites (Alicante, SE Spain). Ocean Coast. Manag. 2019, 181, 104914. [Google Scholar] [CrossRef]
  49. Asensio-Montesinos, F.; Anfuso, G.; Ramírez, M.O.; Smolka, R.; Sanabria, J.G.; Enríquez, A.F.; Arenas, P.; Bedoya, A.M. Beach Litter Composition and Distribution on the Atlantic Coast of Cádiz (SW Spain). Reg. Stud. Mar. Sci. 2020, 34, 101050. [Google Scholar] [CrossRef]
  50. Andriolo, U.; Gonçalves, G.; Sobral, P.; Fontán-Bouzas, Á.; Bessa, F. Beach-Dune Morphodynamics and Marine Macro-Litter Abundance: An Integrated Approach with Unmanned Aerial System. Sci. Total Environ. 2020, 749, 141474. [Google Scholar] [CrossRef] [PubMed]
  51. Kako, S.; Isobe, A.; Magome, S. Sequential Monitoring of Beach Litter Using Webcams. Mar. Pollut. Bull. 2010, 60, 775–779. [Google Scholar] [CrossRef] [PubMed]
  52. Van Sebille, E.; Aliani, S.; Law, K.L.; Maximenko, N.; Alsina, J.M.; Bagaev, A.; Bergmann, M.; Chapron, B.; Chubarenko, I.; Cózar, A.; et al. The Physical Oceanography of the Transport of Floating Marine Debris. Environ. Res. Lett. 2020, 15, 023003. [Google Scholar] [CrossRef]
  53. Corbau, C.; Buoninsegni, J.; Olivo, E.; Vaccaro, C.; Nardin, W.; Simeoni, U. Understanding through Drone Image Analysis the Interactions between Geomorphology, Vegetation and Marine Debris along a Sandy Spit. Mar. Pollut. Bull. 2023, 187, 114515. [Google Scholar] [CrossRef]
  54. Arpae e Regione Emilia-Romagna. La Gestione dei Rifiuti in Emilia-Romagna; Bologna University Press: Bologna, Italy, 2024; pp. 1–196. [Google Scholar]
  55. ARPAE. Monitoraggio Delle Acque Marino Costiere e Classificazione Dello Stato di Qualità; Triennio 2017–2019 e Sessennio 2014–2019; Agenzia Prevenzione Ambiente Energia Emilia-Romagna; Assessorato all’Ambiente, Difesa del suolo e della Costa, Protezione Civile: Cesenatico, Italy, 2021; pp. 1–142. [Google Scholar]
  56. Simeoni, U.; Bondesan, M. The Role and Responsibility of Man in the Evolution of the Italian Adriatic Coast. Bull. Inst. Oceanogr. Spec. 1997, 3, 111–132. [Google Scholar]
  57. Simeoni, U.; Corbau, C. A Review of the Delta Po Evolution (Italy) Related to Climatic Changes and Human Impacts. Geomorphology 2009, 107, 64–71. [Google Scholar] [CrossRef]
  58. Provincia di Rovigo. Piano Territoriale di Coordinamento Provinciale 2008. Available online: https://www.provincia.rovigo.it/servizi-info/ptcp-adottato (accessed on 14 February 2025).
  59. Bondesan, M.; Castiglioni, G.B.; Elmi, C.; Gabbiannelli, G.; Marocco, R.; Pirazzoli, P.A.; Tomasin, A. Storm Surges and Sea-Level Rise: Coastal Areas at Risk in Northeast Italy. J. Costal Res. 1995, 11, 1354–1379. [Google Scholar]
  60. Orlić, M.; Kuzmić, M.; Pasarić, Z. Response of the Adriatic Sea to the Bora and Sirocco Forcing. Cont. Shelf Res. 1994, 14, 91–116. [Google Scholar] [CrossRef]
  61. Ursella, L.; Poulain, P.; Signell, R.P. Surface Drifter Derived Circulation in the Northern and Middle Adriatic Sea: Response to Wind Regime and Season. J. Geophys. Res. 2006, 111, 2005JC003177. [Google Scholar] [CrossRef]
  62. Jeffries, M.A.; Lee, C.M. A Climatology of the Northern Adriatic Sea’s Response to Bora and River Forcing. J. Geophys. Res. 2007, 112, 2006JC003664. [Google Scholar] [CrossRef]
  63. Maicu, F.; Alessandri, J.; Pinardi, N.; Verri, G.; Umgiesser, G.; Lovo, S.; Turolla, S.; Paccagnella, T.; Valentini, A. Downscaling With an Unstructured Coastal-Ocean Model to the Goro Lagoon and the Po River Delta Branches. Front. Mar. Sci. 2021, 8, 647781. [Google Scholar] [CrossRef]
  64. Falcieri, F.M.; Benetazzo, A.; Sclavo, M.; Russo, A.; Carniel, S. Po River Plume Pattern Variability Investigated from Model Data. Cont. Shelf Res. 2014, 87, 84–95. [Google Scholar] [CrossRef]
  65. Maicu, F.; De Pascalis, F.; Ferrarin, C.; Umgiesser, G. Hydrodynamics of the Po River-Delta-Sea System. JGR Ocean. 2018, 123, 6349–6372. [Google Scholar] [CrossRef]
  66. Bellafiore, D.; Ferrarin, C.; Braga, F.; Zaggia, L.; Maicu, F.; Lorenzetti, G.; Manfè, G.; Brando, V.; De Pascalis, F. Coastal Mixing in Multiple-Mouth Deltas: A Case Study in the Po Delta, Italy. Estuar. Coast. Shelf Sci. 2019, 226, 106254. [Google Scholar] [CrossRef]
  67. Calabrese, L.; Correggiari, A.; Perini, L.; Remia, A. La Geologia tra la Terra e il Mare: Strumenti per la Gestione dei Rischi Costieri in Emilia-Romagna; ISMAR-CNR: Venezia, Italy, 2024. [Google Scholar]
  68. Aquaprogram srl. Analisi Del Settore Della Pesca e Dell’acquicoltura Nelle Lagune Dell’alto Adriatico, Con Particolare Attenzione al Mercato Ittico Anche in Termini Di Produzione, Occupazione e Dei Diversi Aspetti Sociali Ed Economici Dei Siti Di Interesse (Laguna Di Caleri, Marinetta e Valli Di Comacchio); Progetto 3/RBC/19 “Sviluppo di una Strategia Partecipativa per Implementare le Risorse della pesca Migliorando la Biodiversità ed in Funzione degli Effetti dei Cambiamenti Climatici Previsti nelle Lagune Costiere e Zone Umide dell’Alto Adriatico”, MASAF; Aquaprogram srl.: Vicenza, Italy, 2023; pp. 1–166. [Google Scholar]
  69. Simeoni, U.; Fontolan, G.; Tessari, U.; Corbau, C. Domains of Spit Evolution in the Goro Area, Po Delta, Italy. Geomorphology 2007, 86, 332–348. [Google Scholar] [CrossRef]
  70. Bezzi, A.; Casagrande, G.; Martinucci, D.; Pillon, S.; Del Grande, C.; Fontolan, G. Modern Sedimentary Facies in a Progradational Barrier-Spit System: Goro Lagoon, Po Delta, Italy. Estuar. Coast. Shelf Sci. 2019, 227, 106323. [Google Scholar] [CrossRef]
  71. Viaroli, P.; Giordani, G.; Bartoli, M.; Naldi, M.; Azzoni, R.; Nizzoli, D.; Ferrari, I.; Comenges, J.M.Z.; Bencivelli, S.; Castaldelli, G.; et al. The Sacca Di Goro Lagoon and an Arm of the Po River. In Estuaries; The Handbook of Environmental Chemistry; Wangersky, P.J., Ed.; Springer: Berlin/Heidelberg, Germany, 2005; Volume 5H, pp. 197–232. ISBN 978-3-540-00270-3. [Google Scholar]
  72. Sabelli, C. Come sta procedendo l’invasione del granchio blu nel Mediterraneo. Aula di Scienze, 21 May 2024; pp. 1–5. [Google Scholar]
  73. Gavioli, A.; Mancinelli, G.; Turolla, E.; Lanzoni, M.; Paesanti, V.; Soana, E.; Eggleston, D.B.; Christian, R.R.; Castaldelli, G. Impacts of the Invasive Blue Crab Callinectes Sapidus on Small-Scale Fisheries in a Mediterranean Lagoon Using Fishery Landing Data. Sci. Total Environ. 2025, 974, 179236. [Google Scholar] [CrossRef]
  74. Parco Delta del Po Emilia-Romagna. Master Plan della Costa del Parco Regionale del Delata del Po. Progetto finanziato dall’Asse 2 Misura 2.1 del DOCUP delle Aree Obiettivo 2—2000/2006—Della Regione Emilia-Romagna; Consorzio del Parco Regionale del Delta del Po: Ferrara, Italy, 2005; pp. 1–88. [Google Scholar]
  75. Galgani, F.; Hanke, G.; Werner, S.; De Vrees, L. Marine Litter within the European Marine Strategy Framework Directive. ICES J. Mar. Sci. 2013, 70, 1055–1064. [Google Scholar] [CrossRef]
  76. Palatinus, A.; Kovač Viršek, M.; Kaberi, E. DeFishGear Protocols for Sea Surface and Beach Sediment Sampling and Sample Analysis; Adriatic IPA; DeFishGear: Athens, Greece, 2015; pp. 1–27. [Google Scholar]
  77. Marshak, S. Earth: Portrait of a Planet: 5th International Student Edition; WW Norton & Company: New York, NY, USA, 2015. [Google Scholar]
  78. Alkalay, R.; Pasternak, G.; Zask, A. Clean-Coast Index—A New Approach for Beach Cleanliness Assessment. Ocean Coast. Manag. 2007, 50, 352–362. [Google Scholar] [CrossRef]
  79. Lippiatt, S.; Opfer, S.; Arthur, C. Marine Debris Monitoring and Assessment; NOAA Technical Memorandum; NOAA Marine Debris Division: Silver Spring, MD, USA, 2013; pp. 1–82. [Google Scholar]
  80. Maziane, F.; Nachite, D.; Anfuso, G. Artificial Polymer Materials Debris Characteristics along the Moroccan Mediterranean Coast. Mar. Pollut. Bull. 2018, 128, 1–7. [Google Scholar] [CrossRef]
  81. Addamo, A.M.; Laroche, P.; Hanke, G.; European Commission; MSFD Technical Group on Marine Litter (Eds.) Top Marine Beach Litter Items in Europe: A Review and Synthesis Based on Beach Litter Data; Publications Office: Luxembourg, 2017; ISBN 978-92-79-87711-7. [Google Scholar]
  82. Mira Veiga, J.; Fleet, D.; Kinsey, S.; Nilsson, P.; Vlachogianni, T.; Werner, S.; Galgani, F.; Thompson, R.C.; Dagevos, J.; Gago, J.; et al. (Eds.) Identifying Sources of Marine Litter: MSFD GES TG Marine Litter Thematic Report; Publications Office: Luxembourg, 2016; ISBN 978-92-79-64522-8. [Google Scholar]
  83. Fleet, D.; Vlachogianni, T.; Hanke, G. A Joint List of Litter Categories for Marine Macrolitter Monitoring; Publications Office of the European Union: Luxembourg, 2021; pp. 1–55. [Google Scholar]
  84. R Core Team. R: A Language and Environment for Statistical Computing; R Core Team: Vienna, Austria, 2024. [Google Scholar]
  85. Groenen, P.J.; van de Velden, M. Multidimensional Scaling. In Encyclopedia of Statistics in Behavioral Sciences; Wiley & Sons: New York, NY, USA, 2005; pp. 1–14. [Google Scholar]
  86. Munari, C.; Corbau, C.; Simeoni, U.; Mistri, M. Marine Litter on Mediterranean Shores: Analysis of Composition, Spatial Distribution and Sources in North-Western Adriatic Beaches. Waste Manag. 2016, 49, 483–490. [Google Scholar] [CrossRef] [PubMed]
  87. Nachite, D.; Maziane, F.; Anfuso, G.; Williams, A.T. Spatial and Temporal Variations of Litter at the Mediterranean Beaches of Morocco Mainly Due to Beach Users. Ocean Coast. Manag. 2019, 179, 104846. [Google Scholar] [CrossRef]
  88. Asensio-Montesinos, F.; Anfuso, G.; Aguilar-Torrelo, M.T.; Oliva Ramírez, M. Abundance and Temporal Distribution of Beach Litter on the Coast of Ceuta (North Africa, Gibraltar Strait). Water 2021, 13, 2739. [Google Scholar] [CrossRef]
  89. Fernández García, G.; Asensio-Montesinos, F.; Anfuso, G.; Arenas-Granados, P. Beach Litter Variability According to the Number of Visitors in Cádiz Beaches, SW Spain. JMSE 2024, 12, 201. [Google Scholar] [CrossRef]
  90. Ciufegni, E.; Asensio-Montesinos, F.; Castle, C.R.; Anfuso, G. Fresh Versus Beach Users’ Deposited Litter in El Puerto De Santa Maria (Cádiz, SW Spain). JMSE 2025, 13, 258. [Google Scholar] [CrossRef]
  91. Buoninsegni, J.; Olivo, E.; Paletta, M.G.; Vaccaro, C.; Corbau, C. Marine Litter Surveys on Boccasette Beach (Rovigo, Italy). In Ninth International Symposium “Monitoring of Mediterranean Coastal Areas: Problems and Measurement Techniques”; Bonora, L., Carboni, D., De Vincenzi, M., Matteucci, G., Eds.; Firenze University Press: Florence, Italy, 2022; pp. 156–164. ISBN 979-12-215-0030-1. [Google Scholar]
  92. Kolitari, J.; Gjyli, L. Marine Litter Assessment on Some Beaches Along the Southeastern Adriatic Coastline (Albania). In Plastics in the Aquatic Environment—Part I; Stock, F., Reifferscheid, G., Brennholt, N., Kostianaia, E., Eds.; The Handbook of Environmental Chemistry; Springer International Publishing: Cham, Switzerland, 2020; Volume 111, pp. 323–351. ISBN 978-3-030-84117-1. [Google Scholar]
  93. Fernández-Enríquez, A.; Anfuso, G.; Asensio-Montesinos, F.; Bakaj, A.; Ismailaj, M.; Cobaj, G. Distribution and Composition of Beach Litter along the Ionian Coastline of Albania. Water 2024, 16, 2370. [Google Scholar] [CrossRef]
  94. Vlachogianni, T.; Scoullos, M. Baseline Assessment of Macrolitter on the Coastline of Algeria: Fit-for-Purpose Data for Tailor-Made Measures to Navigate the Plasticene Age. Mar. Pollut. Bull. 2024, 205, 116646. [Google Scholar] [CrossRef]
  95. Akarsu, C.; Sönmez, V.Z.; Altay, M.C.; Pehlivan, T.; Sivri, N. The Spatial and Temporal Changes of Beach Litter on Istanbul (Turkey) Beaches as Measured by the Clean-Coast Index. Mar. Pollut. Bull. 2022, 176, 113407. [Google Scholar] [CrossRef]
  96. de Veer, D.; Baeza-Álvarez, J.; Bolaños, S.; Cavour Araya, S.; Darquea, J.J.; Díaz Poblete, M.A.; Domínguez, G.; Holtmann-Ahumada, G.; Honorato-Zimmer, D.; Gaibor, N.; et al. Citizen Scientists Study Beach Litter along 12,000 Km of the East Pacific Coast: A Baseline for the International Plastic Treaty. Mar. Pollut. Bull. 2023, 196, 115481. [Google Scholar] [CrossRef] [PubMed]
  97. Velander, K.A.; Mocogni, M. Maritime Litter and Sewage Contamination at Cramond Beach Edinburgh—A Comparative Study. Mar. Pollut. Bull. 1998, 36, 385–389. [Google Scholar] [CrossRef]
  98. Williams, A.T.; Tudor, D.T. Litter Burial and Exhumation: Spatial and Temporal Distribution on a Cobble Pocket Beach. Mar. Pollut. Bull. 2001, 42, 1031–1039. [Google Scholar] [CrossRef] [PubMed]
  99. Eriksson, C.; Burton, H.; Fitch, S.; Schulz, M.; Van Den Hoff, J. Daily Accumulation Rates of Marine Debris on Sub-Antarctic Island Beaches. Mar. Pollut. Bull. 2013, 66, 199–208. [Google Scholar] [CrossRef]
  100. Lamprecht, A. The Abundance, Distribution an d Accumulation of Plastic Debris in Table Bay, Cape Town, South Africa. Master’s Thesis, University of Cape Town, Cape Town, South Africa, 2013. [Google Scholar]
  101. Critchell, K.; Lambrechts, J. Modelling Accumulation of Marine Plastics in the Coastal Zone; What Are the Dominant Physical Processes? Estuar. Coast. Shelf Sci. 2016, 171, 111–122. [Google Scholar] [CrossRef]
  102. Williams, A.T.; Randerson, P.; Allen, C.; Cooper, J.A.G. Beach Litter Sourcing: A Trawl along the Northern Ireland Coastline. Mar. Pollut. Bull. 2017, 122, 47–64. [Google Scholar] [CrossRef]
  103. Willis, K.; Denise Hardesty, B.; Kriwoken, L.; Wilcox, C. Differentiating Littering, Urban Runoff and Marine Transport as Sources of Marine Debris in Coastal and Estuarine Environments. Sci. Rep. 2017, 7, 44479. [Google Scholar] [CrossRef]
  104. Ryan, P.G.; Perold, V.; Osborne, A.; Moloney, C.L. Consistent Patterns of Debris on South African Beaches Indicate That Industrial Pellets and Other Mesoplastic Items Mostly Derive from Local Sources. Environ. Pollut. 2018, 238, 1008–1016. [Google Scholar] [CrossRef]
  105. Gjyli, L.; Vlachogianni, T.; Kolitari, J.; Matta, G.; Metalla, O.; Gjyli, S. Marine Litter on the Albanian Coastline: Baseline Information for Improved Management. Ocean Coast. Manag. 2020, 187, 105108. [Google Scholar] [CrossRef]
  106. Compa, M.; Alomar, C.; Morató, M.; Álvarez, E.; Deudero, S. Spatial Distribution of Macro- and Micro-Litter Items along Rocky and Sandy Beaches of a Marine Protected Area in the Western Mediterranean Sea. Mar. Pollut. Bull. 2022, 178, 113520. [Google Scholar] [CrossRef]
  107. Haseler, M.; Ben Abdallah, L.; El Fels, L.; El Hayany, B.; Hassan, G.; Escobar-Sánchez, G.; Robbe, E.; Von Thenen, M.; Loukili, A.; Abd El-Raouf, M.; et al. Assessment of Beach Litter Pollution in Egypt, Tunisia, and Morocco: A Study of Macro and Meso-Litter on Mediterranean Beaches. Environ. Monit. Assess. 2025, 197, 123. [Google Scholar] [CrossRef]
  108. Mokos, M.; Rokov, T.; Zubak Čižmek, I. Monitoring and Analysis of Marine Litter in Vodenjak Cove on Iž Island, Central Croatian Adriatic Sea. Rend. Fis. Acc. Lincei 2020, 31, 905–912. [Google Scholar] [CrossRef]
  109. Abid, A.; Obtel, M.; Oujidi, B.; Kabriti, M.; Rhayour, K.; Laqsir, C.; Belkacem, A.; El Bouch, M.; El Mrini, A.; Nachite, D. Assessment of Marine Litter on Morocco’s Mediterranean Beaches. E3S Web Conf. 2024, 502, 01005. [Google Scholar] [CrossRef]
  110. Giovacchini, A.; Merlino, S.; Locritani, M.; Stroobant, M. Spatial Distribution of Marine Litter along Italian Coastal Areas in the Pelagos Sanctuary (Ligurian Sea-NW Mediterranean Sea): A Focus on Natural and Urban Beaches. Mar. Pollut. Bull. 2018, 130, 140–152. [Google Scholar] [CrossRef] [PubMed]
  111. Kouvara, K.; Kosmopoulou, A.; Fakiris, E.; Christodoulou, D.; Filippides, A.; Katsanevakis, S.; Ioakeimidis, C.; Geraga, M.; Xirotagarou, P.; Galgani, F.; et al. Assessing Marine Litter in a Highly Polluted Area in the Mediterranean: A Multi-Perspective Approach in the Saronikos Gulf, Greece. Mar. Pollut. Bull. 2024, 203, 116497. [Google Scholar] [CrossRef]
  112. Laglbauer, B.J.L.; Franco-Santos, R.M.; Andreu-Cazenave, M.; Brunelli, L.; Papadatou, M.; Palatinus, A.; Grego, M.; Deprez, T. Macrodebris and Microplastics from Beaches in Slovenia. Mar. Pollut. Bull. 2014, 89, 356–366. [Google Scholar] [CrossRef]
  113. Slimane, E.B.; Haseler, M.; Ben Abdallah, L.; Mhiri, F.; Nassour, A.; Schernewski, G. Efficient Beach Litter Monitoring: Accelerated Surveys of Pollution Hotspots—A North African Case Study. JMSE 2025, 13, 71. [Google Scholar] [CrossRef]
  114. Topçu, E.N.; Tonay, A.M.; Dede, A.; Öztürk, A.A.; Öztürk, B. Origin and Abundance of Marine Litter along Sandy Beaches of the Turkish Western Black Sea Coast. Mar. Environ. Res. 2013, 85, 21–28. [Google Scholar] [CrossRef]
  115. UNEP. Marine Litter Assessment in the Mediterranean; Vassileos Konstantinou: Athens, Greece, 2015; pp. 1–45. [Google Scholar]
  116. Munari, C.; Scoponi, M.; Mistri, M. Plastic Debris in the Mediterranean Sea: Types, Occurrence and Distribution along Adriatic Shorelines. Waste Manag. 2017, 67, 385–391. [Google Scholar] [CrossRef]
  117. Abelouah, M.R.; Ben-Haddad, M.; Alla, A.A.; Rangel-Buitrago, N. Marine Litter in the Central Atlantic Coast of Morocco. Ocean Coast. Manag. 2021, 214, 105940. [Google Scholar] [CrossRef]
  118. Van Hoytema, N.; Bullimore, R.D.; Al Adhoobi, A.S.; Al-Khanbashi, M.H.; Whomersley, P.; Le Quesne, W.J.F. Fishing Gear Dominates Marine Litter in the Wetlands Reserve in Al Wusta Governorate, Oman. Mar. Pollut. Bull. 2020, 159, 111503. [Google Scholar] [CrossRef]
  119. Weidlich, S.; Lenz, M. Abundance, Composition and Sources of Beach Litter on the Cape Verdean Island São Vicente. Mar. Pollut. Bull. 2022, 185, 114258. [Google Scholar] [CrossRef]
  120. Vlachogianni, T.; Skocir, M.; Constantin, P.; Labbe, C.; Orthodoxou, D.; Pesmatzoglou, I.; Scannella, D.; Spika, M.; Zissimopoulos, V.; Scoullos, M. Plastic Pollution on the Mediterranean Coastline: Generating Fit-for-Purpose Data to Support Decision-Making via a Participatory-Science Initiative. Sci. Total Environ. 2020, 711, 135058. [Google Scholar] [CrossRef] [PubMed]
  121. Duong, L.T.; Nguyen, H.T.L.; Nguyen, T.T.H.; Dang, Q.T.; Dao, N.N.; Nguyen, K.T.; Duong, D.C.; Tran, N.T.H.; Nguyen, H.T.; Nguyen, B.Q. Abundance, Distribution, and Seasonal Variation of Marine Litter on the Beaches of Central Vietnam. Mar. Pollut. Bull. 2025, 216, 118046. [Google Scholar] [CrossRef] [PubMed]
  122. Martinez-Ribes, L.; Basterretxea, G.; Palmer, M.; Tintoré, J. Origin and Abundance of Beach Debris in the Balearic Islands. Sci. Mar. 2007, 71, 305–314. [Google Scholar] [CrossRef]
  123. Metcalf, R.; White, H.L.; Moresco, V.; Ormsby, M.J.; Oliver, D.M.; Quilliam, R.S. Sewage-Associated Plastic Waste Washed up on Beaches Can Act as a Reservoir for Faecal Bacteria, Potential Human Pathogens, and Genes for Antimicrobial Resistance. Mar. Pollut. Bull. 2022, 180, 113766. [Google Scholar] [CrossRef]
  124. Fernandino, G.; Elliff, C.I.; Silva, I.R.; Brito, T.D.S.; Bittencourt, A.C.D.S.P. Plastic Fragments as a Major Component of Marine Litter: A Case Study in Salvador, Bahia, Brazil. RGCI 2016, 16, 281–287. [Google Scholar] [CrossRef]
  125. Smith, L.; Turrell, W.R. Monitoring Plastic Beach Litter by Number or by Weight: The Implications of Fragmentation. Front. Mar. Sci. 2021, 8, 702570. [Google Scholar] [CrossRef]
  126. Battulga, B.; Kawahigashi, M.; Oyuntsetseg, B. Distribution and Composition of Plastic Debris along the River Shore in the Selenga River Basin in Mongolia. Environ. Sci. Pollut. Res. 2019, 26, 14059–14072. [Google Scholar] [CrossRef]
  127. Geyer, R. Production, Use, and Fate of Synthetic Polymers. In Plastic Waste and Recycling; Academic Press: Cambridge, MA. USA, 2020; pp. 13–32. [Google Scholar]
  128. OSPAR. Marine Litter in the Northeast Atlantic Region: Assessment and Priorities for Response; OSPAR Commission: London, UK, 2009; ISBN 978-1-906840-26-6. [Google Scholar]
  129. Poeta, G.; Battisti, C.; Bazzichetto, M.; Acosta, A.T.R. The Cotton Buds Beach: Marine Litter Assessment along the Tyrrhenian Coast of Central Italy Following the Marine Strategy Framework Directive Criteria. Mar. Pollut. Bull. 2016, 113, 266–270. [Google Scholar] [CrossRef]
  130. Williams, A.T.; Randerson, P.; Di Giacomo, C.; Anfuso, G.; Macias, A.; Perales, J.A. Distribution of Beach Litter along the Coastline of Cádiz, Spain. Mar. Pollut. Bull. 2016, 107, 77–87. [Google Scholar] [CrossRef] [PubMed]
  131. Federigi, I.; Balestri, E.; Castelli, A.; De Battisti, D.; Maltagliati, F.; Menicagli, V.; Verani, M.; Lardicci, C.; Carducci, A. Beach Pollution from Marine Litter: Analysis with the DPSIR Framework (Driver, Pressure, State, Impact, Response) in Tuscany, Italy. Ecol. Indic. 2022, 143, 109395. [Google Scholar] [CrossRef]
  132. Zurel, D.; Arzoine, F.; Barnett-Itzhaki, Z. Assessing the Effectiveness of 18 Years of Israel’s “Clean Coast” Program. Mar. Policy 2025, 176, 106655. [Google Scholar] [CrossRef]
  133. Forsberg, P.L.; Sous, D.; Stocchino, A.; Chemin, R. Behaviour of Plastic Litter in Nearshore Waters: First Insights from Wind and Wave Laboratory Experiments. Mar. Pollut. Bull. 2020, 153, 111023. [Google Scholar] [CrossRef] [PubMed]
  134. Carlson, D.F.; Suaria, G.; Aliani, S.; Fredj, E.; Fortibuoni, T.; Griffa, A.; Russo, A.; Melli, V. Combining Litter Observations with a Regional Ocean Model to Identify Sources and Sinks of Floating Debris in a Semi-Enclosed Basin: The Adriatic Sea. Front. Mar. Sci. 2017, 4, 78. [Google Scholar] [CrossRef]
  135. Araújo, M.C.B.; Costa, M.F. A Critical Review of the Issue of Cigarette Butt Pollution in Coastal Environments. Environ. Res. 2019, 172, 137–149. [Google Scholar] [CrossRef]
  136. Kungskulniti, N.; Charoenca, N.; Hamann, S.; Pitayarangsarit, S.; Mock, J. Cigarette Waste in Popular Beaches in Thailand: High Densities That Demand Environmental Action. IJERPH 2018, 15, 630. [Google Scholar] [CrossRef]
  137. Loizidou, X.I.; Loizides, M.I.; Orthodoxou, D.L. Persistent Marine Litter: Small Plastics and Cigarette Butts Remain on Beaches after Organized Beach Cleanups. Environ. Monit. Assess. 2018, 190, 414. [Google Scholar] [CrossRef]
  138. Ocean Conservancy. Trash Travels: From Our Hands to the Sea, Around the Globe and Through Time; International Coastal Cleanup; Ocean Conservancy: Washington, DC, USA, 2010; pp. 1–60. [Google Scholar]
  139. Rangel-Buitrago, N.; Barría-Herrera, J.; Vergara-Cortés, H.; Contreras-López, M.; Agredano, R. A Snapshot of the Litter Problem along the Viña Del Mar—Concón Coastal Strip, Valparaíso Region, Chile. Mar. Pollut. Bull. 2020, 160, 111524. [Google Scholar] [CrossRef]
  140. Kataržytė, M.; Balčiūnas, A.; Haseler, M.; Sabaliauskaitė, V.; Lauciūtė, L.; Stepanova, K.; Nazzari, C.; Schernewski, G. Cigarette Butts on Baltic Sea Beaches: Monitoring, Pollution and Mitigation Measures. Mar. Pollut. Bull. 2020, 156, 111248. [Google Scholar] [CrossRef]
  141. Cerqueira, M. Exploring Marine Litter Abundance and Composition on a Rural Sandy Beach in Portugal. Case Stud. Chem. Environ. Eng. 2025, 11, 101071. [Google Scholar] [CrossRef]
  142. Ariza, E.; Jiménez, J.A.; Sardá, R. Seasonal Evolution of Beach Waste and Litter during the Bathing Season on the Catalan Coast. Waste Manag. 2008, 28, 2604–2613. [Google Scholar] [CrossRef] [PubMed]
  143. Balčiūnas, A.; Blažauskas, N. Scale, Origin and Spatial Distribution of Marine Litter Pollution in the Lithuanian Coastal Zone of the Baltic Sea. Baltica 2014, 27, 39–44. [Google Scholar] [CrossRef]
  144. Schernewski, G.; Balciunas, A.; Gräwe, D.; Gräwe, U.; Klesse, K.; Schulz, M.; Wesnigk, S.; Fleet, D.; Haseler, M.; Möllman, N.; et al. Beach Macro-Litter Monitoring on Southern Baltic Beaches: Results, Experiences and Recommendations. J. Coast Conserv. 2018, 22, 5–25. [Google Scholar] [CrossRef]
  145. Sarafraz, J.; Rajabizadeh, M.; Kamrani, E. The Preliminary Assessment of Abundance and Composition of Marine Beach Debris in the Northern Persian Gulf, Bandar Abbas City, Iran. J. Mar. Biol. Ass. 2016, 96, 131–135. [Google Scholar] [CrossRef]
  146. Kanstrup, N.; Balsby, T.J.S. Plastic Litter from Shotgun Ammunition on Danish Coastlines—Amounts and Provenance. Environ. Pollut. 2018, 237, 601–610. [Google Scholar] [CrossRef]
  147. Asensio-Montesinos, F.; Anfuso, G.; Williams, A.T.; Sanz-Lázaro, C. Litter Behaviour on Mediterranean Cobble Beaches, SE Spain. Mar. Pollut. Bull. 2021, 173, 113106. [Google Scholar] [CrossRef]
  148. Poeta, G.; Battisti, C.; Acosta, A.T.R. Marine Litter in Mediterranean Sandy Littorals: Spatial Distribution Patterns along Central Italy Coastal Dunes. Mar. Pollut. Bull. 2014, 89, 168–173. [Google Scholar] [CrossRef]
  149. Šilc, U.; Küzmič, F.; Caković, D.; Stešević, D. Beach Litter along Various Sand Dune Habitats in the Southern Adriatic (E Mediterranean). Mar. Pollut. Bull. 2018, 128, 353–360. [Google Scholar] [CrossRef]
  150. Frigione, M.; Marini, G.; Pinna, M. A Thermal Analysis-Based Approach to Identify Different Waste Macroplastics in Beach Litter: The Case Study of Aquatina Di Frigole NATURA 2000 Site (IT9150003, Italy). Sustainability 2021, 13, 3186. [Google Scholar] [CrossRef]
  151. Kei, K. Beach Litter in Amami Islands, Japan. South Pac. Stud. 2005, 26, 15–24. [Google Scholar]
  152. Lee, J.; Lee, J.; Hong, S.; Hong, S.H.; Shim, W.J.; Eo, S. Characteristics of Meso-Sized Plastic Marine Debris on 20 Beaches in Korea. Mar. Pollut. Bull. 2017, 123, 92–96. [Google Scholar] [CrossRef]
  153. Brennan, E.; Wilcox, C.; Hardesty, B.D. Connecting Flux, Deposition and Resuspension in Coastal Debris Surveys. Sci. Total Environ. 2018, 644, 1019–1026. [Google Scholar] [CrossRef]
  154. Olivelli, A.; Hardesty, B.D.; Wilcox, C. Coastal Margins and Backshores Represent a Major Sink for Marine Debris: Insights from a Continental-Scale Analysis. Environ. Res. Lett. 2020, 15, 074037. [Google Scholar] [CrossRef]
  155. Kaviarasan, T.; Dhineka, K.; Sambandam, M.; Sivadas, S.K.; Sivyer, D.; Hoehn, D.; Pradhan, U.; Mishra, P.; Ramana Murthy, M.V. Impact of Multiple Beach Activities on Litter and Microplastic Composition, Distribution, and Characterization along the Southeast Coast of India. Ocean Coast. Manag. 2022, 223, 106177. [Google Scholar] [CrossRef]
  156. Kusui, T.; Noda, M. International Survey on the Distribution of Stranded and Buried Litter on Beaches along the Sea of Japan. Mar. Pollut. Bull. 2003, 47, 175–179. [Google Scholar] [CrossRef] [PubMed]
  157. Lavers, J.L.; Bond, A.L. Exceptional and Rapid Accumulation of Anthropogenic Debris on One of the World’s Most Remote and Pristine Islands. Proc. Natl. Acad. Sci. USA 2017, 114, 6052–6055. [Google Scholar] [CrossRef] [PubMed]
  158. Tavares, D.C.; Moura, J.F.; Ceesay, A.; Merico, A. Density and Composition of Surface and Buried Plastic Debris in Beaches of Senegal. Sci. Total Environ. 2020, 737, 139633. [Google Scholar] [CrossRef]
  159. Andriolo, U.; Gonçalves, G. Is Coastal Erosion a Source of Marine Litter Pollution? Evidence of Coastal Dunes Being a Reservoir of Plastics. Mar. Pollut. Bull. 2022, 174, 113307. [Google Scholar] [CrossRef]
  160. Andriolo, U.; Gonçalves, G.; Bessa, F.; Sobral, P. Mapping Marine Litter on Coastal Dunes with Unmanned Aerial Systems: A Showcase on the Atlantic Coast. Sci. Total Environ. 2020, 736, 139632. [Google Scholar] [CrossRef]
  161. Turner, A.; Amos, S.L.; Williams, T. Coastal Dunes as a Sink and Secondary Source of Marine Plastics: A Study at Perran Beach, Southwest England. Mar. Pollut. Bull. 2021, 173, 113133. [Google Scholar] [CrossRef]
  162. Merlino, S.; Paterni, M.; Massetti, L.; Cocchi, L.; Locritani, M. A Citizen Science Approach to Supporting Environmental Sustainability and Marine Litter Monitoring: A Case Study of USV Mapping of the Distribution of Anthropogenic Debris on Italian Sandy Beaches. Sustainability 2025, 17, 5048. [Google Scholar] [CrossRef]
  163. Debrot, A.O.; Meesters, H.W.G.; Bron, P.S.; De León, R. Marine Debris in Mangroves and on the Seabed: Largely-Neglected Litter Problems. Mar. Pollut. Bull. 2013, 72, 1. [Google Scholar] [CrossRef]
  164. Okuku, E.O.; Kiteresi, L.I.; Owato, G.; Mwalugha, C.; Omire, J.; Mbuche, M.; Chepkemboi, P.; Ndwiga, J.; Nelson, A.; Kenneth, O.; et al. Baseline Meso-Litter Pollution in Selected Coastal Beaches of Kenya: Where Do We Concentrate Our Intervention Efforts? Mar. Pollut. Bull. 2020, 158, 111420. [Google Scholar] [CrossRef]
  165. Ryan, P.G.; Weideman, E.A.; Perold, V.; Moloney, C.L. Toward Balancing the Budget: Surface Macro-Plastics Dominate the Mass of Particulate Pollution Stranded on Beaches. Front. Mar. Sci. 2020, 7, 575395. [Google Scholar] [CrossRef]
  166. Viehman, S.; Vander Pluym, J.L.; Schellinger, J. Characterization of Marine Debris in North Carolina Salt Marshes. Mar. Pollut. Bull. 2011, 62, 2771–2779. [Google Scholar] [CrossRef] [PubMed]
  167. Willoughby, N.G.; Sangkoyo, H.; Lakaseru, B.O. Beach Litter: An Increasing and Changing Problem for Indonesia. Mar. Pollut. Bull. 1997, 34, 469–478. [Google Scholar] [CrossRef]
  168. Bowman, D. Dynamics of Litter Pollution on Israeli Mediterranean Beaches: A Budgetary, Litter Flux Approach. J. Coast. Res. 1998, 14, 418–432. [Google Scholar]
  169. Araújo, M.C.; Costa, M. An Analysis of the Riverine Contribution to the Solid Wastes Contamination of an Isolated Beach at the Brazilian Northeast. Manag. Environ. Qual. Int. J. 2007, 18, 6–12. [Google Scholar] [CrossRef]
  170. Williams, A.T.; Tudor, D.T.; Randerson, P. Beach Litter Sourcing in the Bristol Channel and Wales, U.K. Water Air Soil Pollut. 2003, 143, 387–408. [Google Scholar] [CrossRef]
  171. GESAMP. Guidelines or the Monitoring and Assessment of Plastic Litter and Microplastics in the Ocean; Reports and Studies; United Nations Environment Programme: London, UK, 2019; pp. 1–130. [Google Scholar]
  172. Ryan, P.G.; Pichegru, L.; Perold, V.; Moloney, C.L. Monitoring Marine Plastics—Will We Know If We Are Making a Difference? S. Afr. J. Sci. 2020, 116, 1–9. [Google Scholar] [CrossRef]
  173. Browne, M.A.; Chapman, M.G.; Thompson, R.C.; Amaral Zettler, L.A.; Jambeck, J.; Mallos, N.J. Spatial and Temporal Patterns of Stranded Intertidal Marine Debris: Is There a Picture of Global Change? Environ. Sci. Technol. 2015, 49, 7082–7094. [Google Scholar] [CrossRef]
Figure 1. The central map depicts the macro area, with the four sampling sites shown in the corners: (a) Goro; (b) Volano; (c) Estensi; (d) Spina.
Water 17 02173 g001
Figure 2. Percentage of litter macro categories at (a) Goro; (b) Volano; (c) Estensi; (d) Spina; (e) total amount.
Water 17 02173 g002
Figure 3. Top 10 most collected items found at the four sites investigated: (a) Goro; (b) Volano; (c) Estensi; (d) Spina. The vertical axis displays the item categories, and the horizontal axis shows their percentage contribution.
Water 17 02173 g003
Figure 4. Distribution of litter items by usage category across the four study sites (Goro, Volano, Estensi, and Spina) and the total dataset. The horizontal axis displays the usage categories: agriculture-related (AG), aquaculture-related (AQ), building and construction-related (CO), clothing (CL), fisheries-related (FI), food consumption-related (FC), hunting-related (HU), medical-related (MD), personal hygiene and care-related (HY), recreation-related (RE), smoking-related (SM), and undefined use (NN). The vertical axis shows the percentage contribution of each category. Different colors indicate individual sites and the total amount.
Water 17 02173 g004
Figure 5. Distribution of collected items across sites and seasons. Pie charts represent the percentage of items collected during each season: (a) Goro; (b) Volano; (c) Estensi; (d) Spina; (e) total amount.
Water 17 02173 g005
Figure 6. Time-series plot of significant wave peaks for the period of 1 June 2023–31 July 2024, derived from four daily average values. Sampling activities are indicated by distinct symbols and colors for different sites and seasons.
Water 17 02173 g006
Figure 7. Top 10 most commonly collected items found during each investigated season: (a) summer; (b) autumn; (c) winter; (d) spring. The vertical axis displays the item categories, while the horizontal axis shows their percentage contribution.
Water 17 02173 g007
Figure 8. Grouping of sites and seasons based on the density of collected litter categories: (a) non-multi-dimensional scaling ordination (nMDS), where vector labels indicate litter categories with Pearson correlation > 0.7 [plastic rings (J24); drink bottles ≤ 0.5 l (J7); drink bottles > 0.5 l (J8); crisp packets and sweet wrappers (J30); cups and cup lids (J227); string and cord Ø < 1 cm (J233); food containers (J225)]; (b) cluster dendrograms. Distinct symbols and colors correspond to each site and season.
Water 17 02173 g008
Figure 9. Top 10 of the most collected items based on all collected data across the geomorphological zones: (a) swash zone; (b) lower backshore; (c) upper backshore; (d) dune foot; (e) dune crest. The vertical axis displays the item categories, and the horizontal axis shows their relative percentage contribution.
Water 17 02173 g009
Table 1. Clean Coast Index: value and definition for each quality class.
QualityValueDefinition
Very clean0–2No litter is seen
Clean2–5No litter is seen over a large area
Moderate5–10A few pieces of litter can be detected
Dirty10–20A lot of litter on the shore
Extremely dirty>20Most of the beach is covered with litter
Table 2. Collected information for each site and sampling season (area in m2, collected items, density, and CCI).
SiteArea (m2)Sampling SeasonTotal Collected Items (n.)Density (items/m2)CCI (Density • K)
Goro714.24Summer 2023780.112.18
Autumn 20232540.367.11
Winter 2024590.081.65
Spring 20241180.173.30
Volano2409.23Summer 20233230.132.68
Autumn 20233600.152.99
Winter 20244930.183.64
Spring 202411360.479.43
Estensi1060.51Summer 20231150.112.17
Autumn 20231160.112.19
Winter 2024990.091.87
Spring 20241650.163.11
Spina5051.58Autumn 20236530.132.59
Winter 20247270.142.88
Spring 20246230.122.47
Summer 20243620.071.43
Table 3. Average litter density recorded in different studies conducted in the Mediterranean Sea that explicitly expressed litter density as items/m2.
Study AreaAverage Litter Density (Items/m2 ± SD 1)Reference
Adriatic–Ionian macroregion0.67[47]
Albanian coast0.22[47]
Albanian coast0.02[92]
Albanian coast0.14[105]
Alicante, Spain0.12[48]
Balearic Islands, Spain1.9 ± 2.4[106]
Bellocchio (Ferrara, Italy)0.13[86]
Bevano (Ravenna, Italy)0.16[86]
Boccasette (Rovigo, Italy)0.35 ± 0.13[91]
Casalborsetti (Ravenna, Italy)0.14[86]
Coast of Bosnia and
Herzegovina
0.17[47]
Corfu Island, Greece1.22[25]
Croatian coast2.9[47]
Egyptian coast2.52 ± 1.36[107]
Estensi (Ferrara, Italy)0.47 ± 0.03Present study
Ferrara, Italy0.61 ± 0.16Present study
Goro (Ferrara, Italy)0.71 ± 0.12Present study
Greek coast0.24[47]
Istanbul, Turkey5.50 ± 4.46[95]
Italian coast0.28[47]
Iž Island, Croatia2.55 ± 1.83[108]
Montenegrin coast0.37[47]
Moroccan coast0.05 ± 0.04[87]
Moroccan coast0.34[109]
Moroccan coast0.71 ± 0.43[107]
NW Adriatic coast, Italy0.2[86]
NW Italian coast1.06[110]
Rosolina (Rovigo, Italy)0.12[86]
Saronikos Gulf, Greece2.61[111]
Slovenian coast1.25[112]
Slovenian coast0.42[47]
Spina (Ferrara, Italy)0.47 ± 0.01Present study
Tunisian coast1.16 ± 0.92[107]
Tunisian coast1.01 ± 1.08[113]
Volano (Ferrara, Italy)0.94 ± 0.16Present study
Volano (Ferrara, Italy)0.57[86]
Notes: 1 SD = standard deviation data were included if available.
Table 4. Average density and CCI were calculated for each geomorphological zone based on data collected from each site and season. A chromatic scale was applied to facilitate the table interpretation, enabling quick identification of the beach cleanliness categories: light blue for “Very clean”, green for “Clean”, yellow for “Moderately clean”, and red for “Extremely dirty”.
ZoneSZLBUBDFDC
DensityAverage0.120.080.290.510.10
Summer0.100.140.170.270.07
Autumn0.140.060.140.520.12
Winter0.100.060.310.340.05
Spring0.140.100.490.920.13
CCIAverage2.251.555.7510.251.77
Summer2.071.833.355.370.71
Autumn2.071.152.8410.392.36
Winter2.101.226.136.751.00
Spring2.782.029.7318.472.66
Disclaimer/Publisher’s Note: The statements, opinions and data contained in all publications are solely those of the individual author(s) and contributor(s) and not of MDPI and/or the editor(s). MDPI and/or the editor(s) disclaim responsibility for any injury to people or property resulting from any ideas, methods, instructions or products referred to in the content.

