Article

Volcanic Ash–Alkaline (Soda) Lake Water Interactions: Biogeochemical Effects in Lake Van as a Model System

Eurasia Institute of Earth Sciences, Istanbul Technical University, 34469 Istanbul, Türkiye
Water 2025, 17(15), 2171; https://doi.org/10.3390/w17152171
Submission received: 21 June 2025 / Revised: 13 July 2025 / Accepted: 18 July 2025 / Published: 22 July 2025
(This article belongs to the Section Hydrogeology)

Abstract

Volcanic ash from explosive eruptions can significantly alter lake water chemistry through ash–water interactions, potentially influencing primary productivity. Alkaline (soda) lakes, mostly found in volcanic regions, are particularly sensitive due to their unique geochemical properties. However, the effects of volcanic ash on the biogeochemistry and phytoplankton dynamics of soda lakes remain poorly understood. This study presents the first nutrient release experiments using natural alkaline water from Lake Van (Türkiye) and volcanic ash from four volcanoes (Hekla, Arenal, Sakurajima, Rabaul-Tavurvur) with different compositions. Sixteen abiotic leaching experiments were conducted over contact durations ranging from 1 to 24 h. Results show rapid increases in pH (~0.4–0.5 units), enhanced silica and phosphate concentrations, and elevated levels of Na, K, Ca, Sr, and S. Nitrate and Mg were generally depleted. The low N:P ratio (~0.06) in Lake Van water indicated nitrogen limitation, partially mitigated by ash-derived inputs. Cyanobacteria dominated the phytoplankton community (95%), consistent with nitrogen fixation under low-nitrate conditions. Elevated silica may promote diatom growth, while changes in Mg/Ca ratios suggest possible impacts on carbonate precipitation and microbialite development. These findings highlight the biogeochemical and ecological relevance of volcanic ash inputs to soda lakes.

1. Introduction

Volcanic eruptions can distribute fine ash particles over extensive distances, affecting both land and water surfaces. These newly formed tephra particles frequently bear surface deposits of water-soluble salts enriched in metals—such as sulfates and halides—which are readily mobilized when the ash interacts with water [1]. Soluble elements have been identified in volcanic ash leachates, many of which are environmentally significant, such as fixed nitrogen, phosphate, silica, and a range of trace metals [1,2,3,4,5,6]. Certain elements released from volcanic ash can support essential metabolic processes in phytoplankton, such as photosynthesis and nitrogen fixation, thereby enhancing primary productivity. In contrast, others, like fluoride and copper, may become toxic at elevated concentrations and potentially inhibit phytoplankton growth [5]. Heavy volcanic ash fallout can lead to the contamination of water supplies and cause severe ecological disturbances [7] and also cause the mass mortality of sensitive aquatic organisms such as pteropods [8].
Although the soils developed over volcanic ash are generally known to be fertile, the potential of volcanic ash to fertilize the aqueous environments has gained limited attention. The hypothesis derived in the 1990s suggested that volcanic ash can fertilize the oceans and may represent a biological pump of atmospheric CO2 into the oceans [9,10,11]. The hypothesis has been supported by a considerable number of studies including geochemical experiments [1,3,4,6], biological experiments [3,12], satellite data [13,14,15,16] and evidence from in situ measurements in ash fall regions [17] revealing increased primary productivity related to volcanic eruptions.
There is growing interest in the geochemical and ecological consequences of volcanic ash deposition into aquatic systems, particularly in its potential to alter nutrient availability and stimulate primary production [18]. While a comprehensive review of early responses and recovery processes in freshwater ecosystems following volcanic ash deposition has been provided, no specific data or case studies are available for alkaline lake systems, which exhibit distinct geochemical conditions [19]. Interactions between volcanic ash and naturally alkaline (soda) lake waters remain poorly understood, despite the global distribution of soda lakes in volcanically active regions (Figure 1a). Addressing this knowledge gap is crucial for understanding how episodic ash fall events may influence nutrient cycling and biological processes in these unique and extreme environments.
Despite the evidences of diatom blooms in lakes due to volcanic ash falls (e.g., Lacher See, Germany) [22,23,24], most of the geochemical studies related to the influence of volcanic eruptions on lake environments have focused on the possible negative effects such as pH decrease, reduction in insolation, and toxicity [7,25]. Furthermore, the fertilization of marine and lake environments with volcanic ash has been suggested to affect the zooplankton and even the fish populations (e.g., salmon in Litnik Lake, Western Alaska) [22,26,27]. This evidence indicates that volcanic ash deposition has the potential to impact not only the primary productivity but also higher trophic levels in the ash fallout areas and the neighboring regions.
Alkaline (soda) lakes are distributed widely in the world (Figure 1a) and found almost exclusively in the volcanic regions of basaltic, andesitic, and even dacitic composition. Alkaline lakes are also considered analogs of early alkaline oceans, which may have favored biogenic processes, including those potentially occurring on icy moons such as Europa (e.g., [20]). The dissolution behavior of volcanic ash under alkaline conditions has gained attention, with studies showing significant release of soluble components that may influence both geochemical and material processes [28]. Yet, the way in which the biogeochemistry in the alkaline lakes is affected by the volcanic eruptions still remains unknown.
Alkaline lakes support diverse and abundant phytoplankton communities, particularly cyanobacteria (e.g., Arthrospira fusiformis) and diatoms, which play key roles in local primary production and biogeochemical cycling [29,30]. Diatom assemblages have also been observed in several alkaline lakes, often showing spatial and seasonal variability, influenced by nutrient availability and stratification dynamics [31]. Understanding how phytoplankton respond to environmental perturbations—such as volcanic ash deposition—can provide critical insights into productivity and nutrient cycling in these unique aquatic systems.
Lake Van, located in eastern Turkey, is the largest of the alkaline lakes (by volume) on Earth, and also the third largest terminal (closed) lake with 3570 km2 of surface area. The largest known calcareous (calcite or aragonite) microbialites (of several meters high), which are formed by cyanobacterial activity, are found in Lake Van [32]. Lake Van has very alkaline (155 mEp/L) and very saline (22 g kg−1) waters with high pH (9.8) [32] and is surrounded by semi-active stratovolcanoes Nemrut, Süphan, Tendürek, and Ararat (Figure 1b).
In this study, abiotic leaching experiments were conducted using water samples from alkaline Lake Van as a model system and four different ash samples with different chemistry compositions, including ashes from eruptions of Hekla (Iceland), Arenal (Costa Rica), Sakurajima (Japan), and Rabaul-Tavurvur (Papau New Guinea) in order to understand the possible changes in the water chemistry after the deposition of volcanic ash.

2. Materials and Methods

2.1. Water Samples from Lake Van

Surface water samples were collected from Lake Van from a location 20 km west of the harbor of city Van with a small boat on 8 July 2014 (lat: 38.5232, lon: 43.1080; Figure 1). All equipment that came in contact with lake water on board was sterile and packed in plastic bags to avoid any contamination. The temperature, specific conductivity, sound speed, and pH of the surface water of Lake Van were measured on board by a handheld YSI CastAway® (Yellow Springs, OH, USA)—CTD with integrated GPS using a pH meter.
Water samples that were used for dissolved ion analyses were filtered on board through 0.45 µm pore-sized polycarbonate filters (Millipore©, Merck KGaA, Darmstadt, Germany) and stored in polyethylene containers (Nalgene©, Thermo Fisher Scientific, Waltham, MA, USA). For chlorophyll-a (chl-a) measurements, 3 L of lake water was filtered through 0.7 µm glass fiber filters GF/F (Millipore©, Merck KGaA, Darmstadt, Germany), and the filters were immediately coated with aluminum folio to protect from light and deep frozen for preservation. Three replicates were measured for chl-a determination.

2.2. Volcanic Ash Samples

Four volcanic samples were used from eruptions from different volcanoes located around the world, including Hekla (2000 eruption), Arenal (1993 eruption), Sakurajima (2007 eruption), and Rabaul-Tavurvur (2002 eruption) (Table 1). Since volcanic ash particles are coated with nutrient-rich soluble salts on the surface [1], it was important to use fresh ash samples that had not been in contact with rain water (unhydrated) after deposition. Unhydrated ash samples used in this study were collected shortly after the eruptions and stored dry in plastic bags. The major elemental compositions of volcanic ash samples were referenced from glass shards and matrix glass and were determined by electron microprobe analysis (EMPA, JEOL-JXA-8200, JEOL Ltd., Tokyo, Japan) at the Helmholtz Centre for Ocean Research Kiel-GEOMAR, Germany. For electron microprobe analyses, an ash size fraction of 125-32 µm was used. The ash particles were mounted on a tray with resin and analyzed with a beam current of 6 nA and a beam size of 5 µm. The average glass composition was inferred from ~25 individual measurements on glass shards or matrix glass. The FeO (wt%) values of the volcanic ash samples were previously shown [4].

2.3. Water Measurements

The concentrations of nitrate, phosphate, and silica macronutrients in the water samples were measured with a Hach Lange (Hach Lange GmbH, Berlin, Germany) DR2800 UV-spectrophotometer at Geomicrobiology Laboratory at the Istanbul Technical University. The methods used in concentration measurements were used according to the Water Analysis Handbook [33], including (1) the cadmium reduction method for nitrate, (2) ascorbic acid method for phosphate, and (3) ammonium molybdate method for silica. The original Hach Lange reagents (Hach Lange GmbH, Berlin, Germany) of nitrate LR (Method 8192), phosphorus (Orthophosphate) PhosVer 3 (Method 8048), and silicic acid (Method LCW 028) were used.
For metal and volatile element determinations, lake water samples were acidified to pH < 2 using ultrapure HNO3 (65%, Merck Suprapur, Darmstadt, Germany) to prevent ion adsorption onto container surfaces. Analyses were conducted at ACME Analytical Laboratories (Vancouver, BC, Canada) using Inductively Coupled Plasma Mass Spectrometry (ICP-MS) following EPA Method 200.8 [34] and Inductively Coupled Plasma Optical Emission Spectrometry (ICP-OES) in accordance with EPA Method 200.7 [35].
The reproducibility of the analyses was evaluated through repeated measurements, yielding the following standard deviations (stdv): pH ± 0.01, NO3 ± 0.04 µmol/L, PO43− ± 0.22 µmol/L, SiO2 ± 0.24 µmol/L, Na+ ± 0.15 mmol/L, K+ ± 0.04 mmol/L, Ca2+ ± 0.02 mmol/L, Mg2+ ± 0.09 mmol/L, Sr2+ ± 0.001 µmol/L, S ± 0.2 mmol/L, and B ± 0.03 mmol/L.
Chl-a concentrations in Lake Van surface waters were determined spectrophotometrically at ITU-EMCOL laboratories, according to APHA Standard Methods for the Examination of Water and Wastewater (1999), Method 10,200 H. [36]. Pigment extractions were carried out with three mechanical crushings with 5 mL 95% acetone and then sonification for one hour in cold water, followed by ultrasound with crushed ice. The samples were stored again at 0–4 °C and left to rest for 24 h before measurements. After extraction, the debris filter was removed with tweezers, and the remaining solution was centrifuged for 5 min at 3500 RCF (relative centrifugal force). The entire process was conducted in the dark or with as dim indirect lighting as possible. The measurements of the pigment extract were carried out at absorbance levels of A630 nm, A647 nm, A664 nm, and A750 nm. Chl-a concentrations were calculated using the following formula:
C h l a   µ g L = 11.85 A 664 A 750 1.54 A 647 A 750 0.08 A 630 A 750 x v V × Z
where v = volume of the extract (mL), V = volume of the sample filtered (L), and Z = Path length of the cuvette (cm).
Chlorophyll-a concentrations were used as an indicator of trophic status and primary productivity, based on OECD (1982) thresholds: oligotrophic (<2 µg/L), mesotrophic (2–7 µg/L), eutrophic (7–30 µg/L), and hypereutrophic (>30 µg/L) [37].
For phytoplankton analyses, unfiltered lake water samples were used. Phytoplankton species were identified and counted following the Utermöhl (1958) method using an Accu-Scope 3032 inverted microscope (Accu-Scope Inc., Commack, NY, USA) [38]. Water samples for phytoplankton analyses were treated with Lugol’s iodine solution (prepared by mixing 25 g potassium iodine and 12.5 g iodine in 200 mL distilled water) for preservation, and the samples were stored in the dark and at a cool temperature. In total, 20 mL of Lugol’s iodine was added per 1 L of unfiltered lake water. Phytoplankton were concentrated via sedimentation and using the back suction method. A total of 5 L of water sample was concentrated to 10 mL, and 1 mL of formaldehyde was added to water samples prior to microscopic analyses. Phytoplankton concentrations and species identification were conducted using glass slides under a light microscope (under ×40 magnification). Phytoplankton species were identified morphologically, and taxonomic names were verified using the online database AlgaeBase [39].

2.4. Leaching Experiments with Volcanic Ash

Sixteen abiotic leaching experiments were performed in vitro in natural alkaline water from Lake Van by mixing four volcanic ash samples (Table 1) with increasing ash/water contact times of 1, 3, 6, and 24 h durations. In the leaching experiments, a mixing ratio of 1 g/m2 ash/water mixing was chosen, which is representative of the flux of ash during moderate-magnitude volcanic eruptions [40]. In total, 200 mg of ash was mixed with 200 mL lake water in polyethylene bottles and gently shook briefly for 10 min. The bottles were rotated during the experiments using a Stuart STR4 Rotator Drive (Cole-Parmer Ltd., Eaton Socon, UK) in a cold room (4 °C) at the ITU MOBGAM Laboratories. The experiments were conducted for 1 h, 3 h, 6 h, and 24 h contact times. At the end of the experiments, leachates were syringed through 0.45 µm Sartorius syringe filters to avoid particulate matter in the measurements. Water pH was measured before mixing with ash and at the end of the experiments (leachate-pH) with a Mettler Toledo (Hanna Instruments, Nusfalau, Romania) portable HI9815-5 pH meter. Macronutrient (nitrate, phosphate, and silica) concentrations were measured using a Hach Lange DR2800 UV-spectrophotometer and other element concentrations were determined in the lake water sample and ash leachates. Samples were acidified with ultra-pure nitric acid to pH < 2 with ICP-MS and ICP-OES techniques at ACME laboratories.

3. Results

3.1. Composition of Lake Van Surface Water

In the surface water sample from Lake Van, the measured pH was 9.73; salinity, 21.3‰; temperature, 22.74 °C; conductivity, 29.5 mS/cm; and sound speed, 1510.5 m/s. The pH and ion concentrations are shown in Table 2. Based on the spectrophotometric nutrient analyses, Lake Van surface water samples showed depleted nitrate levels (below 0.4 µmol/L NO3), moderate phosphate levels (6.2 µmol/L PO43−), and high silica concentrations (18.8 µmol/L SiO2). ICP-ES analyses showed that alkali cations were enriched in Lake Van with extremely high concentrations of sodium (336.4 mmol/L Na+) and potassium (11.4 mmol/L K+). On the other hand, magnesium, calcium, and strontium were in low concentrations, with calcium and strontium being extremely depleted (5.3 mmol/L Mg2+, 0.4 mmol/L Ca2+, and 0.2 mmol/L Sr2+). The sulfate concentration, inferred from the sulfur concentration, was 27.3 mmol/L SO42−, which is close to that of seawater, and the boron concentration was 9.9 mmol/L B. Due to high ionic loading, chloride concentrations were not measured.
The Chl-a concentrations of three replicates were measured at 1.73 ± 0.3 µg/L, indicating low to moderate primary productivity. The total phytoplankton cell number was 35,888 cells/L, the phytoplankton community was significantly dominated by cyanobacteria (95%), while diatoms comprised a smaller proportion (5%). Some identified phytoplankton species encountered in the Lake Van water surface water were cyanobacteria Spirulina sp. and Anabaena sp. and diatom species Pseudo-nitzschia delicatissima sp. and Navicula sp. The density of ciliates, a group of protists, in the surface Lake Van water sample was measured as 781 ciliat/L.

3.2. Volcanic Ash Composition

Volcanic ash classification was based on the electron microprobe analyses and total alkali versus silica diagram (TAS) (Figure 2). Ash samples were categorized as follows: Hekla ash showing basaltic andesite; Arenal ash showing dacite; Sakurajima ash showing rhyolite, and Rabaul-Tavurvur ash showing trachy-dacite to rhyolite composition. The major oxide and minor element compositions of volcanic glass for the ash samples from Hekla 2000, Arenal 1993, Sakurajima 2007, and Rabaul-Tavurvur 2002 are shown in Table 3.

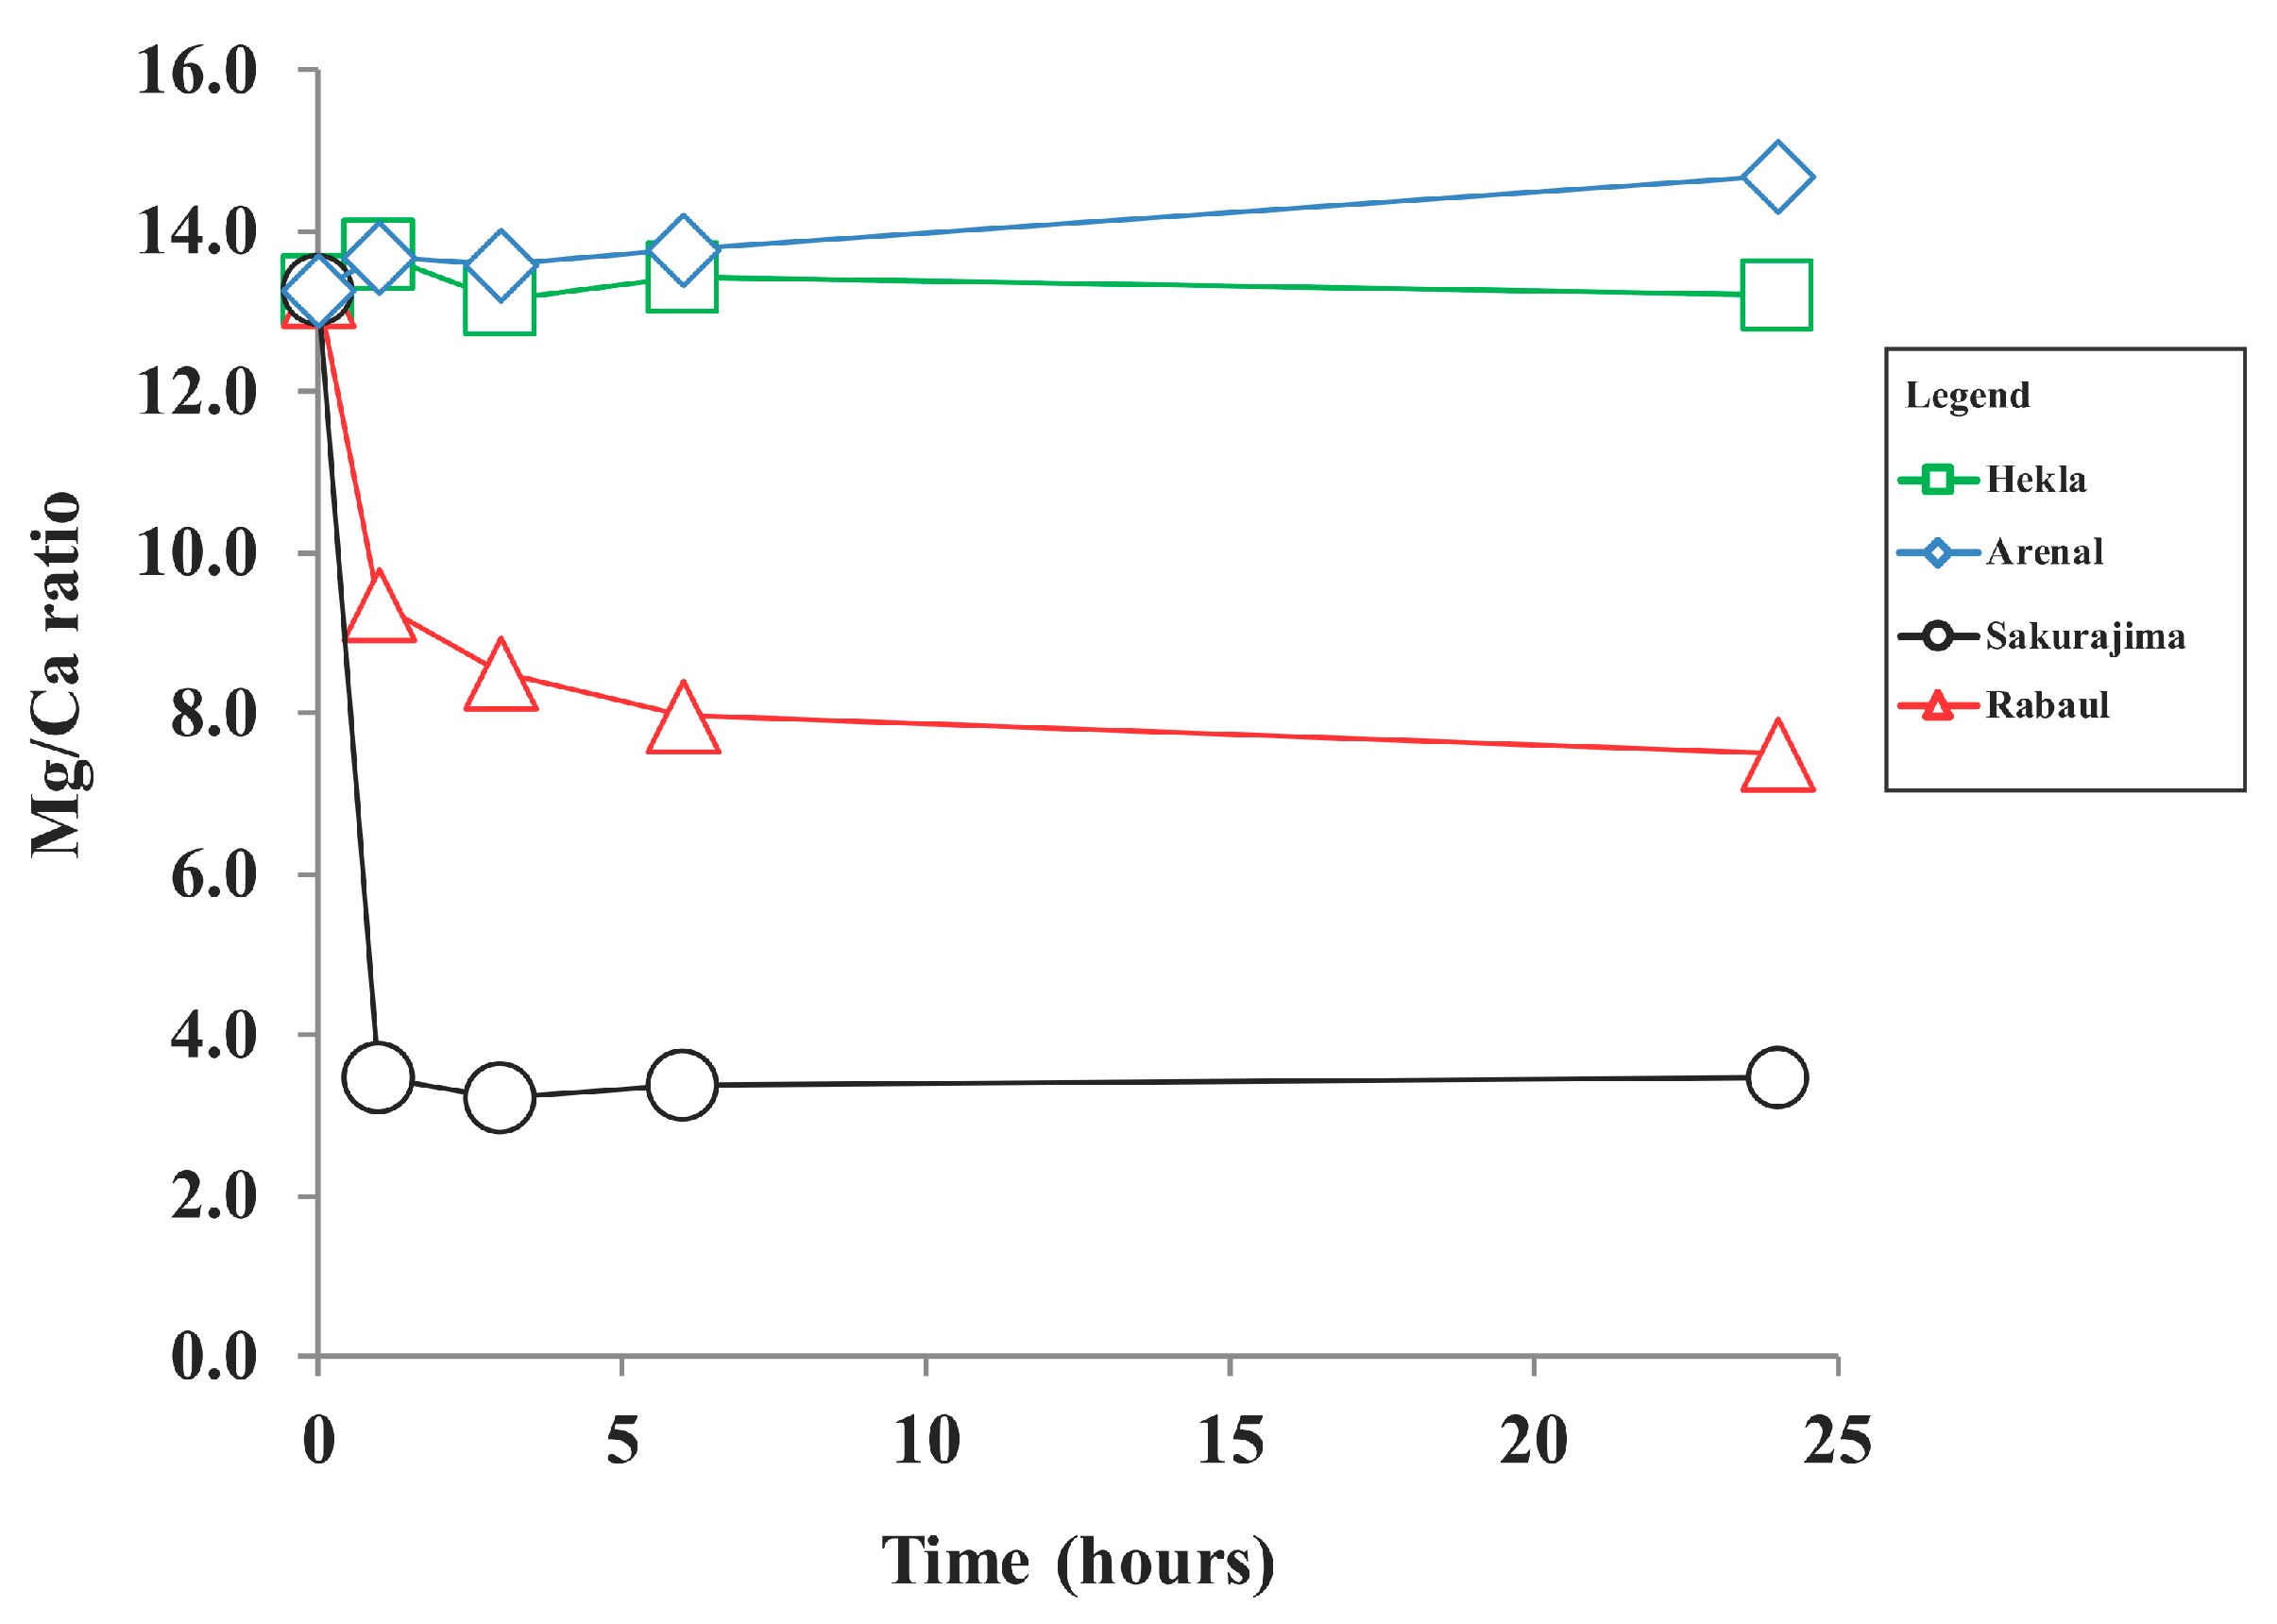
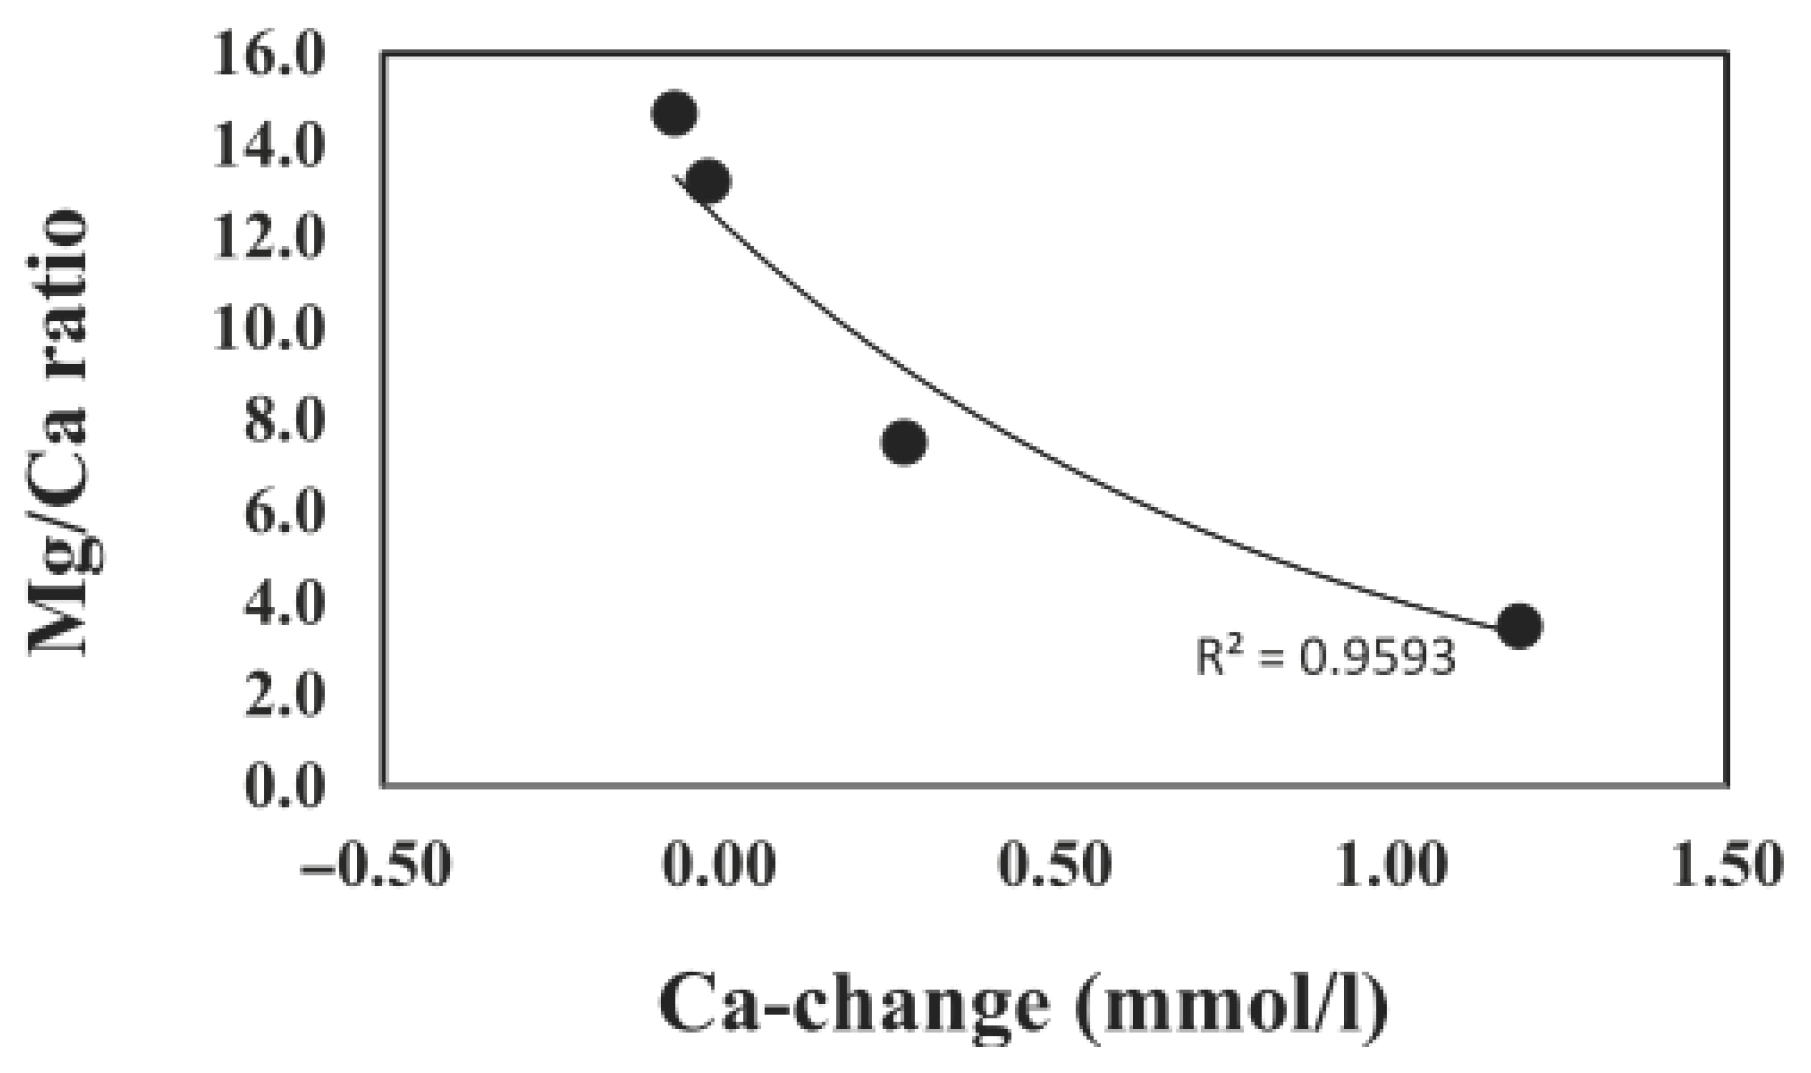
3.3. Leaching Experiments

The results of the ash leaching experiments are shown in Figure 3 and Appendix A. The pH of the water samples used in the experiments was 9.42, which is lower than that measured onboard (pH 9.73). Regardless of the chemistry of volcanic ash, the pH in all experiments increased rapidly within 1 h of the ash mixing of about 0.4 to 0.5 pH units, and pH remained nearly constant during the 3 h, 6 h, and 24 h experiments. Experimental errors in pH measurements were negligible (<0.01).
Dissolved anion and cation concentrations in the ash leachates showed variable patterns, including (a) relatively low variations in nitrate with an initial decrease, (b) a sharp initial decrease followed by a significant increase in phosphate, and (c) a net increase in silica (Figure 3). Low initial nitrate concentrations in lake water were further depleted within the first hour, and nitrate concentrations remained below the initial levels for Hekla, Rabaul-Tavurvur, and Sakurajima ashes. Only for the Arenal sample, nitrate concentrations were slightly above the initial levels at the end of the 24 h experiment, with a small net increase of 0.14 ± 0.04 µmol/g ash (Figure 3).
Phosphate concentrations in all leachates also showed an initial decrease during the first hour of leaching. Rabaul and Arenal samples showed further decreases in phosphate in the the 3 h experiments (−4.4 ± 0.2 µmol/g ash) (Figure 3). After 6 h of leaching, phosphate concentrations increased significantly and reached values as high as 15.8 ± 0.2 µmol/g ash for the Arenal sample and 12.9 ± 0.2 µmol/g ash for the Rabaul-Tavurvur sample. Silica concentrations increased significantly within the 6 h of leaching, with the highest input from the Hekla sample being 11.2 ± 0.2 µmol/g ash. Unlike nitrate and phosphate levels, silica levels were above the initial concentrations in all experiments (Figure 3).
ICP-ES analyses of the ash leachates showed that the concentrations of Na, K, Ca, and Sr increased in most cases, except for Mg (Figure 3). In general, the release of ions occurred during the initial interaction of volcanic ashes and lake water. Na concentrations showed the highest increase, which rose from initial concentrations of 336.4 mmol/L to 341.5 mmol/L in the Arenal ash leachate (Figure 3). The highest net releases per gram of ash were 5.09 ± 0.15 mmol/L Na, 0.46 ± 0.04 mmol/L K, 1.19 ± 0.02 mmol/L Ca, 0.4 ± 0.001 µmol/L Sr, and 1.09 ± 0.19 mmol/L S (Figure 3). In contrast, Mg concentrations decreased with increasing leaching time and remained below the lake water initial concentrations for all ash leachates (Figure 3). The highest decrease in Mg concentrations was from 5.31 mmol/L to 4.90 mmol/L, with a net decrease of 0.41 ± 0.09 mmol Mg/g ash. The Arenal ash sample with rhyolite composition showed the highest concentrations of Na and K and the lowest for Mg and Ca, while the Sakurajima ash sample with dacite composition showed the highest concentrations of Ca, Sr, and S (Figure 3).

4. Discussion

The results show that the deposition of volcanic ash on alkaline lakes can affect the chemistry of lake water through the leaching of volcanic ash (Figure 3). The Chl-a measurement was 1.73 ± 0.3 µg/L, indicating low-to-moderate levels of phytoplankton production and oligotrophic conditions in the sampling point about 20 km off the lake coast of Lake Van (Figure 1). Phytoplankton communities were found to be dominated by cyanobacteria (95%), while diatoms contributed a smaller proportion (5%). Previous investigations have also suggested that a limited primary productivity in Lake Van, and the limiting factor has been suggested to be nitrogen [41].
The elemental ratio in the organic matter in the phytoplankton and throughout the deep ocean is referred to as the ‘Redfield ratio’; it is commonly considered to reflect the elemental ratios in seawater [42] and used to detect the limiting nutrient [43]. Also, nutrient stoichiometry may determine the phytoplankton growth rate and species composition [44,45]. The N:P ratio calculated for the Lake Van water sample was 0.06 (Figure 4). Although the N:P ratio of the phytoplankton in Lake Van is unknown, assuming a N:P of 16:1 [43], the N:P ratio of Lake Van is below 16, indicating a nitrogen limitation.
Also, the dominance of cyanobacteria, which are known as nitrogen-fixers, supports the nitrogen limitation in Lake Van (Figure 4). However, as the measurements depend on a single sampling point, the limiting factor may vary in different locations of the lake. The N:P ratio in the ash leachates increased from 0.06 up to 0.14, and 0.16 with the dacitic composition of the Arenal and Rabaul-Tavuvur ash samples (Figure 4). An increase in the N:P ratio during ash dissolution can also favor phytoplankton growth.
Water pH, volcanic ash composition, and the mixing ratio of ash and water are found to be important parameters that can control the element mobilization from volcanic particles [25,46]. For examples, rapid pH drop has been considered to cause potential mass mortality in aquatic organisms (e.g., pteropod mortality due to the eruptions of the Soufrière Hills volcano) [8]. In the leaching experiments presented in this study, a rapid increase in leachate pH of about 0.4 to 0.5 units was measured for all four ash samples regardless of chemistry (Figure 3). pH increase can be significant considering that alkaline waters have very high buffering capacity and affect biological production in the lakes.
The impact of volcanic eruptions can vary from a couple of weeks to three months (e.g., Gulf of Alaska, three months; [14]). The highest impact of ash fall on the phytoplankton production in alkaline lakes is likely to be within the initial hours of deposition. Based on Stoke’s Law, the residence times of individual particles in the upper 100 m of the water column range amount to a few minutes for coarser particles (2000–150 µm), 1–2 h for medium-size particles (250–150 µm), and 1–2 days for fine ash particles (<50 µm) to pass [3]. However, in nature, volcanic ash particles commonly form aggregates described as clusters of fine and coarse ash that are attached to each other, which lead to high deposition rates of more than 70 m/h, e.g., the Pinatubo 1991 ash fallout [47]. In the case of Lake Van, ash particles would settle within 3–4 h as aggregates at the maximum lake depth of 245 m. And when the eruptions deposit pumice ash, as the pumice floats on the water, they can also form a blanket on the lakes and affect the entire ecosystem of the lakes, including the fish and zooplankton.
Phosphate is one of the most common nutrients for phytoplankton. Phosphate release in ash leachates reached maximum concentrations in the 24 h experiments (e.g., 22.5 µmol/L in the Arenal sample and 19.09 µmol/L for the Rabaul sample; Figure 3). Although the N:P ratio suggested a nitrogen limitation, an increase in the phosphate can fertilize the phytoplankton, as the necessary nitrogen can be fixed through atmospheric N2 by the cyanobacteria as they contribute to 95% of the phytoplankton community. In the experiments, Si, Na, K, Ca, Sr, and S showed an initial high release of the element and slight reduction in the 6 h and 24 h contact times (Figure 3).
Earlier ash leaching experiments with seawater showed increased nutrient concentrations within the first 20–30 min, which remain relatively constant with increasing contact time for ash and water [4]. In the experiments on alkaline water, an initial decrease in the nutrient levels was observed, which may be related to the absorption of anions on the ash particles in high-pH waters (Figure 3).
In general, the concentrations of the elements of the ash samples (Table 3) were not correlated with the release or loss of elements in the leachates (e.g., Si content vs. Si release). Correlations between the elemental content of volcanic ash and the corresponding amounts released during leaching were evaluated using the coefficient of determination (R2). Among the measured elements in the leaching experiments, the correlation values were generally low across most elements, indicating weak relationships between total content and leached concentrations. The R2 values were as follows: Si = 0.0187, Mg = 0.0414, Ca = 0.285, Na = 0.2482, K = 0.0180, P = 0.2393, and S = 0.0017 (Al, Fe, Ti, Mn, and Cl correlations were not measured in the leaching experiments). On the other hand, the Mg/Ca ratio of the leachates was correlated with the Ca release from the volcanic ashes (R2 = 0.9592) (Figure 5).
The Arenal ash sample with dacite composition showed the highest concentrations of Na, K, and the lowest of Mg and Ca, while the Sakurajima ash sample with rhyolite composition showed the highest concentrations of Ca, Sr, and S in the ash leachates (Figure 3). It is likely that the leachate concentrations were controlled more by the surface chemistry of the ashes, as the duration of experiments were limited to 1 day. Also, the dissolution rate of volcanic particles was lower in solutions with high pH [25]. Volcanic ashes were coated with soluble salt films that formed during the eruption plume with ash particles interacting with volcanic gases and the atmosphere and were in the form of sulfates and halides [48]. As the element compositions ashes were based on the volcanic glass chemistry, the content of a specific element did not show a strong correlation with the element release in the ash leachates.
Diatoms, which have silica skeletons, are known to thrive in high-silica environments, particularly in alkaline lakes where silica availability can become a limiting factor for growth [49,50]. Therefore, available silica is especially important for diatoms. Volcanic ashes of all compositions showed a significant increase in SiO2 concentrations (Figure 3). Dissolved Si concentrations increased from 10.5 µmol/L up to 23.8 µmol/L, with the highest concentration observed in the 3 h experiment with the Arenal sample (Figure 3). However, the Si content derived from volcanic glass shards were not correlated with the Si release into the alkaline waters. The silica released in the experiments is likely sourced from silicate minerals (e.g., Na-rich albite) rather than from volcanic glass shards. The input of silica has potential to favor the growth of diatoms and hence alter the phytoplankton population dynamics towards a more diatom-dominated community structure.
The Mg concentration in the Lake Van water sample was 5.31 mmol/L; Mg concentrations were decreased in Sakurajima ash with rhyolite composition and Rabaul-Tavurvur ash with trachy-dacite composition, remained relatively constant in Hekla ash with basaltic andesite composition, and were slightly increased in the Arenal sample with dacite composition (Figure 3). The loss of Mg in the Sakurajima and Rabaul-Tavurvur experiments was probably due to quick precipitation in the form of magnesium hydroxides, as reported previously [51]. The formation of Mg hydroxides was reported in the presence of increased amounts of OH ions [52]. Also, the Mg/Ca ratio was found to play a role in the precipitation of Mg [53].
The Mg/Ca ratio plays a significant role in regulating carbonate mineralogy and microbialite formation, especially in high-pH systems [54,55,56]. The Mg/Ca ratio of the lake water sample was 13.3 before the experiments, and dropped down to as low as 3.2 (Sakurajima ash with rhyolite composition). A Mg/Ca ratio between 2 and 12 favors the precipitation of high magnesium calcite, while Mg/Ca > 12 results in aragonite formation [53]. The leaching experiments showed that the ash input likely favors the precipitation of calcium carbonate in the ash fallout region. Mg in ash leachate may inhibit the formation of calcium carbonate and favor the formation of inorganic precipitates of aragonite. The Mg/Ca ratio was found to be strongly correlated (R2 = 0.96) with the Ca concentrations in the ash leachates, showing higher Ca release with lower Mg/Ca rations (Figure 6). Changes in the Mg/Ca ratio can also affect the composition of microbialates through the precipitation of low-Mg aragonite and calcite due to the activity of cyanobacteria, which are common in Lake Van [32].
Volcanic ash can influence lake biogeochemistry not only through immediate interactions with the water column but also via long-term processes such as through the gradual dissolution of mineral components and the downstream transport of solutes via meltwater runoff originating from volcanic terrains. These prolonged inputs can alter nutrient fluxes and elemental availability in receiving aquatic ecosystems, potentially impacting primary productivity and biogeochemical cycling over extended periods [57]. On the long-term time scales, the slow alteration of volcanic deposits on the lake floor can further mobilize elements (on a days to years scale) [58,59]. The post-depositional alteration of tephra can therefore provide a mechanism that impacts the chemistry and the biogeochemical conditions of the entire lake. Indeed, the relationship between alkaline lakes and volcanism has been attributed to the input of large quantities of Na and K resulting from the long-term weathering and alteration of volcanic rocks, which in turn increases the alkalinity of the water body [20].

5. Conclusions

This study demonstrates that volcanic ash deposition can significantly alter the biogeochemical conditions of alkaline lakes through rapid leaching processes. Leaching experiments with Lake Van water revealed that volcanic ash introduces considerable amounts of bioavailable elements such as silica, phosphate, sodium, and calcium into the water, with variable effects depending on ash composition. A notable increase in pH was observed across all experiments, despite the high buffering capacity of the alkaline lake water.
The initial depletion and subsequent enrichment of nutrients, particularly phosphate and silica, indicate a complex interaction between ash particles and alkaline lake water chemistry. Although nitrogen remained a limiting factor, as indicated by low N:P ratios, the dominance of nitrogen-fixing cyanobacteria suggests that volcanic ash-induced phosphate input could still enhance primary productivity. Similarly to the phytoplankton stimulation observed in marine and coastal waters following ash deposition, our results suggest that ash-derived nutrients could also affect phytoplankton growth in alkaline lake systems.
Moreover, the shifts in Mg/Ca ratios and resulting carbonate precipitation highlight the potential mineralogical and ecological impacts in the ash fallout zones. These findings underscore the importance of volcanic inputs in shaping nutrient dynamics, primary production, and mineral equilibria in alkaline lake systems such as Lake Van.
Overall, the results highlight the short-term biogeochemical impact of volcanic ash on nutrient and element dynamics, pH buffering, and carbonate chemistry in alkaline lake systems.

Funding

This research was funded by FP7 People: Marie-Curie Actions Co-Funded Brain Circulation Scheme and Türkiye Bilimsel ve Teknolojik Araştırma Kurumu (TÜBİTAK) Grant-2236 under the EVOLVAN project (Environmental Impacts of Subaerial Volcanic Eruptions on Alkaline Lakes—A Case Study on Lake Van in Eastern Turkey, Project No. 112C001), led by Nazlı Olgun.

Data Availability Statement

The data are available upon request.

Acknowledgments

This research was supported by the European Commission’s Marie Skłodowska-Curie Actions Co-Funded Brain Circulation Scheme and The Scientific and Technological Research Council of Türkiye (TÜBİTAK) Grant-2236 under the EVOLVAN project (Environmental Impacts of Subaerial Volcanic Eruptions on Alkaline Lakes—A Case Study on Lake Van in Eastern Turkey, Project No. 112C001), led by Nazlı Olgun. I gratefully acknowledge the crew of the boat for their assistance during water sampling. I am also thankful to Nihayet Bizsel for her guidance on phytoplankton analyses and to Estrella Maria Lopez Ramon for her valuable support during the leaching experiments.

Conflicts of Interest

The author declares no conflicts of interest. The funders had no role in the design of the study; in the collection, analyses, or interpretation of data; in the writing of the manuscript; or in the decision to publish the results.

Appendix A

Table A1. Results of leaching experiments with volcanic ash and surface lake water of Lake Van showing the changes in pH, nutrients, and major anions and cations. The first row, “Lake Van onboard”, shows the measured values on the boat on 6 July 2014. Initial experiments showed the pH measured just before the leaching experiments. Experiments were performed by mixing 20 mg of volcanic ash in 200 mL lake water with increasing durations of 1, 3, 6, and 24 h. Nutrient measurements were conducted spectrophotometrically; metal concentrations were measured by ICP-OES.
TimepHNitratePhosphateSilicaNaKCaMgSrSB
(h) µmol/Lµmol/Lµmol/Lmmol/Lmmol/Lmmol/Lmmol/Lµmol/Lmmol/Lmmol/L
Lake Van onboard 9.73 ± 0.001 0.386.2110.49336.3711.410.405.310.1827.299.86
Hekla
Initial t = 009.420.386.2110.49336.3711.410.405.310.1827.299.86
Hekla 1 h 1 g/L19.770.164.1114.31336.3711.590.375.140.2127.729.90
Hekla 3 h 1 g/L39.760.275.2617.48336.4111.610.395.140.2428.079.97
Hekla 6 h 1 g/L69.770.277.1616.31336.7611.640.385.140.2428.079.90
Hekla 24 h 1 g/L249.790.2710.6714.31337.5011.540.385.060.2127.699.87
Arenal
İnitial exps.09.420.386.2110.49336.3711.410.405.310.1827.299.86
Arenal 1 h 1 g/L19.770.223.4718.64341.4611.820.375.020.2127.699.71
Arenal 3 h 1 g/L39.760.281.8123.80340.7211.870.374.980.2227.829.73
Arenal 6 h 1 g/L69.770.406.8420.47340.0711.840.364.940.2127.919.60
Arenal 24 h 1 g/L249.770.5222.0516.64337.7611.820.334.900.2127.5710.24
Rabaul
İnitial exps.09.420.386.2110.49336.3711.410.405.310.1827.299.86
Rabaul 1 h 1 g/L19.780.164.0712.32337.1111.770.555.140.2527.799.86
Rabaul 3 h 1 g/L39.770.271.9013.81336.8011.660.605.100.2927.979.81
Rabaul 6 h 1 g/L69.770.324.7412.98336.4611.690.635.060.2728.079.81
Rabaul 24 h 1 g/L249.790.3219.0912.52336.6711.640.675.060.2627.769.83
Sakura
İnitial exps.09.420.386.2110.49336.3711.410.405.310.1827.299.86
Sakura 1 h 1 g/L19.780.223.4714.63340.5411.611.475.100.4628.199.91
Sakura 3 h 1 g/L39.770.275.0519.47339.8511.641.595.100.4828.389.92
Sakura 6 h 1 g/L69.790.307.2017.11339.0611.591.505.060.4528.329.86
Sakura 24 h 1 g/L249.760.3811.1417.01338.5411.561.424.940.4028.139.85

References

  1. Frogner, P.; Gislason, S.R.; Óskarsson, N. Fertilizing potential of volcanic ash in ocean surface water. Geology 2001, 29, 487–490. [Google Scholar] [CrossRef]
  2. Frogner Kockum, P.C. A diverse ecosystem response to volcanic aerosols. Chem. Geol. 2006, 231, 57–66. [Google Scholar] [CrossRef]
  3. Duggen, S.; Croot, P.; Schacht, U.; Hoffmann, L. Subduction zone volcanic ash can fertilize the surface ocean and stimulate phytoplankton growth: Evidence from biogeochemical experiments and satellite data. Geophys. Res. Lett. 2007, 34, L01612. [Google Scholar] [CrossRef]
  4. Olgun, N.; Duggen, S.; Croot, P.L.; Delmelle, P.; Dietze, H.; Schacht, U.; Óskarsson, N.; Siebe, C.; Auer, A. Surface ocean iron fertilization: The role of airborne volcanic ash from subduction zone and hotspot volcanoes and related iron-fluxes into the Pacific Ocean. Glob. Biogeochem. Cycles 2011, 25, GB4001. [Google Scholar] [CrossRef]
  5. Hoffmann, L.; Breitbarth, E.; Ardelan, M.V.; Duggen, S.; Olgun, N.; Hassellöv, M.; Wanberg, S.A. Influence of trace metal release from volcanic ash on growth of Thalassiosira pseudonana and Emiliania huxleyi. Mar. Chem. 2012, 132–133, 28–33. [Google Scholar] [CrossRef]
  6. Jones, M.T.; Gislason, S.R. Rapid releases of metal salts and nutrients following the deposition of volcanic ash into aqueous environments. Geochim. Cosmochim. Acta 2008, 72, 3661–3680. [Google Scholar] [CrossRef]
  7. Stewart, C.; Johnston, D.M.; Leonard, G.S.; Horwell, C.J.; Thordarson, T.; Cronin, S.J. Contamination of water supplies by volcanic ashfall: A literature review and simple impact modelling. J. Volcanol. Geotherm. Res. 2006, 158, 296–306. [Google Scholar] [CrossRef]
  8. Wall-Palmer, D.; Jones, M.T.; Hart, M.B.; Fisher, J.K.; Smart, C.W.; Hembury, D.J.; Palmer, M.R.; Fones, G.R. Explosive volcanism as a cause for mass mortality of pteropods. Mar. Geol. 2011, 282, 231–239. [Google Scholar] [CrossRef]
  9. Sarmiento, J.L. Atmospheric CO2 stalled. Nature 1993, 365, 697–698. [Google Scholar] [CrossRef]
  10. Watson, A.J. Volcanic Fe, CO2, ocean productivity and climate. Nature 1997, 385, 587–588. [Google Scholar] [CrossRef]
  11. Spirakis, C.S. Iron fertilization with volcanic ash. Eos Trans. Am. Geophys. Union 1991, 72, 525. [Google Scholar] [CrossRef]
  12. Hoffmann, L.; Breitbarth, E.; Ardelan, M.V.; Duggen, S.; Olgun, N.; Hasselhö, M.; Wängberg, S.A. Influence of volcanic ash and pumice on phytoplankton growth and Cu ligand production of Thalassiosira pseudonana and Emiliania huxleyi. Mar. Chem. 2012, 132–133, 28–33. [Google Scholar]
  13. Hamme, R.C.; Webley, P.W.; Crawford, W.R.; Whitney, F.A.; DeGrandpre, M.D.; Emerson, S.R.; Eriksen, C.C.; Giesbrecht, K.E.; Gower, J.F.R.; Kavanaugh, M.T.; et al. Volcanic ash fuels anomalous plankton bloom in subarctic northeast Pacific. Geophys. Res. Lett. 2010, 37, L19604. [Google Scholar] [CrossRef]
  14. Langmann, B.; Zaksek, K.; Hort, M.; Duggen, S. Volcanic ash as fertiliser for the surface ocean. Atmos. Chem. Phys. 2010, 10, 3891–3899. [Google Scholar] [CrossRef]
  15. Lin, I.I.; Hu, C.; Li, Y.H.; Ho, T.Y.; Fischer, T.P.; Wong, G.T.F.; Wu, J.; Huang, C.W.; Chu, D.A.; Ko, D.S.; et al. Fertilization potential of volcanic dust in the low-nutrient low-chlorophyll western North Pacific subtropical gyre: Satellite evidence and laboratory study. Glob. Biogeochem. Cycles 2011, 25, GB1006. [Google Scholar] [CrossRef]
  16. Uematsu, M.; Toratani, M.; Kajino, M.; Narita, Y.; Senga, Y.; Kimoto, T. Enhancement of primary productivity in the western North Pacific caused by the eruption of the Miyake-jima volcano. Geophys. Res. Lett. 2004, 31, L06106. [Google Scholar] [CrossRef]
  17. Censi, P.; Randazzo, L.A.; Zuddas, P.; Saiano, F.; Aricò, P.; Andò, S. Trace element behaviour in seawater during Etna’s pyroclastic activity in 2001: Concurrent effects of nutrients and formation of alteration minerals. J. Volcanol. Geotherm. Res. 2010, 193, 106–116. [Google Scholar] [CrossRef]
  18. Bisson, K.M.; Gassó, S.; Mahowald, N.; Wagner, S.; Koffman, B.; Carn, S.A.; Wilson, C. Observing ocean ecosystem responses to volcanic ash. Remote Sens. Environ. 2023, 296, 113749. [Google Scholar] [CrossRef]
  19. Carrillo, U.; Díaz-Villanueva, V. Impacts of volcanic eruptions and early recovery in freshwater environments and organisms. Biol. Rev. 2021, 96, 2546–2560. [Google Scholar] [CrossRef] [PubMed]
  20. Kempe, S.; Karmierczak, J. Biogenesis and Early Life on Earth and Europa: Favored by an Alkaline Ocean? Astrobiology 2002, 2, 123–130. [Google Scholar] [CrossRef] [PubMed]
  21. Sigurdsson, H.; Houghton, B.; McNutt, S.R.; Rymer, H.; Stix, J. (Eds.) Encyclopedia of Volcanoes; Academic Press: San Diego, CA, USA, 2000. [Google Scholar]
  22. Eicher, G.J.; Rousefell, G.A. Effects of lake fertilization by volcanic activity on abundance of salmon. Adv. Sci. Limnol. Oceanogr. 1957, 2, 70–76. [Google Scholar] [CrossRef]
  23. Smith, M.A.; White, M. Observations on lakes near Mount St. Helens: Phytoplankton. J. Arch. Hydrobiol. 1985, 104, 345–363. [Google Scholar] [CrossRef]
  24. Birks, H.J.B.; Lotter, A.F. The impact of the Laacher See Volcano (11000 yr B.P.) on terrestrial vegetation and diatoms. J. Paleolimnol. 1994, 11, 313–322. [Google Scholar] [CrossRef]
  25. Witham, C.S.; Oppenheimer, C.; Horwell, C.J. Volcanic ash-leachates: A review and recommendations for sampling methods. J. Volcanol. Geotherm. Res. 2005, 141, 299–326. [Google Scholar] [CrossRef]
  26. Olgun, N.; Duggen, S.; Langmann, B.; Hort, M.; Waythomas, C.F.; Hoffmann, L.; Croot, P. Geochemical evidence of oceanic iron fertilization by the Kasatochi (2008) volcanic eruption and evaluation of the potential impacts on sockeye salmon population. Mar. Ecol. Prog. Ser. 2013, 488, 81–83. [Google Scholar] [CrossRef]
  27. Parsons, T.R.; Whitney, F.A. Did volcanic ash from Mt. Kasatochi in 2008 contribute to a phenomenal increase in Fraser River sockeye salmon (Oncorhynchus nerka) in 2010? Fish. Oceanogr. 2012, 21, 374–377. [Google Scholar] [CrossRef]
  28. Dal Poggetto, G.; Douwe, P.; Stroscio, A.; Kamseu, E.; Lancellotti, I.; Elimbi, A.; Leonelli, C. Dissolution of Volcanic Ash in Alkaline Environment for Cold Consolidation of Inorganic Binders. Materials 2024, 17, 5068. [Google Scholar] [CrossRef] [PubMed]
  29. Schagerl, M.; Oduor, S.O. Phytoplankton community relationship to environmental variables in three Kenyan Rift Valley saline–alkaline lakes. Mar. Freshw. Res. 2008, 59, 125–136. [Google Scholar] [CrossRef]
  30. Ballot, A.; Krienitz, L.; Kotut, K.; Wiegand, C.; Metcalf, J.S.; Codd, G.A.; Pflugmacher, S. Cyanobacteria and cyanobacterial toxins in three alkaline Rift Valley lakes of Kenya—Lakes Bogoria, Nakuru and Elmenteita. J. Plankton Res. 2004, 26, 925–935. [Google Scholar] [CrossRef]
  31. Wagaw, S.; Mengistou, S.; Getahun, A. Phytoplankton community structure in relation to physico-chemical factors in a tropical soda lake, Lake Shala (Ethiopia). Afr. J. Aquat. Sci. 2021, 46, 428–440. [Google Scholar] [CrossRef]
  32. Kempe, S.; Kazmierczak, J.; Landmann, G.; Konuk, T.; Reimer, A.; Lipp, A. Largest known microbialites discovered in Lake Van, Turkey. Nature 1991, 349, 605–608. [Google Scholar] [CrossRef]
  33. Hach Company. Water Analysis Handbook; Hach Company: Loveland, CO, USA, 2002. [Google Scholar]
  34. U.S. Environmental Protection Agency. Method 200.8: Determination of Trace Elements in Waters and Wastes by Inductively Coupled Plasma-Mass Spectrometry (ICP-MS); Environmental Monitoring Systems Laboratory, Office of Research and Development: Cincinnati, OH, USA, 1994.
  35. U.S. Environmental Protection Agency. Method 200.7: Determination of Metals and Trace Elements in Water and Wastes by Inductively Coupled Plasma-Atomic Emission Spectrometry (ICP-AES); Environmental Monitoring Systems Laboratory, Office of Research and Development: Cincinnati, OH, USA, 1994.
  36. APHA. Standard Methods for the Examination of Water and Wastewater, 20th ed.; Clesceri, L.S., Greenberg, A.E., Eaton, A.D., Eds.; American Water Works Association, Water Environment Federation: Denver, CO, USA, 1999. [Google Scholar]
  37. OECD. Eutrophication of Waters: Monitoring, Assessment and Control; Organisation for Economic Co-operation and Development: Paris, France, 1982. [Google Scholar]
  38. Utermöhl, H. Zur Vervollkommnung der quantitativen Phytoplankton-Methodik. Mitt. Int. Verein. Theor. Angew. Limnol. 1958, 9, 1–38. [Google Scholar] [CrossRef]
  39. Guiry, M.D.; Guiry, G.M. AlgaeBase. World-Wide Electronic Publication. 2014. Available online: https://www.algaebase.org (accessed on 1 September 2014).
  40. Olgun, N.; Duggen, S.; Andronico, D.; Kutterolf, S.; Croot, P.L.; Giammanco, S.; Censi, P.; Randazzo, L. Possible impacts of volcanic ash emissions of Mount Etna on the primary productivity in the oligotrophic Mediterranean Sea: Results from nutrient-release experiments in seawater. Mar. Chem. 2013, 152, 32–42. [Google Scholar] [CrossRef]
  41. Reimer, A.; Landmann, G.; Kempe, S. Lake Van, Eastern Anatolia, Hydrochemistry and History. Aquat. Geochem. 2009, 15, 195–222. [Google Scholar] [CrossRef]
  42. Redfield, A.C. The biological control of chemical factors in the environment. Am. Sci. 1958, 46, 205–221. [Google Scholar]
  43. Redfield, A.C. On the proportions of organic derivatives in sea water and their relation to the composition of plankton. In James Johnston Memorial Volume; Liverpool University Press: Liverpool, UK, 1934; pp. 176–192. [Google Scholar]
  44. Hecky, R.E.; Campbell, P.; Hendzel, L.L. The stoichiometry of carbon, nitrogen, and phosphorus in particulate matter of lakes and oceans. Limnol. Oceanogr. 1993, 38, 709–724. [Google Scholar] [CrossRef]
  45. Kilham, S.S. Relationship of phytoplankton and nutrients to stoichiometric measures. In Large lakes: Ecological structure and function; Tilzer, M.M., Serruya, C., Eds.; Springer: Berlin/Heidelberg, Germany, 1990; pp. 403–414. [Google Scholar]
  46. Duggen, S.; Olgun, N.; Croot, P.; Hoffmann, L.; Dietze, H.; Teschner, C. The role of airborne volcanic ash for the surface ocean biogeochemical iron-cycle: A review. Biogeosciences 2010, 7, 827–844. [Google Scholar] [CrossRef]
  47. Wiesner, M.G.; Wang, Y.; Zheng, L. Fallout of volcanic ash to the deep South China Sea induced by the 1991 eruption of Mount Pinatubo (Philippines). Geology 1995, 23, 885–888. [Google Scholar] [CrossRef]
  48. Delmelle, P.; Lambert, M.; Dufrene, Y.; Gerin, P.; Oskarsson, N. Gas/aerosol–ash interaction in volcanic plumes: New insights from surface analyses of fine ash particles. Earth Planet. Sci. Lett. 2007, 259, 159–170. [Google Scholar] [CrossRef]
  49. Kilham, P.; Kilham, S.S.; Hecky, R.E. Hypothesized resource relationships among African planktonic diatoms. Limnol. Oceanogr. 1986, 31, 1169–1181. [Google Scholar] [CrossRef]
  50. Hecky, R.E.; Kilham, P. Nutrient limitation of phytoplankton in freshwater and marine environments: A review of recent evidence on the effects of enrichment. Limnol. Oceanogr. 1988, 33, 796–822. [Google Scholar] [CrossRef]
  51. Balci, N.; Menekşe, M.; Karagüler, N.G.; Sönmez, M.Ş.; Meister, P. Reproducing Authigenic Carbonate Precipitation in the Hypersaline Lake Acıgöl (Turkey) with Microbial Cultures. Geomicrobiol. J. 2016, 33, 758–773. [Google Scholar] [CrossRef]
  52. Balci, N.; Demirel, C.; Akçer Ön, S.; Gültekin, A.H.; Kurt, M.A. Evaluating abiotic and microbial factors on carbonate precipitation in Lake Acigol, a hypersaline lake in Southwestern Turkey. Quat. Int. 2018, 486, 116–128. [Google Scholar] [CrossRef]
  53. Müller, G.; Irion, G.; Förstner, U. Formation and diagenesis of inorganic Ca–Mg carbonates in the lacustrine environment. Naturwissenschaften 1972, 59, 158–164. [Google Scholar] [CrossRef]
  54. Dupraz, C.; Reid, R.P.; Braissant, O.; Decho, A.W.; Norman, R.S.; Visscher, P.T. Processes of carbonate precipitation in modern microbial mats. Earth-Sci. Rev. 2009, 96, 141–162. [Google Scholar] [CrossRef]
  55. Gallagher, K.L.; Kading, T.J.; Braissant, O.; Dupraz, C. Inside the alkalinity engine: The role of electron donors in the organomineralization potential of sulfate-reducing bacteria. Geobiology 2013, 11, 269–280. [Google Scholar] [CrossRef] [PubMed]
  56. Zeyen, N.; Daval, D.; Lopez-Garcia, P.; Moreira, D.; Gaillardet, J.; Benzerara, K. Geochemical conditions allowing the formation of modern lacustrine microbialites. Procedia Earth Planet. Sci. 2017, 17, 380–383. [Google Scholar] [CrossRef]
  57. Semkin, P.; Pavlova, G.; Lobanov, V.; Barabanshchikov, Y.; Kukla, S.; Sagalaev, S.; Shvetsova, M.; Shkirnikova, E.; Tishchenko, P.; Tibenko, E.; et al. Nutrient Flux under the Influence of Melt Water Runoff from Volcanic Territories and Ecosystem Response of Vilyuchinskaya and Avachinskaya Bays in Southeastern Kamchatka. J. Mar. Sci. Eng. 2023, 11, 1299. [Google Scholar] [CrossRef]
  58. Schacht, U.; Wallmann, K.; Kutterolf, S.; Schmidt, M. Volcanogenic sediment-seawater interactions and the geochemistry of pore waters. Chem. Geol. 2008, 249, 321–338. [Google Scholar] [CrossRef]
  59. Schacht, U. Alteration of Volcanic Glasses in Marine Sediments: Laboratory Experiments and Field Studies. Ph.D. Thesis, University of Kiel, Kiel, Germany, 2005. [Google Scholar]
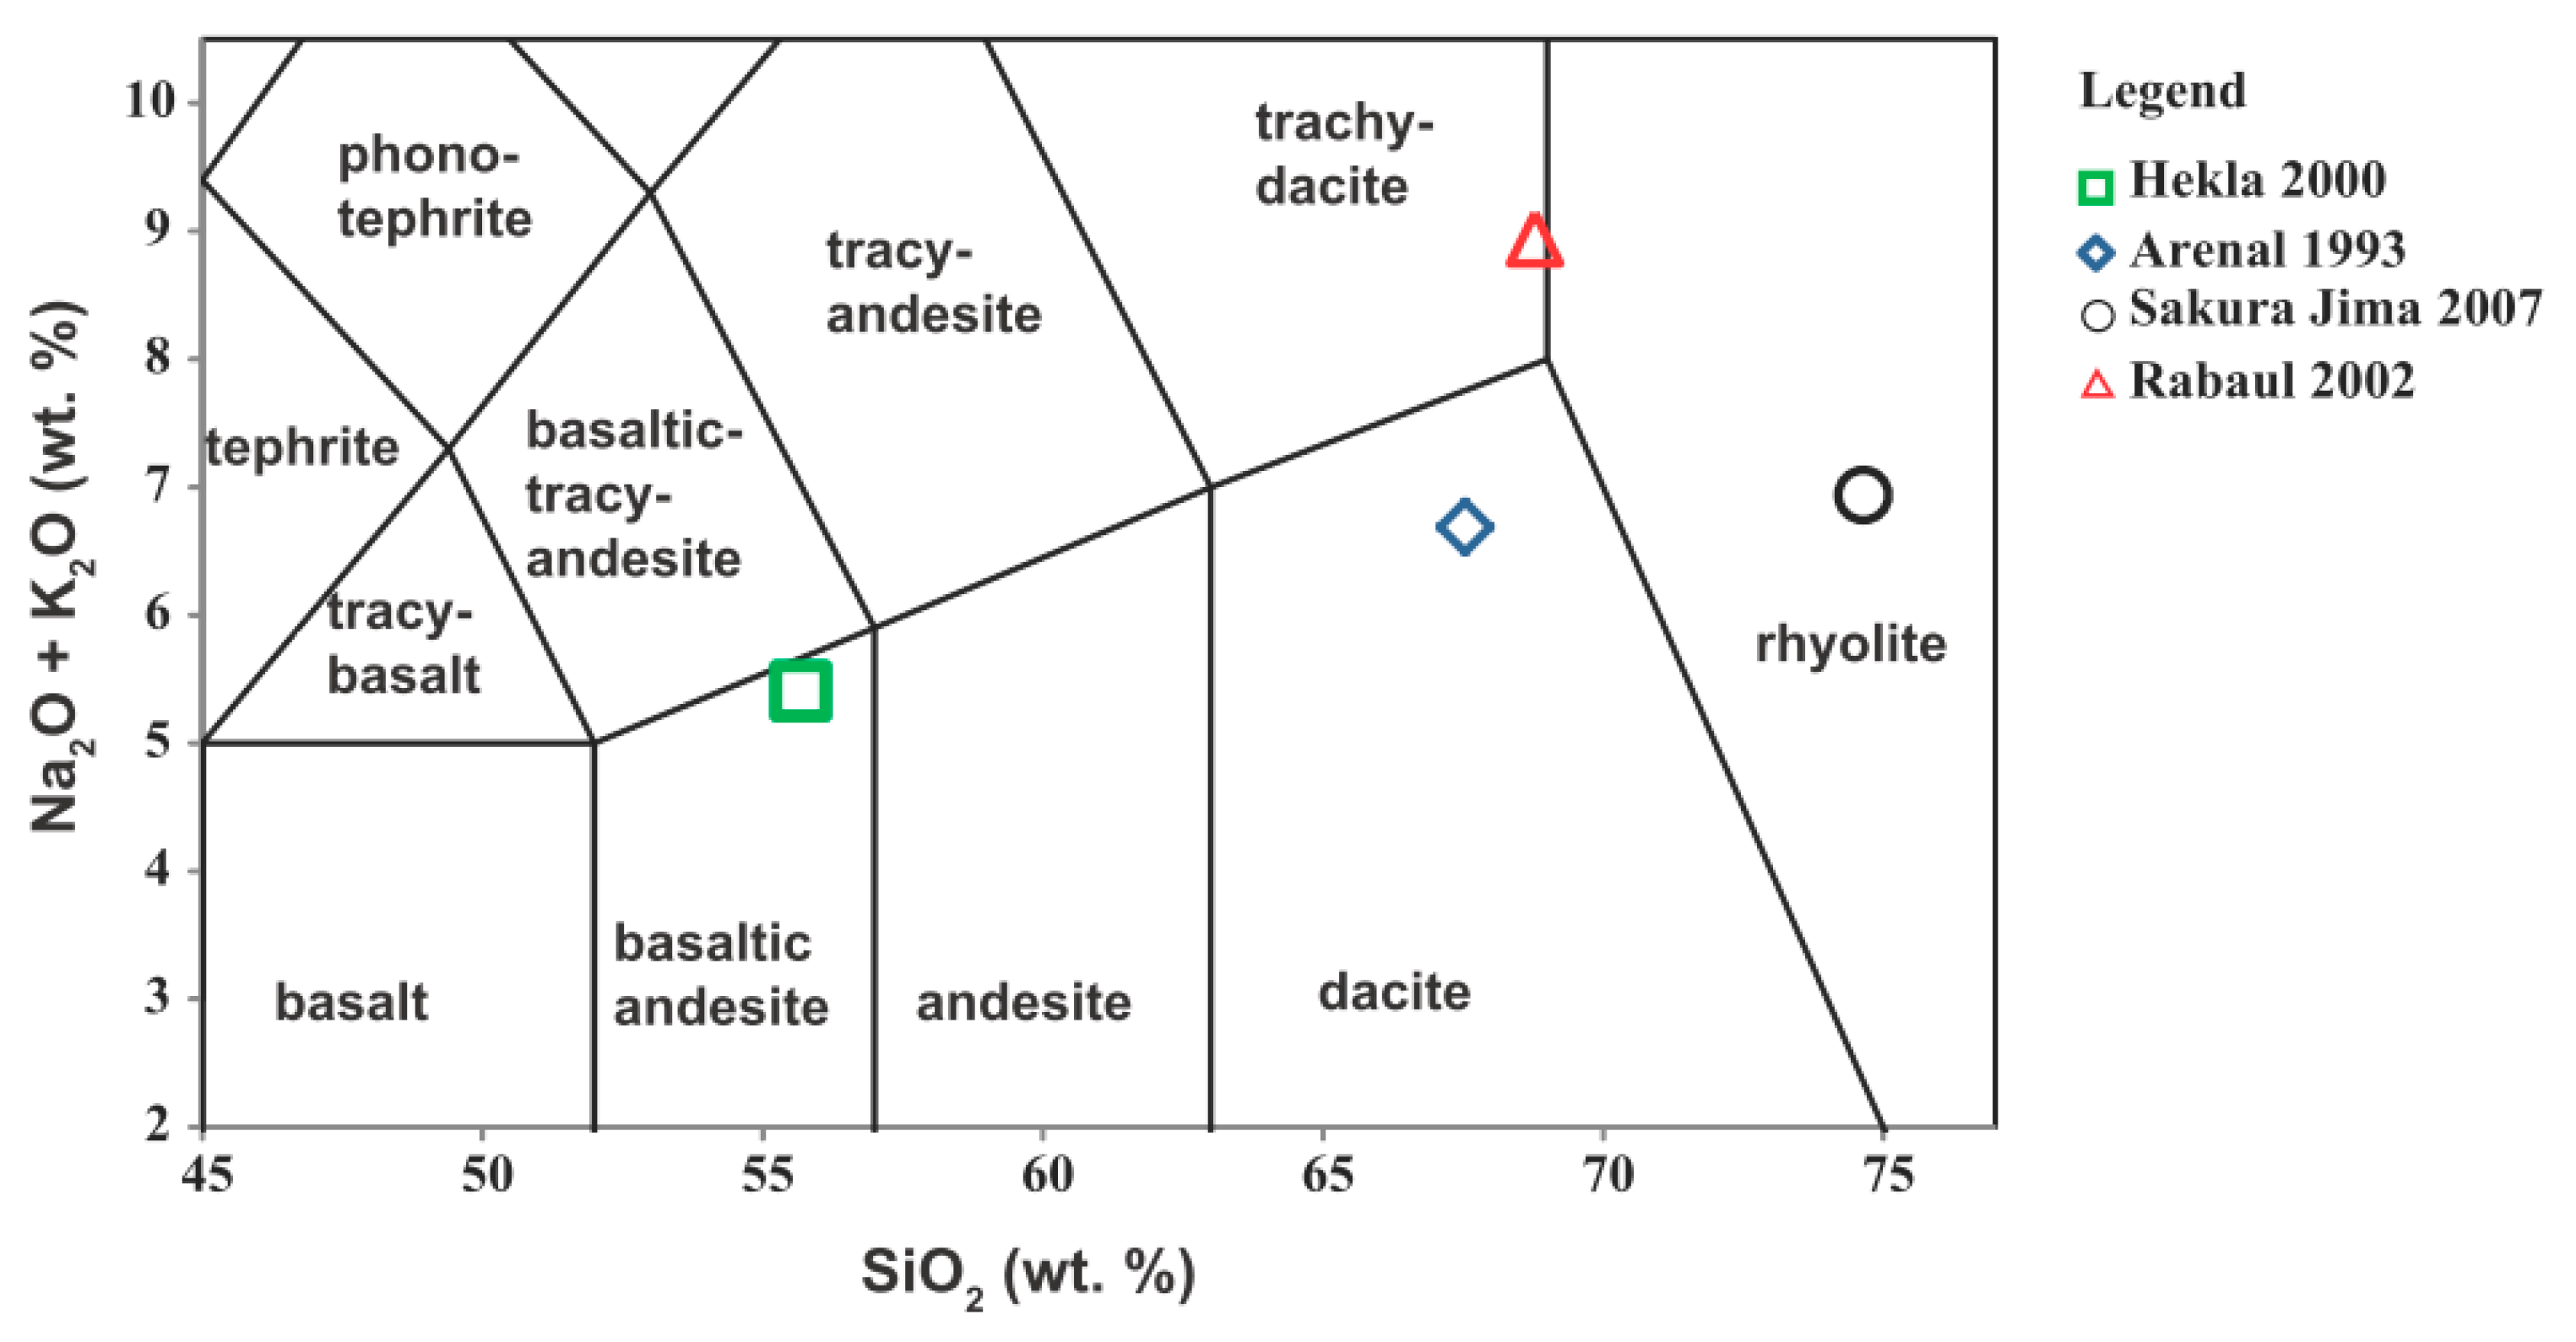
Figure 1. Maps showing (a) the locations of the major alkali (soda) lakes of the world, modified from [20]; the distribution of subaerial Holocene-active volcanoes on Earth (red triangles), modified from [21]; and (b) Lake Van in eastern Türkiye and the location of the lake water sampling site.
Water 17 02171 g001
Figure 2. Classification of volcanic ash samples based on total alkali versus silica (TAS) diagram.
Water 17 02171 g002
Figure 3. Results of leaching experiments with volcanic ash and surface lake water of Lake Van showing the changes in pH, nutrients, and major anions and cations. Initial values show the measured values in the water sample before the leaching experiments. Experiments were conducted by mixing 20 mg of volcanic ash in 200 mL lake water with increasing durations of 1, 3, 6, and 24 h. Nutrient measurements were carried out spectrophotometrically; other element concentrations were measured by ICP-OES.
Water 17 02171 g003
Figure 4. Nitrate to phosphate (N:P) ratio of Lake Van and volcanic ash leachates.
Water 17 02171 g004
Figure 5. Mg/Ca ratio in Lake Van water (t = 0) and volcanic ash leachates.
Water 17 02171 g005
Figure 6. Correlation of Mg/Ca ratio and the Ca concentration in volcanic leachates. Negative values in Ca-change indicate a decrease in Ca compared to initial concentrations.
Water 17 02171 g006
Table 1. Volcanic ash samples used in the ash leaching experiments with alkaline lake water.
Volcanic AshEruption YearLocationComposition
Hekla2000IcelandBasaltic Andesite
Arenal1993Costa RicaDacite
Sakurajima2007JapanRhyolite
Rabaul-Tavurvur2002Papa New GuineaTrachy-Dacite to Rhyolite
Table 2. Chemistry of the water sample from Lake Van.
TemppHNO3PO4SiO2NaKCaMgSrSO4B
(°C) (µmol/L)(µmol/L)(µmol/L)(mmol/L)(mmol/L)(mmol/L)(mmol/L)(mmol/L)(mmol/L)(mmol/L)
Lake Van22.79.73 ± 0.0010.386.2110.49336.3711.410.405.310.1827.299.86
Table 3. Major and minor oxide weight percentages and volatile contents of volcanic glass of ash samples measured with electron microprobe.
SiO2Al2O3FeOMgOCaONa2OK2OTiO2P2O5MnOClSO3
wt.%wt.%wt.%wt.%wt.%wt.%wt.%wt.%wt.%wt.%wt.%wt.%
Hekla55.6813.6611.882.876.603.981.432.290.990.310.040.06
Arenal67.5412.236.391.103.424.272.421.030.420.160.130.01
Sakurajima72.7413.173.870.302.343.413.500.930.270.060.040.01
Rabaul-Tavurvur68.7013.673.550.361.934.913.960.820.140.100.280.01
Disclaimer/Publisher’s Note: The statements, opinions and data contained in all publications are solely those of the individual author(s) and contributor(s) and not of MDPI and/or the editor(s). MDPI and/or the editor(s) disclaim responsibility for any injury to people or property resulting from any ideas, methods, instructions or products referred to in the content.

