Article

Identification of Critical Exposed Elements and Strategies for Mitigating Secondary Hazards in Flood-Induced Coal Mine Accidents

1
School of Management and Economics, North China University of Water Resources and Electric Power, Zhengzhou 450046, China
2
Faculty of Economics and Management, Volodymyr Dahl East Ukrainian National University, 01042 Kyiv, Ukraine
3
School of Economics and Management, Pingdingshan Polytechnic College, Pingdingshan 467001, China
4
Faculty of Social Sciences and Humanities, The National University of Malaysia (UKM), Bangi 43600, Malaysia
*
Authors to whom correspondence should be addressed.
Water 2025, 17(15), 2181; https://doi.org/10.3390/w17152181
Submission received: 14 June 2025 / Revised: 6 July 2025 / Accepted: 17 July 2025 / Published: 22 July 2025
(This article belongs to the Topic Natural Hazards and Disaster Risks Reduction, 2nd Edition)

Abstract

Natech events, involving multi-hazard coupling and cascading effects, pose serious threats to coal mine safety. This paper addresses flood-induced Natech scenarios in coal mining and introduces a two-stage cascading analysis framework based on hazard systems theory. A tri-layered network—comprising natural hazards, exposed elements, and secondary hazards—models hazard propagation. In Stage 1, an improved adjacency information entropy algorithm with multi-hazard coupling coefficients identifies critical exposed elements. In Stage 2, Dijkstra’s algorithm extracts key risk transmission paths. A dual-dimensional classification method, based on entropy and transmission risk, is then applied to prioritize emergency responses. This method integrates the criticality of exposed elements with the risk levels associated with secondary disaster propagation paths. Case studies validate the framework, revealing: (1) Hierarchical heterogeneity in the network, with surface facilities and surrounding hydrological systems as central hubs; shaft and tunnel systems and surrounding geological systems are significantly affected by propagation from these core nodes, exhibiting marked instability. (2) Strong risk polarization in secondary hazard propagation, with core-node-originated paths being more efficient and urgent. (3) The entropy-risk classification enables targeted hazard control, improving efficiency. The study proposes chain-breaking strategies for precise, hierarchical, and timely emergency management, enhancing coal mine resilience to flood-induced Natech events.

1. Introduction

With the rapid advancement of industrialization, incidents of secondary technological hazards induced by natural hazards have become increasingly frequent [1]. These natural hazard-triggered technological accidents, known as Natech (natu-ral-technological) events [2], represent a unique class of cascading hazards characterized by multi-hazard interactions and cross-sectoral propagation [3]. Although relatively rare, Natech events are capable of triggering domino effects that significantly amplify their impact beyond that of conventional accidents [4]. As a result, they have drawn growing attention from emergency management authorities across various administrative levels [5,6].
Coal mines, characterized by complex geological conditions and harsh operational environments, are particularly vulnerable to natural hazards—especially flood-induced compound safety incidents [7]. Floodwater energy can severely impact critical infrastructure within the mining system, often triggering secondary hazards. When such energy exceeds the system’s protective capacity, it may lead to abrupt operational failure, causing significant casualties and systemic disruption [8,9]. For instance, in 2016, heavy rainfall in Nasheng, Guizhou Province flooded the industrial zone of a local coal mine, resulting in eight missing persons due to floodwater backflow. In 2021, torrential rains caused a shaft flooding incident at the Dafengshu Coal Mine in Dazhu County, Sichuan Province, leaving two miners missing and causing direct economic losses of approximately CNY 8.85 million. Similarly, in 2022, prolonged rainfall in Lüliang, Shanxi Province led to multiple flood-related emergencies across coal mining sites [8]. Such flood-triggered coal mine accidents—hereinafter referred to as coal mine–flood Natech events—not only lead to severe injuries and infrastructure failure but also cause cascading impacts including production disruption, workday losses, reduced enterprise profits, and weakened investor confidence [7,10]. Studies have indicated that post-accident shutdown periods, driven by regulatory inspections and safety restructuring, can extend over several weeks or months, posing substantial strain on corporate cash flow [10]. Moreover, the total economic impact extends beyond immediate production losses to encompass indirect costs such as medical compensation, equipment restoration, customer attrition, and reputational damage. These combined factors significantly undermine the competitive capacity of mining enterprises and may further result in decreased regional tax revenues, labor market instability, and increased social security burdens [10,11]. Given the high risk and substantial socioeconomic cost of such compound hazards, a proactive and systematic investment in hazard prevention strategies is both urgent and practically necessary.
Conceptually, Natech events comprise three fundamental components: hazard-causing factors, hazard environments, and exposed elements [12]. Among these, the hazard environment provides the foundational conditions for the formation of hazard-causing factors, while natural hazards, as hazard-causing factors, directly impact the exposed elements of the coal mine through physical shocks or chemical pollution. Under the influence of natural hazards, the exposed elements in coal mines may transform into new hazard-causing factors, leading to severe consequences, including casualties, property losses, ecological pollution, and social unrest [13]. For example, the hazard process of heavy rain → coal mine → flooding of the well → casualties among miners clearly illustrates the two-stage chain evolution path of Natech events. From the dual perspectives of hazard impact and causation, once the exposed element, acting as an “intermediary,” undergoes a state change, it will trigger a chain reaction of secondary hazards, resulting in a more complex and diverse evolution path [14]. Identifying key evolution paths of varying risk levels from numerous paths is crucial for formulating targeted hazard reduction strategies [15]. Therefore, accurately identifying key exposed elements and the propagation paths of secondary hazards, as well as classifying and grading them, followed by implementing precise intervention measures for weak or high-risk links, is vital for breaking the hazard chain and reducing hazard losses.
Natech events often evolve through multiple cascading chains, gradually leading to an interconnected disaster network that exhibits distinct characteristics of complex systems [3]. Recognizing this intrinsic feature, researchers have introduced network modeling and graph-theoretical approaches into the assessment of Natech scenarios [16,17,18,19]. In these models, nodes are typically defined as hazardous events or exposed elements, while edges represent the relationships among crises, thereby enabling the construction of a complex network model of Natech accidents. The strength of this approach lies in its ability to capture latent transmission pathways and identify critical exposed elements within the system [14]. Typically, topological indicators based on complex networks (such as degree centrality, betweenness centrality, closeness centrality, K-shell decomposition, and eigenvector centrality) can be used to assess the importance of exposed elements, ranking their criticality [20,21,22]. Additionally, some emerging algorithms (such as gravitational centrality and PageRank algorithm) have also been introduced to this field [23,24]. However, these methods are often applicable only to specific types of networks (such as undirected unweighted networks or directed weighted networks), which presents certain limitations [25]. To develop a more widely applicable method, reference [26] proposed a network node importance identification algorithm based on Adjacency Information Entropy (AIE). This algorithm is versatile for different types of networks and requires only information from nodes and their neighboring nodes to complete the calculations, offering high computational efficiency, particularly suitable for hazard networks that are urgent and structurally complex. Nevertheless, the aforementioned methods primarily consider factors such as time, efficiency, and cost when determining the weights of nodes or edges, but do not adequately address the coupling issues between them. This issue is crucial in studying Natech events [6], as Natech events often involve the joint action of multiple hazard types, manifesting as a multi-chain coupled network evolution pattern [3]. The coupling effects between hazard chains often lead to consequences that far exceed the mere superposition of single hazard chains [27]. Therefore, when identifying key exposed elements, it is essential to fully consider the coupling effects between hazard nodes to ensure accurate identification of the entities most vulnerable to severe impacts.
In the field of critical path identification, various mature methods have been widely applied, such as analysis methods based on maximum flow, structural holes, and shortest paths [28,29,30]. Among them, maximum flow analysis focuses on path capacity, structural hole analysis emphasizes network connectivity, while shortest path analysis highlights efficiency—here, “efficiency” can be reflected in factors such as distance, time, or cost [31,32,33]. Natech events are characterized by typical suddenness, instantaneousness, and urgency [34]. In the propagation path from the failure of the exposed element to the final accident consequences, the fewer nodes experienced, the shorter the time, and the greater the loss cost, the higher the propagation efficiency of secondary hazards, and the corresponding risk of that path also increases [35]. Therefore, in disaster chain network analysis, particular attention should be directed to high-risk propagation routes—namely, the shortest paths with the greatest potential to cause severe cascading consequences. Disrupting these critical pathways can significantly delay or even prevent the rapid escalation of disaster impacts. Dijkstra’s algorithm, a classical shortest-path detection method based on the greedy principle, computes the minimum-distance routes from a source node to all other nodes within a graph [36]. It is well-suited for both directed and undirected graphs with non-negative edge weights [37]. In this paper, Dijkstra’s algorithm is employed to identify the shortest propagation paths of secondary disasters initiated by various exposed elements, enabling the detection of high-risk pathways and facilitating targeted mitigation strategies.
In summary, the secondary hazards triggered by natural hazards acting on exposed elements are often more complex and difficult to control. Therefore, classifying and grading emergency action targets based on key exposed elements and key propagation paths is of great significance for formulating effective hazard reduction strategies. However, current research still faces many challenges. First, the propagation mechanism of Natech events is complex, involving multiple interactions between primary hazards, exposed elements, and secondary hazards, which adds difficulty to the construction of Natech networks. Second, Natech events have typical characteristics of multi-hazard coupling, requiring existing algorithms to fully consider this complex coupling mechanism when identifying key exposed elements, thereby further increasing the complexity of the algorithms and the demand for adaptability to Natech events. In addition, the evolution paths of secondary hazards are more diverse and complicated compared to primary hazards, making the identification of the shortest evolution paths and the classification and grading work based on key exposed elements and the shortest paths more difficult. Therefore, there is an urgent need to develop a network analysis framework suitable for Natech events to effectively identify key exposed elements and key propagation paths of secondary hazards, and to classify and grade them, thus providing scientific support for formulating differentiated hazard reduction strategies.
To address the above challenges, this paper proposes a systematic solution. First, the evolution path of Natech events is divided into two stages: “natural hazards—exposed elements” (Stage I) and “exposed elements—secondary hazards” (Stage II). A three-layer network of Natech events is constructed with hazards and exposed elements as nodes, and the propagation and evolution of hazards as edges, thereby revealing the laws of hazard transmission more clearly. Secondly, for Stage I, a Coupled Adjacency Information Entropy (C-AIE) algorithm is proposed to calculate the importance of exposed elements in Natech events. This method fully considers the coupling effects in Natech events, explores various coupling scenarios in depth, and provides a more comprehensive understanding of the complex coupling relationships in the network, offering a more scientific theoretical basis for determining the priority of exposed elements. For Stage II, Dijkstra’s algorithm is used to search for the shortest propagation path of secondary hazards, with the weights of edges based on hazard propagation time and loss costs. Finally, based on real coal mine case data, a detailed analysis and classification of key exposed elements and the evolution path of secondary hazards in coal mines are conducted, and corresponding chain break hazard reduction strategies are proposed.
The main research contributions of this paper are as follows:
  • This paper proposes a two-stage analytical framework for Natech events, centered around the identification of critical exposed elements. By recognizing their dual role as both victims and facilitators of hazard transmission, the framework systematically analyzes key propagation pathways and introduces a tailored link classification and grading method for disaster evolution.
  • An enhanced algorithm for node importance identification based on adjacency information entropy is developed. Incorporating the concept of coupling enhancement coefficients, the algorithm captures the inherent multi-hazard coupling features of Natech scenarios. Comparative analyses against classical methods validate its effectiveness and robustness in identifying critical exposed elements.
  • To prioritize intervention targets, a dual-dimensional link classification strategy integrating entropy and risk is introduced. This approach adheres to the principle of concentrating efforts on decisive hazards, enabling targeted interventions under limited conditions and enhancing the overall efficiency of Natech disaster mitigation efforts.
  • The proposed framework is validated using a comprehensive dataset of real-world coal mine–flood Natech cases. The findings offer actionable insights for emergency decision-making and strategic risk mitigation. Specifically, the results support targeted classification of exposed elements and focused interventions along high-risk propagation routes, facilitating the formulation of differentiated emergency response plans and enhancing the accuracy and timeliness of coal mine disaster governance.
The remainder of this paper is structured as follows. Section 2 introduces the evolutionary chain analysis framework for flood-induced coal mine disasters. Section 3 details the data sources and presents an algorithm for identifying critical exposed elements and mitigating secondary disasters. Section 4 presents an empirical study based on the proposed methodology and collected data. Section 5 provides analysis and discussion of the empirical results. Finally, Section 6 concludes the paper by summarizing the main findings, discussing the study’s limitations, and outlining directions for future research.

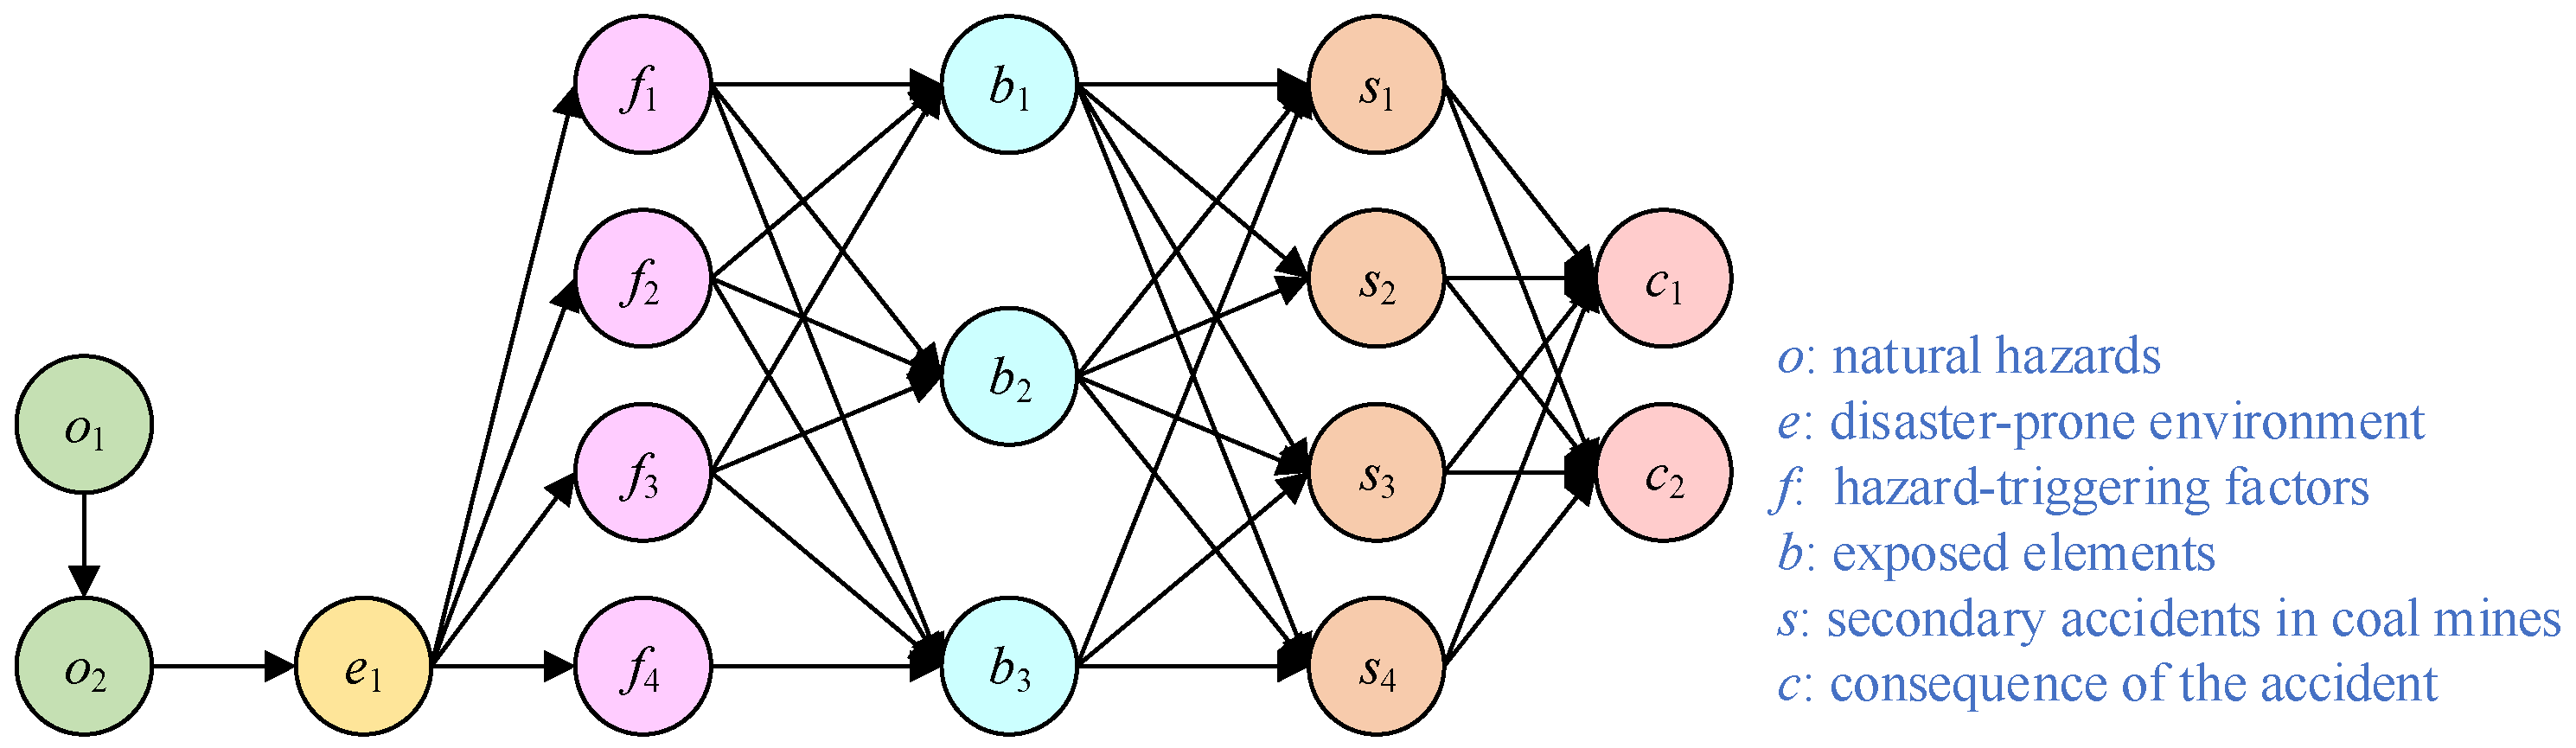
2. Analytical Framework

Considering the pivotal role of exposed elements within the Natech network, the hazard evolution process is divided into two stages: from natural hazards to exposed elements (representing the primary hazard), and from exposed elements to accident consequences (representing the secondary hazard). In the primary hazard stage, the C-AIE for exposed element nodes is analyzed to evaluate their vulnerability to impact and their potential for hazard propagation. In the secondary hazard stage, shortest-path analysis is employed to identify high-risk propagation routes. Interrupting these critical nodes and paths can effectively delay or prevent the rapid spread of hazards. Figure 1 and Figure 2 illustrate the two-stage network model of coal mine–flood Natech event evolution and its fundamental network structure, respectively.
In Figure 2, Stage 1 describes the direct impact of natural hazards such as heavy rain and floods on the exposed elements in the coal mine system (such as equipment, facilities, surrounding ecosystems, etc.). The core of this stage is the direct destruction or impact of natural hazards on the exposed elements, which is the starting point of hazard transmission. Stage 2 describes how the exposed elements, after being affected by natural hazards, further trigger secondary accidents (such as flooding of wells, explosions, leaks, etc.) and their consequences. The core of this stage is the interaction between exposed elements and the chain reaction of accidents, which is the expansion and deepening of hazard transmission.
In Stage 1, the C-AIE algorithm is used to identify key exposed elements and rank their importance, which can help managers determine the priority exposed elements for protection. In Stage 2, using the key exposed elements as source points, Dijkstra’s algorithm is employed to determine the shortest evolution path from the exposed elements to the consequences of the incident. This method can systematically reveal the transmission mechanism of secondary hazards, identify high-risk intermediaries and propagation paths during the hazard evolution process, thereby providing scientific support for formulating effective hazard reduction strategies for chain breaks.

3. Datas and Methods

3.1. Data Sources

This paper systematically classifies exposed elements in coal mines based on the Technical Specification for the Investigation of Exposed elements in Coal Mine Natural Hazards [38]. In addition, a total of 264 coal mine emergency cases characterized as flood-induced Natech events, spanning the years 2000 to 2024, were collected from the following sources:
  • The National Institute for Occupational Safety and Health (NIOSH) and the Mine Safety and Health Administration (MSHA) in the United States. Accident data are publicly accessible via their official websites (https://www.cdc.gov/niosh/ (accessed on 5 March 2025) and https://www.msha.gov/ (accessed on 6 March 2025));
  • China Safety Production Yearbook (2000–2017), compiled by the China Academy of Safety Science and Technology, accessible through the National Library of China and relevant academic databases;
  • The Coal Mine Safety Production Network (http://www.mkaq.org (accessed on 9 March 2025)) and the Safety Management Network (http://www.safehoo.com (accessed on 10 March 2025)), both of which provide open-access mining accident cases and safety analysis reports;
  • Official websites of emergency management authorities, such as the Ministry of Emergency Management of China (http://www.mem.gov.cn (accessed on 11 March 2025)), where accident bulletins can be retrieved from the “News” or “Accident Alerts” sections.
Based on a thorough review and extraction of these case sources, the study identified 101 key nodes representing typical Natech scenarios, with exposed elements as a core component. The detailed node classification is presented in Table 1.

3.2. Methodology

3.2.1. Problem Description

Based on the directionality and weight attributes of the edges in the network, the network can be classified into four types: unweighted undirected network, unweighted directed network, weighted undirected network, and weighted directed network [25]. In Natech events, the relationships between hazard nodes typically exhibit a one-way triggering pattern, and the strength, probability, and coupling mechanisms of the hazard chain vary. Therefore, different edges need to be assigned different weights. Based on this, the coal mine Natech network is classified as a directed weighted network. This network can be represented as G = V , E , W , where V = v 1 , v 2 , v n represents the set of network nodes; E = e 1 , e 2 , e n represents the set of network edges; W represents the weight matrix of the edges, ω i j indicating the weights on the edges connecting node v i to node v j . The adjacency matrix of the network is denoted as A n × n = a i j , where if there is an edge from v i to v j , otherwise, a i j = 0 .
The phenomenon where two or more factors or incidents interact and trigger new events or exacerbate the impact of the initial event is collectively referred to as the coupling effect between emergent events. Depending on the mechanism of the emergent events, coupling can be categorized as OR coupling, AND coupling, and CO coupling [39]. The probabilities of these different coupling mechanisms occurring vary. Typically, the higher the coupling probability of a parent node, the more likely it is to cause severe consequences for the child nodes, meaning higher weights should be assigned in the network. Since this coupling effect increases the weight of the nodes, we refer to this phenomenon as the enhancement effect and use an enhancement coefficient to quantify its impact. To comprehensively reflect the connections of a node and its indirect neighboring nodes while considering the coupling effects of hazards in reality, this paper constructs an AIE model that takes into account the node coupling mechanism. Additionally, using key exposed elements as the source, Dijkstra’s algorithm is applied to determine the shortest evolution path from the exposed element to the accident consequences. This method systematically identifies high-risk intermediary nodes and propagation paths in the hazard evolution process, providing scientific support for the development of effective chain-breaking hazard reduction strategies.

3.2.2. Coupled Adjacency Information Entropy Model for Key Exposed Element Identification

  • Modeling of Enhancement Coefficients Under Coupling Mechanisms
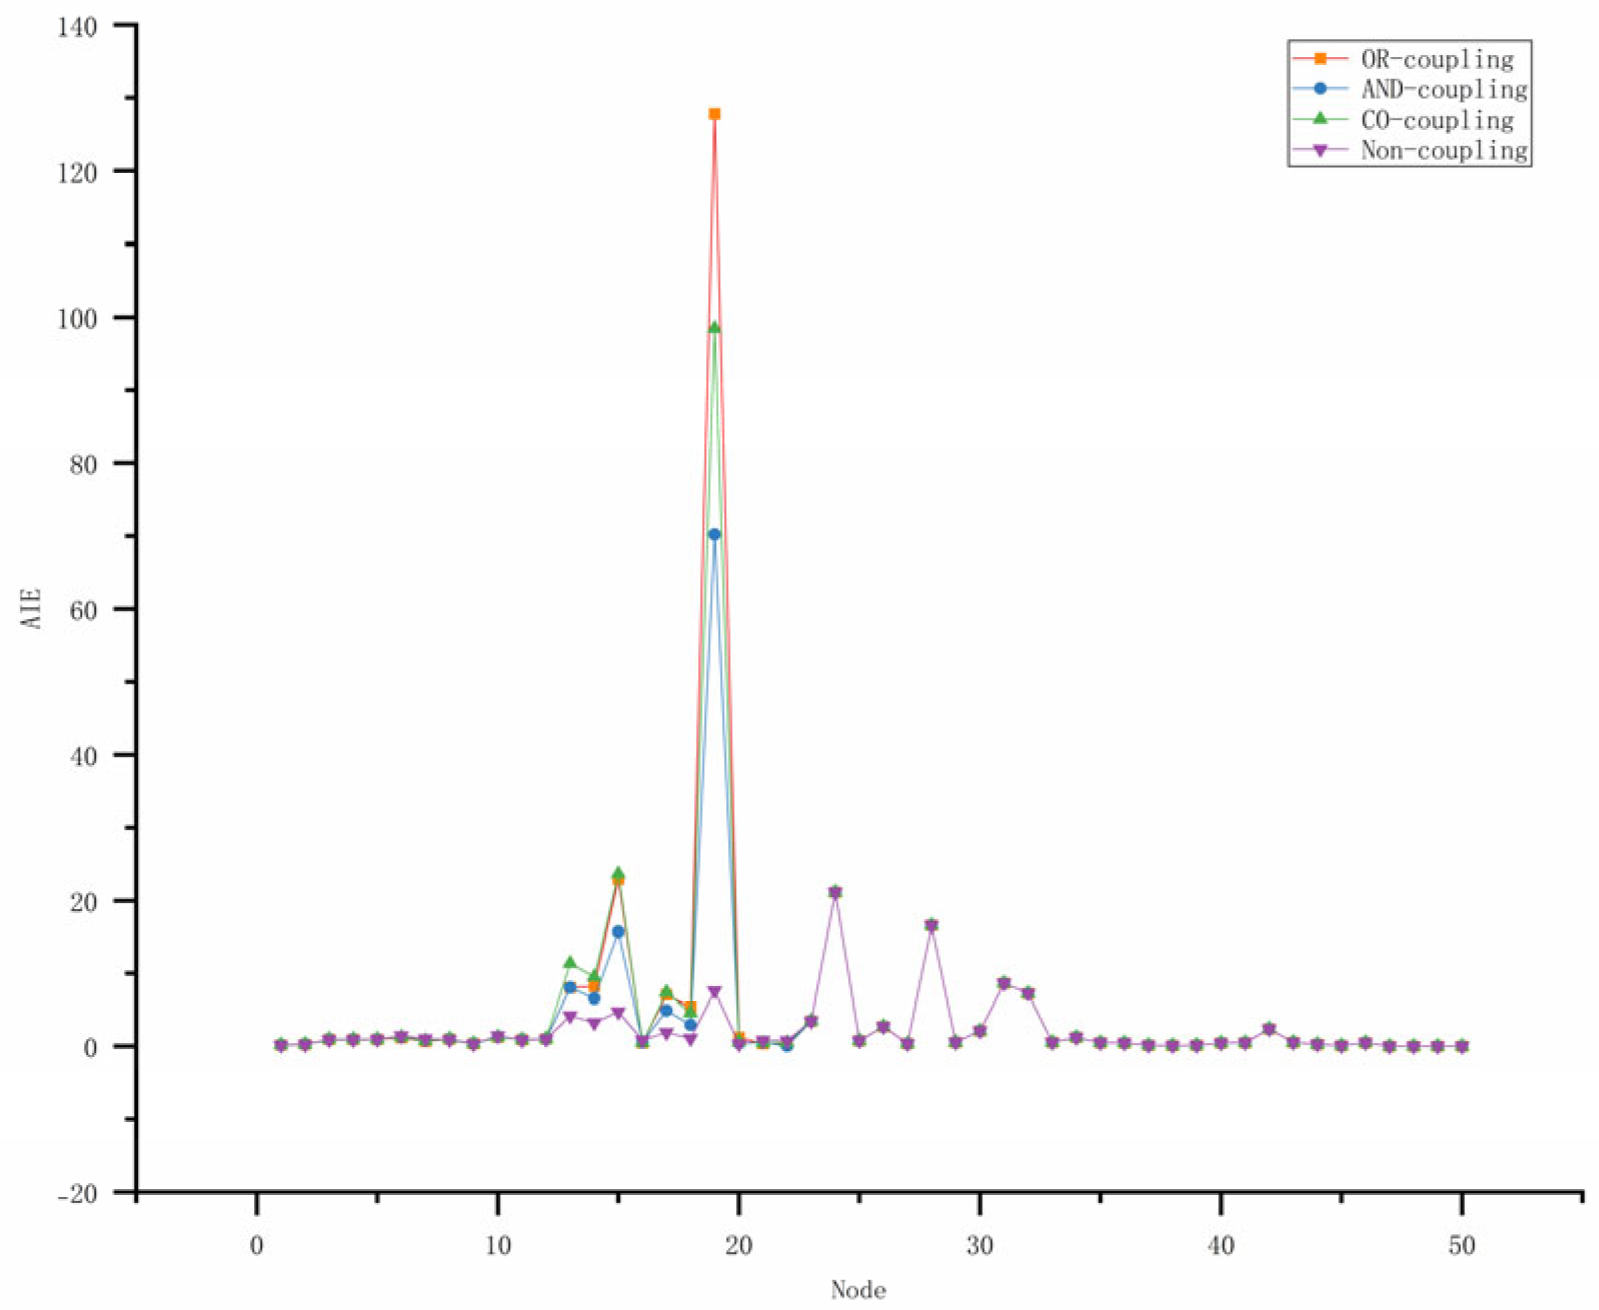
  • Enhancement Coefficient Under OR Coupling
OR coupling indicates that two neighboring nodes operate independently, and the output is the result of either one being activated. The characteristic of this coupling is a loose dependency relationship, and the OR coupling coefficient can be understood as the probability or intensity of at least one of the two neighboring nodes participating in the coupling. Under the OR coupling mechanism, the coupling coefficient of nodes j and r is
k j or r = P j + P r P j r
where vj and vr are both neighbor nodes of vi, P j and P r represent the occurrence probabilities of vj and vr, respectively, P j r denotes the probability of vj and vr occurring simultaneously.
Thus, the enhancement coefficient of the edge under OR coupling can be obtained as
e o r j i = r Γ i r j P j + P r P j r
where e o r j i represents the enhancement coefficient of edge vji under the OR coupling effect.
  • Enhancement Coefficient Under AND Coupling
AND coupling indicates that effective coupling can only occur when both neighboring nodes are activated simultaneously. This type of coupling has a stronger dependency, and the coupling coefficient reflects the intensity of the simultaneous action of the two neighboring nodes.
k j and r = P j r
where P j r represents the probability that vj and vr occur simultaneously.
Thus, the enhancement coefficient of the edge under the AND coupling effect can be obtained as
e o r j i = r Γ i r j P j r
  • Enhancement Coefficient Under CO Coupling
CO coupling generally describes the coupling strength of synergistic coupling or synergy, involving interaction terms between neighboring nodes. Its coupling coefficient is usually represented as the correlation or interdependence between neighboring nodes.
k j co r = P j r / P j · P r
where P j r represents the probability that vj and vr occur simultaneously. P j · P r is a normalization factor to eliminate the influence of the individual system strength.
Thus, the enhancement coefficient of the edge under the CO coupling effect can be obtained as
e c o j i = r Γ i r j P j r / P j · P r
There are mainly two methods for calculating the occurrence probability P of nodes: one is the statistical probability value based on accident case statistics, but due to the low frequency of certain accidents or incomplete data disclosure, this may lead to inaccurate probability calculations; the other is the empirical probability value obtained from expert scoring, which has a strong subjectivity. Therefore, this paper adopts a method that combines statistical probability values and empirical probability values to calculate the occurrence probability P. Specifically, a weighted method is used to integrate the two probability values, and the calculation method is as follows:
P = α P 1 + 1 α P 2
P 1 = N i / N
where P 1 and P 2 represent statistical probability and empirical probability, respectively, N is the total number of statistical cases, and N i is the number of occurrences of accident vi in the statistical cases. α is the weight coefficient, and the more sufficient the case data, the larger the value of α .
To minimize the subjectivity of expert scoring as much as possible and improve the applicability of the occurrence probability of nodes, this paper introduces Dempster–Shafer (DS) theory [40] to fuse expert scoring values. Specifically, assuming that a certain node in the network has two independent states T and F, m is the basic probability assignment function (i.e., mass function) for each state. If i experts are invited to score the mass functions for the two states of the node, their scoring results can be denoted as m 1 T , m 1 F , m 2 T , m 2 F , …, m i T , m i F . According to the multi-evidence synthesis rule of DS theory, the fused m value (denoted as m(X)) for the possible occurrence situation X (X ∈ (T, F)) of a certain node in the network is
m X = X i = X 1 i n m i X i / 1 K , X 0 , X =
K = X i = 1 i n m i X i
2.
Coupled Adjacency Information Entropy Model
First, we define the following basic concepts:
Definition 1
([25]). Adjacency Degree—Considering the influence of a node on its neighboring nodes, the adjacency degree of vi in an unweighted network is defined as
A i = j Γ i d j
where vj is a neighbor of vi Γ i is the set of neighbor nodes of vi, and d j represents the degree value of vj.
Definition 2
([25]). Selection Probability—To describe the probability of vj being selected among all neighboring nodes of vi, the probability function is defined as follows:
P i j = d i / A j , ( j Γ i )
Definition 3
([41]). Information Entropy—In 1948, Shannon proposed the concept of information entropy. Information entropy starts from the uncertainty of system sample points and uses probability and statistical methods to characterize the degree of disorder represented by the sample space. This method can effectively measure the importance of network nodes. The adjacent information entropy of vi is defined as
A I E i = j Γ i P i j log 2 P i j
In a weighted network, the edges between nodes have weights. To more accurately characterize the importance of nodes, the weights of the edges are converted into the strength values of the nodes, that is
s i = j Γ i ω i j
s j = i Γ j ω i j
where si is the strength value of vi, ω i j is the weight of the edge between vi and vj, and Γ i is the set of neighboring nodes of vi.
In a directed network, the strength values of nodes are divided into out-strength values and in-strength values. It is generally believed that out-strength values and in-strength values have different effects on nodes, that is
s i = θ s i i n + 1 θ s i o u t
s i i n = j Γ i 1 + e j i ω j i
s i o u t = j Γ i 1 + e i j ω i j
where s i i n is the in-strength value of v i , s i o u t is the out-strength value of v i , and θ is the influence coefficient. In this paper, we take θ = 0.85 , which means that the in-strength value of a node has a greater effect on the node than the out-strength value [26]. e j i Represents the enhancement effect brought to v i by vj under the coupling effect with other nodes in the neighbor node set of v i , that is, the enhancement coefficient.
The C-AIE of a node in a directed weighted network is calculated as
A j = θ i Γ j s i j + 1 θ i Γ j s j i
p i j = s i / A j
C-AIE i = j Γ i P i j   log 2   P i j
where A i is the comprehensive adjacency strength value of v i , s i j is the comprehensive strength value from v i to v j , s j i is the comprehensive strength value from v j to v i , and C-AIE i is the C-AIE of v i .

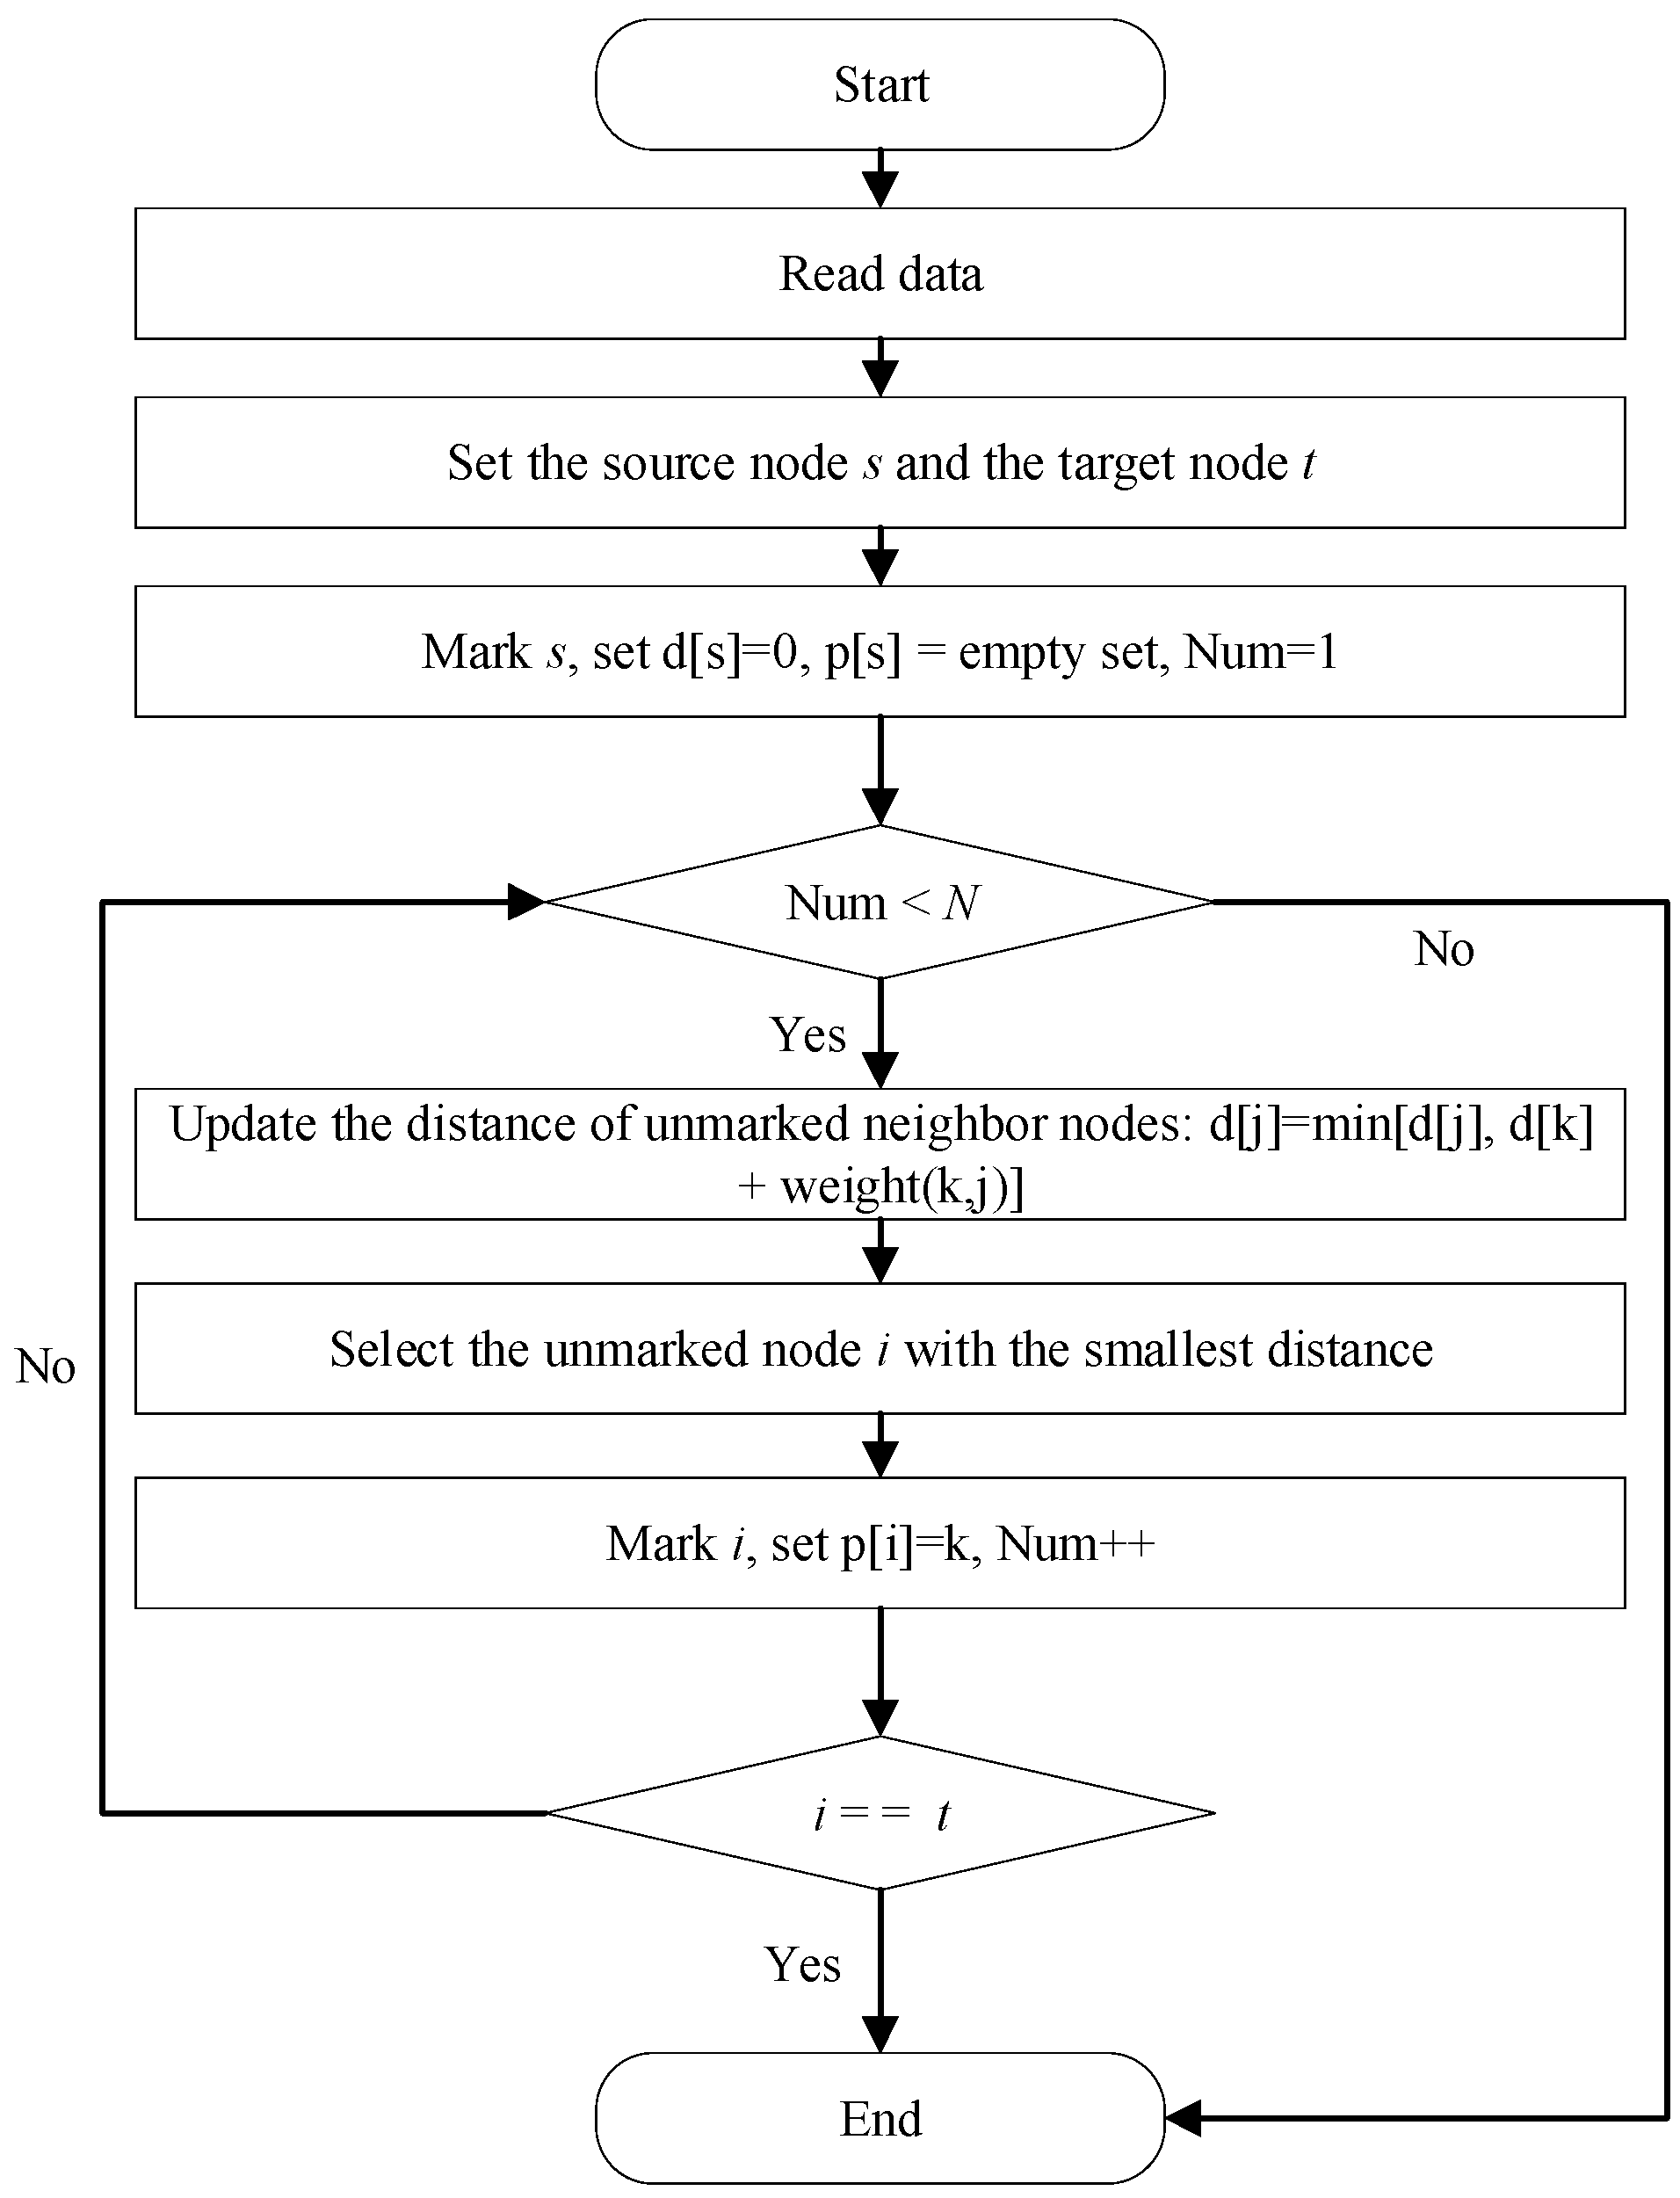
3.2.3. Dijkstra’s Algorithm for Identifying the Shortest Propagation Path of Secondary Hazards

The flow of Dijkstra’s algorithm is shown in Figure 3, where s represents the source node, which is the starting node of the algorithm; t represents the target or destination node; d[s] represents the distance from the source node s to the current node, initially set to 0; p[s] represents the parent node set, used to record the path to each node, initially empty; Num represents the number of currently marked nodes, initially set to 1; N represents the total number of nodes to be marked; k represents the currently checked marked node; j represents the unmarked node; weight(k, j) represents the weight of the edge (k, j), that is, the distance or cost from node k to node j; d[j] represents the minimum distance from the source point to the unmarked node j; p[i] represents the nodes directly connected to node i; d[j] = min[d[j], d[k] + weight(k, j)], where the min function is used to determine the shortest path from the current node to the next node, d[k] represents the minimum distance from the source node to the currently checked marked node k, and d[k] + weight(k, j) represents the distance from the source node to node j via node k; Num++ is an increment operator, indicating that the value of the variable Num is increased by 1. In the algorithm flow, Num may be used to record the number of nodes that have been processed or the number of iterations. When the algorithm finds a new shortest path and marks the corresponding node, the Num++ operation will be executed, indicating that a new node has been processed.

3.2.4. Priority Determination Based on Dual Dimensions of Exposed Element Management and Secondary Hazard Disruption

The ABC classification method is derived from the Pareto principle, with the core idea being “the vital few determine the overall effectiveness,” following the principle of “concentrating resources to prioritize the management of key elements” [25,42]. Based on this, this paper achieves differentiated resource allocation through dual-dimensional classification (importance of exposed elements, risk level of paths), prioritizing the interruption of the cascading effects between high-entropy exposed elements and high-risk paths, thus avoiding efficiency losses caused by “average” prevention and control. The specific classification rules are as follows:
(1)
Classification of Exposed Elements and Secondary Hazard Paths
Classify the exposed elements into different categories based on C-AIE. C-AIE reflects the connectivity diversity and information transmission capability of exposed elements in the hazard transmission network. The higher the entropy value, the stronger the hub role of the exposed element in hazard transmission, and its failure may trigger more widespread secondary hazards. Therefore, class A (high entropy) has the highest C-AIE value, with the strongest connectivity diversity and information transmission capability. Class B (medium entropy) has a moderate C-AIE value, with significant local hub functions. Class C (low entropy) has a lower C-AIE value, with a single connection path.
Based on the shortest propagation path length, secondary hazard path categories are divided. The shorter the path, the faster the propagation speed of secondary hazards, and the higher the risk level. Therefore, class A (high risk) has the shortest path length and the fastest hazard propagation speed. Class B (medium risk) has a medium path length and the next highest propagation efficiency. Class C (low risk) has the longest path length and the slowest propagation speed.
(2)
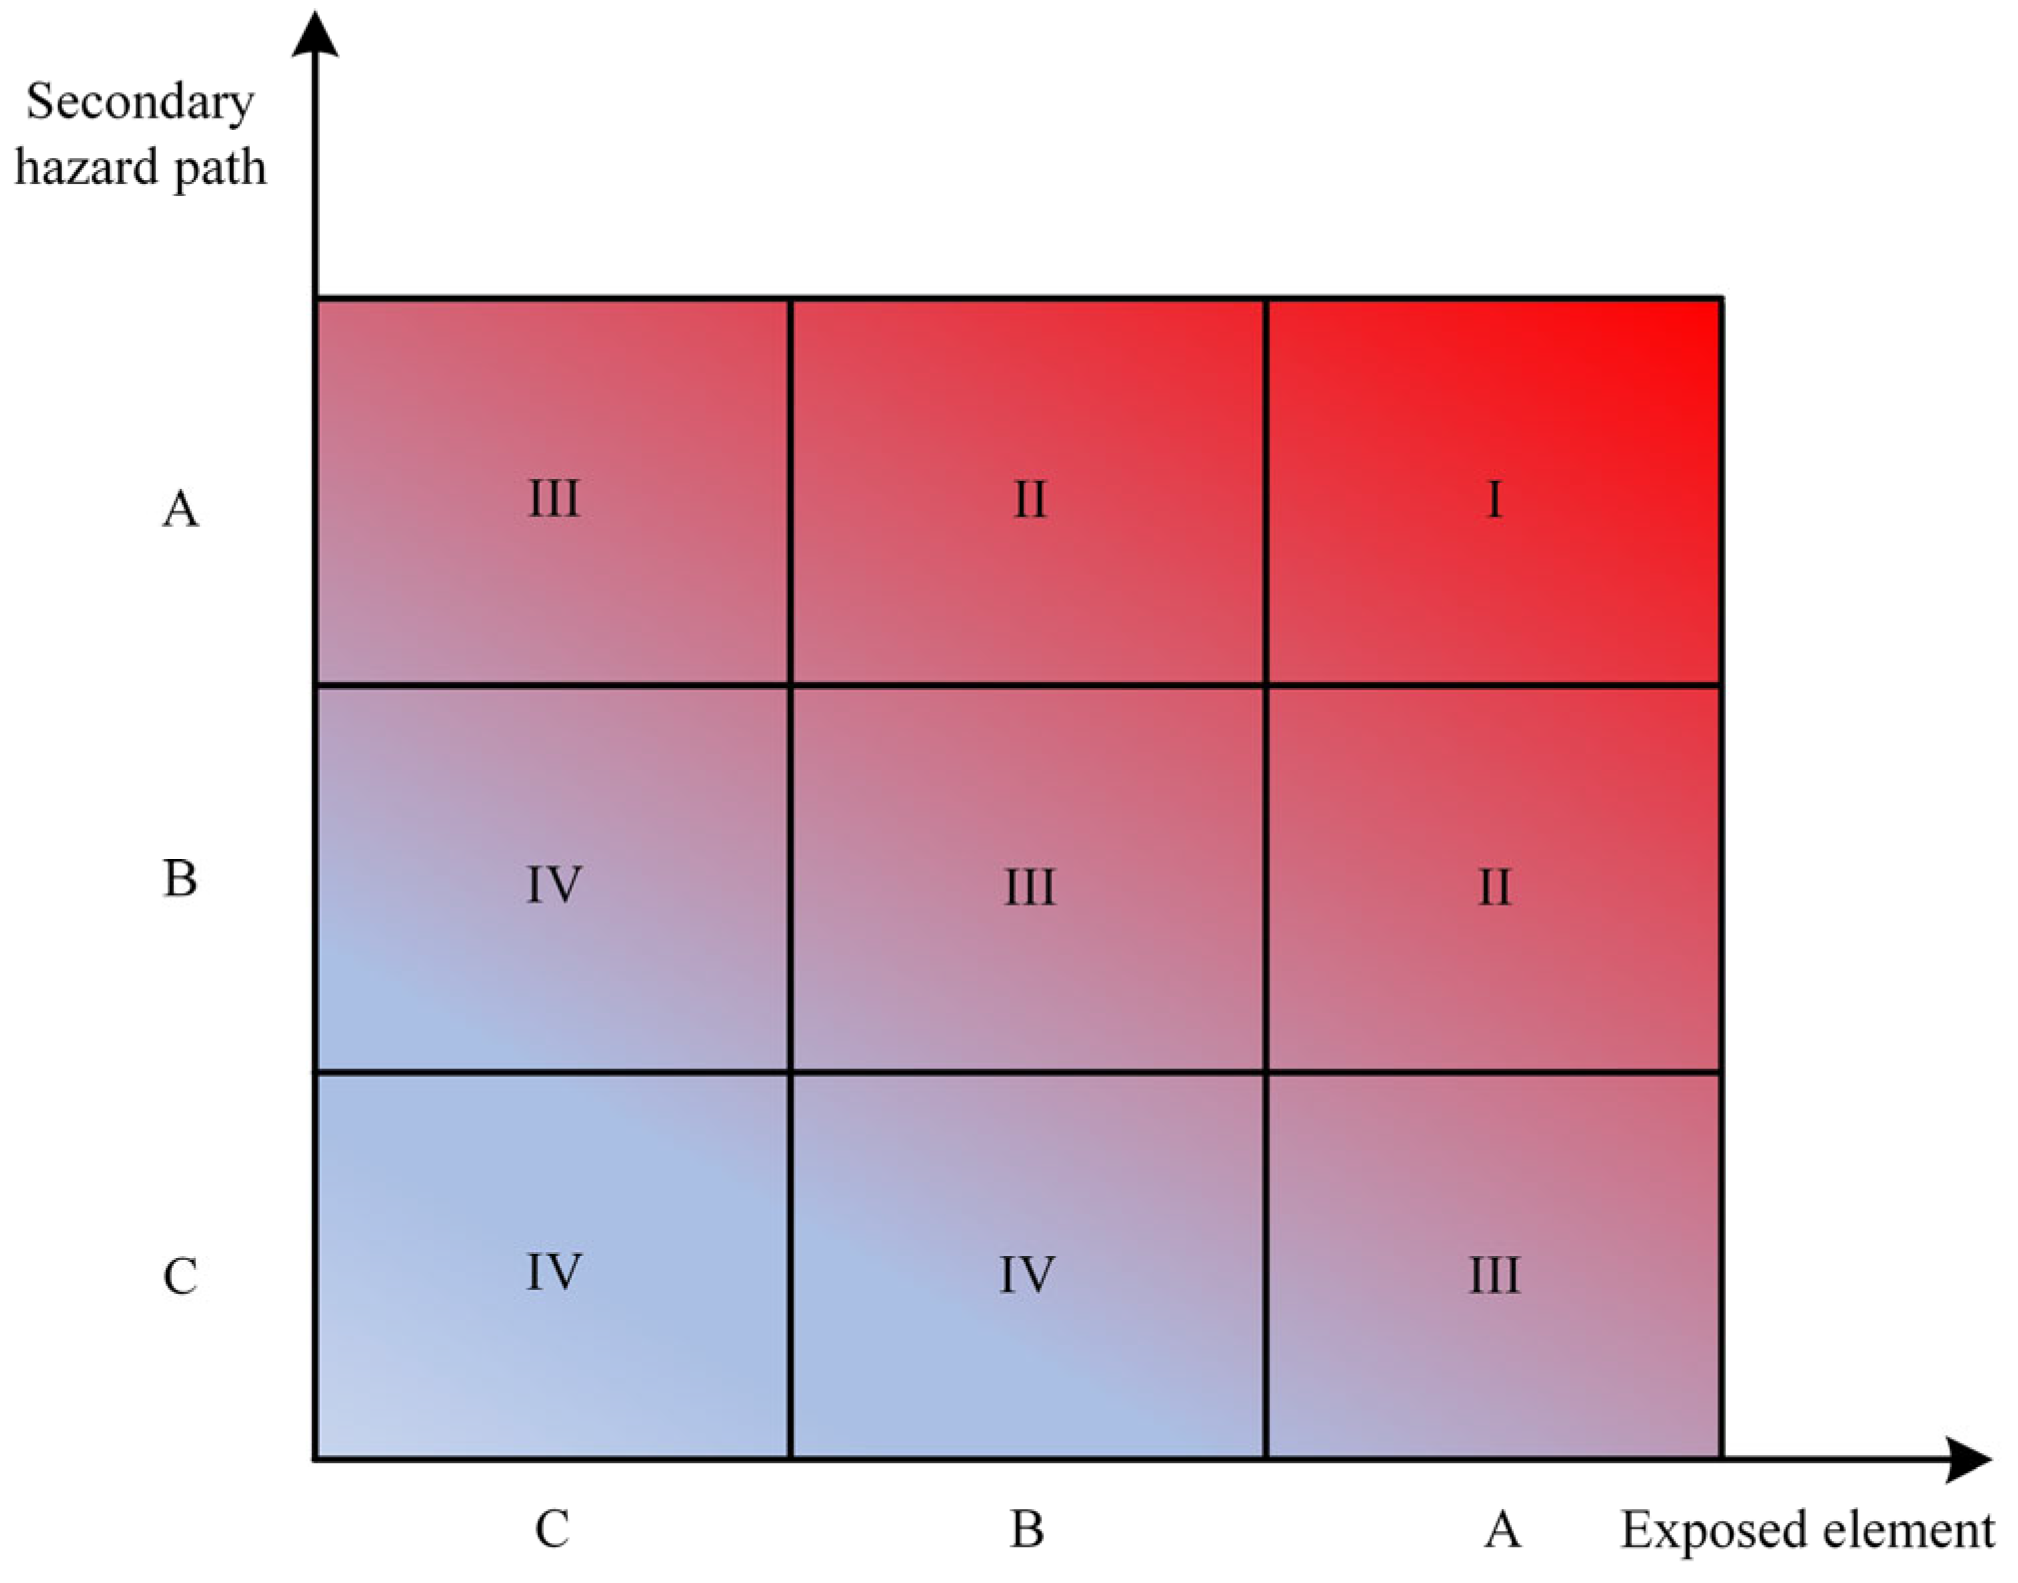
Priority Determination Based on Combined Dual-Dimensional Classification
By cross-combining the entropy level of exposed elements and the risk level of secondary hazard paths, a management priority matrix is constructed, as shown in Figure 4 and Table 2. In Figure 4, the color gradient from blue (bottom left) to red (top right) represents increasing priority levels, with blue indicating the lowest priority and red the highest. The different regions correspond to four levels: I, II, III, and IV. For the highest priority (A-A), high-entropy exposed elements should be avoided from overlapping with high-risk paths. For the second highest priority (A-B/B-A), key nodes and rapid propagation paths should be optimized. The basic priority (other combinations) requires regular maintenance and dynamic monitoring.

3.3. Numerical Analysis
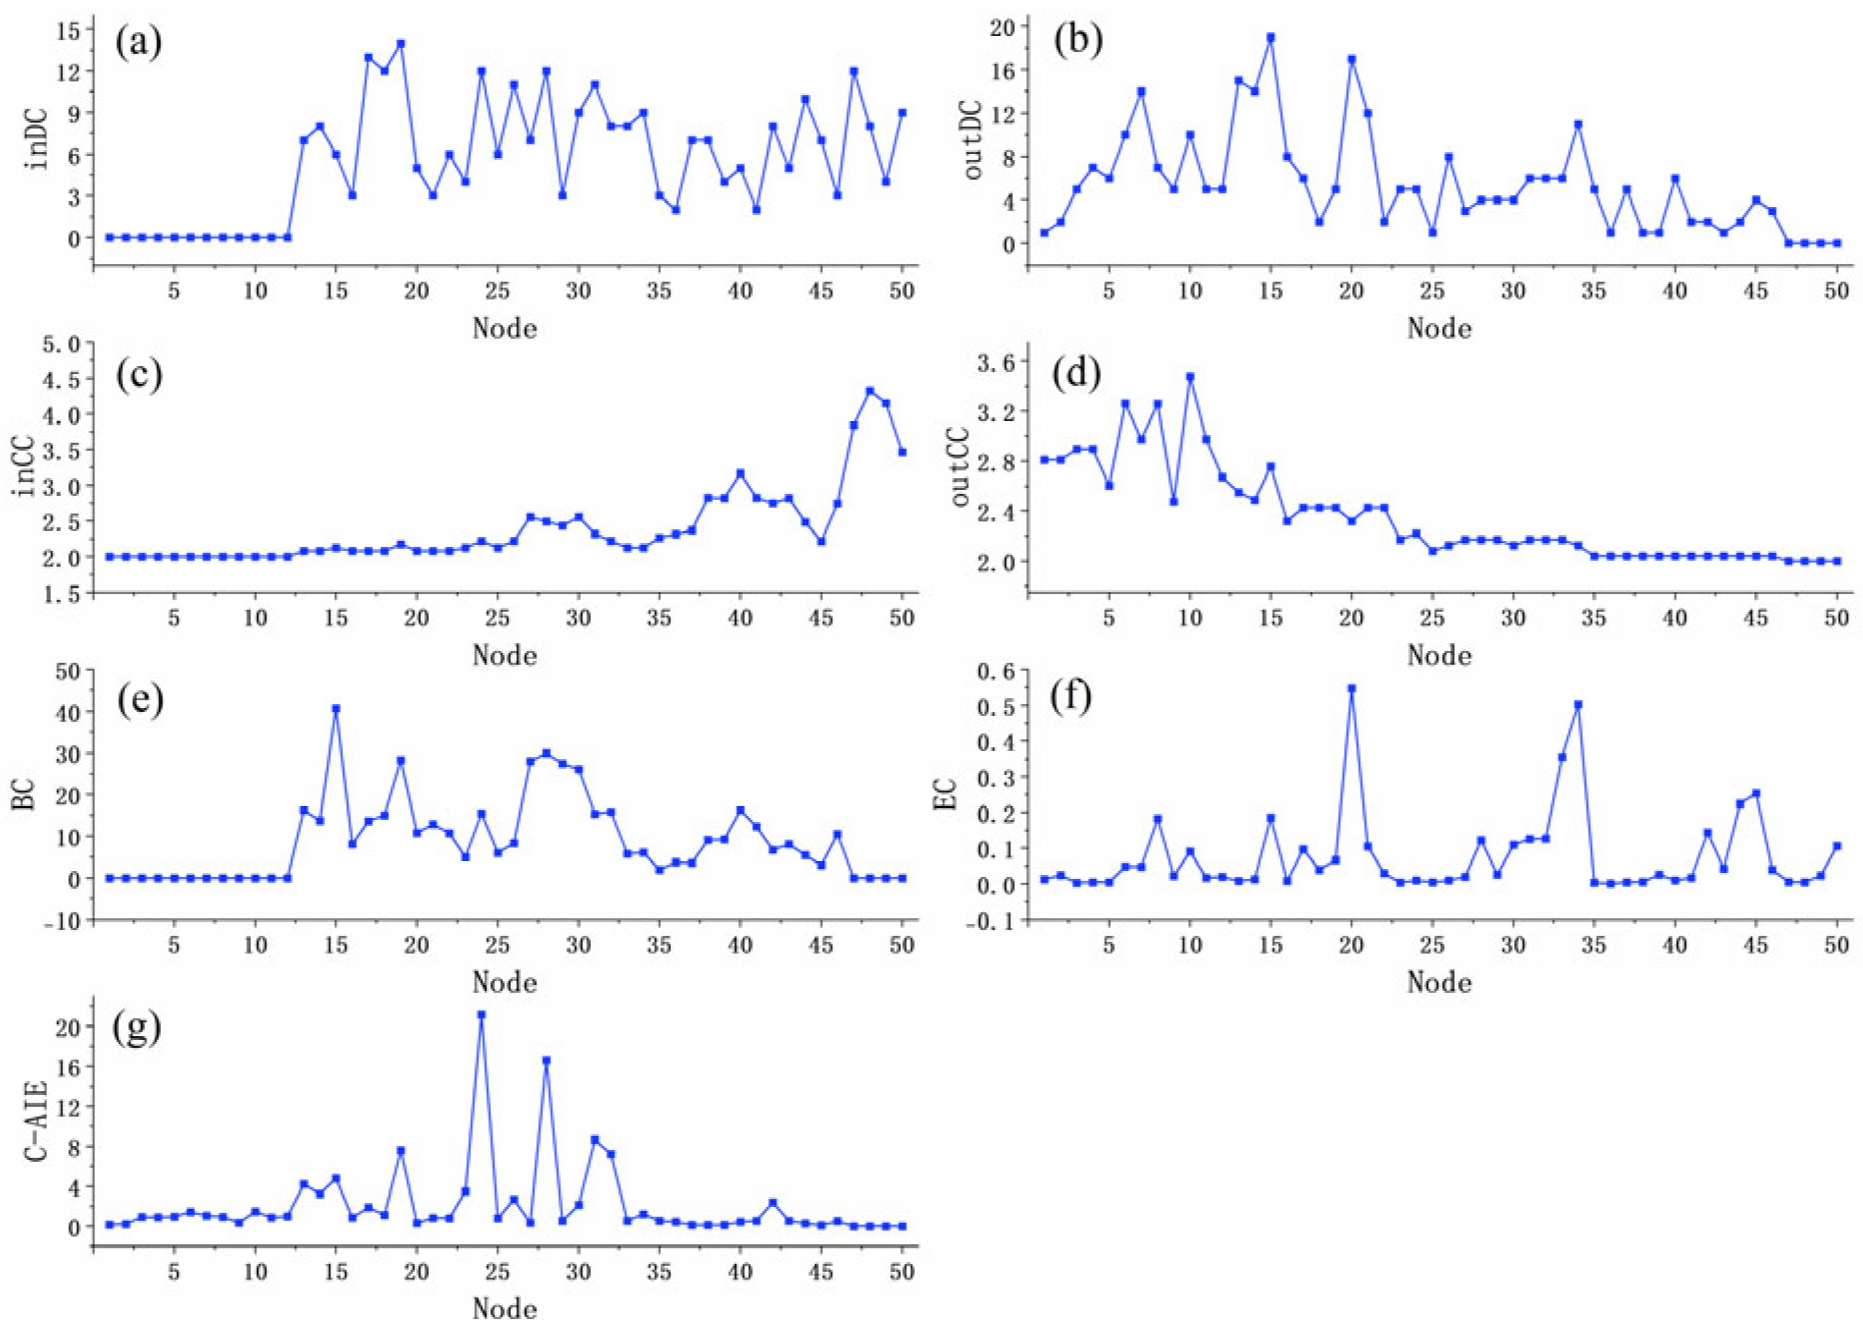
To verify the effectiveness of the proposed C-AIE algorithm in this paper, we constructed a network consisting of 50 nodes and 92 edges using UCINET (Version 6.186) and Gephi (Version 0.10.1) for numerical analysis. The results were compared with those obtained from degree centrality (DC), eigenvector centrality (EC), closeness centrality (CC), and betweenness centrality (BC).
Based on the chain evolution law of natural hazards, exposed elements, and secondary hazards, the three-layer network topology is shown in Figure 5. The network nodes in the first, second, and third layers correspond to primary hazards, exposed elements, and secondary hazards, respectively. The importance of each node was calculated using the aforementioned algorithms, and the results are shown in Table A1 (see Appendix B). For ease of visual comparison, the calculation results were normalized and presented in Figure 6. In addition, Figure 7 compares the distribution of node importance under different centrality indicators.
Figure 6 indicates that there are significant differences in the ranking of node importance due to the different focuses of the recognition methods. For out-degree centrality (outDC), out-closeness centrality (outCC), and betweenness centrality (BC), the most important node identified is B3; whereas for C-AIE, in-degree centrality (inDC), and in-closeness centrality (inCC), the most important node identified is B7; feature vector centrality (EC) identifies B8 as the most important node. Among these, inDC, outDC, inCC, outCC, and BC mainly consider the position of the evaluated node in the network and the number of directly connected nodes, that is, direct influence; while C-AIE and EC not only consider direct influence but also focus on indirect influence (the quality of neighboring nodes). Specifically:
(1)
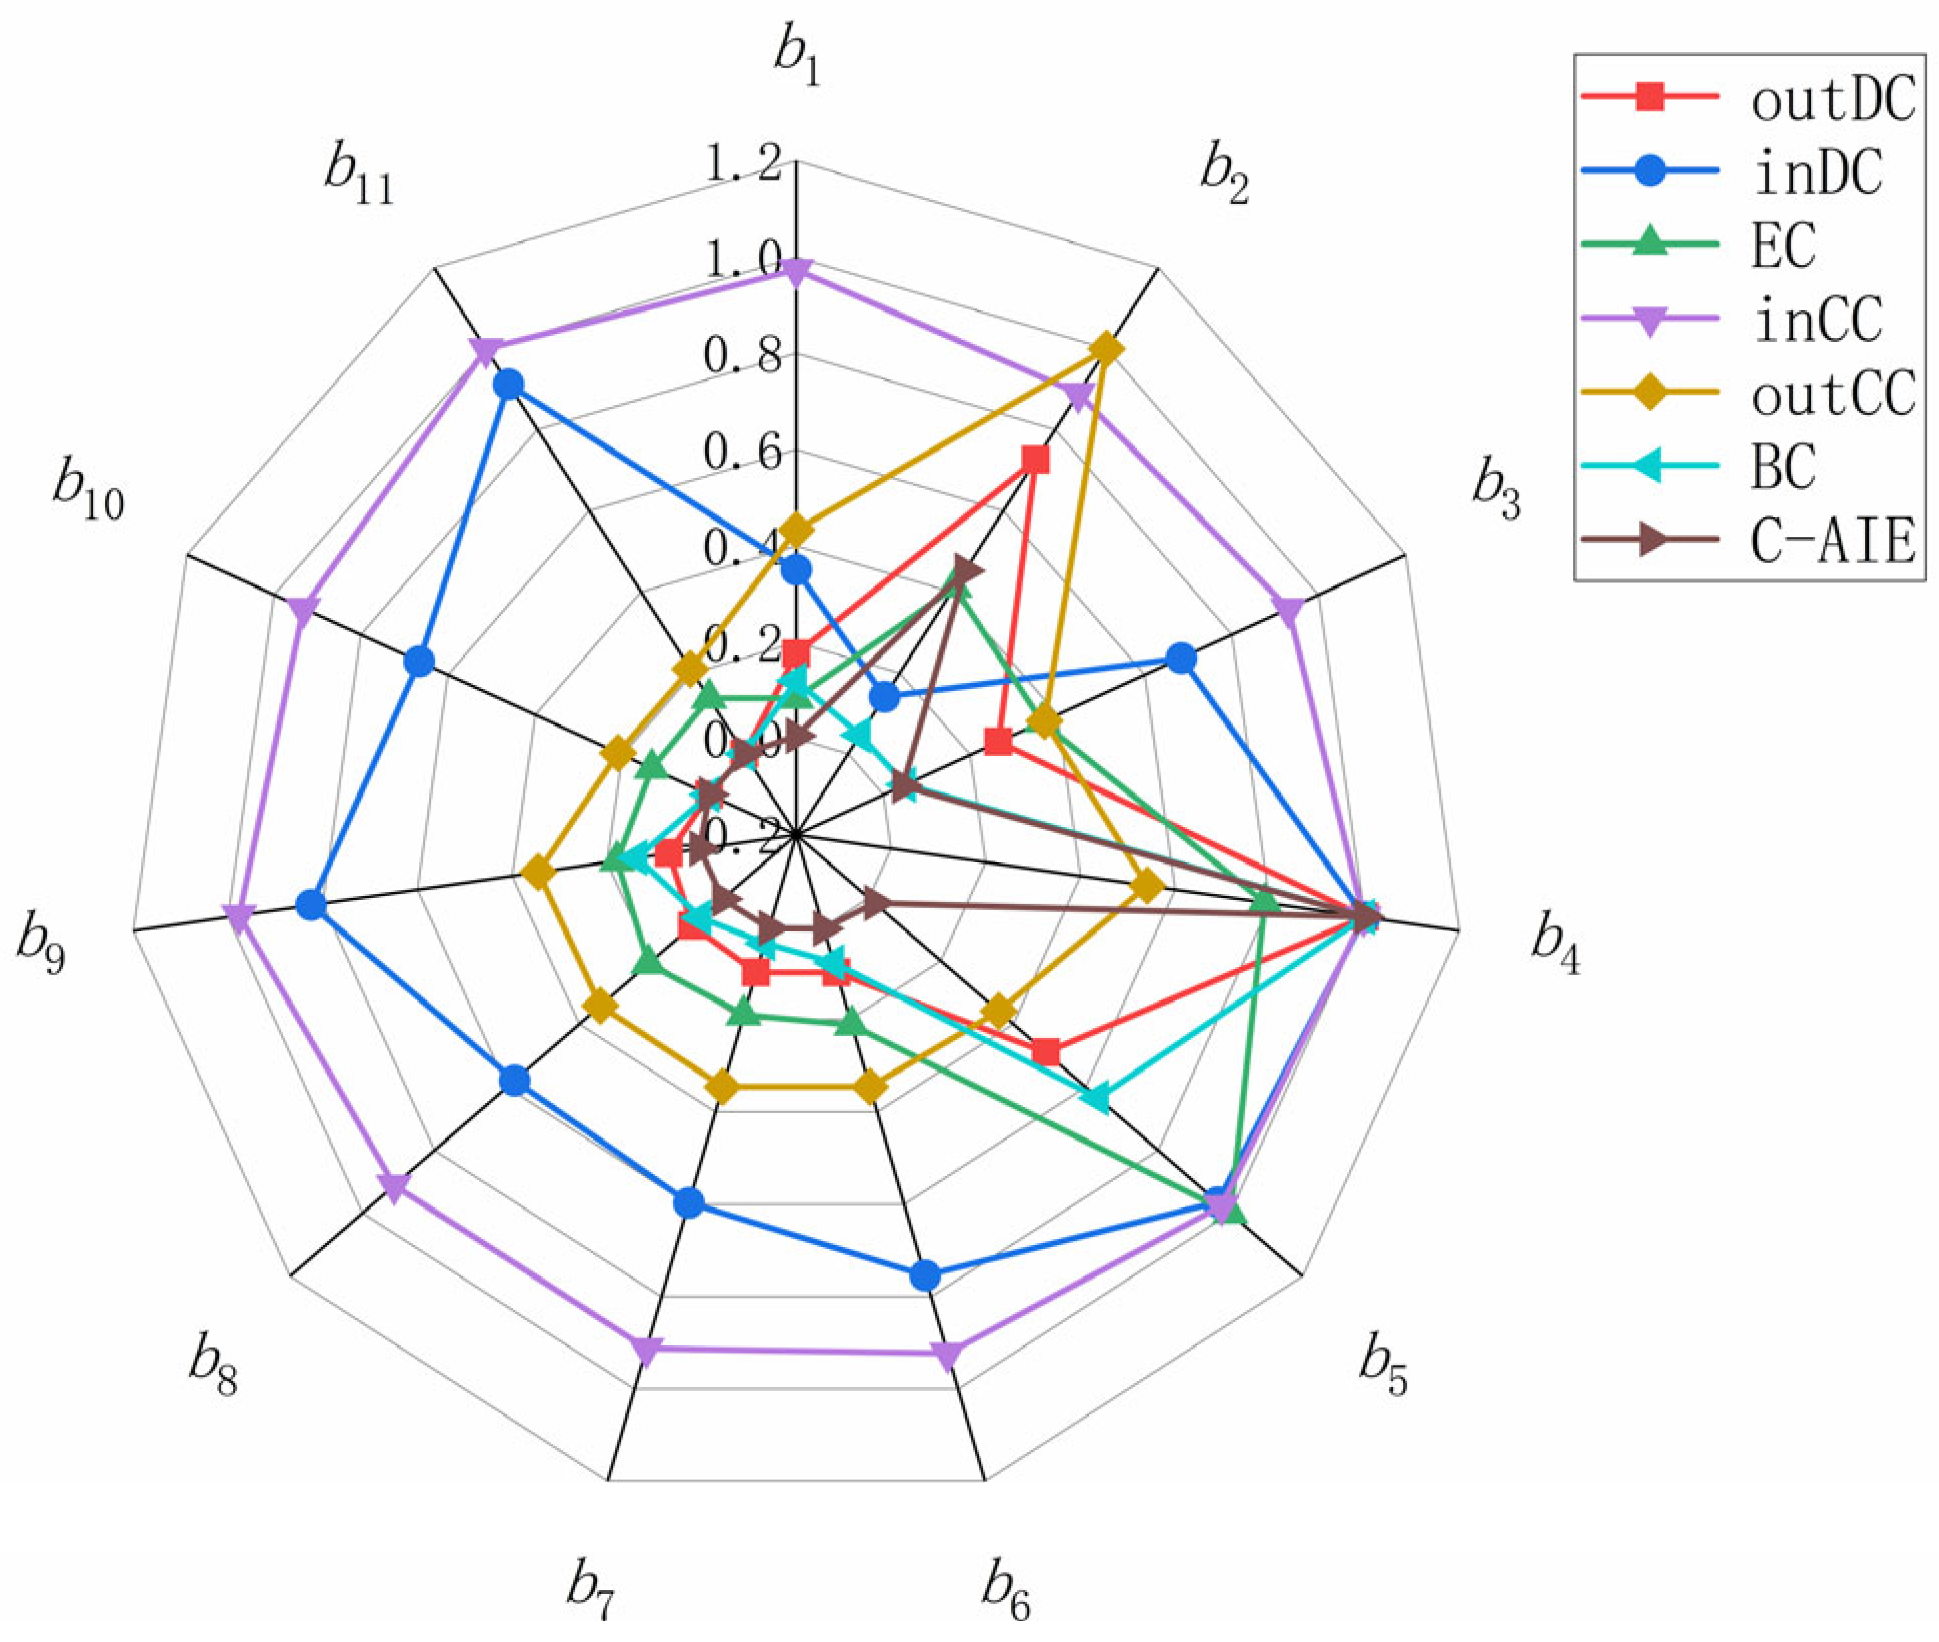
Degree Centrality focuses on the direct influence between nodes
In-degree indicates the extent to which a node is influenced by other nodes or its ability to receive information, while out-degree indicates a node’s direct influence on other nodes or its ability to disseminate information. Therefore, in a hierarchical directed network, the results of in-degree and out-degree calculations often show completely opposite trends. As shown in Figure 6a,b, nodes with higher in-degree values typically appear in later hierarchical networks, while nodes with higher out-degree values are often found in earlier hierarchical networks.
(2)
Closeness Centrality reflects the degree to which a node is positioned at the center of the network; the closer a node is to the center of the network, the higher its importance
In directed networks, in-closeness reflects the efficiency with which a node “acquires” information from the network. High in-closeness indicates that the node is easily accessible by other nodes in the network and may play the role of an information “endpoint” or resource “aggregation point.” Out-closeness reflects the efficiency with which a node “transmits” information to other parts of the network. High out-closeness indicates that the node can quickly disseminate information or resources and may serve as a “source” or “hub” in the network. Therefore, in-closeness and out-closeness often differ significantly due to directional differences, and this difference is more pronounced than degree centrality, presenting a polarized phenomenon, as shown in Figure 6c,d.
(3)
Node Betweenness Centrality reflects the extent to which a node (or edge) acts as a “bridge” or “intermediary” between other nodes in the network
Typically, nodes or groups that connect different parts play an important role in the network, but the differences in importance between nodes are not sufficiently clear. As shown in Figure 6e, it is difficult to reasonably assess the relative importance of nodes with similar BC values.
(4)
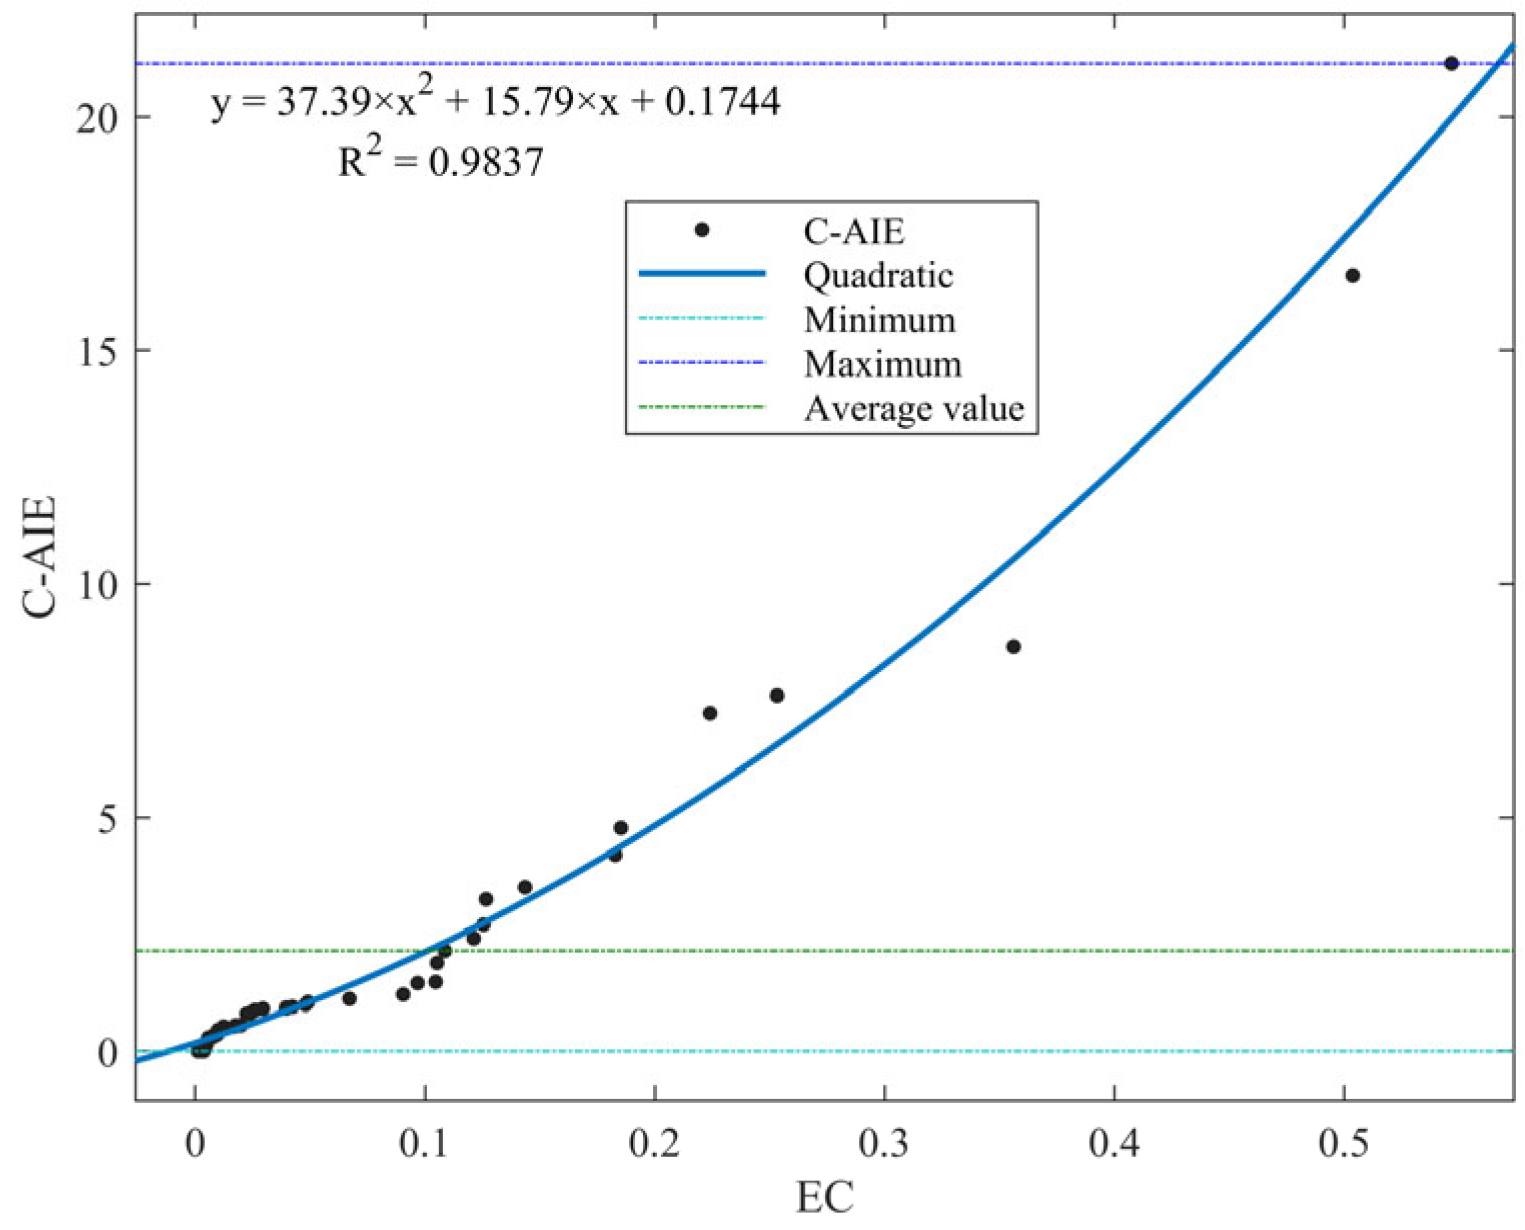
C-AIE and EC not only focus on the “direct influence” of nodes but also consider the “indirect influence,” so the distribution trends of node importance for both are quite similar, but C-AIE has higher discriminability
As shown in Figure 6f,g, C-AIE can more accurately distinguish the importance differences in nodes with similar EC values, and this advantage of C-AIE is also reflected in comparisons with inDC, outDC, inCC, outCC, and BC, as shown in Figure 7. This characteristic is significant for identifying key exposed elements in reality.
To explore the impact of node coupling mechanisms on node importance identification, this paper sets the coupling mechanisms of the exposed element layer to OR coupling, AND coupling, and CO coupling, while keeping the node occurrence probability unchanged, and calculates the C-AIE values of nodes under different coupling mechanisms. The calculation results and comparison charts are shown in Table A2 (see Appendix A) and Figure 8, respectively. From Figure 8, it can be seen that under the influence of the coupling mechanism, the C-AIE values of exposed element nodes show a significant increasing trend. Among them, the impact of OR coupling is the most significant, followed by CO coupling, and finally AND coupling.
To further validate the effectiveness of the constructed model, Figure 9 shows the linear relationship between the model built in this paper (C-AIE) and the metrics based on EC, where the adjusted R-squared of the linear fit is 0.9837. Clearly, the proposed method has a high similarity to the importance assessment of traditional methods, which to some extent verifies the rationality of the proposed method.

3.4. Algorithmic Workflow

Figure 10 presents the workflow of the proposed priority determination method, which integrates exposed element management and the mitigation of secondary hazards. The corresponding pseudocode can be found in the Appendix B.

4. Results

4.1. Construction of the Coal Mine–Flood Natech Event Chain Network

Based on the scenario information obtained in Section 3.1, this paper developed a coal mine Natech event chain that follows the progression from natural hazard, to exposed system, to secondary disaster, and finally to disaster consequence. First, individual event chains were constructed by identifying causal relationships among the key nodes. Then, through an analysis of causal couplings between these individual chains, they were integrated to form a comprehensive coal mine–flood Natech event chain network, as illustrated in Figure 11.

4.2. Analysis of Exposed Elements

4.2.1. Importance Evaluation and Classification of Exposed Elements Based on the C-AIE Algorithm

First, classify the coupling types of native hazards, as shown in Table 3.
Next, the statistical probability of each node is calculated using Equation (8), while three experts are invited to assess the occurrence probability of the nodes. The expert evaluation results are then synthesized using Equations (9) and (10). Since the case data collected in this paper is relatively sufficient and complete, and the accuracy of the statistical probabilities is high, the value is taken, and integration is performed using Equation (7). Subsequently, based on Table 3, the enhancement coefficients for the edges acting on the exposed elements are calculated using Equations (1)–(6). Finally, the C-AIE of the exposed elements is calculated using Equations (11)–(21), and the exposed elements are classified into high entropy (class A), medium entropy (class B), and low entropy (class C) using the ABC classification method, as shown in Table 4.

4.2.2. Analysis of Key Exposed Elements by Category

(1)
Class A exposed elements
Surface facility (b4): As an exposed element, surface facility is also an important barrier to resist the damage of natural hazards to underground projects. Once the surface facility is destroyed, the underground projects are also difficult to escape unscathed. Its C-AIE value is the highest, indicating that it plays a strong hub role in the hazard transmission network, capable of connecting multiple upstream natural hazards and downstream accident consequences. This high entropy value reflects the diversity and complexity of surface facility in information transmission and hazard conduction, thus requiring priority prevention and control.
Surrounding hydrological system (b2): The surrounding hydrological system serves as an interactive interface between natural and artificial systems. Once damaged, it can easily trigger a series of chain reactions and transmit hazards through various paths (e.g., rising river levels → flooding of mining areas → casualties). Its high entropy value reflects the multi-path connection characteristics of the hydrological system in hazard transmission, thus requiring special attention.
(2)
Class B exposed elements
Surrounding geological system (b3): The surrounding geological system is a secondary carrier of natural hazard energy, capable of conducting hazards through moderately complex paths, such as the conversion of flood kinetic energy into geological deformation energy, causing ground subsidence. Its entropy value reflects the moderate connectivity diversity of the geological system in hazard conduction, requiring enhanced monitoring and maintenance, especially in earthquake-prone areas.
Shaft and tunnel system (b5): As the spatial carrier of underground production activities, the shaft and tunnel system connects subsystems such as drainage (s27) and ventilation (s25), serving as a local hub. Once a failure occurs, it can lead to serious consequences in a short period, requiring regular inspections of its structural safety and the development of emergency plans to respond to sudden accidents.
(3)
Class C exposed elements
Mining area ecosystem (b1), power system (b9), ventilation system (b8), etc. The C-AIE values of these exposed elements are relatively low, participating only in the hazard transmission of specific paths, with lower uncertainty. They usually rely on the failure of other systems to trigger accidents (such as power outages leading to ventilation stoppage), so targeted protection needs to be strengthened.
Transport lifting system (b10) and security monitoring and communication system (b11): These systems have a zero C-AIE, indicating that they do not directly participate in hazard transmission in the current hazard transmission network. However, this does not mean their role is zero; their failure often weakens emergency response capabilities. For example, the failure of the transport lifting system may hinder the rapid dispatch of rescue supplies and personnel, while the failure of the security monitoring and communication system may weaken accident warning capabilities and information transmission efficiency. Therefore, it is necessary to ensure their functional stability.

4.3. Analysis of Secondary Hazard Propagation Paths

4.3.1. Classification of Secondary Hazard Evolution Paths Based on Dijkstra’s Algorithm

Dijkstra’s algorithm is used to extract the shortest evolution paths of secondary hazards triggered by exposed elements, resulting in a total of 36 paths. Based on the path lengths, the ABC classification method is applied to classify these paths into high risk (class A), medium risk (class B), and low risk (class C), as shown in Figure 12, Figure 13 and Figure 14. Detailed information can be found in Table A3 (see Appendix A).

4.3.2. Analysis of Secondary Hazard Propagation Paths by Category

Figure 12, Figure 13 and Figure 14 illustrate three distinct categories of secondary hazard evolution paths, classified by risk level and extracted using Dijkstra’s algorithm. These path types exhibit notable differences in their propagation mechanisms, structural configurations, and corresponding response strategies.
(1)
Class A propagation paths
Class A paths (Figure 12) mainly include those driven by class A (b2, b4) and class B (b3, b5) exposed elements. They are characterized by fast propagation speed and strong destructiveness, making them high-risk paths that need to be prioritized for blockage in coal mine-flood Natech events. Specifically, the paths based on b4 (surface engineering) and b5 (shaft system) are the shortest due to the high exposure level of surface engineering and the complex structure of the shaft system. Both have significant vulnerabilities, making them prone to hazard amplification effects, which accelerate hazard propagation speed. Hazard propagation driven by natural systems such as b2 (surrounding hydrological system) and b3 (surrounding geological system) often triggers short-path cascading reactions, which can lead to severe consequences by affecting technical systems. These paths usually have strong propagation characteristics and are more likely to trigger serious consequences of coal mine hazards.
(2)
Class B propagation paths
The class B paths (Figure 13) are mainly driven by class B exposed elements (b3, b5) and class C exposed elements (b1, b6, b7, b8, b9). The characteristics of class B paths are moderate hazard propagation efficiency and controllable conduction time. Although the destructiveness of these paths is relatively low, they still require special attention to delay the further spread of hazards. These paths involve failures in natural systems and semi-natural systems, which may cause significant ecological damage and social disruption, and may also lead to casualties and property losses due to failures in technical systems. Compared to class A paths, system failures in class B paths are usually slower, but may lead to greater indirect impacts.
(3)
Class C propagation paths
Class C paths (Figure 14) mainly include those driven by class C exposed elements (b6, b7, b8, b9, b10, b11). The characteristics of these paths are significant hazard conduction delays, lower destructiveness, and relatively small recovery difficulties. Although their direct destructiveness is limited, the involvement of more intermediate nodes and longer propagation paths may accumulate potential risks. In addition, some class C paths, while not directly involved in hazard conduction, may still trigger chain reactions through indirect effects, posing a potential threat to the overall safety of the mine.

4.4. Management Priority Determination Based on Exposed Elements and Secondary Hazard Propagation Paths
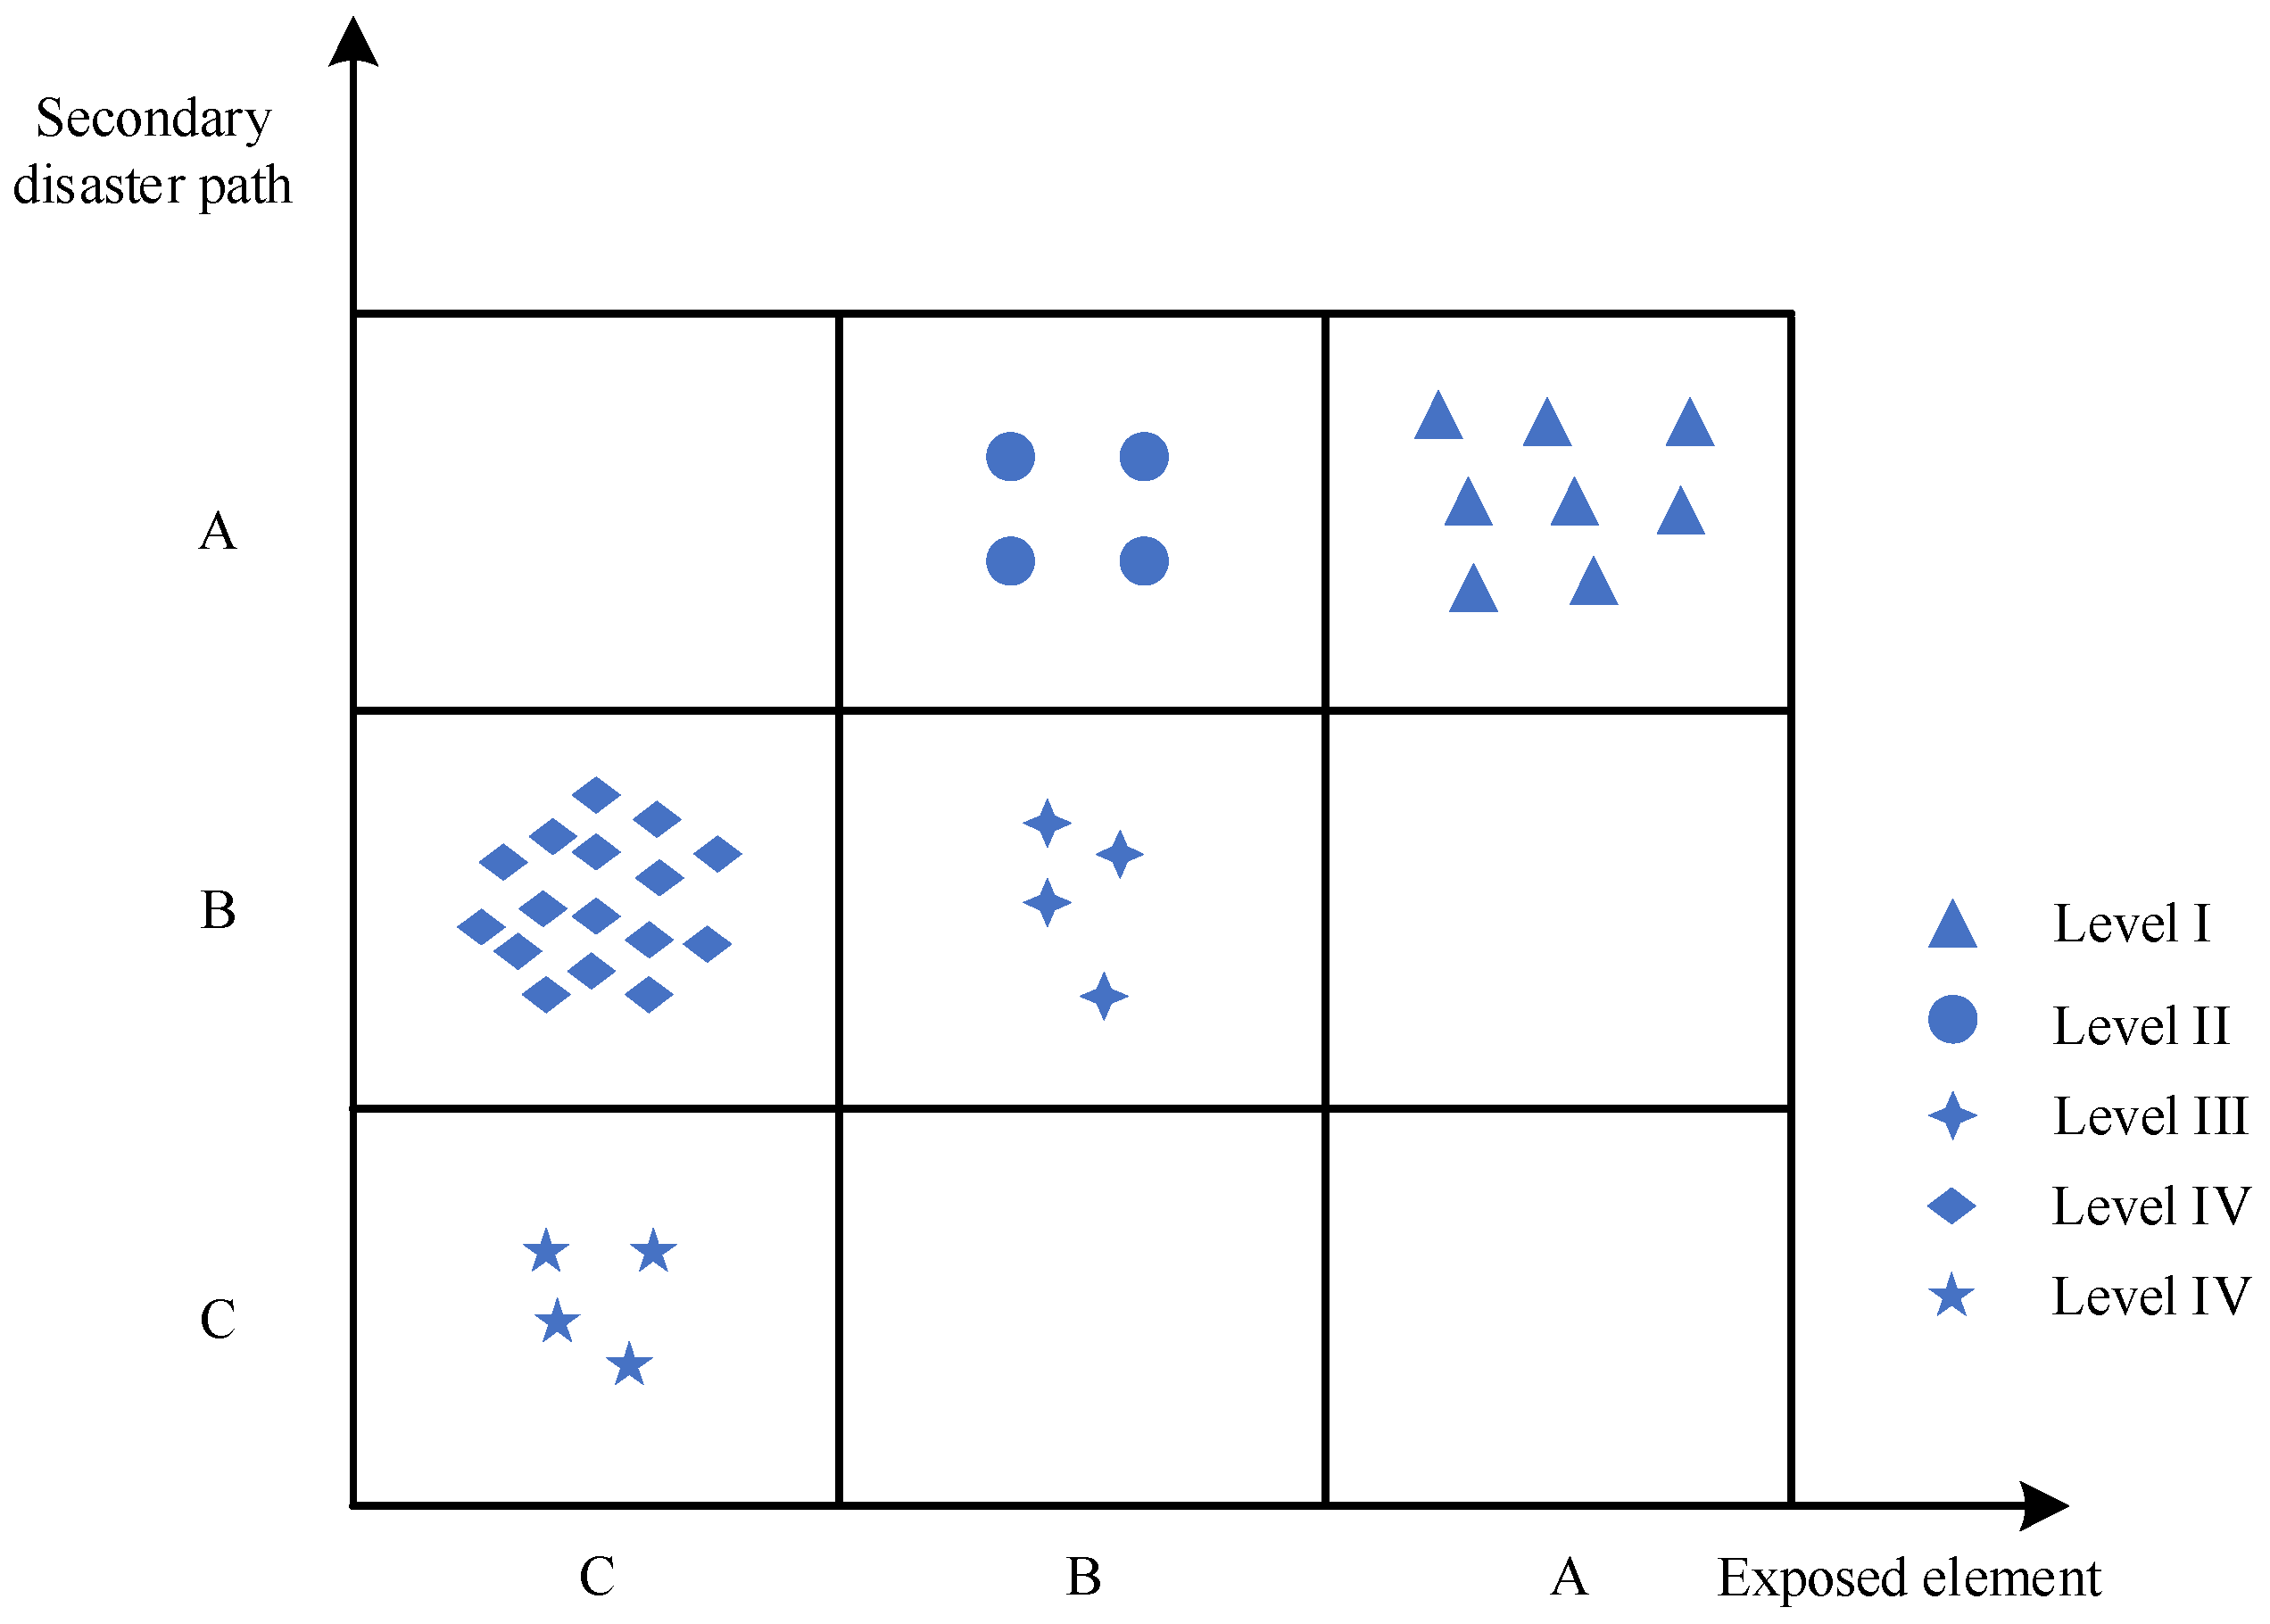
By analyzing the shortest path of the comprehensive key exposed elements and secondary hazards, corresponding management priorities can be derived, as shown in Figure 15 and Table A4 (see Appendix A). The specific classification is as follows:
(1)
Level I (class A exposed elements and class A paths)
As a high-entropy exposed element, surface facility (b4) and surrounding hydrological systems (b2) have many associated nodes in the system and a wide range of influence. The hazard conduction paths based on high-entropy exposed elements are mostly high-risk paths, making prevention difficult. High-risk paths are relatively short, with fast hazard conduction speeds and wide impact ranges, and may quickly lead to severe consequences (such as floods, ground subsidence, etc.) after the exposed element fails. Main paths include: b4-s46-s75-c1, b4-s46-s75-c3, b4-s45-s84-c4, b4-s38-s78-c2, b2-s40-s84-c3, b2-s40-s83-c4, b2-s40-s78-c2, b2-b9-s53-s73-c1.
(2)
Level II (class B exposed elements and class A paths)
Due to geographical reasons, the well and tunnel system (b5) as a medium entropy exposed element and the surrounding geological system (b3) are easily affected by high-entropy-exposed elements. Although the risk of medium entropy-high risk paths is high, the relative uncertainty is lower. Generally, as long as the failure of high-entropy-exposed elements is avoided, the occurrence of medium-entropy–high-risk paths can be effectively prevented. These paths include: b5-s19-s45-c1, b5-s19-s45-c3, b3-s29-s60-c3, b5-s19-s52-c4.
(3)
Level III (class B exposed elements and class B paths)
The risks and uncertainties of this type of path are at a medium level, and serious consequences can be avoided as long as the failure of the exposed element is prevented. For example: b5-s49-s73-c2, b3-s59-s79-c2, b3-b5-s49-s75-c1, b3-b5-s49-s82-c4.
(4)
Level IV (class C exposed elements and class B/C paths)
The risks and uncertainties of these paths are relatively low. Due to the longer path, consequences will gradually arise after the failure of the exposed element, allowing for a longer time to take response measures. Although the urgency is lower, systematic optimization and long-term monitoring are still required.

5. Discussion

5.1. Hazard Reduction Strategies for Coal Mine-Flood Natech Events

In coal mine accidents caused by natural hazards, the power system, ventilation system, mining system, and drainage system are artificial technical systems characterized by their reliance on equipment stability and power supply. The speed of hazard transmission is fast but can be partially controlled through technical means; while surface engineering, hydrological systems, geological systems, and shaft systems are natural or semi-natural systems, directly impacted by natural forces, resulting in more severe hazard consequences and greater difficulty in restoration. Therefore, differentiated prevention, monitoring, and emergency strategies should be adopted for different systems to comprehensively enhance the overall hazard resistance capability of the mining area.
  • Surface facility (b4) and surrounding hydrological systems (b2), as well as the secondary hazard propagation paths that act as conduits between them, should be monitored as the highest priority. After a natural hazard occurs, the status of surface facility and surrounding hydrological systems is most likely to change, easily expanding the hazard scope through the hazard-causing environment, and the rate of destruction is extremely fast. Therefore, in daily protection, surface facility should be reinforced to improve its hazard resistance; real-time monitoring devices (such as hydrological monitoring and ground subsidence monitoring) should be deployed in surrounding hydrological systems to promptly detect anomalies, prevent the failure of surrounding hydrological systems, and thus avoid cascading effects in other hazard-bearing systems.
  • The well and tunnel system (b5) and the surrounding geological system (b3), as well as the secondary hazard propagation paths that act as conductive intermediaries, should be monitored as a second-high priority. These systems are highly susceptible to the impacts of surface facility and surrounding hydrological systems; for example, flooding of industrial squares or damage to river channels may directly lead to well and tunnel collapses or geological structure damage. Therefore, geological exploration should be conducted regularly to identify geological risk points such as faults and landslides in advance, optimizing the layout of wells and tunnels; strengthening well and tunnel reinforcement and dynamic monitoring, using high-strength support materials and sensor networks to monitor well and tunnel deformation and pressure changes in real time; and setting up emergency isolation doors or waterproof flood walls at key nodes of the wells and tunnels to prevent the spread of hazards.
  • The ecological system of the mining area (b1), power system (b9), ventilation system (b8), mining system (b6), drainage system (b7), and the secondary hazard transmission paths that use them as conduits should be prioritized for management. These systems are at a higher risk of indirect impact from natural hazards and need to comprehensively reduce their indirect risks in natural hazards through technical redundancy design (such as backup power supply, multi-level drainage), intelligent monitoring (real-time fault diagnosis and data linkage), ecological protection measures (vegetation buffer zones and pollution emergency response), and remote automated operations, thereby enhancing the system’s hazard resilience and rapid recovery capabilities, and avoiding secondary hazard transmission caused by equipment failure or ecological damage.
  • The transportation lifting system (b10), safety monitoring and communication system (b11), and the secondary hazard propagation paths that serve as conduits for them should be optimized as basic support systems. Although their direct risks are relatively low, the failure of the transportation lifting system and the safety monitoring and communication system may hinder rescue efforts and information transmission. Measures such as planning emergency transportation routes, reinforcing transportation lifting equipment, deploying multi-modal communication redundancy, and implementing hazard linkage response should be taken to ensure smooth transportation and uninterrupted information transmission in extreme environments, providing reliable support for overall emergency response.

5.2. Comparative Analysis with Existing Studies

To further validate the effectiveness and rationality of the proposed C-AIE algorithm, this section presents a comparative study from both quantitative and qualitative perspectives. The method is compared against several classical benchmark algorithms and representative entropy-based node identification approaches.

5.2.1. Comparison with Benchmark Algorithms

The C-AIE algorithm is evaluated alongside several widely used centrality metrics to examine differences in the ranking of exposed element importance. As shown in Table 5 and Figure 16, although the ranking outcomes vary among algorithms, nodes b4 and b2 consistently appear in the top positions across most methods, demonstrating high consensus with the results derived from the proposed model.
More importantly, the C-AIE algorithm shows superior discriminative capability in identifying the most critical nodes (e.g., b4 and b2), with their computed C-AIE values exhibiting a markedly higher magnitude compared to others. This underscores the algorithm’s higher sensitivity and precision in capturing key structural nodes within the hazard network.
From the hazard propagation perspective, these top-ranked nodes (b4 and b2) also tend to trigger broader and more interconnected chains of secondary hazards. This finding is consistent with the results of reference [43], whose research on flood-induced coal mine hazards identified similar key nodes in the critical hazard evolution chains. These parallels further substantiate the applicability and validity of the C-AIE algorithm in real-world Natech event analysis.

5.2.2. Comparison with Other Entropy-Based Node Identification Algorithms

To further verify the innovativeness and adaptability of the C-AIE algorithm, a horizontal comparison is conducted between the proposed method and several entropy-based node identification algorithms. Table 6 summarizes the applicability of related methods across multiple dimensions.
Several existing studies have contributed valuable approaches to node identification from an entropy-based perspective. For instance, reference [25], drawing on degree entropy theory, developed an adjacency information entropy algorithm tailored for urban rail transit networks, which effectively identifies structurally vulnerable components. Reference [44] constructed node input features by integrating information entropy with node degree and the average degree of neighboring nodes, proposing a lightweight yet effective graph neural network model. Reference [45] introduced a Local Structure Entropy method based on Taslli entropy, where critical nodes are identified through simulated node removal. In contrast, Reference [26] proposed an enhanced adjacency information entropy method applicable to four network types: undirected-unweighted, undirected-weighted, directed-unweighted, and directed-weighted. While these entropy-based algorithms have demonstrated considerable potential in identifying important nodes across diverse networks, they still face limitations in terms of directionality, edge weights, and the omission of inter-node coupling dynamics. To address these shortcomings, this paper presents the C-AIE algorithm as an innovative alternative, offering the following advantages:
(1)
Well-suited for directed and weighted networks, enhancing applicability. The C-AIE algorithm is specifically developed to accommodate directed and weighted networks, aligning well with the structural attributes of hazard chain systems. In contrast, methods proposed in References [25,44,45] are limited to undirected and unweighted networks, rendering them inadequate for capturing asymmetric inter-node influences or varying edge weights. By differentiating the impact of in-degree and out-degree on node significance, the C-AIE algorithm offers a more refined understanding of network structure.
(2)
Computationally efficient with reduced data requirements. Unlike the method in reference [45], which necessitates both first-order and second-order neighbor information, the C-AIE algorithm relies solely on a node and its immediate neighbors. This design simplifies the data processing pipeline while preserving high identification accuracy, making it suitable for large-scale or data-constrained scenarios.
(3)
Incorporates coupling mechanisms to model compound hazard dynamics. Although reference [26] extends entropy-based methods to various network types, it—like other compared methods—does not account for hazard coupling. The C-AIE algorithm addresses this gap by modeling the collaborative impact of multiple parent nodes on a shared downstream node, thus capturing the cascade amplification effects commonly observed in multi-hazard hazard systems.
In conclusion, the C-AIE algorithm exhibits superior adaptability, discriminative power, and interpretability in assessing the significance of exposed elements. It not only identifies critical nodes more effectively but also encapsulates realistic features such as propagation intensity and inter-node synergy within the disaster evolution process. Balancing data sufficiency, computational tractability, and model precision, C-AIE provides a robust analytical foundation for studying complex hazard networks.

5.3. Applicability of the Proposed Method Across Sectors

This paper presents a method for modeling flood-induced Natech disaster chains in coal mines, aiming to support risk-informed decision-making by identifying critical exposed elements, analyzing secondary disaster propagation paths, and prioritizing management strategies. The dataset comprises representative coal mine cases from various countries and regions, encompassing multiple coal mine types. Therefore, the proposed approach demonstrates a certain degree of generalizability under flood-prone scenarios. However, we acknowledge that the current study does not yet address non-coal mines (e.g., copper or tungsten mines) or systematically explore the differences in disaster chain structures between open-pit and underground coal mining operations—both of which represent promising directions for future research.
To evaluate the method’s applicability beyond flood-related contexts, we distinguish two categories of mining scenarios:
(1) Mines without natural hazard exposure. These scenarios involve accidents arising solely from human factors, such as technical failure or operational errors, and do not fall under the definition of Natech events. As the model is built upon the two-stage causal structure of “natural hazard → exposed element → secondary disaster,” its application is not valid in the absence of natural triggers. This delineates a clear boundary for methodological applicability.
(2) Mines exposed to non-flood natural hazards. This includes mines vulnerable to events such as earthquakes, snowstorms, or landslides. In such Natech-related settings, the proposed method can be adapted and applied effectively, provided that the following modifications are made to account for disaster-specific and site-specific factors:
  • Reclassification of exposed elements. The critical infrastructure affected varies across hazard types. Floods typically damage surface-level drainage and shaft systems, whereas earthquakes are more likely to impact underground tunnels and support structures. Hence, the node types and spatial distribution in the network must be redefined accordingly.
  • Adjustment of coupling mechanisms. The current model is based on flood-induced cascading effects. However, other hazards differ in their transmission mechanisms and interdependency patterns. Therefore, the inter-node coupling logic and edge weights must be revised to accurately capture the dynamic evolution under alternative disaster scenarios.
  • Modification of hazard propagation mechanisms. Spatial and temporal characteristics of hazard spread vary significantly. Floods tend to exhibit terrain-dependent flow paths, while earthquakes propagate damage in a simultaneous, multi-point fashion. As such, model parameters and propagation rules should be recalibrated to reflect these differences.
Furthermore, the research framework developed in this study holds strong potential for extension to other non-mining sectors that are exposed to Natech risks, such as the chemical industry, transportation systems, and fisheries. However, to ensure effective applicability, it is essential to implement targeted adjustments based on the three key aspects discussed above.

6. Conclusions and Suggestions

6.1. Conclusions and Future Work

Compared to ordinary coal mine hazard chains, the most significant feature of coal mine Natech events is that the coal mine hazard-bearing system acts as both the exposed element and the hazard-causing factor. Natural hazards lead to the failure of the exposed element, which in turn triggers more severe secondary hazards. In addition, the scale of the coal mine Natech event network is larger, with more nodes and edges, and the relationships between nodes are more complex. Therefore, identifying key exposed elements and secondary hazard paths is of great significance for understanding the structure of the coal mine Natech network and the mechanisms of hazard propagation, and for implementing targeted hazard reduction measures.
This paper developed a classification and grading framework for coal mine Natech events based on node importance identification and shortest path recognition. The framework integrates three methods: complex networks, Adjacency Information Entropy, and Dijkstra’s algorithm, each of which plays a specific role in the analysis of coal mine Natech events. First, complex networks are used to illustrate the causal coupling relationships of events, revealing the topological structure of the hazard propagation network. Second, a novel node importance identification method named C-AIE is proposed based on the Adjacency Information Entropy algorithm. This method comprehensively considers the position of the hazard-bearing nodes and their neighboring nodes in the network, as well as the coupling effects of natural hazards on the exposed elements, allowing for more accurate identification of key exposed elements. Next, Dijkstra’s algorithm is used to identify the most dangerous secondary hazard propagation paths based on key exposed elements, providing a basis for the classification and grading of response to hazards.
Building upon the proposed methodology, this paper constructs a directed weighted network as the computational foundation and performs comparative analyses against several state-of-the-art algorithms. Leveraging an extensive dataset of real-world cases, the developed model is applied to coal mine Natech scenarios to identify the key exposed elements and secondary hazard propagation paths most likely to result in severe economic losses, ecological damage, casualties, and social impacts. These critical elements and pathways are further categorized into prioritized levels. The findings reveal that surface facility, surrounding hydrological systems, shaft and tunnel system, and surrounding geological systems serve as central components in the Natech network. Propagation paths mediated through these components exhibit higher urgency and risk. Based on this analysis, a classification-based intervention strategy is proposed to interrupt critical transmission links, providing scientific support for risk mitigation in coal mine Natech emergencies. Nevertheless, the study has several limitations: (1) Although Dijkstra’s algorithm is employed in this paper to identify the shortest transmission paths between critical nodes for estimating potential disaster propagation risks, in real-world Natech scenarios—such as those involving terrain obstructions, infrastructure damage, or the early release of toxic substances—high-risk routes may not necessarily correspond to the shortest ones. Future studies could incorporate path-specific risk weights (e.g., toxicity, population density, and route capacity) to refine the risk assessment and enable more accurate identification of high-risk transmission paths. (2) The current framework primarily emphasizes the transmission mechanics of the disaster chain, with limited attention to human, organizational, and societal influences. Subsequent research will aim to incorporate these components into the network structure, enhancing the model’s representativeness and enabling more adaptive responses to real-world Natech crises.

6.2. Suggestions

Although the methodology proposed in this paper was initially developed for modeling flood-induced disaster chains in coal mines, its underlying logic and analytical framework exhibit strong generalizability and scalability for various types of Natech events in both coal and non-coal mining contexts. For researchers and practitioners aiming to extend this work, we propose the following directions:
(1)
Develop a multi-hazard Natech knowledge base and dataset. Establishing a comprehensive accident case repository in representative mining regions—including events triggered by floods, earthquakes, landslides, and snow-related hazards—would allow for systematic documentation of exposed element distributions, coupling chains, and historical propagation patterns. Such a database would facilitate effective model transfer and algorithm refinement.
(2)
Conduct model adaptation studies for different types of mines. It is suggested to investigate the characteristics of accident chains in different types of mines under the influence of natural disasters, and to explore algorithmic models with high adaptability and generalization ability in broader application scenarios.

Author Contributions

Conceptualization, X.Y. and C.L.; Data curation, C.L. and Z.M.; Formal analysis, X.Y. and L.P.; Investigation, C.L. and K.H.; Methodology, X.Y. and C.L.; Project administration, X.Y.; Resources, X.S. and K.H.; Software, X.S.; Supervision, X.Y.; Validation, C.L. and L.P.; Visualization, X.S. and K.H.; Writing—original draft, C.L.; Writing—review and editing, L.P. and Z.M. All authors have read and agreed to the published version of the manuscript.

Funding

This work was funded by the National Natural Science Foundation of China [grant number 71573086], the Henan University Philosophy and Social Science Innovation Team Funding Project (2024-CXTD-10), and the Innovative Science and Technology Team of Water Resource Security and Clean Energy Cooperative Management in Henan Province (01).

Data Availability Statement

The data presented in this study are available upon request from the corresponding author. The data are not publicly available due to privacy or ethical restrictions.

Conflicts of Interest

The authors declare no conflicts of interest.

Appendix A

Table A1. Node importance calculation results under different methods.
No.NodeinDCoutDCinCCoutCCBCECC-AIE
1a1012.0002.81100.0120.141
2a2022.0002.81100.0250.228
3a3052.0002.89600.0030.915
4a4072.0002.89600.0050.909
5a5062.0002.60500.0050.951
6a60102.0003.26000.0491.457
7a70142.0002.97500.0481.051
8a8072.0003.25800.1830.934
9a9052.0002.47600.0220.344
10a100102.0003.48000.0901.482
11a11052.0002.97500.0180.878
12a12052.0002.67000.0200.993
13b17152.0832.54916.2330.0084.204
14b28142.0832.48913.6710.0123.253
15b36192.1282.75640.7000.1854.776
16b4382.0832.3188.0950.0080.879
17b51362.0832.42713.6170.0971.892
18b61222.0832.42715.0000.0401.120
19b71452.1742.42728.3170.0677.614
20b85172.0832.31810.8000.5470.308
21b93122.0832.42712.8330.1050.841
22b10622.0832.42710.7330.0290.798
23c1452.1262.1724.9500.0033.510
24c21252.2192.22015.4600.01021.151
25c3612.1262.0826.0000.0050.800
26c41182.2192.1278.2880.0102.710
27c5732.5552.17227.9690.0200.357
28c61242.4912.17229.9000.12116.599
29c7342.4312.17227.4500.0260.553
30c8942.5532.12726.0330.1092.151
31c91162.3202.17215.3170.1258.660
32c10862.2192.17215.8330.1277.238
33c11862.1262.1725.7330.3560.554
34c129112.1262.1276.0670.5041.213
35c13352.2642.0412.0000.0040.530
36c14212.3172.0413.7500.0010.459
37c15752.3712.0413.6020.0040.125
38c16712.8262.0419.0640.0060.115
39c17412.8212.0419.2330.0260.125
40c18563.1672.04116.2500.0100.454
41c19222.8232.04112.3330.0170.528
42c20822.7472.0416.7170.1442.417
43c21512.8212.0418.0500.0420.553
44c221022.4842.0415.4500.2240.291
45c23742.2172.0413.0670.2530.103
46c24332.7452.04110.4830.0390.520
47c251203.8402.00000.0050.000
48c26804.3252.00000.0040.000
49c27404.1492.00000.0240.000
50c28903.4652.00000.1050.000
Table A2. Node C-AIE calculation results under different coupling mechanisms.
No.NodeOR CouplingAND CouplingCO CouplingNo Coupling (AIE)
1a10.19240.18270.19310.1408
2a20.30060.28730.30150.2275
3a30.97160.95900.96590.9148
4a40.96470.96280.98220.9090
5a50.98170.97530.97610.9508
6a61.20351.29271.26141.4572
7a70.69360.81830.77741.0512
8a81.01310.99290.99430.9341
9a90.36210.36020.36140.3439
10a101.29071.34451.28351.4816
11a110.91620.90470.91370.8779
12a121.03411.02711.03210.9929
13b18.08908.089011.38554.2040
14b28.24626.57789.51193.2529
15b322.947115.737623.66924.7756
16b40.50100.56940.49880.8790
17b57.06324.94467.39781.8916
18b65.34602.96994.57481.1200
19b7127.924170.218698.43167.6137
20b81.22250.40000.59140.3081
21b90.35780.54340.41170.8411
22b100.39300.04830.52100.7979
23c13.50963.50963.50963.5096
24c221.150521.150521.150521.1505
25c30.80020.80020.80020.8002
26c42.71002.71002.71002.7100
27c50.35710.35710.35710.3571
28c616.598816.598816.598816.5988
29c70.55340.55340.55340.5534
30c82.15132.15132.15132.1513
31c98.65968.65968.65968.6596
32c107.23817.23817.23817.2381
33c110.55390.55390.55390.5539
34c121.21261.21261.21261.2126
35c130.52990.52990.52990.5299
36c140.45940.45940.45940.4594
37c150.12510.12510.12510.1251
38c160.11510.11510.11510.1151
39c170.12510.12510.12510.1251
40c180.45360.45360.45360.4536
41c190.52830.52830.52830.5283
42c202.41692.41692.41692.4169
43c210.55340.55340.55340.5534
44c220.29050.29050.29050.2905
45c230.10280.10280.10280.1028
46c240.52000.52000.52000.5200
47c250000
48c260000
49c270000
50c280000
Table A3. Shortest evolution path of secondary disasters caused by different exposed elements.
GradingShortest Path NodeShortest Path Length
High riskb4-s16-s45-c12.2
b4-s16-s45-c32.2
b4-s8-s48-c22.2
b5-s19-s43-c22.2
b4-s15-s54-c42.3
b2-b9-s23-s43-c12.3
b2-s10-s48-c22.4
b5-s19-s45-c12.5
b5-s19-s45-c32.5
b2-s10-s54-c32.5
b2-s10-s53-c42.5
b3-s29-s49-c22.5
Medium riskb5-s19-s52-c42.6
b9-s23-s43-c12.6
b9-s23-s43-c22.6
b9-s23-s43-c32.6
b1-s5-s54-c32.7
b1-s5-s48-c22.8
b8-s25-s58-c22.9
b1-s17-s52-c43.0
b3-s29-s60-c33.0
b3-b5-s19-s45-c13.3
b3-b5-s19-s52-c43.4
b6-s26-s31-s60-c33.5
b7-s27-s19-s45-c13.5
b7-s27-s19-s45-c33.5
b7-s27-s19-s52-c43.6
b1-s5-s48-s19-s45-c13.8
b6-s26-s31-s57-c24.0
b7-s27-s19-s43-c24.0
b9-s23-s27-s19-s52-c44.3
b6-s26-s31-s23-s43-c14.9
Low riskb8-s25-s34-s36-s31-s60-c35.4
b6-s26-s31-s27-s19-s52-c45.6
b8-s25-s34-s36-s31-s27-s19-s52-c42.0
b8-s25-s34-s36-s31-s23-s43-c16.8
Table A4. Management priority of key exposed elements and shortest paths of secondary disasters in coal mine-flood Natech events.
Management PriorityExposed Element LevelPath LevelExposed ElementShortest Path Node
IAAb4b4-s16-s45-c1
b4b4-s16-s45-c3
b4b4-s8-s48-c2
b4b4-s15-s54-c4
b2b2-b9-s23-s43-c1
b2b2-s10-s48-c2
b2b2-s10-s54-c3
b2b2-s10-s53-c4
IIBAb5b5-s19-s43-c2
b5b5-s19-s45-c1
b5b5-s19-s45-c3
b3b3-s29-s49-c2
IIIBBb5b5-s19-s52-c4
b3b3-s29-s60-c3
b3b3-b5-s19-s45-c1
b3b3-b5-s19-s52-c4
IVCBb9b9-s23-s43-c1
b9b9-s23-s43-c2
b9b9-s23-s43-c3
b1b1-s5-s54-c3
b1b1-s5-s48-c2
b8b8-s25-s58-c2
b1b1-s17-s52-c4
b6b6-s26-s31-s60-c3
b7b7-s27-s19-s45-c1
b7b7-s27-s19-s45-c3
b7b7-s27-s19-s52-c4
b1b1-s5-s48-s19-s45-c1
b6b6-s26-s31-s57-c2
b7b7-s27-s19-s43-c2
b9b9-s23-s27-s19-s52-c4
b6b6-s26-s31-s23-s43-c1
CCb8b8-s25-s34-s36-s31-s60-c3
b6b6-s26-s31-s27-s19-s52-c4
b8b8-s25-s34-s36-s31-s27-s19-s52-c4
b8b8-s25-s34-s36-s31-s23-s43-c1

Appendix B

Algorithm A1 Steps of the priority determination method based on exposed element management and secondary hazard mitigation
1 Start
2   Input: Directed weighted graph G = (V, E, W)
3      where V = set of nodes, E = set of edges, W = edge weights
4   // Step 1: Node activation probability modeling
5   For each node i ∈ V do
6     Compute occurrence probability using Equations (7)–(10):
7   End for
8   // Step 2: Edge-level coupling enhancement coefficient calculation
9   For each edge (j → i) ∈ E do
10    Set e(j→i) ← 0
11    For each neighbor r ∈ Predecessors(i), r ≠ j do
12     Determine coupling type T ← C(j, r, i)
13     Compute joint probability p(j ∩ r)
14     Switch T:
15      Case OR based on Equation (1):
        c ←  k j or r = P j + P r P j r
16      Case AND based on Equation (3):
        c ←  k j and r = P j r
17      Case CO based on Equation (5):
18       If p(j) × p(r) ≠ 0 then
         c ←  k j co r = P j r P j · P r
19       Else:
20        c ← 0
21     End Switch
22     Accumulate: e(j→i) ← e(j→i) + c
23    End for
24   End for
25   // Step 3: Coupling-adjacency information entropy computation
26   For each node i ∈ V do
27     Compute strength values using Equations (16)–(18)
28     Compute entropy using Equations (19)–(21):
29   End for
30   // Step 4: Shortest path analysis using Dijkstra
31   For each source node s ∈ S do
32    Run Dijkstra(G, source = s)
33    For each destination node t ∈ V do
34      Store l(s, t) ← distance from s to t
35    End for
36   End for
37   // Step 5: Priority classification based on entropy and path risk
38   For each node i ∈ V do
39     If H(i) ≥ θ_high → class_i ← ‘A’
40     Else if H(i) ≥ θ_mid → class_i ← ‘B’
41     Else → class_i ← ‘C’
42   End for
43   For each (s → t) ∈ all stored shortest paths l(s, t) do
44     If l(s, t) ≤ l_short → class_l(s,t) ← ‘A’
45     Else if l(s, t) ≤ l_mid → class_l(s,t) ← ‘B’
46     Else → class_l(s,t) ← ‘C’
47   End for
48   // Step 6: Cross-dimensional priority matrix assignment
49   For each (s → t) do
50     Retrieve c_i = class_s, c_l = class_l(s, t)
51     Assign priority level:
52      If (c_i = A ∧ c_l = A) → priority ← I
53      Else if (c_i =A ∧ c_l = B) ∨ (c_i =B ∧ c_l =A) → priority ← II
54      Else if (c_i =B ∧ c_l = B) → priority ← III
55      Else → priority ← IV
56   End for
57   Output
58     -Node importance classification: EntropyClass(i) ∈ {A, B, C}
59     -Path risk classification: PathRiskClass(s → t) ∈ {A, B, C}
60     -Combined priority matrix: PriorityLevel(s → t) ∈ {I, II, III, IV}
61 End

References

  1. Misuri, A.; Cozzani, V. A paradigm shift in the assessment of Natech scenarios in chemical and process facilities. Process Saf. Environ. Prot. 2021, 152, 338–351. [Google Scholar] [CrossRef]
  2. Krausmann, E.; Cruz, A.M.; Salzano, E. Natech Risk Assessment and Management: Reducing the Risk of Natural-Hazard Impact on Hazardous Installations; Elsevier: Amsterdam, The Netherlands, 2016. [Google Scholar]
  3. Lan, M.; Gardoni, P.; Qin, R.; Zhang, X.; Zhu, J.; Lo, S. Modeling NaTech-related domino effects in process clusters: A network-based approach. Reliab. Eng. Syst. Saf. 2022, 221, 108329. [Google Scholar] [CrossRef]
  4. Zou, J.; Ma, T.; He, Y.; Zhao, H.; Chu, Y.; Zhang, D.; Huang, C. Quantitative risk analysis of domino effect and natech accidents triggered by flood in liquor storage tank farms. J. Loss Prev. Process Ind. 2024, 92, 105490. [Google Scholar] [CrossRef]
  5. Ricci, F.; Moreno, V.C.; Cozzani, V. A comprehensive analysis of the occurrence of Natech events in the process industry. Process Saf. Environ. Prot. 2021, 147, 703–713. [Google Scholar] [CrossRef]
  6. Ma, T.; Zou, J.; He, Y.; Zhao, H.; Chu, Y.; Zhang, D.; Huang, C. Application of domino effect quantitative risk assessment to Natech accident triggered by earthquakes in a liquor storage tank area. Int. J. Disaster Risk Reduct. 2024, 114, 104957. [Google Scholar] [CrossRef]
  7. Liu, Y.; Yang, T.; Wang, H.; Zhang, P.; Dong, X.; Zhao, Y.; Liu, Y. Risk assessment of disaster chain in multi-seam mining beneath gully topography. Int. J. Disaster Risk Reduct. 2024, 111, 104750. [Google Scholar] [CrossRef]
  8. Qi, Q.; Sun, Z.; Liu, W.; Wang, A.; Yang, J.; Liu, S.; Sun, L.; Wang, W. Study on risk assessment model of coal mine water accident induced by flood disaster. Coal Sci. Technol. 2023, 51, 395–402. [Google Scholar] [CrossRef]
  9. Zhang, D.; Zhang, Y.; Li, S.; Li, S.; Chen, W. Bi-objective robust optimisation on relief collaborative distribution considering secondary disasters. Int. J. Prod. Res. 2024, 62, 2435–2454. [Google Scholar] [CrossRef]
  10. YIlDIz, T.D. Loss of profits occurring due to the halting of mining operations arising from occupational accidents or reasons related to legislation. Gospod. Surowcami Miner. 2021, 37, 153–176. [Google Scholar] [CrossRef]
  11. Kahraman, M.M. Analysis of Mining Lost Time Incident Duration Influencing Factors Through Machine Learning. Min. Metall. Explor. 2021, 38, 1031–1039. [Google Scholar] [CrossRef]
  12. Kong, F. Discussion on the Coupling Effect of Disasters from the Perspective of Disaster System. J. Catastrophol. 2024, 39, 1–5. [Google Scholar] [CrossRef]
  13. Sun, Z.; Liu, Y.; Qi, Q.; Liu, W.; Li, D.; Chai, J. Risk assessment of coal mine flood disasters based on projection pursuit clustering model. Sustainability 2022, 14, 11131. [Google Scholar] [CrossRef]
  14. Jiao, L.; Luo, Q.; Lu, H.; Huo, X.; Zhang, Y.; Wu, Y. Research on the urban rail transit disaster chain: Critical nodes, edge vulnerability and breaking strategy. Int. J. Disaster Risk Reduct. 2024, 102, 104258. [Google Scholar] [CrossRef]
  15. Zeng, T.; Chen, G.; Reniers, G.; Hu, K. Resilience assessment of chemical industrial areas during Natech-related cascading multi-hazards. J. Loss Prev. Process Ind. 2023, 81, 104967. [Google Scholar] [CrossRef]
  16. Chen, C.; Reniers, G.; Khakzad, N. A thorough classification and discussion of approaches for modeling and managing domino effects in the process industries. Saf. Sci. 2020, 125, 104618. [Google Scholar] [CrossRef]
  17. Ding, L.; Khan, F.; Guo, X.; Ji, J. A novel approach to reduce fire-induced domino effect risk by leveraging loading/unloading demands in chemical industrial parks. Process Saf. Environ. Prot. 2021, 146, 610–619. [Google Scholar] [CrossRef]
  18. Lan, M.; Shao, Y.; Zhu, J.; Lo, S.; Ng, S.T. A hybrid copula-fragility approach for investigating the impact of hazard dependence on a process facility’s failure. Process Saf. Environ. Prot. 2021, 149, 1017–1030. [Google Scholar] [CrossRef]
  19. Lan, M.; Zhu, J.; Lo, S. Hybrid Bayesian network-based landslide risk assessment method for modeling risk for industrial facilities subjected to landslides. Reliab. Eng. Syst. Saf. 2021, 215, 107851. [Google Scholar] [CrossRef]
  20. Zhou, J.; Yu, X.; Lu, J. Node importance in controlled complex networks. IEEE Trans. Circuits Syst. II Express Briefs 2018, 66, 437–441. [Google Scholar] [CrossRef]
  21. Zhang, Q.; Deng, R.; Ding, K.; Li, M. Structural analysis and the sum of nodes’ betweenness centrality in complex networks. Chaos Solitons Fractals 2024, 185, 115158. [Google Scholar] [CrossRef]
  22. Tomaselli, C.; Gambuzza, L.V.; Sorrentino, F.; Frasca, M. Control of multiconsensus in multi-agent systems based on eigenvector centrality. Automatica 2024, 164, 111638. [Google Scholar] [CrossRef]
  23. Shang, Q.; Deng, Y.; Cheong, K.H. Identifying influential nodes in complex networks: Effective distance gravity model. Inf. Sci. 2021, 577, 162–179. [Google Scholar] [CrossRef]
  24. Guo, H.-x.; He, X.-y.; Lv, X.-b.; Wu, Y. Risk analysis of rainstorm-urban lifeline system disaster chain based on the PageRank-risk matrix and complex network. Nat. Hazards 2024, 120, 10583–10606. [Google Scholar] [CrossRef]
  25. Huang, W.; Li, H.; Yin, Y.; Zhang, Z.; Xie, A.; Zhang, Y.; Cheng, G. Node importance identification of unweighted urban rail transit network: An Adjacency Information Entropy based approach. Reliab. Eng. Syst. Saf. 2024, 242, 109766. [Google Scholar] [CrossRef]
  26. Hu, G.; Xu, X.; Gao, H.; Guo, X. Node importance recognition algorithm based on adjacency information entropy in networks. Syst. Eng.-Theory Pract. 2020, 40, 714–725. [Google Scholar] [CrossRef]
  27. Chen, Y.; Zhang, L.; Chen, X. A framework for using event evolutionary graphs to rapidly assess the vulnerability of urban flood cascade compound disaster event networks. J. Hydrol. 2024, 642, 131783. [Google Scholar] [CrossRef]
  28. Lotero, S.; Androulakis, V.; Khaniani, H.; Hassanalian, M.; Shao, S.; Roghanchi, P. Optimizing fire emergency evacuation routes in underground coal mines: A lightweight network flow approach. Tunn. Undergr. Space Technol. 2024, 146, 105637. [Google Scholar] [CrossRef]
  29. Bulut, M.; Özcan, E. Optimization of electricity transmission by Ford–Fulkerson algorithm. Sustain. Energy Grids Netw. 2021, 28, 100544. [Google Scholar] [CrossRef]
  30. Eggimann, S. The potential of implementing superblocks for multifunctional street use in cities. Nat. Sustain. 2022, 5, 406–414. [Google Scholar] [CrossRef]
  31. Wu, L.; Huang, X.; Cui, J.; Liu, C.; Xiao, W. Modified adaptive ant colony optimization algorithm and its application for solving path planning of mobile robot. Expert Syst. Appl. 2023, 215, 119410. [Google Scholar] [CrossRef]
  32. Sadaf, T.; Qamar, U.; Khan, S.A.; Almutairi, S. A novel smart street intervention mechanism using clustering-based path optimization for street networks. Knowl.-Based Syst. 2025, 311, 113065. [Google Scholar] [CrossRef]
  33. Yu, S.; Song, Y. Ripple spreading algorithm: A new method for solving multi-objective shortest path problems with mixed time windows. Complex Intell. Syst. 2024, 10, 2299–2325. [Google Scholar] [CrossRef]
  34. Hu, H.; Lan, M.; Qin, R.; Zhu, J. Fragility assessment for process pipelines in flood events through physically-based hazard response analysis. J. Loss Prev. Process Ind. 2024, 90, 105349. [Google Scholar] [CrossRef]
  35. Deng, J.; Liu, S.; Shu, Y.; Hu, Y.; Xie, C.; Zeng, X. Risk evolution and prevention and control strategies of maritime accidents in China’s coastal areas based on complex network models. Ocean Coast. Manag. 2023, 237, 106527. [Google Scholar] [CrossRef]
  36. Zheng, W.; Li, T.; Jing, Q.; Qi, S.; Li, Y. Real-time quantitative risk analysis and routing optimization of gaseous hydrogen tube trailer transport: A Bayesian network and Dijkstra algorithm combining approach. Process Saf. Environ. Prot. 2024, 192, 1205–1220. [Google Scholar] [CrossRef]
  37. Li, X.; Ning, X.; Ma, J.; Han, Z. Investigating the Evolution Path of Urban Natural Gas Pipeline Accidents Using a Complex Network Approach. ASCE-ASME J. Risk Uncertain. Eng. Syst. Part A Civ. Eng. 2024, 10, 06024005. [Google Scholar] [CrossRef]
  38. Office of the Leading Group of the First National Natural Disaster Comprehensive Risk Survey of the State Council. Technical Specification for the Investigation of Exposed Elements in Coal Mine Natural Hazards. FXPC/YJ G-12. 2021. Available online: https://jz.docin.com/p-2842135927.html (accessed on 15 March 2025).
  39. Zhu, G.; Sun, R.; Fan, J.; Li, F.; Hou, Y.; Yu, H.; Liu, P.X. Coupling Effect and Chain Evolution of Urban Rail Transit Emergencies. IEEE Trans. Intell. Transp. Syst. 2023, 25, 1044–1053. [Google Scholar] [CrossRef]
  40. Sentz, K.; Ferson, S. Combination of Evidence in Dempster-Shafer Theory; Sandia National Laboratories: Albuquerque, NM, USA, 2002. [Google Scholar]
  41. Shannon, C.E. A mathematical theory of communication. Bell Syst. Tech. J. 1948, 27, 379–423. [Google Scholar] [CrossRef]
  42. Guo, X.; Zhao, J.; Zong, X.; Song, G.; Du, L.; Lai, C.; Jin, X. Redefining mandibular sub-units: The “ABC” classification and surgical strategies for lower face contouring. Aesthetic Plast. Surg. 2023, 47, 690–699. [Google Scholar] [CrossRef]
  43. Wang, C.; Ma, J.; Su, C.; Deng, J.; Chen, W. Evolution and risk analysis of flood-induced coal mine disaster chains. J. Saf. Environ. 2025, 1–12. [Google Scholar] [CrossRef]
  44. Xi, Y.; Cui, X. Identifying influential nodes in complex networks based on information entropy and relationship strength. Entropy 2023, 25, 754. [Google Scholar] [CrossRef] [PubMed]
  45. Lei, M.; Cheong, K.H. Node influence ranking in complex networks: A local structure entropy approach. Chaos Solitons Fractals 2022, 160, 112136. [Google Scholar] [CrossRef]
Figure 1. Schematic diagram of the two-stage evolution network model for coal mine-flood Natech events.
Water 17 02181 g001
Figure 2. Basic structure of the coal mine-flood Natech evolution network.
Water 17 02181 g002
Figure 3. Flowchart of Dijkstra’s algorithm.
Water 17 02181 g003
Figure 4. Management priority matrix under dual dimensions.
Water 17 02181 g004
Figure 5. Network topology diagram for numerical study.
Water 17 02181 g005
Figure 6. Node identification results under different methods.
Water 17 02181 g006
Figure 7. Comparison of node distribution under different centrality indices.
Water 17 02181 g007
Figure 8. Comparison of C-AIE under different coupling mechanisms.
Water 17 02181 g008
Figure 9. Fitting results between EC and C-AIE.
Water 17 02181 g009
Figure 10. Workflow of the priority determination method based on exposed element management and secondary hazard mitigation.
Water 17 02181 g010
Figure 11. Coal mine-flood Natech event chain network.
Water 17 02181 g011
Figure 12. High-risk paths of secondary hazards.
Water 17 02181 g012
Figure 13. Medium-risk paths of secondary hazards.
Water 17 02181 g013
Figure 14. Low-risk paths of secondary hazards.
Water 17 02181 g014
Figure 15. Coal mine-flood Natech event management priority matrix.
Water 17 02181 g015
Figure 16. Comparison of node rankings between the proposed method and benchmark algorithms.
Water 17 02181 g016
Table 1. Detailed scenario information of flood-induced coal mine Natech events.
No.Node NumberNode InformationNo.Node NumberNode Information
1o1Heavy rain and flood52s22Puddle in the tunnel
2o2Strong wind53s23Damage to power system equipment
3o3Thunderbolt54s24Safety monitoring and communication system equipment failure
4e1Lightning current and strong energy55s25Ventilation system equipment malfunction
5e2Wind pressure56s26Short circuit with electric machinery
6e3Surface runoff57s27Drainage system damage
7e4Surface water58s28Mud and slurry collapse in the tunnel
8e5Old empty water59s29Collapse of mined-out areas
9e6Groundwater60s30Water accumulation in mined-out areas
10f1Lightning strike61s31Gas explosion
11f2Storm62s32Increase in water flow
12f3Changes in the physical structure63s33Drainage failure
13f4Landslide and rockfall64s34The fan stops blowing
14f5Debris flow65s35Toxic gas emissions
15f6Ground subsidence66s36Gas accumulation
16f7Mountain flood67s37System false alarm
17f8Mineral water68s38Residential area damaged
18f9Mine water inrush, infiltration, and flooding69s39Hot air flow intake
19f10Goaf70s40Heat wave burns
20b1Mining area ecosystem71s41Building collapse
21b2Surrounding hydrological system72s42Damage to machinery and equipment
22b3Surrounding geological system73s43Power outage
23b4Surface facility74s44Communication interruption
24b5Shaft and tunnel system75s45Water supply interruption
25b6Mining system76s46Road traffic interruption
26b7Drainage system77s47Electric shock
27b8Ventilation system78s48The river water level rises
28b9Power system79s49Object strike
29b10Transport lifting system80s50Mechanical injury
30b11Security monitoring and communication system81s51Coal mine material loss
31s1Damage to ground facilities82s52Environmental pollution
32s2Industrial site destruction83s53Ecological pollution
33s3Fire84s54Land degradation
34s4The spontaneous combustion and collapse of the gangue mountain85s55Crop damage
35s5Destruction of surface vegetation86s56Drowning
36s6Damage to roads and bridges87s57Personnel burial
37s7Industrial site burial88s58Hypoxia asphyxia
38s8Factory destroyed89s59Shaft and tunnel damage
39s9Burial of road bridges90s60Work face shutdown
40s10River channel damage91s61Decline in shaft and tunnel stability
41s11Reservoir overflow92s62Shock wave impact
42s12Wellhead embankment collapse93s63Suffocation from poisoning
43s13Device submerged in water94s64High-pressure impact
44s14Industrial site flooding95s65High-temperature burning
45s15Road erosion damage96s66Decreased recoverable reserves
46s16Cable route damage97s67Missing persons
47s17Water pollution98c1Social impact
48s18Soil pollution99c2Casualties
49s19Mine flooding100c3Property damage
50s20Water pressure impact on the tunnel101c4Ecological destruction
51s21Tunnel collapse and blockage
Table 2. Management priority classification based on “entropy-risk”.
Exposed Element levelSecondary Hazard Path LevelManagement PriorityFeature Description
AAIHigh connectivity diversity and shortest propagation path easily trigger multi-chain reactions
ABIIHigh connectivity diversity and moderate transmission speed
BALocal hub function and rapid dissemination
BBIIIMedium connectivity and medium transmission speed
ACHigh connectivity diversity and slow conduction path
CASingle connection path but spreads quickly
BCIVLow connectivity or slow transmission
CB
CC
Table 3. Coupling types of primary hazards.
Parent NodeChild NodeParent NodeChild Node
f1 - f2 - f3b1f9 - (f6 = f7)b8
f4 = f5 = f6 = f7b3f1 - f2 - f9 - (f6 = f7)b9
f1 - f2 - f3 - (f4 = f5 = f6 = f7)b4f9 - (f4 = f5 = f6 = f7)b10
f1 - f9 - (f4 = f5 = f6 = f7)b5f1 - f2 - f9 - (f4 = f5 = f6 = f7)b11
f9 - (f5 = f6 = f7)b6e4 -- e5f9
f9 - (f6 = f7)b7
Note: “-“ indicates OR coupling, “--” indicates AND coupling, and “=” indicates CO coupling. “A-(B=C)” indicates that there is a CO coupling mechanism between B and C, while A can couple with either B or C.
Table 4. C-AIE of exposed elements.
GradingSortingNodeExposed ElementC-AIE
High entropy1b4Surface facility134.301
2b2Surrounding hydrological system60.705
Medium entropy3b3Surrounding geological system5.896
4b5Shaft and tunnel system2.199
Low entropy5b1Mining area ecosystem0.714
6b9Power system0.491
7b8Ventilation system0.485
8b6Mining system0.418
9b7Drainage system0.350
Others10b10Transport lifting system0
11b11Security monitoring and communication system0
Table 5. Node importance rankings of exposed elements under different benchmark algorithms.
Benchmark AlgorithmImportance Ranking of Exposed Elements
Out-degree Centrality (outDC)b4-b2-b5-b3-b1-b6-b7-b8-b9-b10-b11
In-degree Centrality (inDC)b4-b5-b11-b9-b6-b3-b10-b7-b8-b1-b2
Eigenvector Centrality (EC)b5-b4-b2-b3-b6-b8-b7-b9-b11-b10-b1
In-closeness Centrality (inCC)b11-b4-b5-b9-b1-b10-b3-b6-b7-b8-b2
Out-closeness Centrality (outCC)b2-b4-b1-b3-b5-b7-b6-b9-b8-b10-b11
Betweenness Centrality (BC)b4-b5-b9-b1-b6-b8-b3-b2-b7-b10-b11
Proposed method (C-AIE)b4-b2-b3-b5-b1-b9-b8-b6-b7-b10-b11
Table 6. Comparison of different entropy-based algorithms.
ReferenceMain MethodNeighbor ConsiderationDirected Network SupportWeighted Network SupportCoupling Mechanism Considered
[25]Adjacency information entropy×××
[44]Information entropy×××
[45]Local structure entropy×××
[26]Adjacency information entropy×
Proposed methodC-AIE
Disclaimer/Publisher’s Note: The statements, opinions and data contained in all publications are solely those of the individual author(s) and contributor(s) and not of MDPI and/or the editor(s). MDPI and/or the editor(s) disclaim responsibility for any injury to people or property resulting from any ideas, methods, instructions or products referred to in the content.

