Article

Influence of Particle Size on the Dynamic Non-Equilibrium Effect (DNE) of Pore Fluid in Sandy Media

1
School of Marine Sciences, Sun Yat–sen University, 135 Xin’gang Rd.W., Guangzhou 510275, China
2
Southern Marine Science and Engineering Guangdong Laboratory (Zhuhai), Zhuhai 519080, China
3
Zhejiang Zhouhuan Environmental Engineering Design Co., Ltd., Zhoushan 316000, China
*
Author to whom correspondence should be addressed.
Yuhao Ai and Zhifeng Wan are co-first authors of this article.
Water 2025, 17(14), 2115; https://doi.org/10.3390/w17142115
Submission received: 15 June 2025 / Revised: 15 July 2025 / Accepted: 15 July 2025 / Published: 16 July 2025
(This article belongs to the Section Soil and Water)

Abstract

The dynamic non-equilibrium effect (DNE) describes the non-unique character of saturation–capillary pressure relationships observed under static, steady-state, or monotonic hydrodynamic conditions. Macroscopically, the DNE manifests as variations in soil hydraulic characteristic curves arising from varying hydrodynamic testing conditions and is fundamentally governed by soil matrix particle size distribution. Changes in the DNE across porous media with discrete particle size fractions are investigated via stepwise drying experiments. Through quantification of saturation–capillary pressure hysteresis and DNE metrics, three critical signatures are identified: (1) the temporal lag between peak capillary pressure and minimum water saturation; (2) the pressure gap between transient and equilibrium states; and (3) residual water saturation. In the four experimental sets, with the finest material (Test 1), the peak capillary pressure consistently precedes the minimum water saturation by up to 60 s. Conversely, with the coarsest material (Test 4), peak capillary pressure does not consistently precede minimum saturation, with a maximum lag of only 30 s. The pressure gap between transient and equilibrium states reached 14.04 cm H2O in the finest sand, compared to only 2.65 cm H2O in the coarsest sand. Simultaneously, residual water saturation was significantly higher in the finest sand (0.364) than in the coarsest sand (0.086). The results further reveal that the intensity of the DNE scales inversely with particle size and linearly with wetting phase saturation (Sw), exhibiting systematic decay as Sw decreases. Coarse media exhibit negligible hysteresis due to suppressed capillary retention; this is in stark contrast with fine sands, in which the DNE is observed to persist in advanced drying stages. These results establish pore geometry and capillary dominance as fundamental factors controlling non-equilibrium fluid dynamics, providing a mechanistic framework for the refinement of multi-phase flow models in heterogeneous porous systems.

1. Introduction

Diamantopoulos and Durner introduced the concept of the dynamic non-equilibrium effect (hereafter referred to as the DNE), characterizing how soil hydraulic parameters exhibit flow rate-dependent behaviors during transient flow processes. This phenomenon manifests as context-specific variations in hydraulic properties, which are particularly observable under contrasting experimental scenarios involving dynamic fluid movement versus restricted-flow or quasi-equilibrium states [1]. The DNE arises from the finite relaxation time required for fluid–fluid interfaces within porous media to reconfigure and counterbalance intrinsic and applied force fields, ultimately establishing a revised static equilibrium during transitional phases where the rate of water saturation change is asymptotically null [2,3]. Current mainstream hypotheses regarding the DNE encompass hydrodynamic factors (such as porous media grain size, porosity, and flow velocity magnitude), the dynamic contact angle, the heterogeneity of porous media, kinetic effects (including actual water saturation and air pressure), and mechanisms such as water–air interface reorganization. Whether during drying or wetting processes, the dual hydraulic characterization curves—specifically, the soil water retention functional relationship and hydraulic conductivity profile—systematically demonstrate manifestations of the DNE phenomenon.
The DNE exerts a governing influence on rainfall infiltration processes in growth substrates [4]. At the subsurface scale, the DNE manifests through multiple critical processes: (1) controlling the migration and entrapment of light, non-aqueous phase liquids (LNAPLs) under transient hydrodynamic conditions [5]; (2) modulating the propagation of multi-phase fluid fronts in complex porous matrices under time-varying hydrodynamic conditions [6]; (3) driving non-equilibrium fluid behaviors in both low-permeability porous matrices and fractured systems [7,8,9,10]; and (4) governing phase interactions in supercritical gas–water flow systems [11]. Due to the presence of the DNE, traditional soil hydraulic characteristic curves determined under static/quasi-static conditions are inadequate to characterize fluid and solute transport in complex, dynamic soil environments.
The manifestation of dynamic non-equilibrium phenomena necessitates a critical re-assessment of conventional soil water retention models. Hydraulic constitutive relationships calibrated under quasi-static equilibrium regimes exhibit limited predictive capacity in modeling multi-phase hydrological processes (e.g., solute migration dynamics) across saturation-transitional scenarios [12,13]. This theoretical limitation has motivated advanced computational approaches; for example, in their pioneering work, Hassanizadeh et al. established that interfacial momentum relaxation mechanisms constitute non-negligible factors in field-scale vadose zone dynamics and thereby proposed the integration of a relaxation parameter (τ) within contemporary modeling frameworks to explicitly resolve capillary pressure hysteresis through momentum transfer kinetics across fluid interfaces [3]. A novel soil hydraulic property relationship has been established through the incorporation of the DNE term into traditional hydraulic property equations, which can more scientifically characterize complex scenarios involving pore-scale variations or dynamically changing hydrodynamic and boundary conditions. This approach has demonstrated promising results in terms of the simulation of complex media and flow regimes [14,15,16,17,18,19]. Therefore, introducing the concept of the DNE holds significant implications for investigating groundwater and contaminant transport processes in regions with complex hydrodynamic conditions, such as coastal regions and intertidal zones. For more detailed summaries of the influential factors governing the dynamic capillary effect—including their underlying mechanisms and the trends associated with each factor—the readers are referred to the comprehensive review by Chen et al. [20]. At the macroscopic scale, the DNE manifests as the non-uniqueness of the soil–water retention curve. This phenomenon arises from complex interactions involving (1) surface roughness heterogeneity [21], (2) fluid–solid wettability variations [9], (3) the shrink–swell dynamics of pore structures [22], (4) hydrodynamic fluctuations, (5) boundary condition responses, (6) particle size distribution effects, (7) pore fluid interactions, and (8) fluid–solid interfacial dynamics determined during experimental testing [20]. The occurrence of the DNE is associated with the soil properties (such as moisture content, particle size, and pore fluid type), observation scale, sampling location, and hydrodynamic conditions. Studies have shown that factors such as soil particle hydrophobicity (water repellency), the injection height in column experiments, and the capillary number also influence the occurrence of the DNE with respect to pore fluid [23,24]. Consequently, multiple interdependent variables collectively modulate the pairwise functional relationships between hydraulic conductivity, water content, and capillary pressure, thereby governing both the emergence and intensity of DNE phenomena.
Column studies on the DNE have predominantly utilized sand matrices with graded particle sizes. Clay-based systems (e.g., clay loam columns) are seldom implemented due to two constraints: (1) hydraulic hysteresis from cyclic swelling/shrinkage during moisture fluctuations, and (2) low permeability extending experimental durations to impractical timescales [25,26]. Standard experimental designs involve water flux monitoring through porous media under steady/unsteady flow regimes or evaporative scenarios, commonly using single- or multi-step outflow protocols [27,28]. Empirical investigations of the DNE have been exclusively confined to laboratory-scale studies, as emphasized by Diamantopoulos and Durner. Innovative instrumentation has been developed to probe capillary dynamics in porous media exhibiting permeability heterogeneity and consolidation-dependent characteristics [29,30]. These studies have systematically explored the influences of key parameters—including chemical additives, capillary number, fracture characteristics, and fluid viscosity—on this phenomenon [31]. Research efforts have predominantly concentrated on sandy substrates under tightly regulated flow conditions characterized by monotonic boundary variations and restricted spatial–temporal scopes. Recent studies have demonstrated that the DNE can retroactively influence experimental testing outcomes [32], thereby introducing additional complexities to research focused on the DNE. These methodological constraints have hindered a comprehensive understanding of the impacts of the DNE on hydrological processes across operationally relevant timeframes and spatial domains.
Recent methodological advances have significantly enhanced investigations on the formation mechanisms and quantitative impacts of the DNE. Standnes et al. [33] systematically generalized the dynamic capillary pressure concept through total chemical potential analysis, establishing a unified governing equation for two-phase flows in porous media. Yan et al. [34] employed lattice Boltzmann simulations to characterize two-phase displacement patterns in 2D porous media under diverse pressure boundary conditions. Konangi et al. [35] performed multi-scale numerical analyses contrasting the evolution of capillary pressure between pore-resolved and continuum-scale frameworks during drainage under varying flow velocities. Complementary approaches using pore network modeling have been extensively adopted to simulate two-phase flows across temporal scales [36,37,38,39,40]. These methodological innovations have collectively improved the resolution and efficiency of DNE-related investigations.
Among the multitude of influencing factors, particle size has been demonstrated to have a pronounced impact on the DNE. Nikooee et al. contended that the pore size and particle size distributions in porous media also significantly influence the manifestation of the DNE [41]. Hassanizadeh et al. demonstrated that a pronounced DNE exclusively emerged in porous media with favorable permeability conditions [3]. Camps-Roach et al. further established that the intensity of the DNE exhibits dependence on the mean particle size in porous media, with finer-textured soils demonstrating greater DNE magnitudes compared to their coarser counterparts, in a manner independent of specimen dimensions [42]. Moreover, the microchannel DNE primarily originates from transient interfacial pressure gradients inducing flow stagnation between inlet–outlet boundaries [43]. Therefore, quantitative investigations of the impacts of particle size on the DNE in certain media have significant implications for the analysis of the limitations of traditional hydraulic characterization methods and the enhancement of predictive models for porous media flow systems.
Research on flow dynamics and fluid–solid relationships has advanced the characterization of the DNE through the use of modified water content–capillary pressure functions, thus enhancing traditional models [44,45]. Initial definitions of the DNE involved the following: (1) water content differences during drainage processes under fixed potentials/durations, and (2) capillary pressure variations between dynamic and static drainage under equivalent water contents [46]. Extended descriptions encompass (i) water content contrasts between multi-step and rapid drainage rates, and (ii) capillary pressure deviations from static conditions proportional to pressure head temporal gradients (∂ψ/∂t [LT−1]) at constant water content [47]. Hassanizadeh and Gray pioneered a theoretical framework, proposing τ (non-equilibrium capillarity coefficient) as the pivotal parameter for the quantitative characterization of the magnitude of the DNE, which is defined as the equilibration rate of two-phase fluids within porous matrices [48]. The non-equilibrium capillarity coefficient τ is calculated as follows:
P d y n c P s t a t c = τ
where Sw = water saturation [-], P d y n c = dynamic capillary pressure [cm H2O], and P s t a t c = static capillary pressure [cm H2O].
This coefficient has been extensively adopted in contemporary pore–fluid DNE investigations across multi-phase flow systems. Our previous analysis revealed no statistically significant relationship between extreme values (i.e., maximum/minimum) of τ and peak DNE manifestations during drainage events. Notably, τ demonstrates robust efficacy in quantifying the DNE under smooth drainage regimes [49]. The dynamic non-equilibrium fundamentally characterizes the non-uniqueness of hydraulic characteristics under varying flow regimes and media textures [1]. Its manifestations in drainage systems include capillary pressure maxima (PMAX)–water saturation minima (SMIN) decoupling, pressure disequilibria, saturation rate dependencies, and other phenomena. Despite Hassanizadeh and Gray’s model (Equation (1)) proposing the relationship ΔP (the pressure gap between transient and equilibrium states) ∝ ∂S/∂t under τ-calibration, these propositions persist as theoretical subjects of debate and remain empirically unverified, particularly across heterogeneous media. Therefore, it is a highly meaningful task to derive specialized parameters from experiments to characterize the DNE.
The objectives of this present study are as follows: (1) to perform stepwise drying experiments on granular media with distinct particle sizes; and (2) to quantify the evolution of saturation and capillary pressure, evaluate the DNE during each drying phase, select optimal parameters, and assess the correlation between particle size and the DNE.

2. Materials and Methods

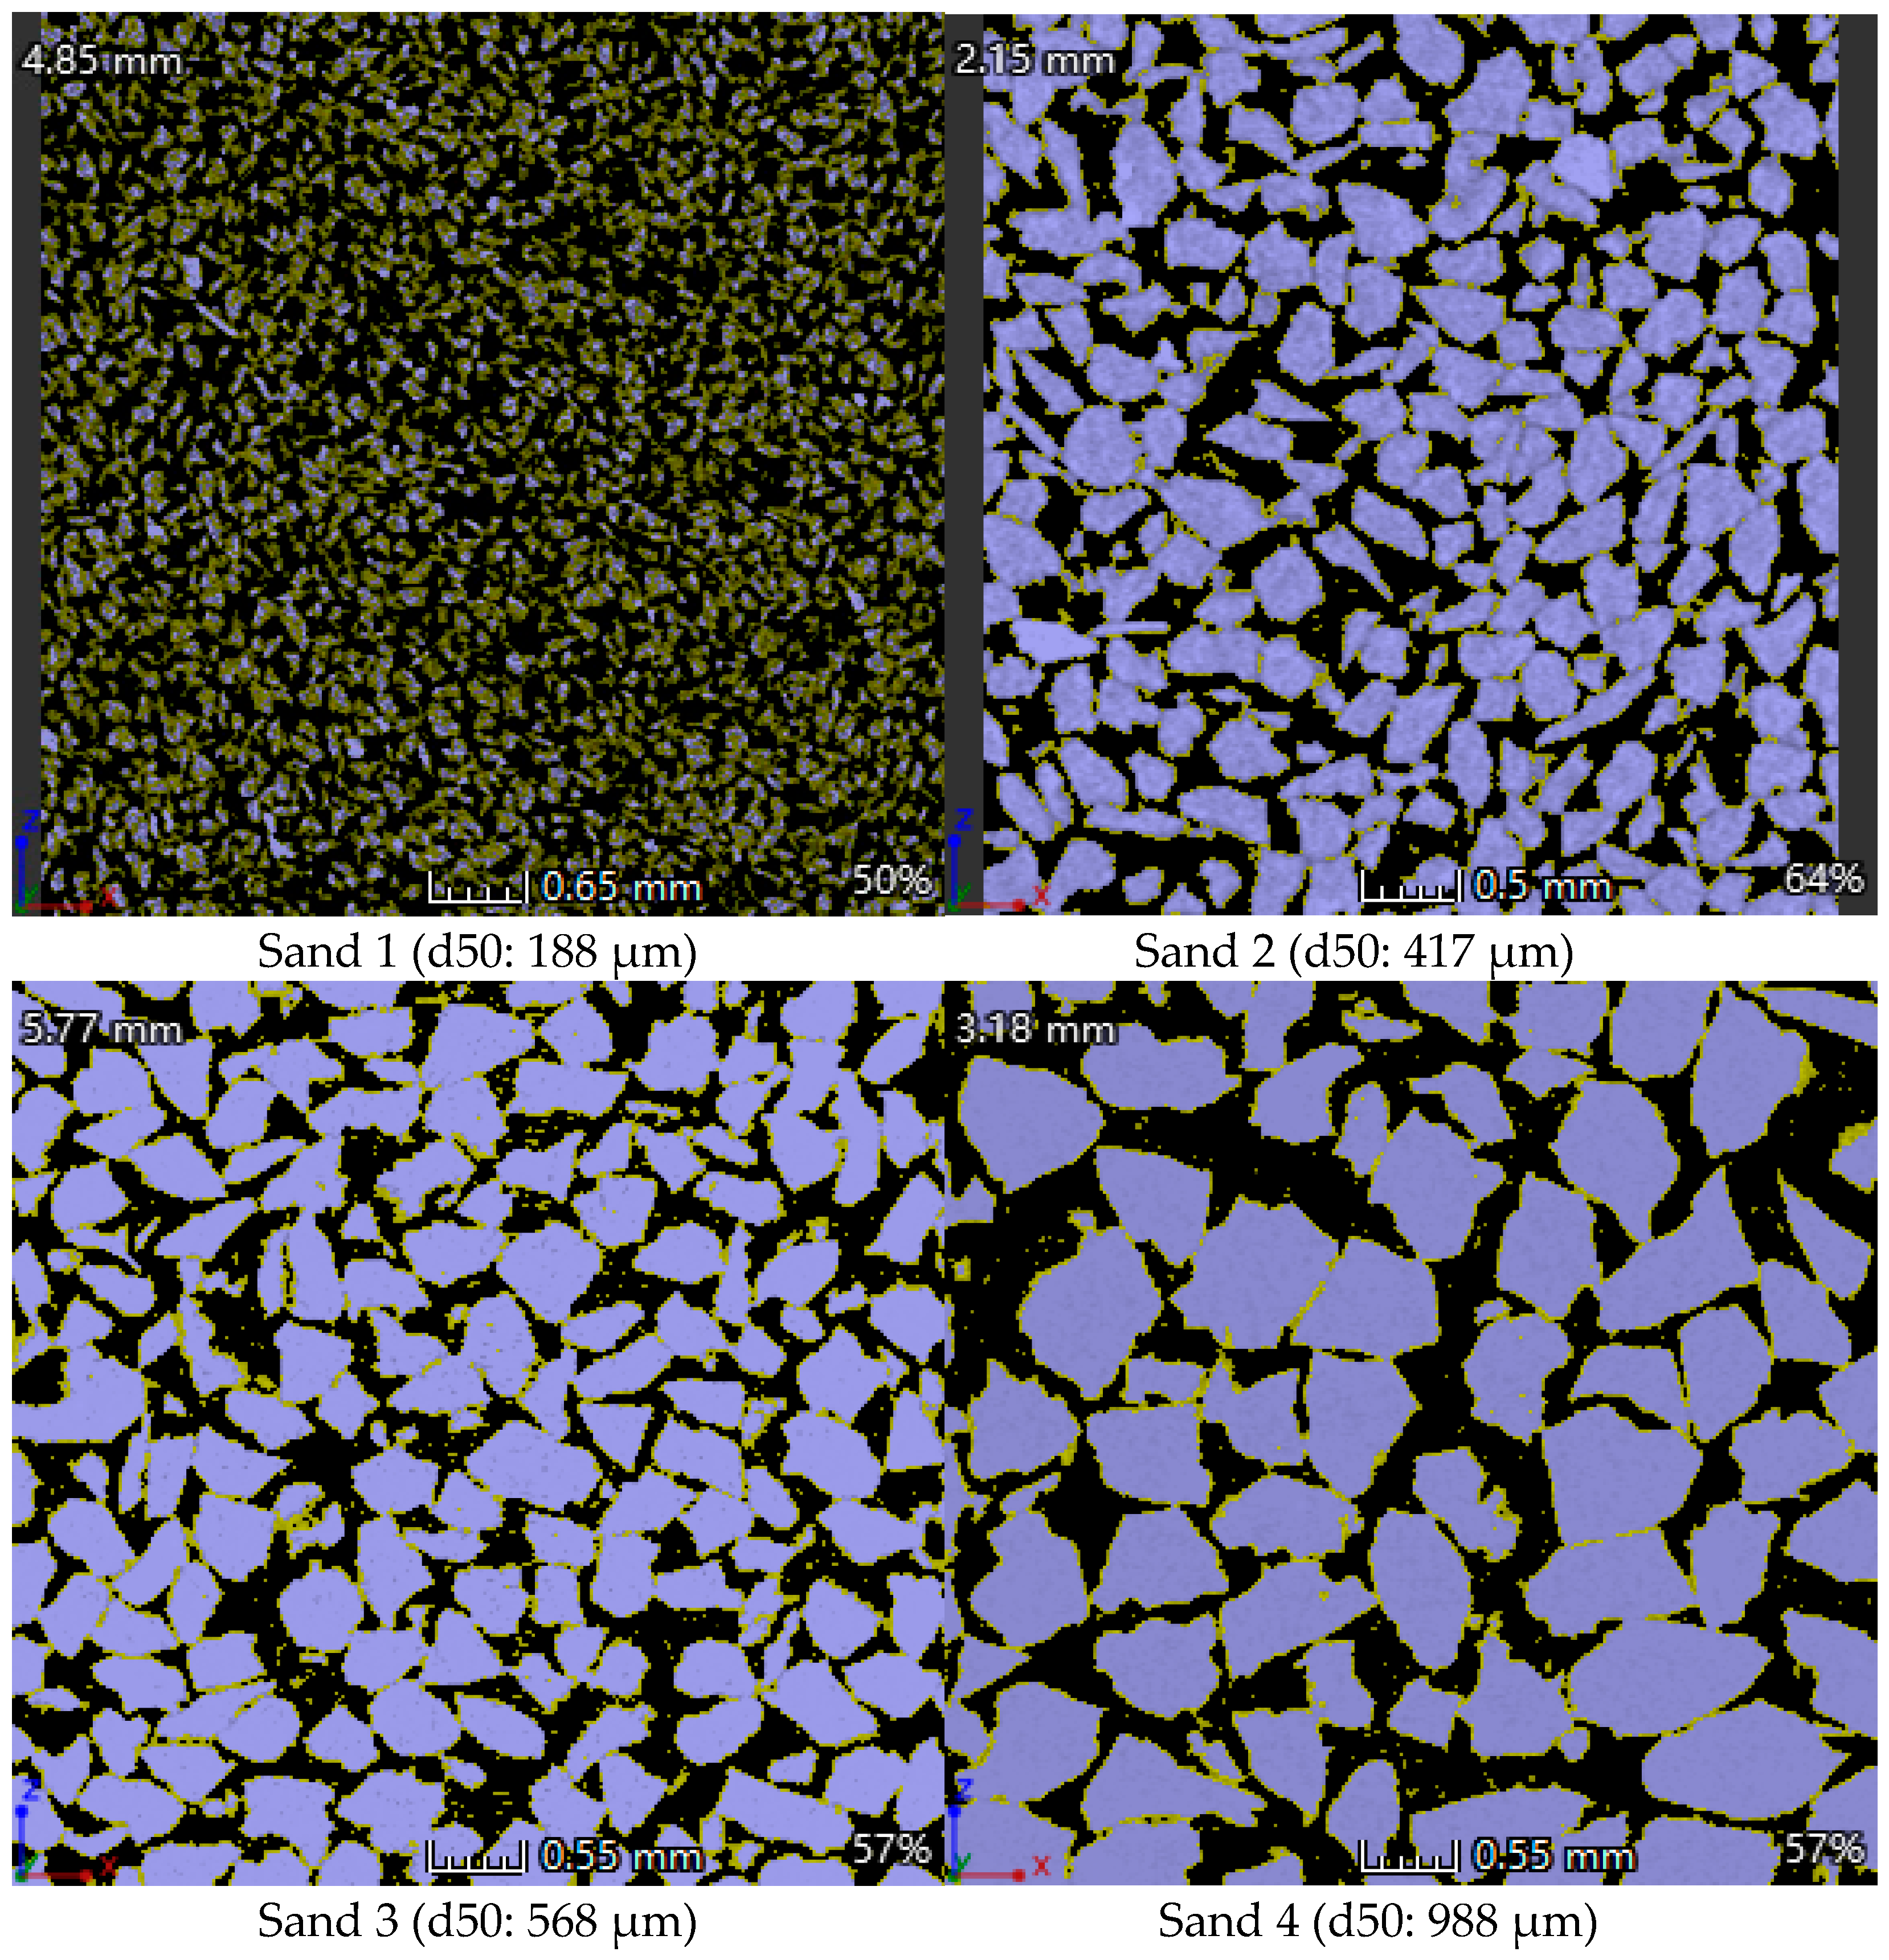
2.1. Sample Preparation

Natural well-graded river sand obtained from the lower reach of the Pearl River, China, was used as the porous medium for the column tests. Prior to testing, clay powders were removed by washing and drying the sand sample to minimize any uncertainty in the characterization of hydraulic properties. The predominant phase in the sand is quartz, which exhibits well-developed crystallinity. These quartz sands were classified into four granulometric cohorts to establish a controlled particle size gradient. Figure 1 displays the particle size distributions of the sand samples, while Table 1 presents the average particle sizes, uniformity coefficients, and densities. Sand 1, Sand 2, Sand 3, and Sand 4 correspond to Test 1, Test 2, Test 3, and Test 4, respectively. Among the four samples, Sand 1 exhibited the finest particle size, whereas Sand 4 displayed the coarsest particle size. All samples were characterized by a high degree of uniformity.

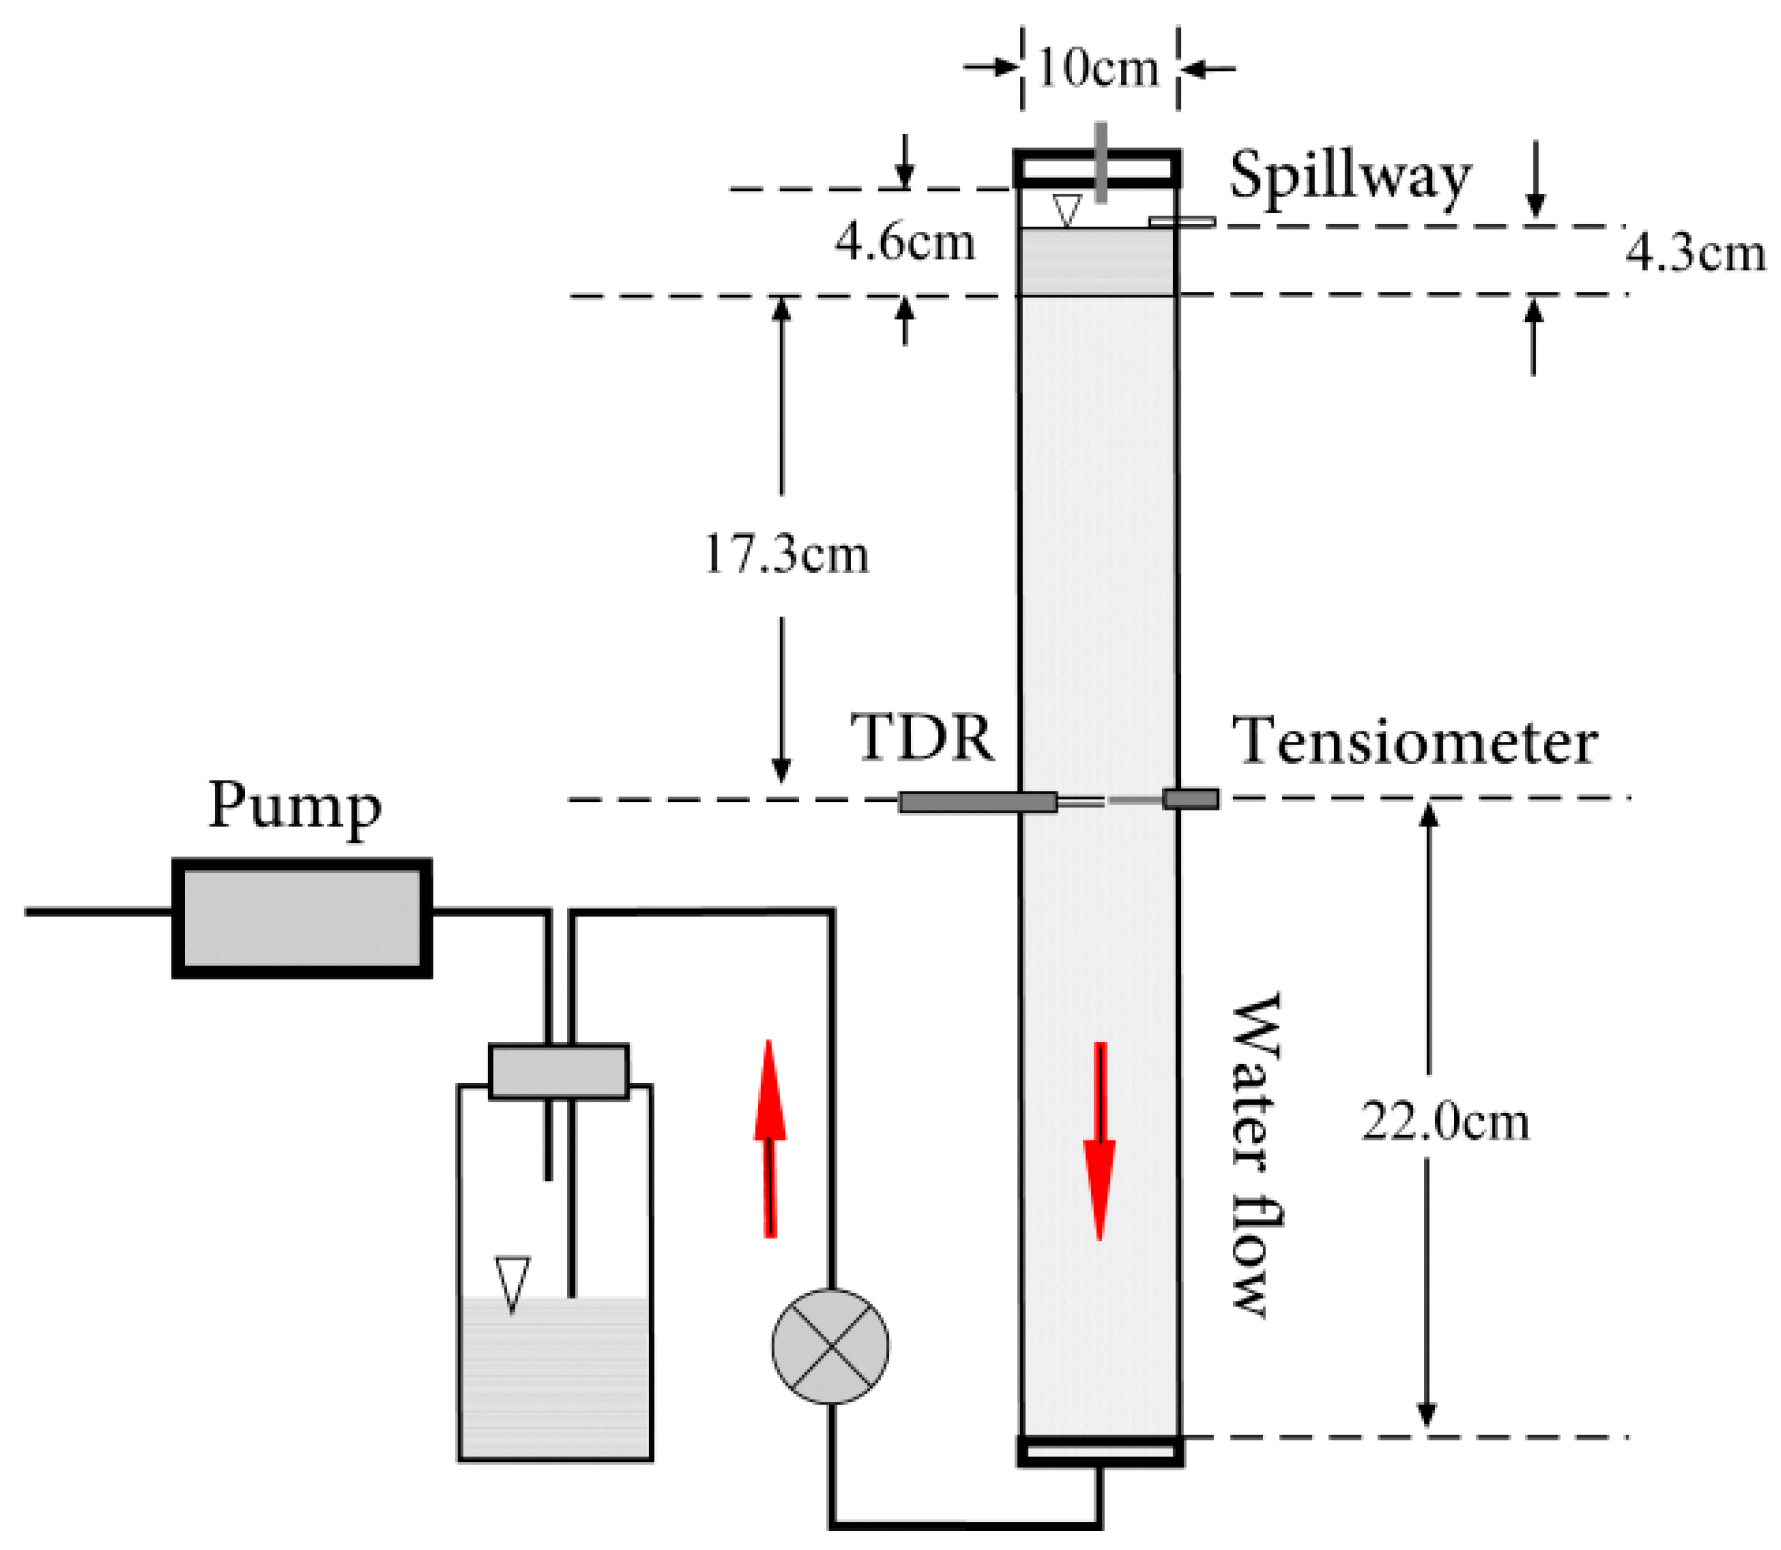
2.2. Experimental Apparatus

In the experimental setup (Figure 2), 44 cm length × 10 cm ID polymethyl methacrylate (PMMA) columns were employed for drainage analysis. The sand was introduced into the column using the following procedure in order to achieve near-full water saturation (~100%). De-aerated water was first incrementally injected into each column from the bottom. Uniform sand layers were incrementally placed via top-mounted funnel systems while maintaining a minimum 5.0 cm water table above the sediment interface. Compaction was systematically achieved through controlled percussion using rubber mallets along the column exterior. A drainage weir positioned 0.4 cm below the column rim facilitated controlled water removal. Post-assembly, a 15-day stabilization period allowed for gravitational consolidation, enhanced sediment packing, and pore network equilibration beyond the initial depositional state.
This experimental configuration (Figure 2) established a controlled atmospheric boundary at the upper interface while maintaining regulated multi-phase connectivity at the lower phase transition zone. Prior to testing, the sand column was fully water-saturated with the initial water table positioned 43.6 cm above the base (21.6 cm above TDR/T5 sensor planes) and 4.3 cm above the sand surface. The upper boundary remained atmospherically open through a 1.5 mm ID capillary tube, while the lower boundary—initially hydraulically sealed by valve closure—was connected to a peristaltic pump via 4.8 mm ID flexible tubing during experimental runs.
Experimental sequences initiated slow bottom-boundary drainage upon valve opening, commencing the drying process. Valve closure occurred when TDR signals detected target saturation levels, terminating each drying step. This drainage-termination cycle was iterated through subsequent stages as the progressive water table decline advanced, culminating in all sand media transitioning to unsaturated conditions, with water saturation converging toward residual levels. At the final drainage stage, the bottom valve was vented to the atmosphere.
The pump precisely controlled pore water flow velocities during experimental sequences. Hydraulic parameters were monitored through real-time measurement techniques [49]. In particular, each experimental column was instrumented with paired hydraulic monitoring systems: a T5 hydraulic potential sensor (Delta-T Devices Ltd., Cambridge, UK) for matric potential quantification and a Trime-IT dielectric permittivity sensor (IMKO Micromodultechnik GmbH, Ettlingen, Germany) for volumetric water content determination via time-domain reflectometry, positioned diametrically 22.0 cm above the base to simultaneously track capillary pressure and water saturation. Instrument response times were characterized as approximately 0.01 s for pore water pressure stabilization and 2–3 s for water content signal equilibration. A temperature-compensated monitoring system recorded tensiometric data at 5 s intervals and TDR measurements every 15 s using a CR1000 data logger (Campbell Scientific Inc., Logan, UT, USA). This instrumentation framework achieved high-temporal-resolution synchronization of saturation–pressure dynamics during controlled drainage processes.

2.3. Calibration of TDR and T5 Tensiometer Probes

Prior to the column experiments described in this study, the calibration of the TDR and T5 tensiometric probes was performed according to methodologies established by Li et al. [50]. To determine the relationship between water saturation and corresponding signals from the TDR probe before the column tests reported here, a calibration column containing identical sand was prepared following the aforementioned methodology to establish TDR signal–water saturation correlations. This column underwent controlled drainage via rotary pump extraction of pore water until hydraulic equilibrium (effluent cessation) occurred. Upon stabilization, data logger-recorded TDR signals were captured. A sand specimen adjacent to the probe was then extracted for oven-drying gravimetric analysis. The final 20 stable signal measurements were averaged to represent the measured saturation state. Iterative testing with adjusted suction levels and drainage periods allowed for the generation of multiple saturation conditions, enabling systematic correlation of TDR responses with quantified water contents across the operational range.
The T5 tensiometers were calibrated by progressively filling an empty column with de-aerated water while measuring hydrostatic pressures at multiple elevations. Signals from the T5 tensiometer were recorded when the water level moved at 0.01 m·s−1, much faster than the water flow velocity (10−6–10−5 m·s−1) in the sand medium. At each height, over 20 stable signal recordings were averaged to determine the pre-defined water pressure values. Further, the capillary pressure was defined as the negative magnitude of tensiometric pore water pressure readings in our tests. Therefore, pressure head computations revealed phase-dependent capillary pressure polarity, with positive values characterizing unsaturated media and negative magnitudes indicating saturation conditions.
Both TDR and T5 exhibited linear calibration curves. The calibration equations are S = aX + b for TDR and P = cY + d for T5, where S and P represent the water saturation and capillary pressure of TDR and T5, respectively, while X and Y represent the electrical signal readings of TDR and T5, respectively. The values of the coefficients a, b, c, and d are provided in Table 2. The parameters with subscripts 1, 2, 3, and 4 correspond to Test 1, Test 2, Test 3, and Test 4, respectively.
To ensure the integrity of measurements, TDR and tensiometric sensors were calibrated before and after experiments under hydrostatic equilibrium conditions. This allowed for the quantitative baseline assessment of instrument accuracy and the monitoring of signal drift during prolonged testing. Following each column test, sand surrounding the TDR probe was sampled for gravimetric water content analysis. When the sand was relatively wet, controlled drainage preceded sampling to facilitate the process. The T5 tensiometers were recalibrated after each test. After 120-day monitoring cycles, the TDR instrumentation exhibited maximal deviations below 4.1% across full saturation gradients (0–100%). Correspondingly, the high-precision T5 tensiometric sensors demonstrated peak deviations less than 0.16 cm H2O within their operational pressure bounds (−25 cm to 100 cm H2O). Observed metrological shifts were attributed to dual causative mechanisms: (1) ambient thermal fluctuations during experimental phases, and (2) intrinsic sensor material hysteresis. Both the TDR and T5 datasets maintained acceptable stability thresholds throughout the experimental protocol.
Operational performance metrics, including the impacts of hydraulic velocity on measurement fidelity, temporal accuracy fluctuations, and sustained signal deviations during extended column trials, were quantitatively assessed [49]. All these influences were found to exert a minimal influence on the experimental results.

2.4. Multi-Step Drainage Processes

Four distinct experimental frameworks (Test 1, Test 2, Test 3, and Test 4) were implemented through controlled multi-phase drainage protocols governed by pre-defined hydrodynamic flux specifications. Tests 1 (d50: 188 μm) and 2 (d50: 417 μm) utilized stratified matrices of finer-grained sand particulates, while Tests 3 (d50: 568) and 4 (d50: 988 μm) incorporated coarser granulometric configurations to establish engineered textural disparity. Following rigorous verification of columnar system stabilization, a sequential desaturation regimen was activated. A peristaltic pump facilitated precisely regulated fluid extraction (at 6 mL/min) from the acrylic column’s basal drainage nexus, which was sustained until pre-defined saturation termination benchmarks were achieved. The saturated hydraulic conductivities of these four sands were all ~5.20 × 10⁻² cm/s.
The sequence of drainage advanced through systematically descending hydraulic potential gradients during operational phases, each followed by interphase stabilization periods (>15 d) maintained through outflow valve deactivation. Post-drainage equilibrium monitoring involved continuous logging of saturation coefficients and matric potential metrics until thermodynamic stability was reconfirmed, followed by subsequent desaturation phase reactivation under identical hydrodynamic constraints. Transient phase behaviors were characterized through high-frequency temporal mapping of saturation–matric potential synergies, with quasi-equilibrium validation performed via terminal-phase parametric assessments post-stabilization. Hydrodynamic flux profiles were algorithmically computed from time-coded volumetric discharge datasets. Four parallel experiments were conducted, with two (Tests 1 and 4) visually mapped in Figure 3. These mappings depict full temporal saturation–pressure interdependencies. Each experimental configuration comprised six discrete drainage cycles.
Upon reaching hydraulic limitation via vacuum-assisted drainage during the desaturation phase, the immobile pore water fraction retained within the granular matrix was operationally classified as residual saturation. Following this procedure, a secondary desaturation protocol was implemented using a micro-vacuum extraction system, allowing for enhanced measurement precision regarding the residual aqueous phase saturation within the acrylic containment vessel. Active vacuum extraction persisted until the achievement of terminal equilibrium was verified, as determined through the stabilization of both gravimetric and tensiometric parameters.

3. Results and Discussion

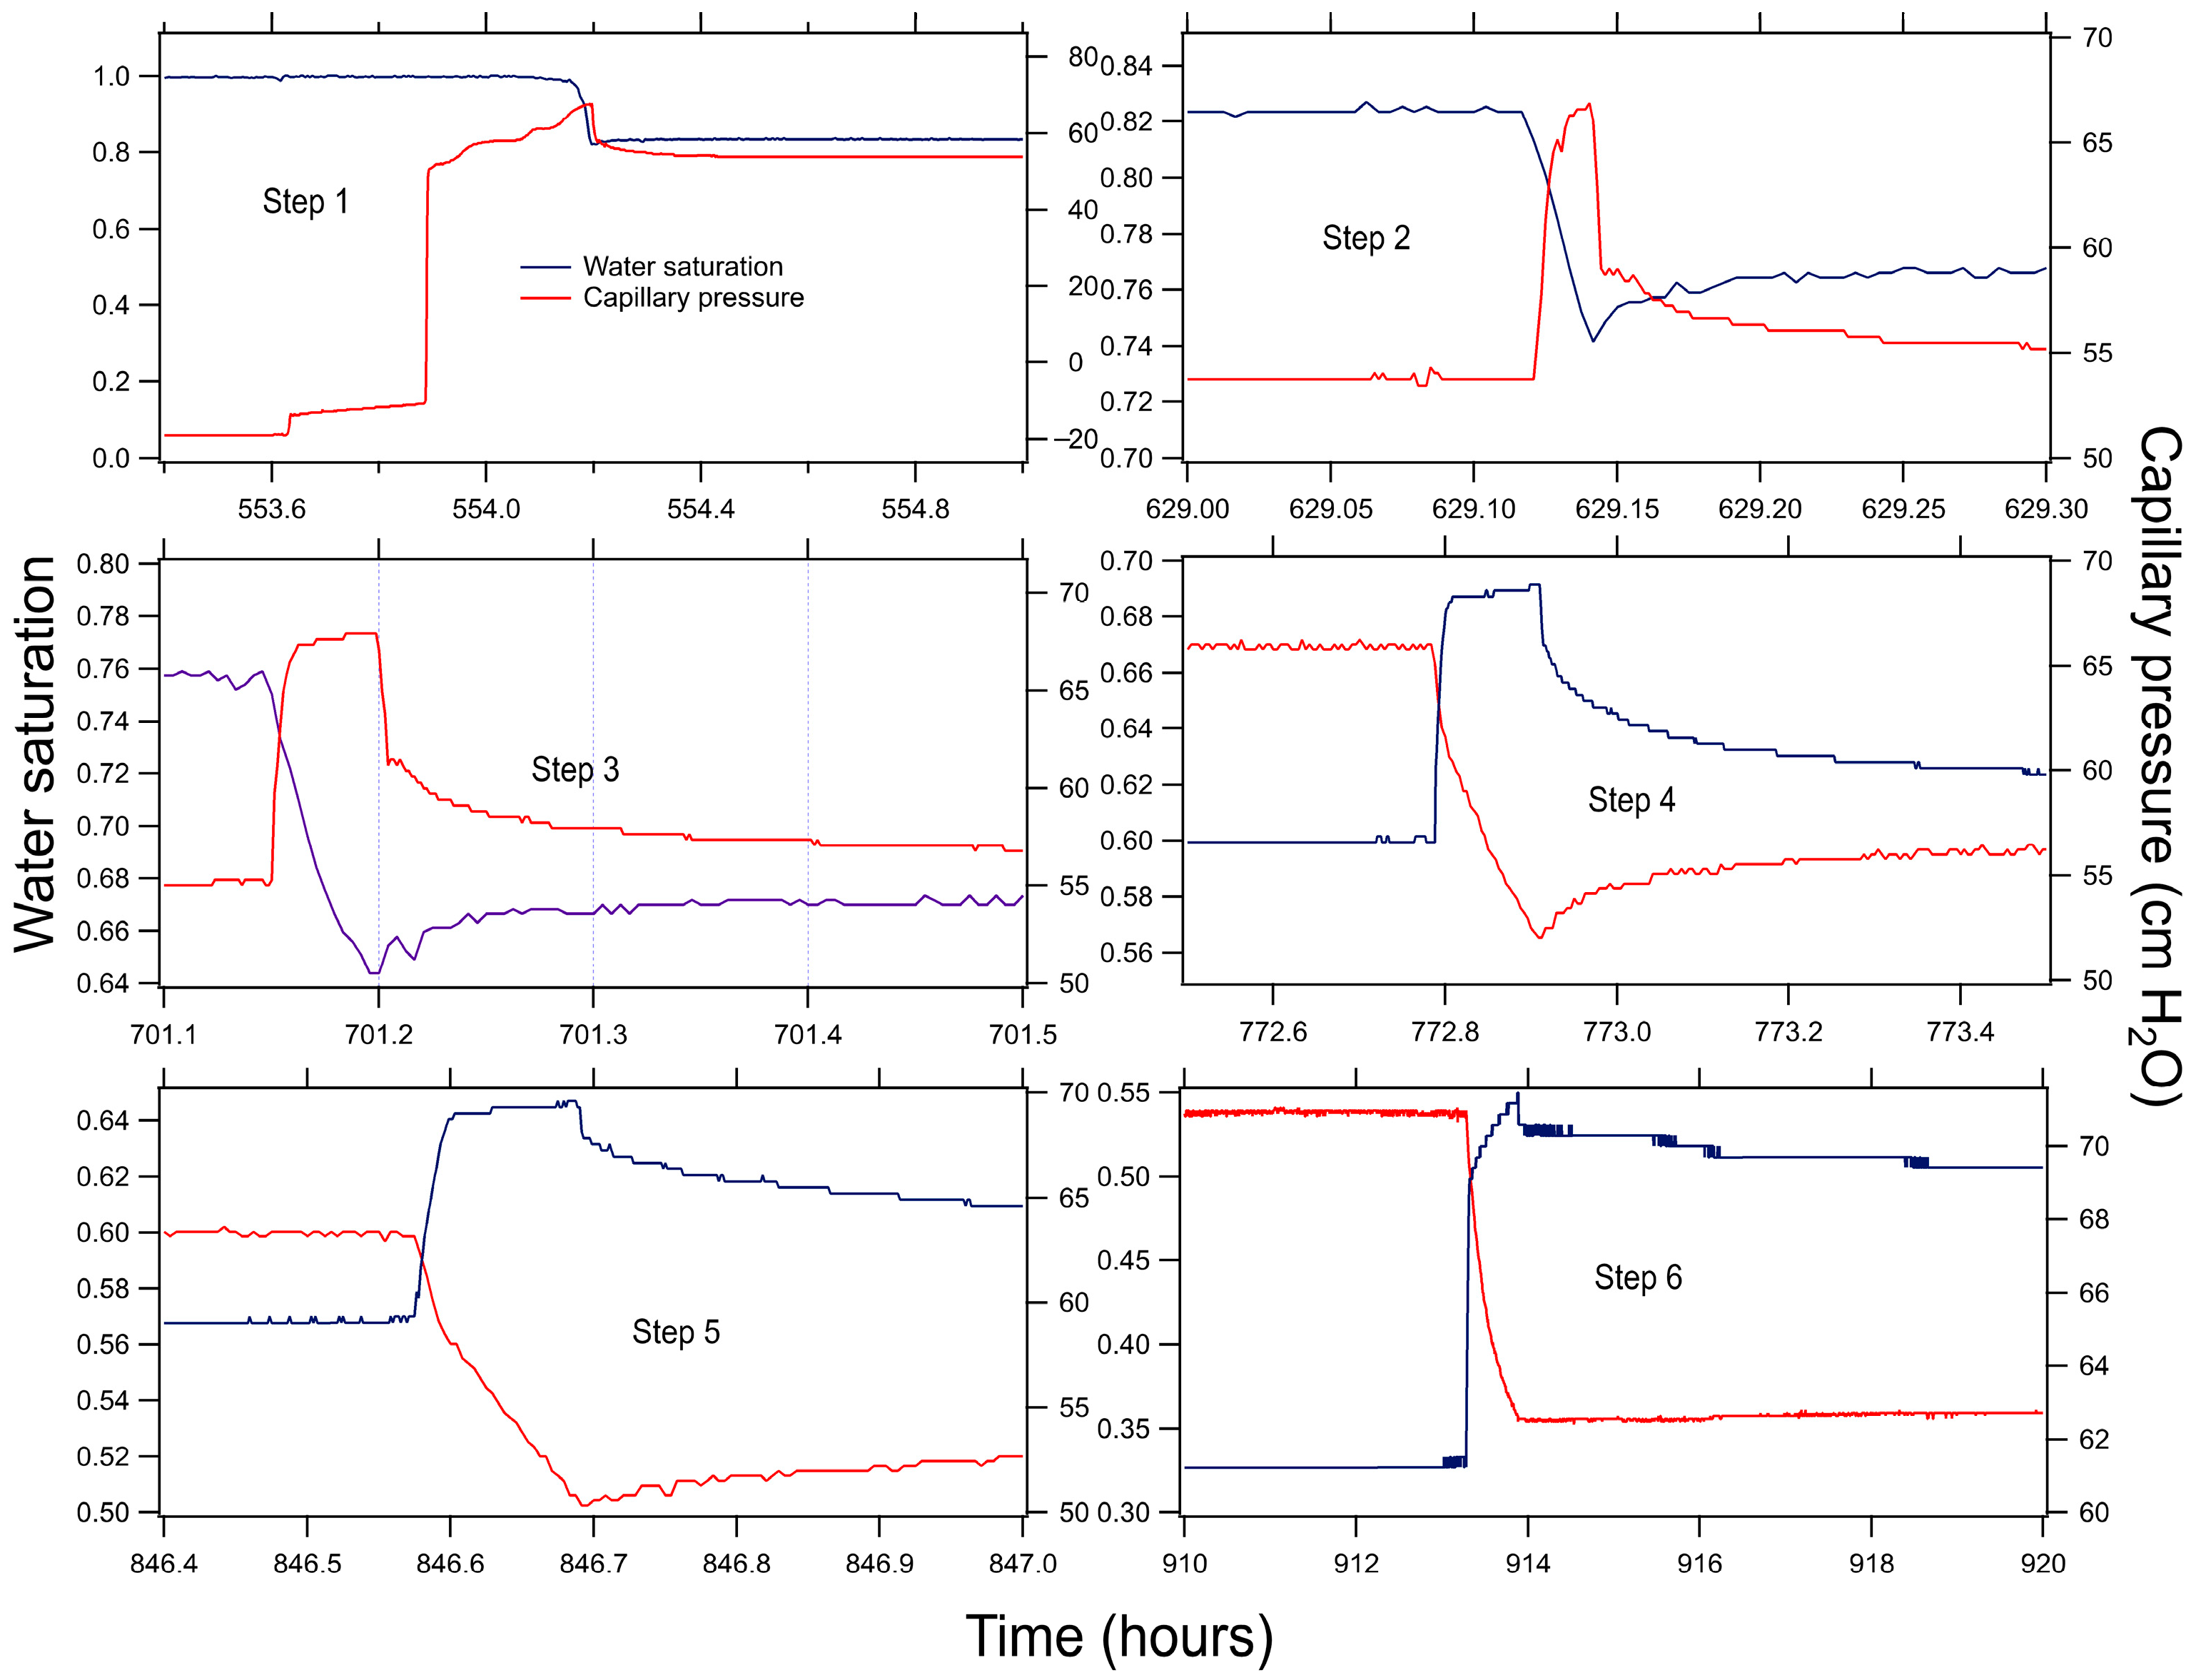
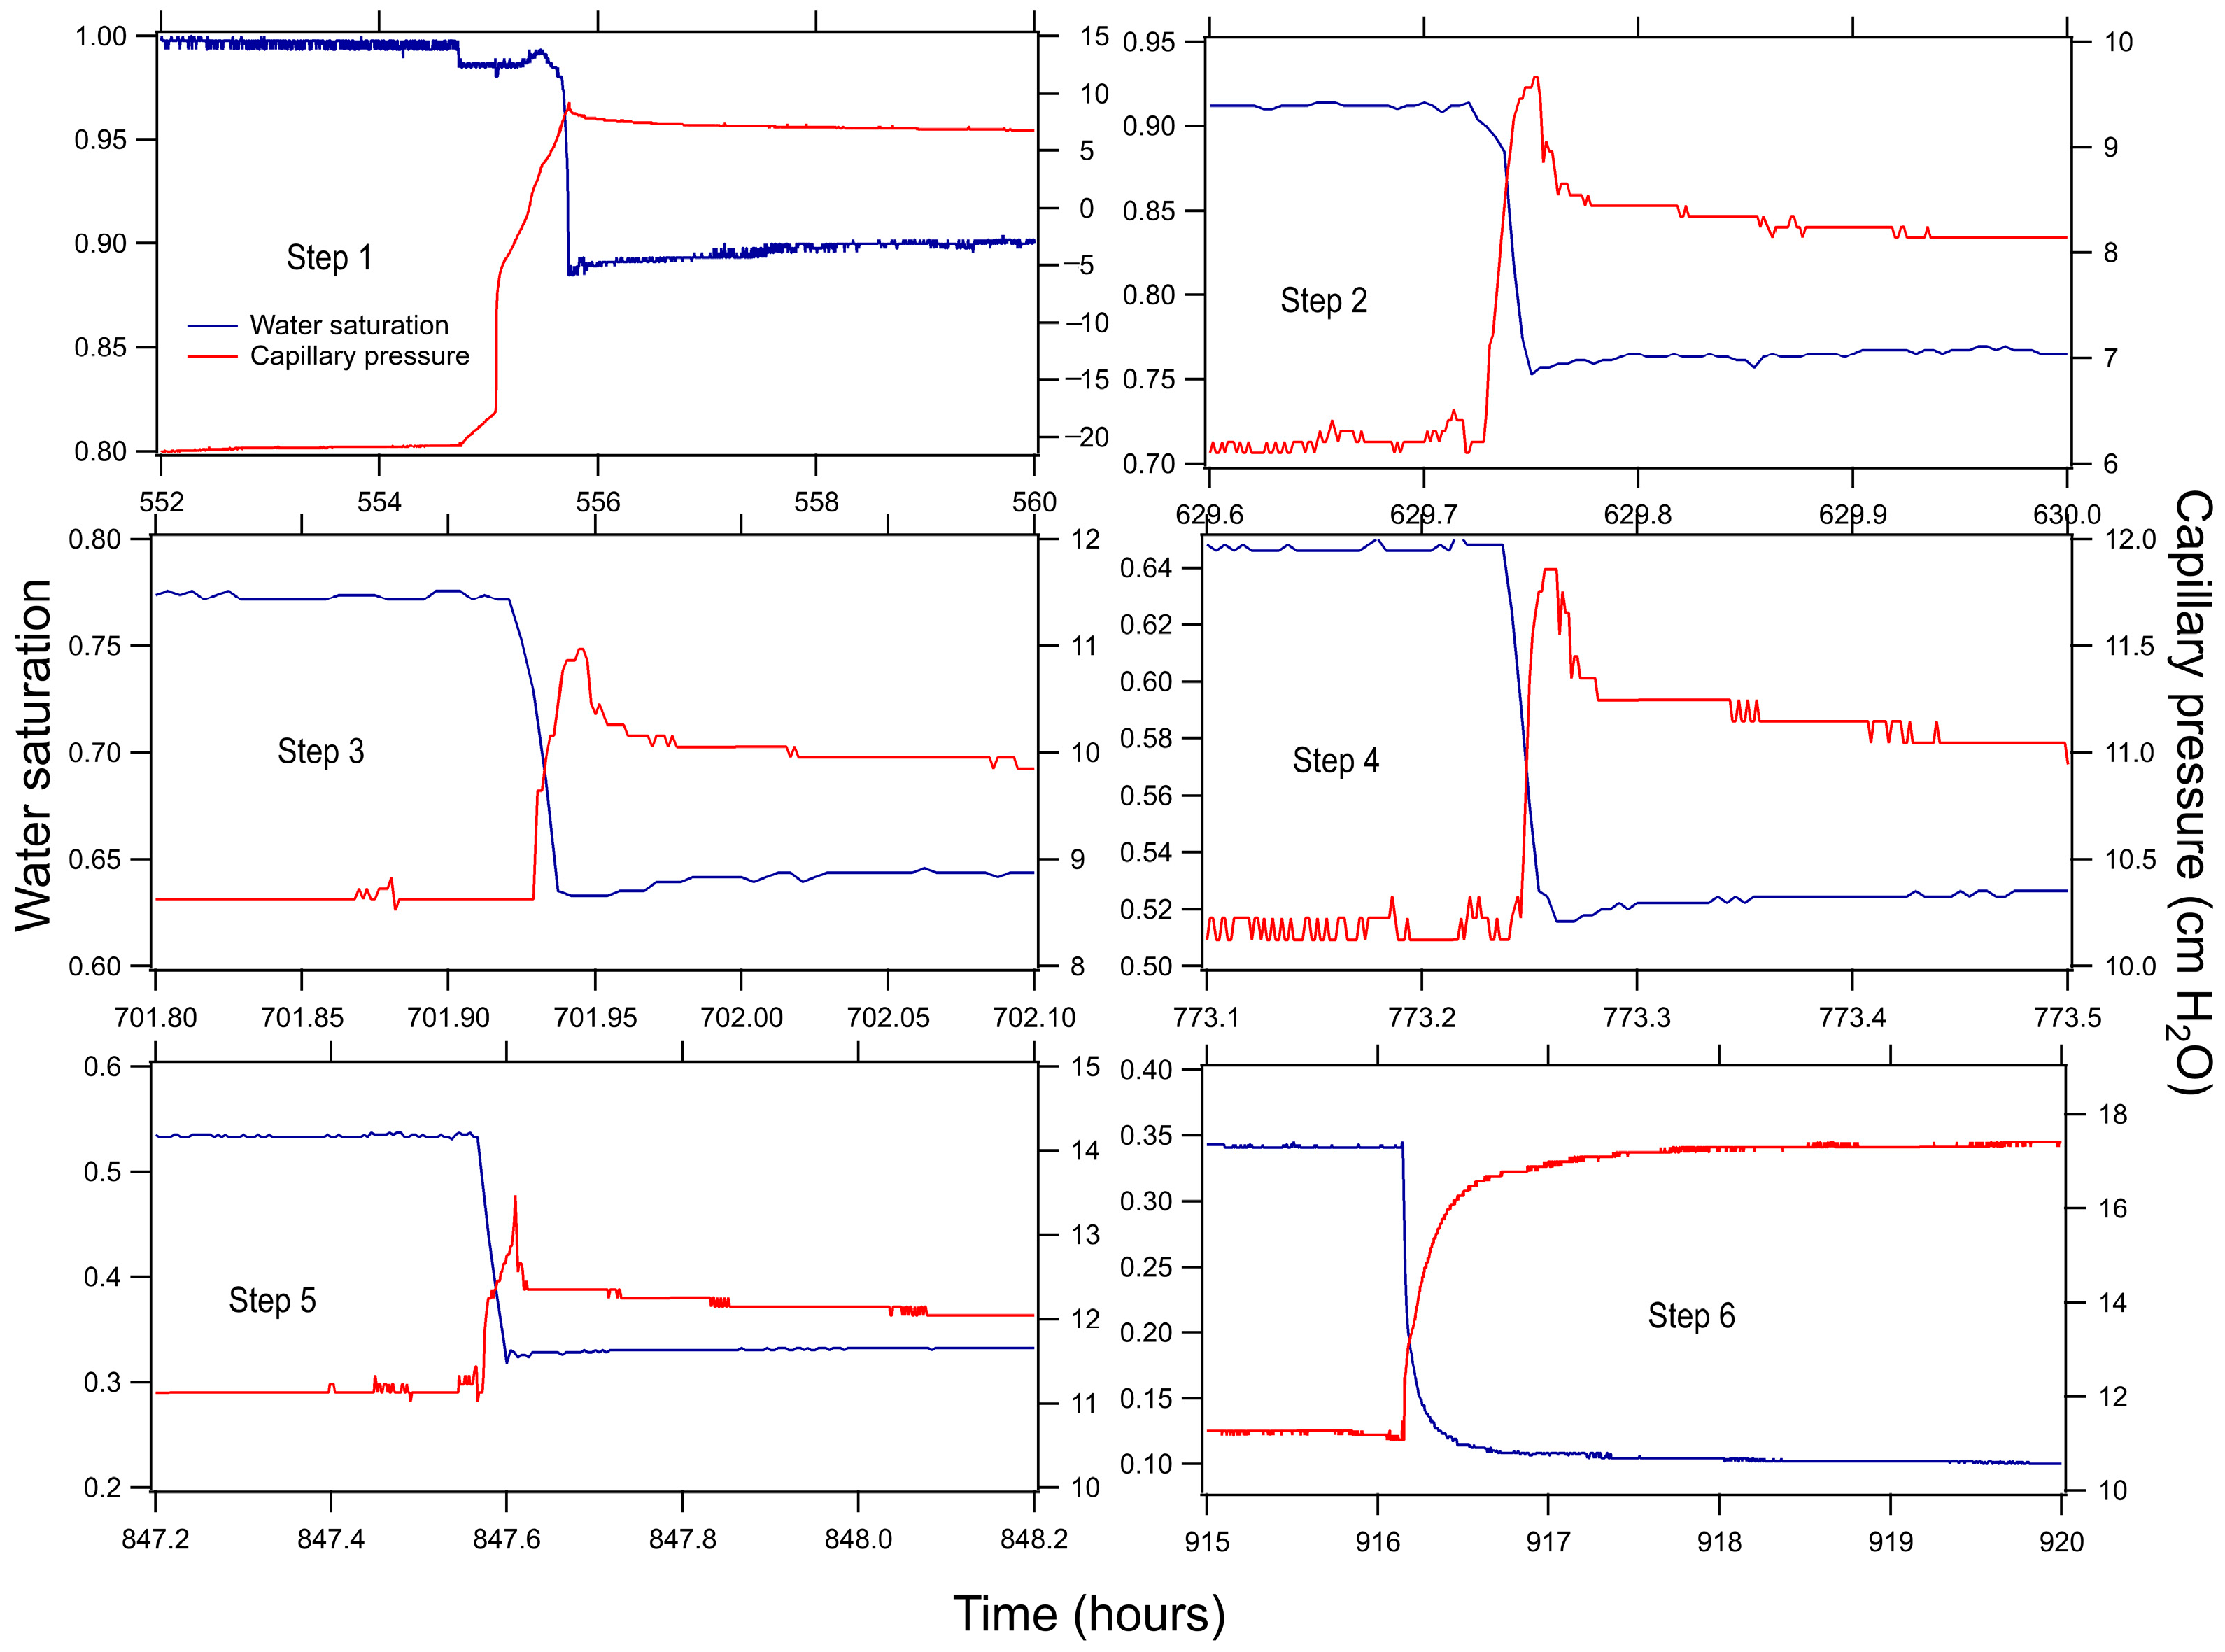
3.1. Temporal Evolution of Hydraulic Saturation and Capillary Pressure

A total of four parallel experiments were conducted. For clarity, two representative cases (Tests 1 and 4) were specifically selected to illustrate the hydraulic parameter variations across six drainage cycles, as shown in Figure 4 and Figure 5. During each drainage cycle, the hydraulic pressure exhibited a rapid surge upon valve actuation initiation, followed by progressive attenuation from peak magnitudes to equilibrium levels coinciding with flow termination. After capillary pressure escalation, saturation states demonstrated transient reductions persisting for seconds following the maximum observed pressure before stabilizing at minimal values. Notably, saturation minima exhibited temporal delays of seconds relative to capillary pressure peaks, highlighting dynamic phase hysteresis that contravenes conventional saturation–pressure (S-p) constitutive models. As such, temporal decoupling between pressure extrema and saturation minima is clearly observable. Subsequent to flow cessation, the capillary potential decays to static equilibrium values, confirming measurable pressure differentials between transient and steady-state conditions. These findings quantify two critical disparities: (1) phase-shifted timing between hydraulic maxima and saturation minima, and (2) state-dependent capillary potential variances under static versus dynamic regimes.

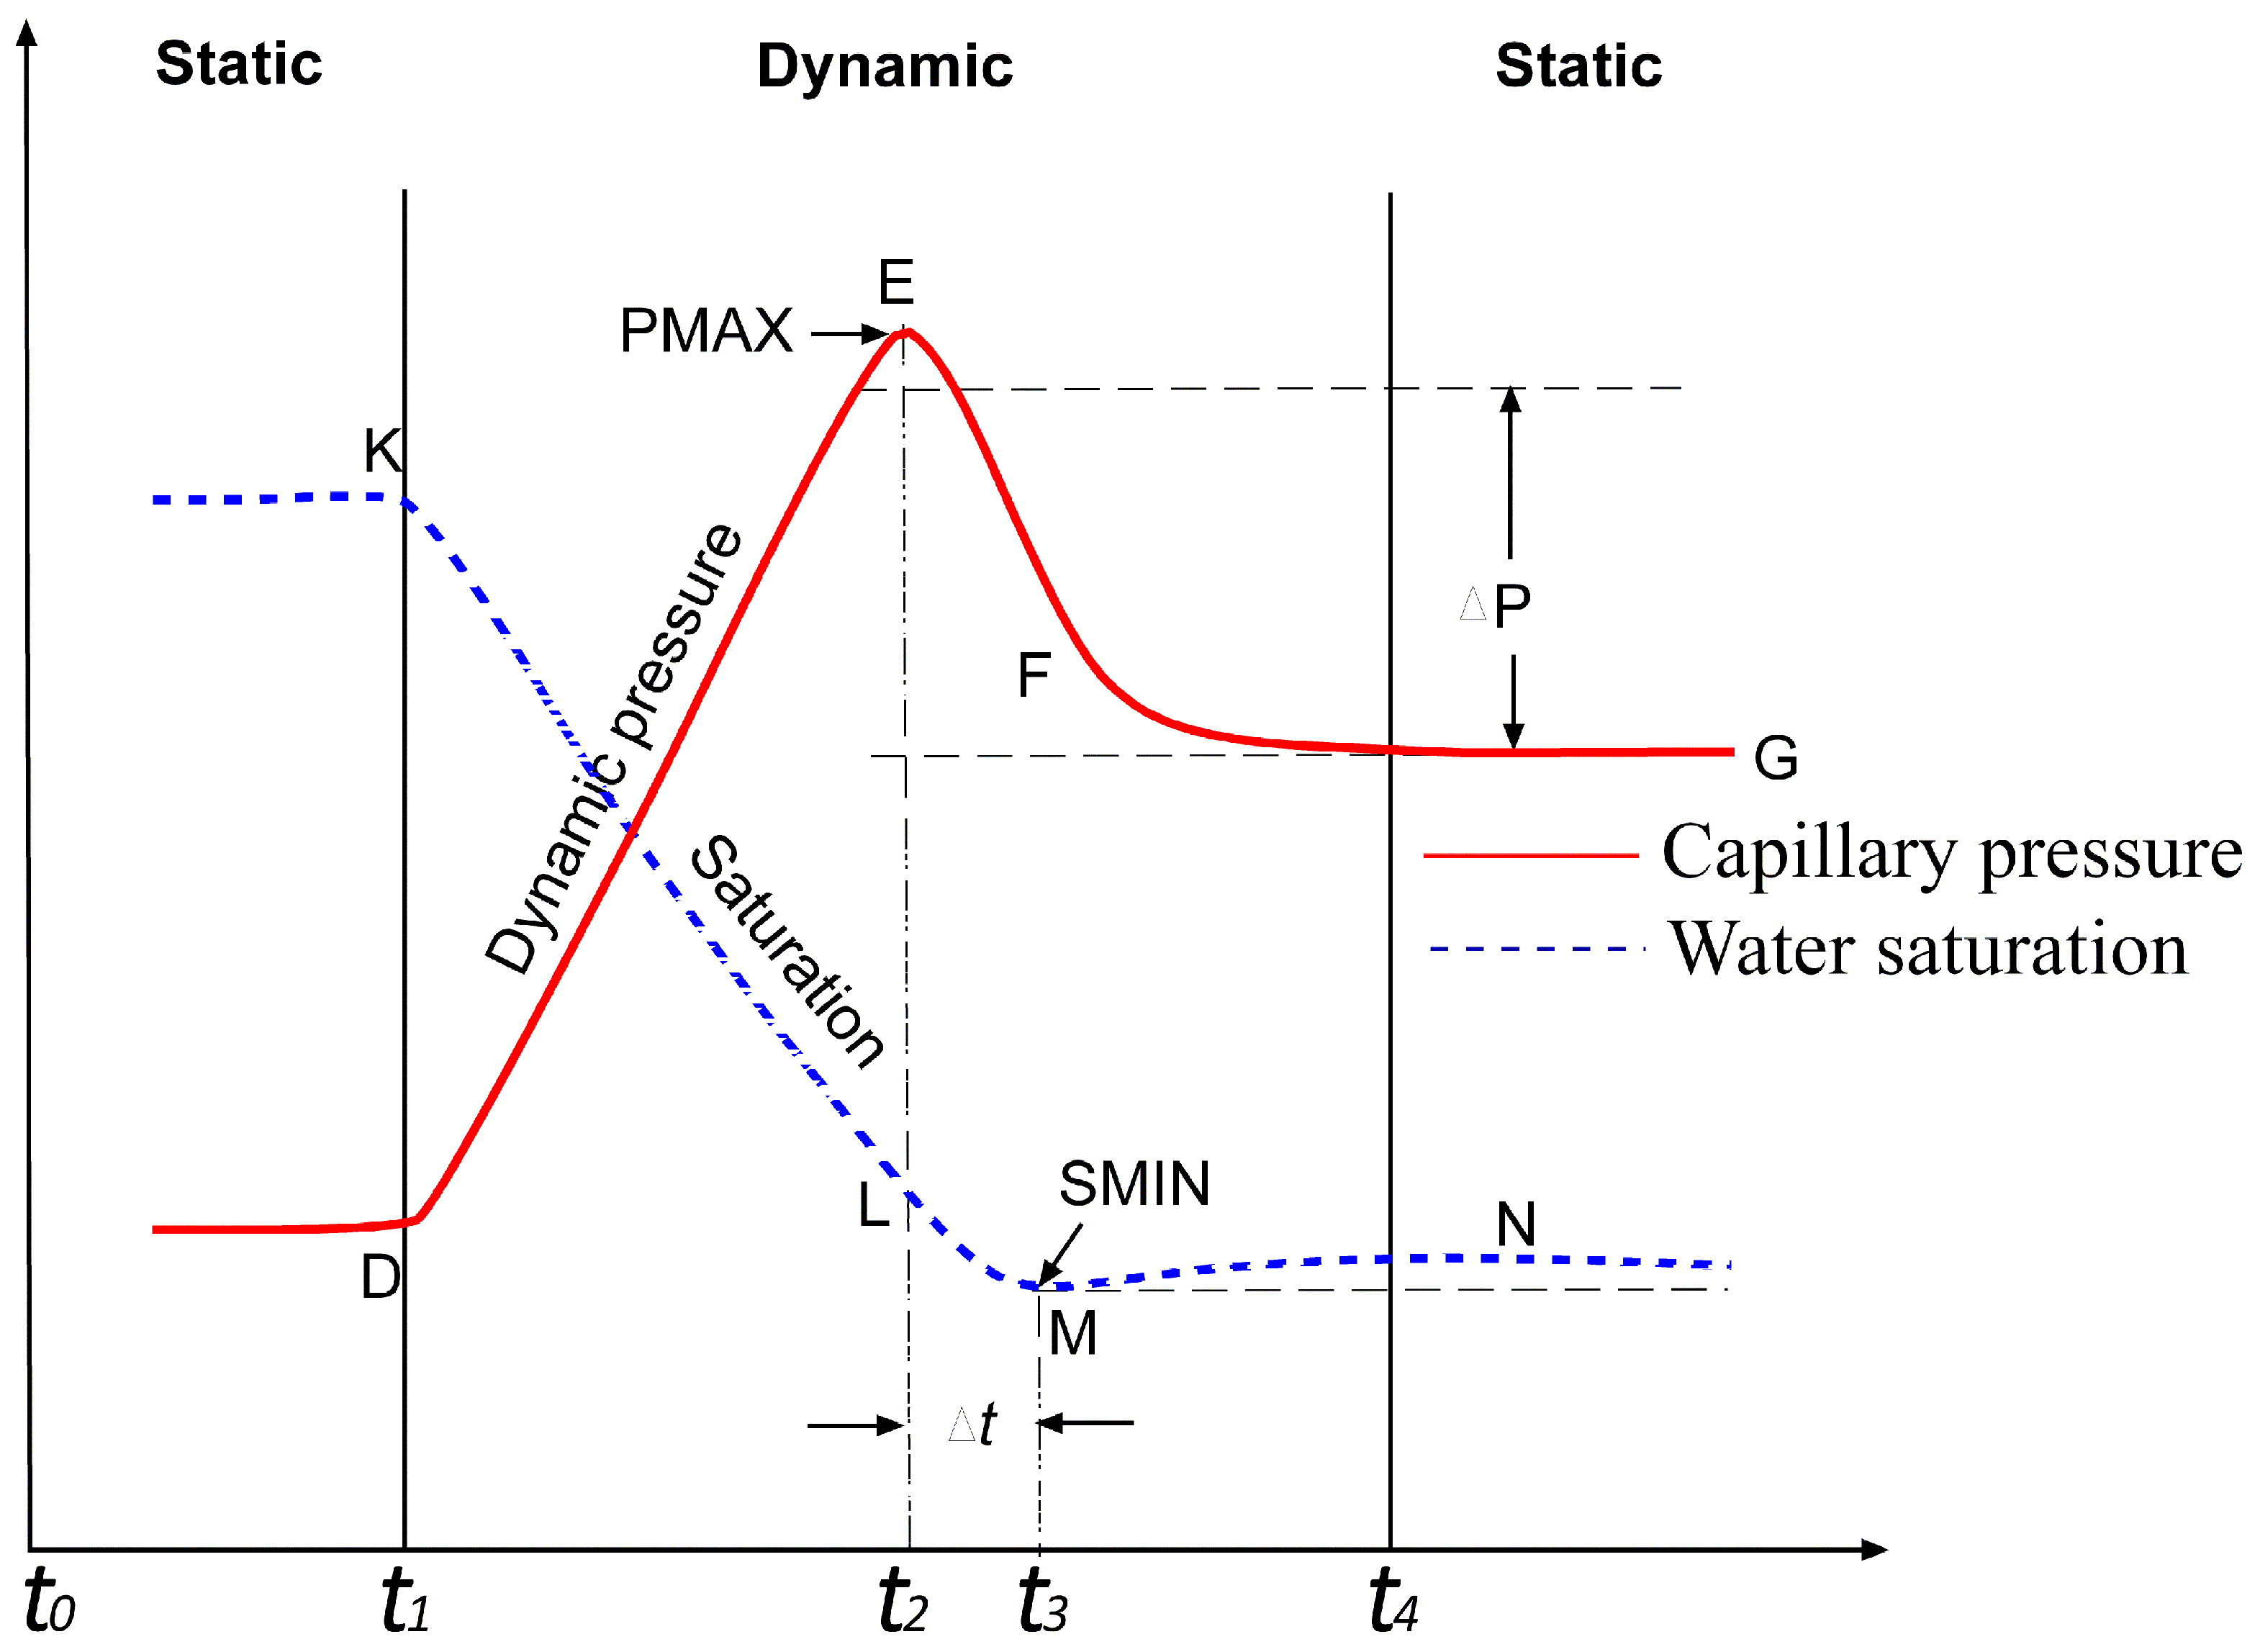
3.2. Characterization of the Dynamic Non-Equilibrium Effect

The temporal evolution of capillary potential and aqueous phase saturation across drainage phases is graphically represented by the DEG (capillary pressure) and KLN (water saturation) trajectories in Figure 6, delineating three distinct hydrodynamic regimes: (1) pre-drainage static equilibrium (t0–t1), (2) transient hydrodynamic evolution spanning drainage initiation to hydraulic equilibrium (t1–t4), and (3) post-drainage static stabilization (t4 onward). Valve actuation events at t1 (initiation) and t2 (termination) correspond to the inflection points D and E on the pressure–time profile, respectively. These trajectories explicitly demonstrate a non-linear relationship between saturation and capillary potential during drainage sequences, exhibiting dynamic phase hysteresis that diverges from the classical S–p constitutive models postulated by Brooks-Corey and van Genuchten [51]. After t4, water saturation showed a steady rise before reaching equilibrium. The gap between the lowest saturation at t3 and the equilibrium state after t4 is tied to the DNE [1]. At the pore scale, the DNE stems from lagged shifts in air–water interface curvature during capillary pressure shifts [52]. At the macro scale, it manifests as leftover water trapped in surface grooves, pore edges, and narrow corners during air entry, along with slow film-flow movement of this trapped water back to connected wet zones. The synergistic interaction of these mechanisms reduces capillary pressure while enhancing aqueous phase saturation under quiescent drainage regimes, as demonstrated through controlled displacement experiments [53]. Consequently, the DNE can be quantified through two key metrics: (i) temporal decoupling (Δt = t3−t2) between capillary pressure maxima (t2) and saturation minima (t3), and (ii) pressure potential differentials (ΔP) between transient and equilibrium states. DNE metrics (∆t, ∆p) during multi-step drainage across discrete particle sizes are presented in Table 3.

3.3. DNE in Multi-Step Drainage Operations

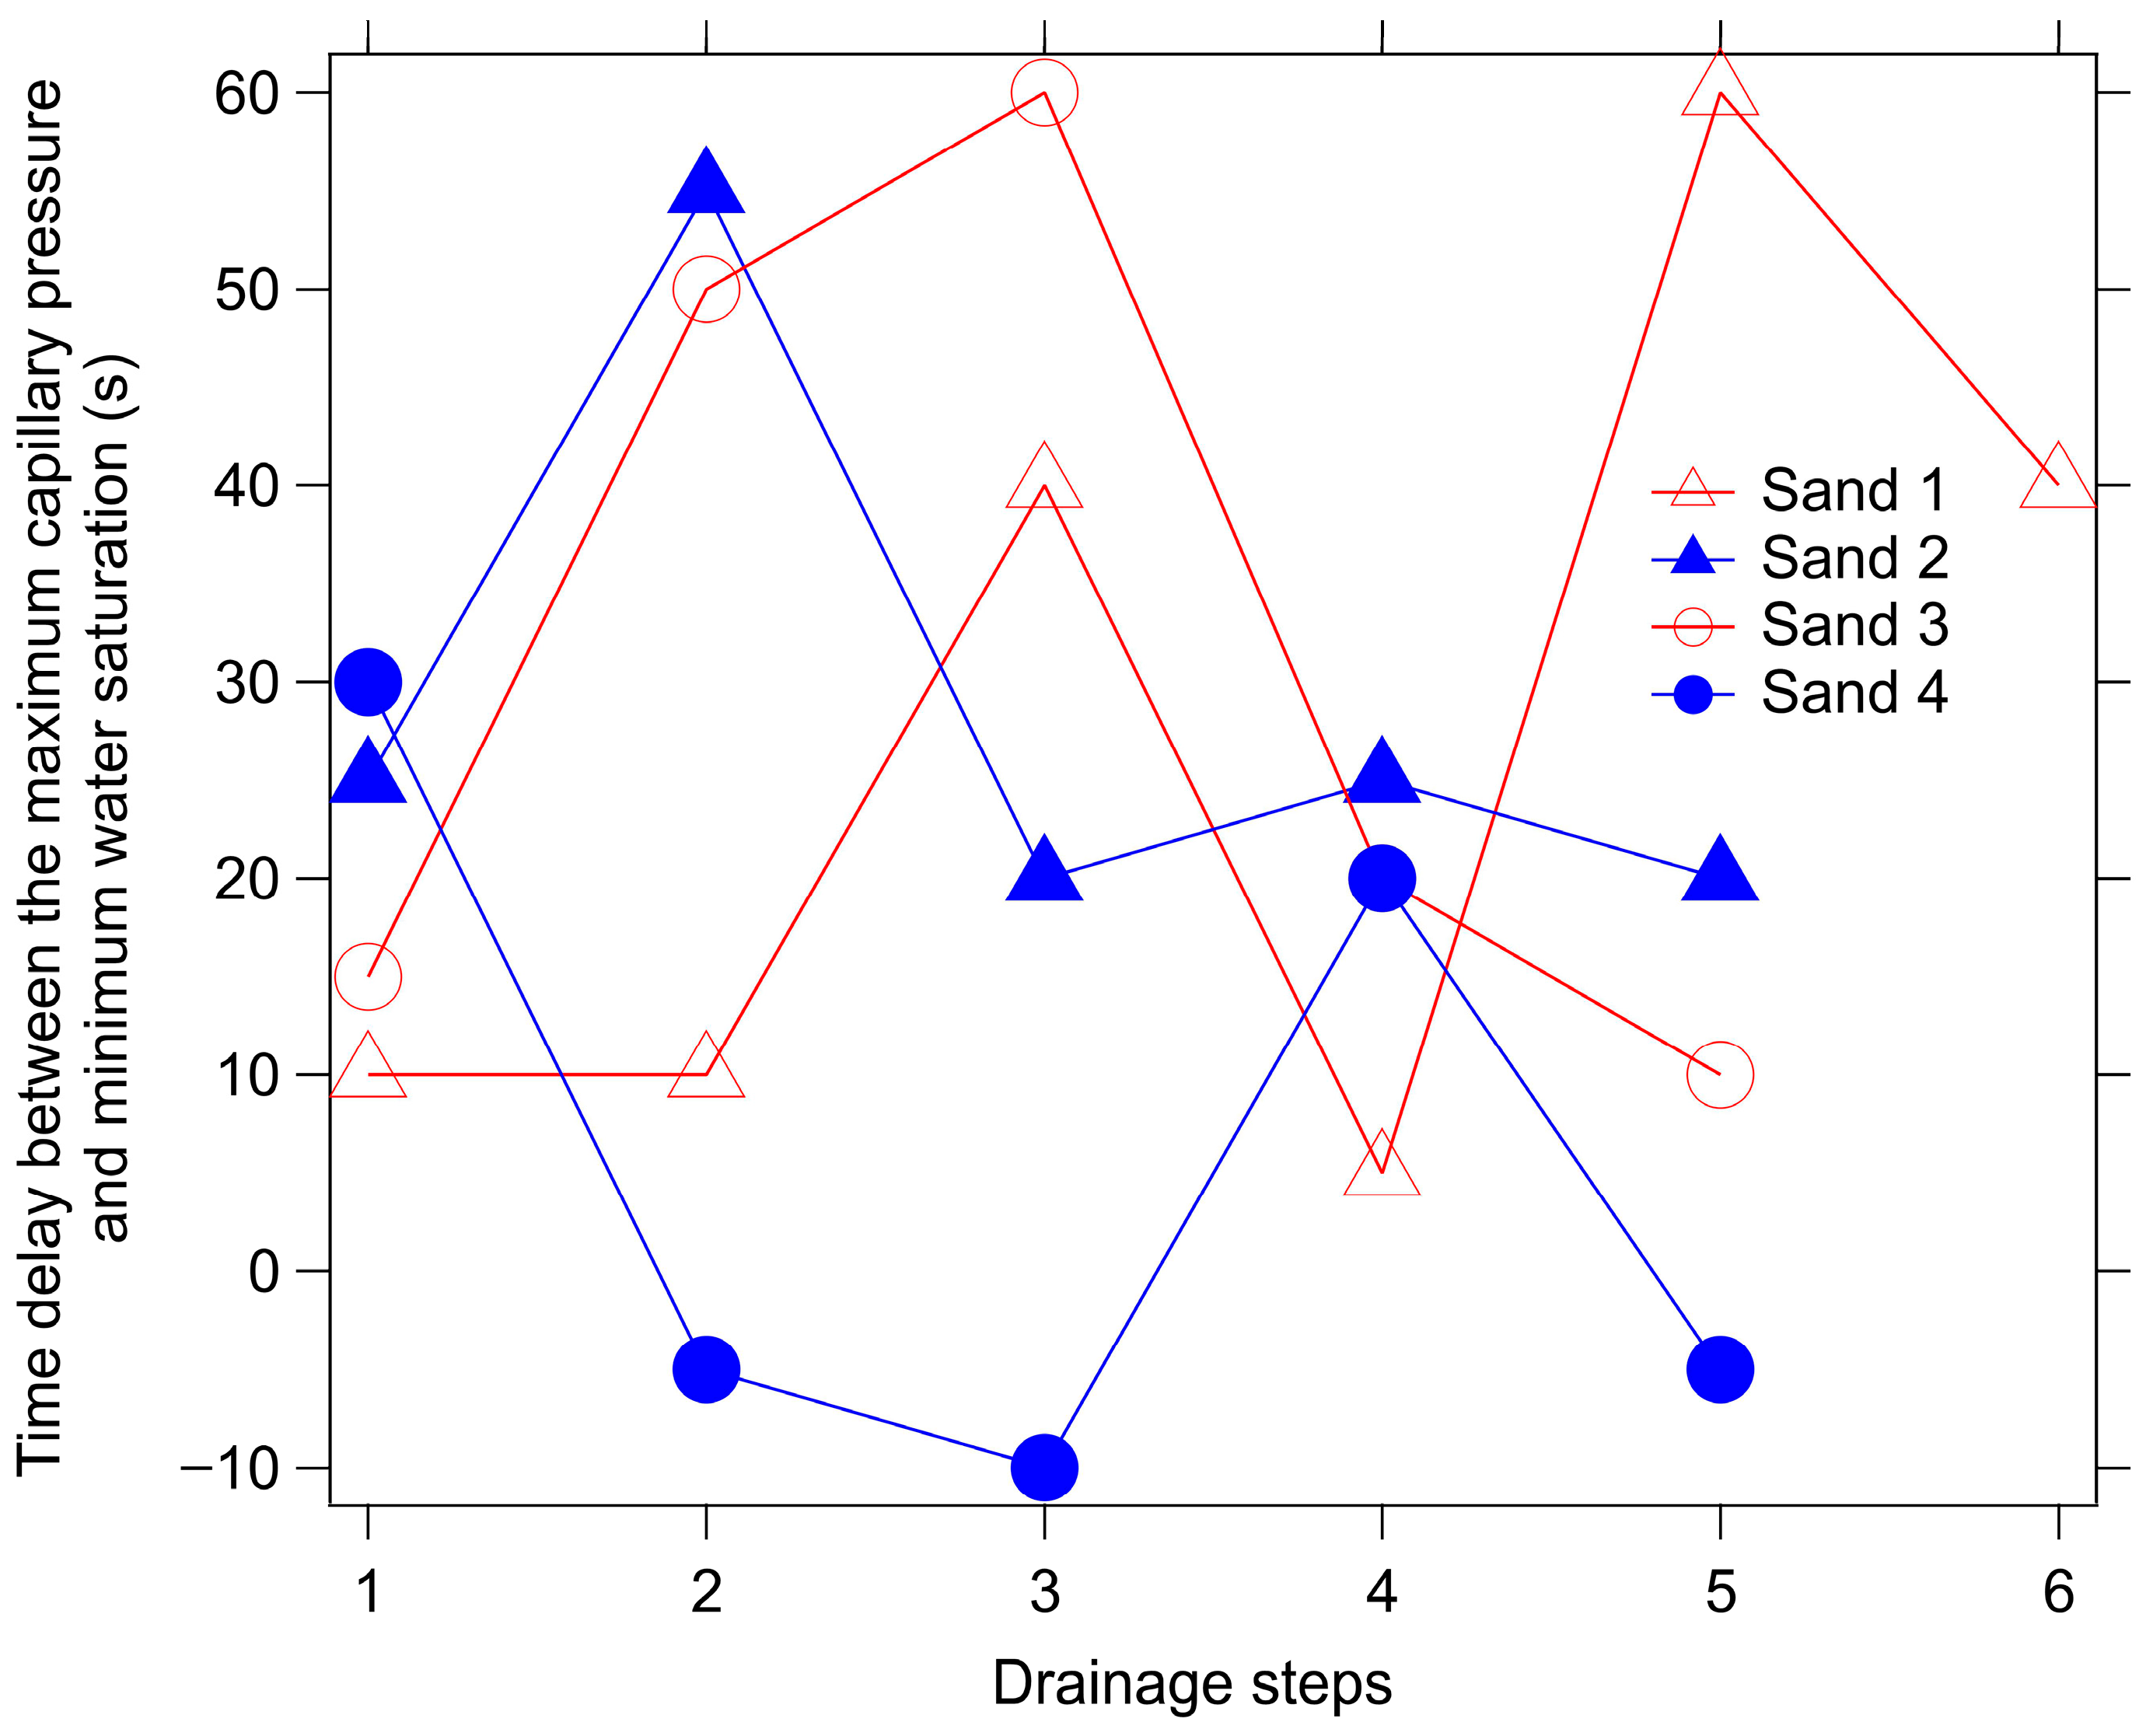
3.3.1. Temporal Decoupling Between Capillary Pressure Peaks and Water Saturation Minima (Δt)

Spatial averaging of hydraulic parameters occurs when a sensor’s resolution exceeds the scale of porous media heterogeneity [1]. In these column tests, the heterogeneities of the sand matrices ranged from millimeter to centimeter scales (Figure 1); that is, below the resolution limits of the TDR probe’s dual-needle configuration (2.0 cm × 0.5 cm measurement window) and comparable to the dimensions of the T5 tensiometer’s ceramic cup (0.5 cm diameter × length). While TDR-derived saturation represents volumetric averages across its measurement zone, tensiometric pressure reflects point-specific values. Consequently, the TDR saturation and T5 pressure measurements characterize localized hydraulic properties at discrete positions in the column.
The temporal decoupling (Δt) between capillary pressure peaks and water saturation minima for Tests 1–4 is graphically depicted in Figure 7 (data in Table 3), where positive Δt values denote capillary pressure extrema preceding saturation counterparts. Notably, the capillary pressure can be seen to attain maximal values prior to the attainment of water saturation endpoints. In Tests 1–3 (d50 = 188–568 μm), the peak capillary pressure consistently precedes minimum water saturation, with Δt values ranging from 10 to 60 s. This persistent time lag contradicts traditional soil–water characteristic curve theory [1], which assumes a unique capillary pressure–saturation relationship. All three tests exhibit marked DNEs throughout their five-stage drying cycles, with the finest sand (Test 1, d50 = 188 μm) demonstrating the most pronounced DNE during its extended six-stage drying process. Conversely, in Test 4 (d50 = 988 μm), fundamentally distinct behavior was observed: the interval between the capillary pressure maxima and water saturation minima shortened progressively during further drying, with Δt ranging from −5 to 30 s. Water saturation minima lagged behind capillary pressure peaks only in Stages 1 and 4. During Stages 2, 3, and 5, water saturation minima either coincided with or preceded capillary pressure maxima. No detectable extrema occurred in Stage 6, precluding DNE analysis. Critically, throughout the first five drying stages in Test 4, the peak capillary pressure failed to systematically precede minimum water saturation. Furthermore, the absence of measurable extrema in Stage 6 indicates no discernible DNE—a result consistently observed in replicate experiments. Post-final drying, water saturation stabilized at approximately 0.872 after complete drainage via peristaltic pump. The larger particle size and associated pore geometry of coarse sand reduced the capillary trapping of the wetting phase (i.e., water). During drying, water films in pores—governed by competing capillary, viscous, and gravitational forces—thin or rupture as drainage proceeds. Viscous forces, driven by pressure gradients, dominate as gravitational effects diminish in smaller pores. Larger pores exhibit weaker capillary pressures, enabling fluid mobilization with minimal hysteresis [54]. This facilitates synchronized or inverted pressure–saturation dynamics, with water saturation extrema occasionally preceding capillary pressure peaks. Consequently, within the studied porous media systems, the temporal sequencing of PMAX and SMIN is governed by granulometric characteristics. A critical threshold emerges at d50 = 568 μm, beyond which the PMAX–SMIN precedence relationship loses statistical significance under drainage conditions.

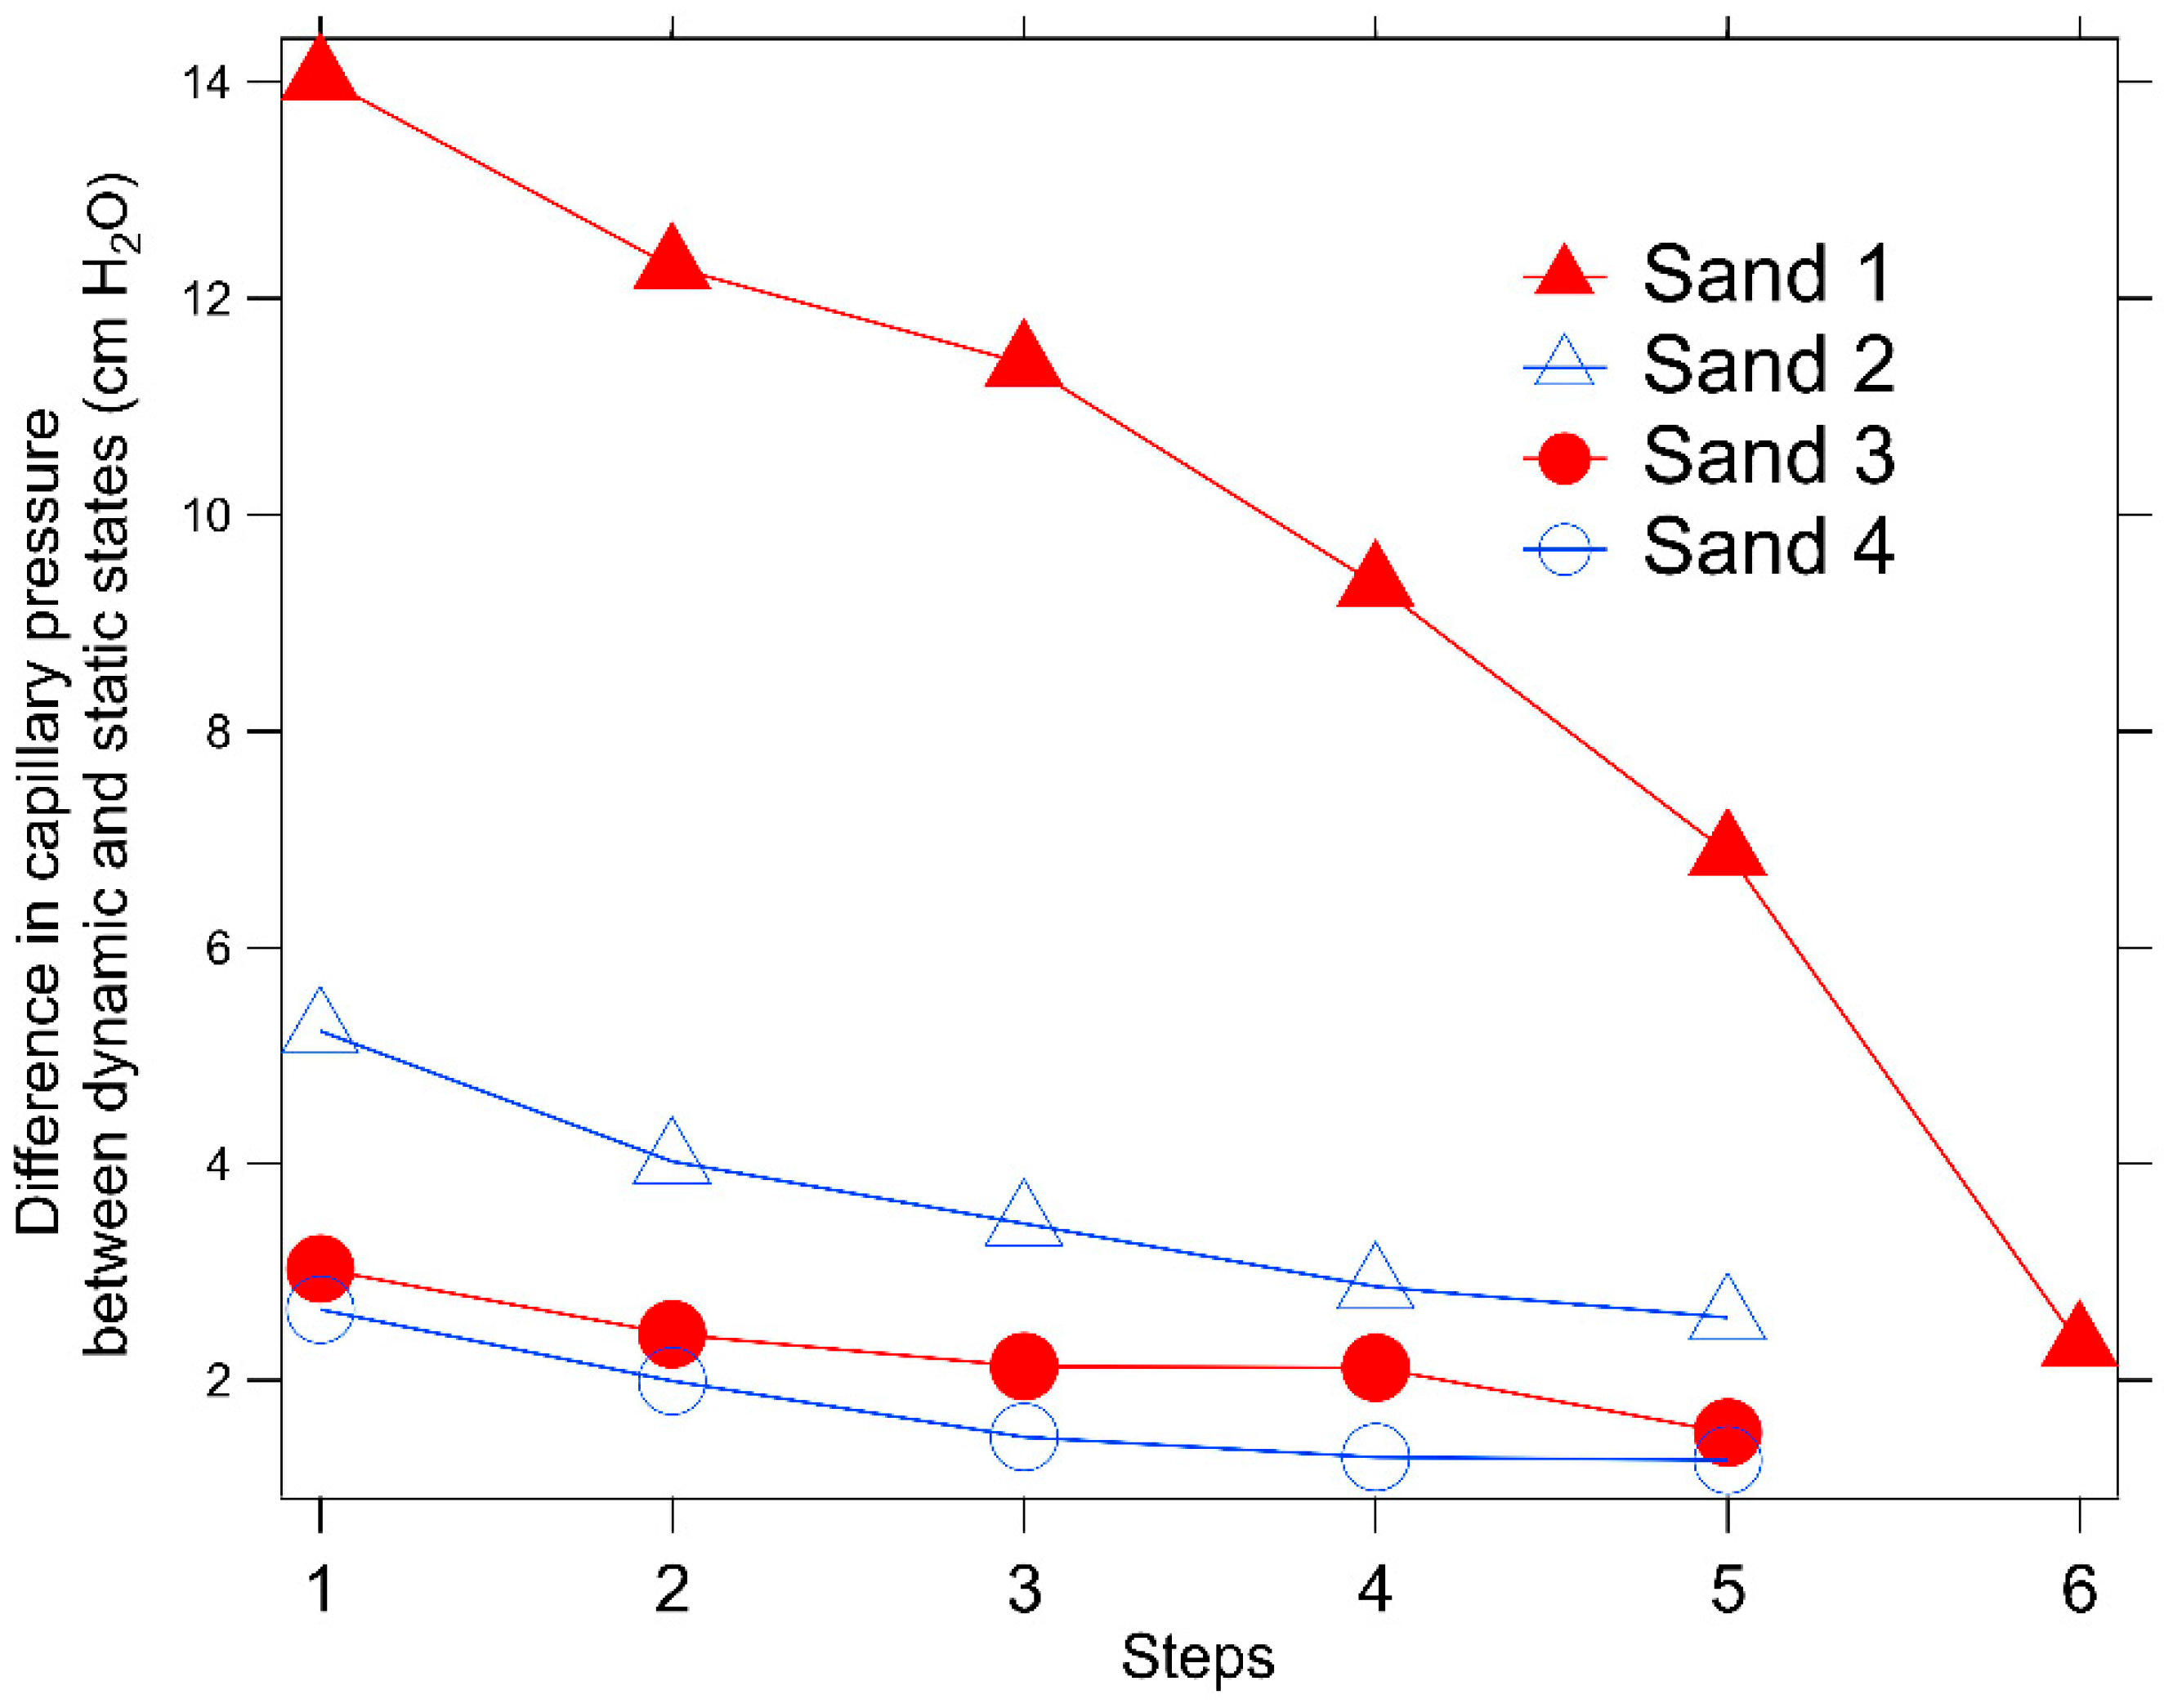
3.3.2. Capillary Pressure Differential Between Dynamic and Static Conditions (ΔP)

Figure 8 evaluates the DNE manifestations in Tests 1, 2, 3, and 4 through quantification of ΔP, defined as the differential between peak capillary pressures during active drainage phases and stabilized post-drainage equilibrium values (data in Table 3). In Test 1, the DNE spanned 3–14 cm H2O across all six stages, with intensity diminishing progressively as water saturation decreased. Notably, a pronounced DNE persisted even in Stage 6, markedly contrasting with coarser-grained sands (i.e., Tests 2, 3, and 4). For Tests 2, 3, and 4, the DNE was significantly weaker, ranging from 1.2–5.2 cm H2O, and similarly diminished with reduced water saturation. By Stage 6, the DNE became negligible. Comparative analysis revealed that while porous media of all particle sizes exhibited the DNE during drying, its strength inversely correlates with particle size and directly correlates with wetting phase fluid saturation; in particular, lower saturation consistently corresponded to weaker DNE. Camps-Roach et al. have demonstrated that the intensity of the DNE depends on the mean particle size in porous media, with finer-textured soils exhibiting greater DNE magnitudes than coarser counterparts while remaining independent of specimen dimensions [42]. This dependency was explicitly confirmed through specialized experiments employing sands of varying particle sizes under diverse hydrodynamic drying conditions: finer particle sizes were found to yield higher DNE intensity.
Furthermore, hysteresis—namely, the delayed saturation extremum relative to that of capillary pressure—also occurs in a particle size-dependent manner. In coarser media (i.e., Tests 2, 3, and 4), observable hysteresis diminished or vanished entirely due to reduced capillary retention. A distinct granulometric threshold was identified at d50 = 188 μm in the characterized porous media systems, beyond which the DNE exhibited progressive diminution, ultimately becoming statistically indistinguishable from baseline transport behavior.
Experimental investigations in particulate systems revealed grain size-dependent residual water saturation profiles. Triplicate trials showed decreasing values with increasing particle size (Table 4), highlighting a monotonic reduction in saturation variability as the grain distribution coarsened. As illustrated in Figure 9, as the size of particles in the porous medium increases and the pores become larger, leading to less water retention, thinner water films occur on the particle surfaces and, consequently, lower residual water saturation occurs. Three principal mechanisms govern residual saturation in porous systems: (1) surface-bound hydration layers at mineral interfaces, (2) capillary-bound aqueous clusters in pore throat constrictions, and (3) geometrically isolated water phases in terminal pore domains. Finer particulates (Test 1) displayed amplified residual saturation through synergistic surface interactions: their increased specific surface area and complex pore throat architecture modify hydraulic response functions in comparison with coarse-grained systems (Tests 2, 3, and 4). This particle-size-dependent multi-phase behavior exemplifies the DNE, with pore-scale connectivity governing macroscopic fluid retention.

4. Conclusions

This study investigated stepwise drainage processes in fine- and coarse-grained sands to elucidate the influence of particle size on the DNE governing pore-scale fluid dynamics. The key findings of the study are as follows:
  • Pressure maxima and saturation minima exhibited asynchronous occurrence during drainage cycles. Saturation–capillary pressure interdependencies displayed non-monotonic behavioral patterns throughout drainage sequences.
  • The DNE manifests during drainage through three quantifiable parameters: the temporal decoupling (Δt) between capillary pressure maxima (PMAX) and water saturation minima (SMIN), the hysteretic pressure differential (ΔP) denoting the disparity between dynamic transient and static equilibrium capillary states, and residual water saturation representing irreducible fluid retention.
  • The strength of the DNE is inversely proportional to particle size and directly proportional to wetting phase saturation. In particular, reduced saturation systematically diminishes the intensity of the DNE. Coarser porous media demonstrated negligible hysteresis due to reduced capillary retention; this is in stark contrast to fine sands, where the DNE persisted even during advanced drying stages. Residual water saturation decreases progressively with larger particle sizes.

Author Contributions

Conceptualization, Y.L.; Methodology, Y.A., Z.W., H.X., Y.S., J.X. and H.H.; Software, Y.A. and Y.Y.; Validation, Y.L.; Formal analysis, Y.L.; Investigation, Y.A., H.X., Y.L., J.X. and H.H.; Data curation, Z.W. and Y.Y.; Writing—original draft, Z.W. and Y.L.; Funding acquisition, Y.S. All authors have read and agreed to the published version of the manuscript.

Funding

This work was supported by the Chinese National Science Foundation (grant no. 41772237), Special Project for Research and Development in Key areas of Guangdong Province (No. 2020B1111350003), Innovation Group Project of Southern Marine Science and Engineering Guangdong Laboratory (Zhuhai) (grant no. 311022004), and Guangdong MEPP (Marine Economy Promotion Projects) Fund (grant no. GDOE–[2019]–A41).

Data Availability Statement

The data supporting the findings and discussions of this study are publicly accessible on Zenodo: https://doi.org/10.5281/zenodo.15473173.

Conflicts of Interest

Author Yijia Sun was employed by the company Zhejiang Zhouhuan Environmental Engineering Design Co., Ltd. The remaining authors declare that the research was conducted in the absence of any commercial or financial relationships that could be construed as a potential conflict of interest.

References

  1. Diamantopoulos, E.; Durner, W. Dynamic nonequilibrium of water flow in porous media: A review. Vadose Zone J. 2012, 11, 811–822. [Google Scholar] [CrossRef]
  2. Hassanizadeh, S.M.; Celia, M.A.; Dahle, H.K. Dynamic Effect in the Capillary Pressure-Saturation Relationship and its Impacts on Unsaturated Flow. Vadose Zone J. 2002, 1, 38–57. [Google Scholar] [CrossRef]
  3. Tian, L.; Feng, B.; Zheng, S.; Gu, D.; Ren, X.; Yang, D. Performance evaluation of gas production with consideration of dynamic capillary pressure in tight sandstone reservoirs. J. Energy Res. Technol. 2019, 141, 022902. [Google Scholar] [CrossRef]
  4. Pettersson, K.; Maggiolo, D.; Sasic, S.; Johansson, P.; Kalagasidis, A.S. Contribution of dynamic capillary pressure to rainfall infiltration in thin homogeneous growth substrates. J. Hydrol. 2021, 603, 126851. [Google Scholar] [CrossRef]
  5. Almaliki, D.F.; Ramli, H.; Zaiter, A.; Sheriff, I. Review on migration and entrapment of light nonaqueous phase liquids in the subsurface environment. Desalination Water Treat. 2025, 322, 101095. [Google Scholar] [CrossRef]
  6. Zakirov, T.R.; Khramchenkov, M.G. Wettability effect on the invasion patterns during immiscible displacement in heterogeneous porous media under dynamic conditions: A numerical study. J. Pet. Sci. Eng. 2012, 206, 109049. [Google Scholar] [CrossRef]
  7. Dejam, M. Advective-diffusive-reactive solute transport due to non-Newtonian fluid flows in a fracture surrounded by a tight porous medium. Int. J. Heat Mass Transf. 2019, 128, 1307–1321. [Google Scholar] [CrossRef]
  8. O’Carroll, D.M.; Mumford, K.G.; Abriola, L.M.; Gerhard, J.I. Influence of wettability variations on dynamic effects in capillary pressure. Water Resour. Res. 2010, 46, W08505. [Google Scholar] [CrossRef]
  9. Zhu, Y.; Xu, H.; Hu, J.; Lu, J.; Ni, J.; Liu, H.; Zhang, K.; Gao, D.; Ding, H. Dynamic wetting mechanism of coal under different CO2 pressure: A new analytical basis through T2 cutoff. Process Saf. Environ. Prot. 2024, 192, 460–470. [Google Scholar] [CrossRef]
  10. Hu, J.; Sun, R.; Zhang, Y. Investigating the horizontal well performance under the combination of micro-fractures and dynamic capillary pressure in tight oil reservoirs. Fuel 2020, 269, 117375. [Google Scholar] [CrossRef]
  11. Abidoye, L.K.; Das, D.B. Impacts of dynamic capillary pressure effects in supercritical CO2-Water flow: Experiments and numerical simulations. Adv. Water Resour. 2020, 136, 103504. [Google Scholar] [CrossRef]
  12. Diamantopoulos, E.; Iden, I.C.; Durner, W. Inverse modeling of dynamic non-equilibrium in water flow with an effective approach. Water Resour. Res. 2012, 48, W03503. [Google Scholar] [CrossRef]
  13. Manthey, S.; Hassanizadeh, S.M.; Helmig, R. Macro-scale dynamic effects in homogeneous and heterogeneous porous media. Transp. Porous Media 2005, 58, 121–145. [Google Scholar] [CrossRef]
  14. Wang, F.; Liu, L.; Xu, H.; Liu, Y.; Meng, X.; Peng, B. An analytical solution model of oil–water dynamic imbibition considering dynamic contact angle effect and osmotic pressure at micro-nano scale. Fuel 2025, 379, 132979. [Google Scholar] [CrossRef]
  15. Wang, X.; Qin, C.; Guo, B.; Pop, S.; Tian, J. Experimental validation of an image-based dynamic pore-network model for spontaneous imbibition in sandstones. Adv. Water Resour. 2025, 195, 104859. [Google Scholar] [CrossRef]
  16. Tian, W.; Wu, K.; Chen, Z.; Lei, Z.; Gao, Y.; Li, J. Mathematical model of dynamic imbibition in nanoporous reservoirs. Pet. Explor. Dev. 2022, 49, 170–178. [Google Scholar] [CrossRef]
  17. Tian, W.; Wu, K.; Chen, Z.; Gao, Y.; Li, J.; Wang, M. A relative permeability model considering nanoconfinement and dynamic contact angle effects for tight reservoirs. Energy 2022, 258, 124846. [Google Scholar] [CrossRef]
  18. Zhang, Y.; Yang, D. A two-phase flow model coupled with geomechanics for simulating transient production behaviour in an unconventional reservoir by considering fracture geometry and capillary pressure. Fuel 2024, 364, 130959. [Google Scholar] [CrossRef]
  19. Abreu, E.; Ferraz, P.; Vieira, J. Numerical resolution of a pseudo-parabolic Buckley-Leverett model with gravity and dynamic capillary pressure in heterogeneous porous media. J. Comput. Phys. 2020, 411, 109395. [Google Scholar] [CrossRef]
  20. Chen, Y.; Mao, Y.; Yang, L.; Wei, W.; Meng, Q.; Cai, J. A comprehensive review of factors affecting dynamic capillary effect in two-phase flow. Transp. Porous Media 2022, 144, 33–54. [Google Scholar] [CrossRef]
  21. Yang, G.; Wang, M. Surface roughness effect on dynamic wettability in imbibition process. Comput. Fluids 2023, 263, 105959. [Google Scholar] [CrossRef]
  22. Souza, R.; Ghannam, K.; Calabrese, S. Dynamic coupling between soil properties and water content in shrink-swell soils: Effects on surface hydrologic partitioning. Adv. Water Resour. 2024, 184, 104630. [Google Scholar] [CrossRef]
  23. Bagarello, V.; Castellini, M.; Di Prima, S.; Iovino, M. Soil hydraulic properties determined by infiltration experiments and different heights of water pouring. Geoderma 2014, 213, 492–501. [Google Scholar] [CrossRef]
  24. Aghaei, A.; Piri, M. Direct pore-to-core up-scaling of displacement processes: Dynamic pore network modeling and experimentation. J. Hydrol. 2015, 522, 488–509. [Google Scholar] [CrossRef]
  25. Li, X.; Liu, C.; Li, H.; Chen, S.; Lu, K.; Zhang, Q.; Luo, H. A review on measurement of the dynamic effect in capillary pressure. J. Pet. Sci. Eng. 2022, 208, 109672. [Google Scholar] [CrossRef]
  26. Cai, J.; Chen, Y.; Qiao, J.; Yang, L.; Zeng, J.; Sun, C. Determination of dynamic capillary effect on two-phase flow in porous media: A perspective from various methods. Pet. Sci. 2022, 19, 1641–1652. [Google Scholar] [CrossRef]
  27. Plagge, R. Bestimmung der Ungesättigten Wasserleitfähigkeit im Boden. Ph.D. Thesis, Department of Landscape Development, Technical University of Berlin, Berlin, Germany, 1991. [Google Scholar]
  28. Plagge, R.; Haeupl, P.; Renger, M. Transient effects on the hydraulic properties of porous media. In Proceedings of the International Workshop on Characterization and Measurement of the Hydraulic Properties of Unsaturated Porous Media, Riverside, CA, USA, 22–24 October 1997; van Genuchten, M.T., Leij, F.J., Wu, L., Eds.; University of California: Riverside, CA, USA, 1999; pp. 905–912. [Google Scholar]
  29. Li, Y.; Li, H.; Chen, S.; Ma, Q.; Liu, C. Two-phase fluid flow characterizations in a tight rock: A fractal bundle of the capillary tube model. Ind. Eng. Chem. Res. 2019, 58, 20806–20814. [Google Scholar] [CrossRef]
  30. Li, Y.; Li, H.; Chen, S.; Luo, H.; Liu, C. Investigation of the dynamic capillary pressure during displacement process in fractured tight rocks. AIChE J. 2020, 66, e16783. [Google Scholar] [CrossRef]
  31. Li, Y.; Luo, H.; Li, H.; Chen, S.; Jiang, X.; Li, J. Dynamic capillarity during displacement process in fractured tight reservoirs with multiple fluid viscosities. Energy Sci. Eng. 2020, 8, 300–311. [Google Scholar] [CrossRef]
  32. Ahmed, A.; Sanedrin, R.; Willers, T.; Waghmare, P.R. The effect of dynamic wetting pressure on contact angle measurements. J. Colloid Interface Sci. 2022, 608, 1086–1093. [Google Scholar] [CrossRef] [PubMed]
  33. Standnes, D.C.; Ebeltoft, E.; Haugen, Å.; Kristoffersen, A. Using the total chemical potential to generalize the capillary pressure concept and therefrom derive a governing equation for two-phase flow in porous media. Int. J. Multiph. Flow 2024, 181, 105024. [Google Scholar] [CrossRef]
  34. Yan, G.; Li, Z.; Bore, T.; Torres, S.A.G.; Scheuermann, A.; Li, L. A lattice Boltzmann exploration of two-phase displacement in 2D porous media under various pressure boundary conditions. J. Rock Mech. Geotech. Eng. 2022, 14, 1782–1798. [Google Scholar] [CrossRef]
  35. Konangi, S.; Palakurthi, N.K.; Karadimitriou, N.K.; Comer, K.; Ghia, U. Comparison of pore-scale capillary pressure to macroscale capillary pressure using direct numerical simulations of drainage under dynamic and quasi-static conditions. Adv. Water Resour. 2021, 147, 103792. [Google Scholar] [CrossRef]
  36. Lysyy, M.; Liu, N.; Landa-Marbán, D.; Ersland, G.; Fernø, M. Impact of gas type on microfluidic drainage experiments and pore network modeling relevant for underground hydrogen storage. J. Energy Storage 2024, 87, 111439. [Google Scholar] [CrossRef]
  37. Lan, Z.; Zhuravljov, A.; Jing, Y.; Armstrong, R.T.; Mostaghimi, P. Coupling of pore network modelling and volume of fluid methods for multiphase flow in fractured media. Fuel 2022, 319, 123563. [Google Scholar] [CrossRef]
  38. Purswani, P.; Johns, R.T.; Karpyn, Z.T. Impact of wettability on capillary phase trapping using pore-network modeling. Adv. Water Resour. 2024, 184, 104606. [Google Scholar] [CrossRef]
  39. Jin, K.; Zhao, J.; Yao, G.; Xu, D.; Wen, D. A fully coupled multiscale phase-change model at the porous interface for transpiration cooling: Coupling dynamics pore-scale networks to continuum-scale free flow. Int. J. Heat Mass Transf. 2025, 236, 126396. [Google Scholar] [CrossRef]
  40. Hosseinzadegan, A.; Raoof, A.; Mahdiyar, H.; Nikooee, E.; Ghaedi, M.; Qajar, J. Review on pore-network modeling studies of gas-condensate flow: Pore structure, mechanisms, and implementations. Geoenergy Sci. Eng. 2023, 226, 211693. [Google Scholar] [CrossRef]
  41. Nikooee, E.; Hassanizadeh, S.M.; Habibagahi, G. Mechanics of Unsaturated Soils: From Equilibrium to Transient Conditions. In Proceedings of the Biot Conference on Poromechanics, Vienne, Austria, 10–12 July 2013. [Google Scholar] [CrossRef]
  42. Camps-Roach, G.; DM O’Carroll; Newson, T.A.; Sakaki, T.; Illangasekare, T.H. Experimental investigation of dynamic effects in capillary pressure: Grain size dependency and upscaling. Water Resour. Res. 2010, 46, W08527. [Google Scholar] [CrossRef]
  43. Rastiello, G.; Leclaire, S.; Belarbi, R.; Bennacer, R. Unstable two–phase flow rate in micro-channels and cracks under imposed pressure difference. Int. J. Multiph. Flow 2015, 77, 131–141. [Google Scholar] [CrossRef]
  44. Joekar-Niasar, V.; Prodanovic, M.; Wildenschild, D.; Hassanizadeh, S.M. Network model investigation of interfacial area, capillary pressure and saturation relationships in granular porous media. Water Resour. Res. 2010, 46, W06526. [Google Scholar] [CrossRef]
  45. Joekar-Niasar, V.; Hassanizadeh, S.M. Effect of fluids properties on non-equilibrium capillarity effects: Dynamic pore-network modeling. Int. J. Multiph. Flow 2011, 37, 198–214. [Google Scholar] [CrossRef]
  46. Rogers, J.S.; Klute, A. The hydraulic conductivity-water content relationship during nonsteady flow through a sand column. Soil Sci. Soc. Am. J. 1971, 35, 695–700. [Google Scholar] [CrossRef]
  47. Constantz, J. Confirmation of rate-dependent behavior in water retention during drainage in nonswelling porous materials. Water Resour. Res. 1993, 29, 1331–1334. [Google Scholar] [CrossRef]
  48. Hassanizadeh, S.M.; Gray, W.G. Thermodynamic basis of capillary pressure in porous media. Water Resour. Res. 1993, 29, 3389–3405. [Google Scholar] [CrossRef]
  49. Li, J.; He, X.; Li, C.; Du, Y.; Li, Y.; Xia, J.; Gao, J.; Yang, Y.; Li, Y. Factors influencing dynamic nonequilibrium effects in drainage processes of an air-water two-phase fine sandy medium. Water Resour. Res. 2019, 55, 2232–2256. [Google Scholar] [CrossRef]
  50. Li, Y.; Flores, G.; Xu, J.; Yue, W.; Wang, Y.; Luan, T.; Gu, Q. Residual air saturation changes during consecutive drainage–imbibition cycles in an air–water fine sandy medium. J. Hydrol. 2013, 503, 77–88. [Google Scholar] [CrossRef]
  51. Van Genuchten, M.T. A closed-form equation for predicting the hydraulic conductivity of unsaturated soils. Soil Sci. Soc. Am. J. 1980, 44, 892–898. [Google Scholar] [CrossRef]
  52. Sakaki, T.; O’Carroll, D.M.; Illangasekare, T.H. Direct quantification of dynamic effects in capillary pressure for drainage-wetting cycles. Vadose Zone J. 2010, 9, 424–437. [Google Scholar] [CrossRef]
  53. O’Carroll, D.M.; Phelan, T.J.; Abriola, L.M. Exploring dynamic effects in capillary pressure in multistep outflow experiments. Water Resour. Res. 2005, 41, W11419. [Google Scholar] [CrossRef]
  54. Thibodeau, L.; Guo, T.; Neale, G.H. Effects of connate water on immiscible displacement processes in porous media. Powder Technol. 1997, 93, 209–217. [Google Scholar] [CrossRef]
Figure 1. Grain size distribution of fine and coarse sandy media.
Water 17 02115 g001
Figure 2. Experimental setup for measuring water saturation–capillary pressure (Sp) curves during imbibition.
Water 17 02115 g002
Figure 3. Time-dependent variations in water saturation and capillary pressure during drainage processes for Sand 1 (Test 1) and Sand 4 (Test 4).
Water 17 02115 g003
Figure 4. Drainage dynamics in Sand 1 (Test 1): Time-dependent variations in water saturation and capillary pressure.
Water 17 02115 g004
Figure 5. Drainage dynamics in Sand 4 (Test 4): Time-dependent variations in water saturation and capillary pressure.
Water 17 02115 g005
Figure 6. Temporal evolution of water saturation and capillary pressure during imbibition.
Water 17 02115 g006
Figure 7. Time lag (Δt) between peak capillary pressure (PMAX) and minimum saturation (SMIN) across six drainage steps (a positive value indicates that the capillary pressure extremum point appears earlier than the saturation extremum point).
Water 17 02115 g007
Figure 8. Dynamic–static capillary pressure difference (ΔP) across six drainage steps.
Water 17 02115 g008
Figure 9. X-CT scanning images of Sand 1, Sand 2, Sand 3, and Sand 4 (black indicates pores, purple indicates sand particles, and yellow indicates the water films surrounding sand particles).
Water 17 02115 g009
Table 1. Grain size parameters for the four sands.
SandSand 1Sand 2Sand 3Sand 4
Size distribution/μm76–352211–756310–976586–2100
Median particle diameter (d50)/μm188417568988
Uniformity coefficient0.3010.1990.1730.208
Particle density/(g/cm3)2.662.672.672.70
Table 2. Calibration parameters for TDR and T5 tensiometer probes.
TDR T5
ab cd
S12.14590.0043P110.319−2.2861
S22.36410.0118P210.234−6.5081
S32.40380.0072P310.213−4.9278
S42.08330.0042P410.2190.0187
Table 3. DNE during multi-step drainage across discrete sand particle sizes.
Sand 1Sand 2Sand 3Sand 4
Steptptptptp
11014.07255.23153.03302.65
21012.30554.02502.43−51.99
34011.40203.45602.12−101.47
459.36252.86202.11201.29
5606.88202.57101.51−51.30
6402.33//////
Note: ∆t denotes temporal decoupling between capillary pressure peaks and water saturation minima (units: s). Positive Δt values indicate capillary pressure extrema preceding saturation minima, while negative values signify capillary pressure extrema lagging behind saturation minima. ∆p represents the differential between drainage-phase capillary pressure peaks and post-drainage equilibrium values (units: cm H2O). ‘/’ signifies the absence of both ∆t and ∆p.
Table 4. Residual water saturation corresponding to different grain sizes obtained from X-CT scanning images.
Test 1Test 2
Average size (d50)/µm188417
Residual water saturation0.2400.3640.3050.1020.1040.142
Test 3Test 4
Average size (d50)/µm568988
Residual water saturation0.0900.0940.0990.0860.0870.098
Disclaimer/Publisher’s Note: The statements, opinions and data contained in all publications are solely those of the individual author(s) and contributor(s) and not of MDPI and/or the editor(s). MDPI and/or the editor(s) disclaim responsibility for any injury to people or property resulting from any ideas, methods, instructions or products referred to in the content.

