Article

Kinetics of the Process DAF-Culture Nannochloropsis oculata Remove Nutrients, Improve Water Quality, and Evaluate Rheological Parameters, Providing an Ecological Method for Treating Complex Wastewater

by
Solmaría Mandi Pérez-Guzmán
1,
Alejandro Alvarado-Lassman
1,
Eduardo Hernández-Aguilar
2,
Roger Emmanuel Sales-Pérez
1 and
Juan Manuel Méndez-Contreras
1,*
1
División de Estudios de Posgrado e Investigación, Tecnológico Nacional de Mexico Campus Orizaba, Avenida Oriente 9 No. 852, Colonia Emiliano Zapata, Orizaba 94320, Veracruz, Mexico
2
Facultad de Ciencias Químicas, Universidad Veracruzana Campus Orizaba, Oriente 6 No. 1009 Colonia Rafael Alvarado, Orizaba 94340, Veracruz, Mexico
*
Author to whom correspondence should be addressed.
Water 2025, 17(14), 2113; https://doi.org/10.3390/w17142113
Submission received: 24 May 2025 / Revised: 4 July 2025 / Accepted: 10 July 2025 / Published: 16 July 2025
(This article belongs to the Topic Advances in Organic Solid Waste and Wastewater Management)

Abstract

Population growth has led to an increased volume of wastewater from industrial, domestic, and municipal sources, contaminating aquatic bodies in the state of Veracruz. This study aimed to assess the efficacy of a water treatment system incorporating a DAF stage, followed by the cultivation of a microalgal consortium to eliminate pollutants from the blended effluent. The cultivation of Nannochloropsis oculata in wastewater entailed the assessment of a single variable (operating pressure) within the DAF system, in conjunction with two supplementary variables (residence time and F:M ratio), resulting in removal efficiencies of 70% for CODt, 77.24% for CODs, 78.34% for nitrogen, and 77% for total organic carbon. The water sample was found to contain elevated levels of organic matter and pollutants, beyond the permitted limits set forth in NOM-001-SEMARNAT-2021. The obtained removal percentages indicate that the suggested physicochemical–biological process (DAF-microalgae) is a suitable method for treating mixed wastewater. This approach reduces atmospheric pollution by sequestering greenhouse gases such as carbon dioxide through the photosynthetic activity of N. oculata cells, so facilitating the production of oxygen and biomass while limiting their accumulation in the atmosphere.

Graphical Abstract

1. Introduction

The rise in the Mexican population and its economic activity has led to an escalation in water pollution. The overutilization of fertilizers and agrochemicals in agriculture, irrigation of crops with black water and manure, illicit industrial discharges into water bodies, and inadequate wastewater treatment substantially exacerbate the issue [1], alongside the presence of volatile and semi-volatile organic contaminants in rainwater, domestic, and municipal waters [2].
In 2021, CONAGUA studied 2764 aquifer deposits across the country and found that 72% had high levels of fecal coliforms, and at least 60% had different types of contaminants [3]. The contamination of water bodies in Mexico constitutes a challenge not only for aquatic ecosystems but also presents a significant threat to human health. In 2019, intestinal illnesses from contaminated drinking water led to 353 fatalities among children under one year old, ranking as the sixth greatest cause of death in this population [4]. To avert the pollution of aquifers by these toxins, it is essential to pursue practical and environmentally advantageous wastewater treatment technologies. The approaches for water treatment include the DAF system, or dissolved air flotation, as well as the application of several microalgal species.
The DAF system technology operates by generating bubbles through the high-pressure dissolution of air in an aqueous medium. Suspended solids adhere to the bubbles, resulting in a supernatant that can later be extracted using a skimming device [5]. Using a DAF system can remove up to 80% of turbidity, 72% of total phosphorus, 71% of chlorophyll, and 61% of COD from wastewater [6]. To reach these levels of organic compound removal, several things need to be taken into account, such as how long the water stays in the system, the pH of the wastewater, the flow of recycled water, the pressure in the saturator, and the size of the bubbles, all of which greatly affect the final outcomes [7].
The implementation of a DAF separator in wastewater treatment is an effective and cost-efficient technology [8], although superior removal efficiencies are attained when it is integrated with physicochemical or biological techniques [9]. This study will utilize two kinds of microalgae as supplementary biological treatments for wastewater.
Nannochloropsis oculata is a unicellular marine microalga distinguished by its sub-spherical or cylindrical morphology, ranging in size from 2 to 4 mm. The chemical composition comprises 0.89% chlorophyll, 52.11% proteins, 16% carbs, and 27.64% lipids [10]. Furthermore, it comprises antioxidants such astaxanthin, zeaxanthin, and canthaxanthin, as well as polyunsaturated fatty acids such as eicosapentaenoic, arachidonic, and docosahexaenoic [11]. Thus, these characteristics confer anti-inflammatory and anticancer advantages, making its biomass a viable choice for medicinal applications [12]. Conversely, research suggests that this microalgal species can flourish in residual substrates [13], despite its limited applicability. Reyimu & Özçimen [14] demonstrate that this species can endure 100% concentration of wastewater as a substrate, while optimal cell density is achieved at concentrations between 50% and 75% of effluent combined with culture medium. Furthermore, N. oculata has the capability to adapt and produce microalgal biomass by assimilating macronutrients, including nitrogen and phosphorus, found in wastewater [15].
This work proposes an approach that generates synergy between the two treatment procedures. DAF is utilized to separate undissolved pollutants from wastewater and diminish turbidity [16]. This promotes the development of microalgae due to enhanced light availability. Moreover, microalgae cultures can eliminate 96% of the soluble Chemical Oxygen Demand (COD) from wastewater [17]. This study involved the treatment of blended wastewater utilizing the DAF system, followed by the cultivation of the microalgal species Nannochloropsis oculata. The former addresses the removal of substantial suspended particles and turbidity within the sample, whereas the microalgae serve to eliminate the organic matter found in the water.

2. Materials and Methods

2.1. Sampling and Physicochemical and Microbiological Characterization of Combined Wastewater

A water sample contaminated with pollutants was collected from the treatment plant’s collector situated in the central region of Veracruz, which handles 750 L/s of wastewater. The comprehensive physicochemical and microbiological analyses performed, along with the equipment and regulations employed, are presented in Table 1.

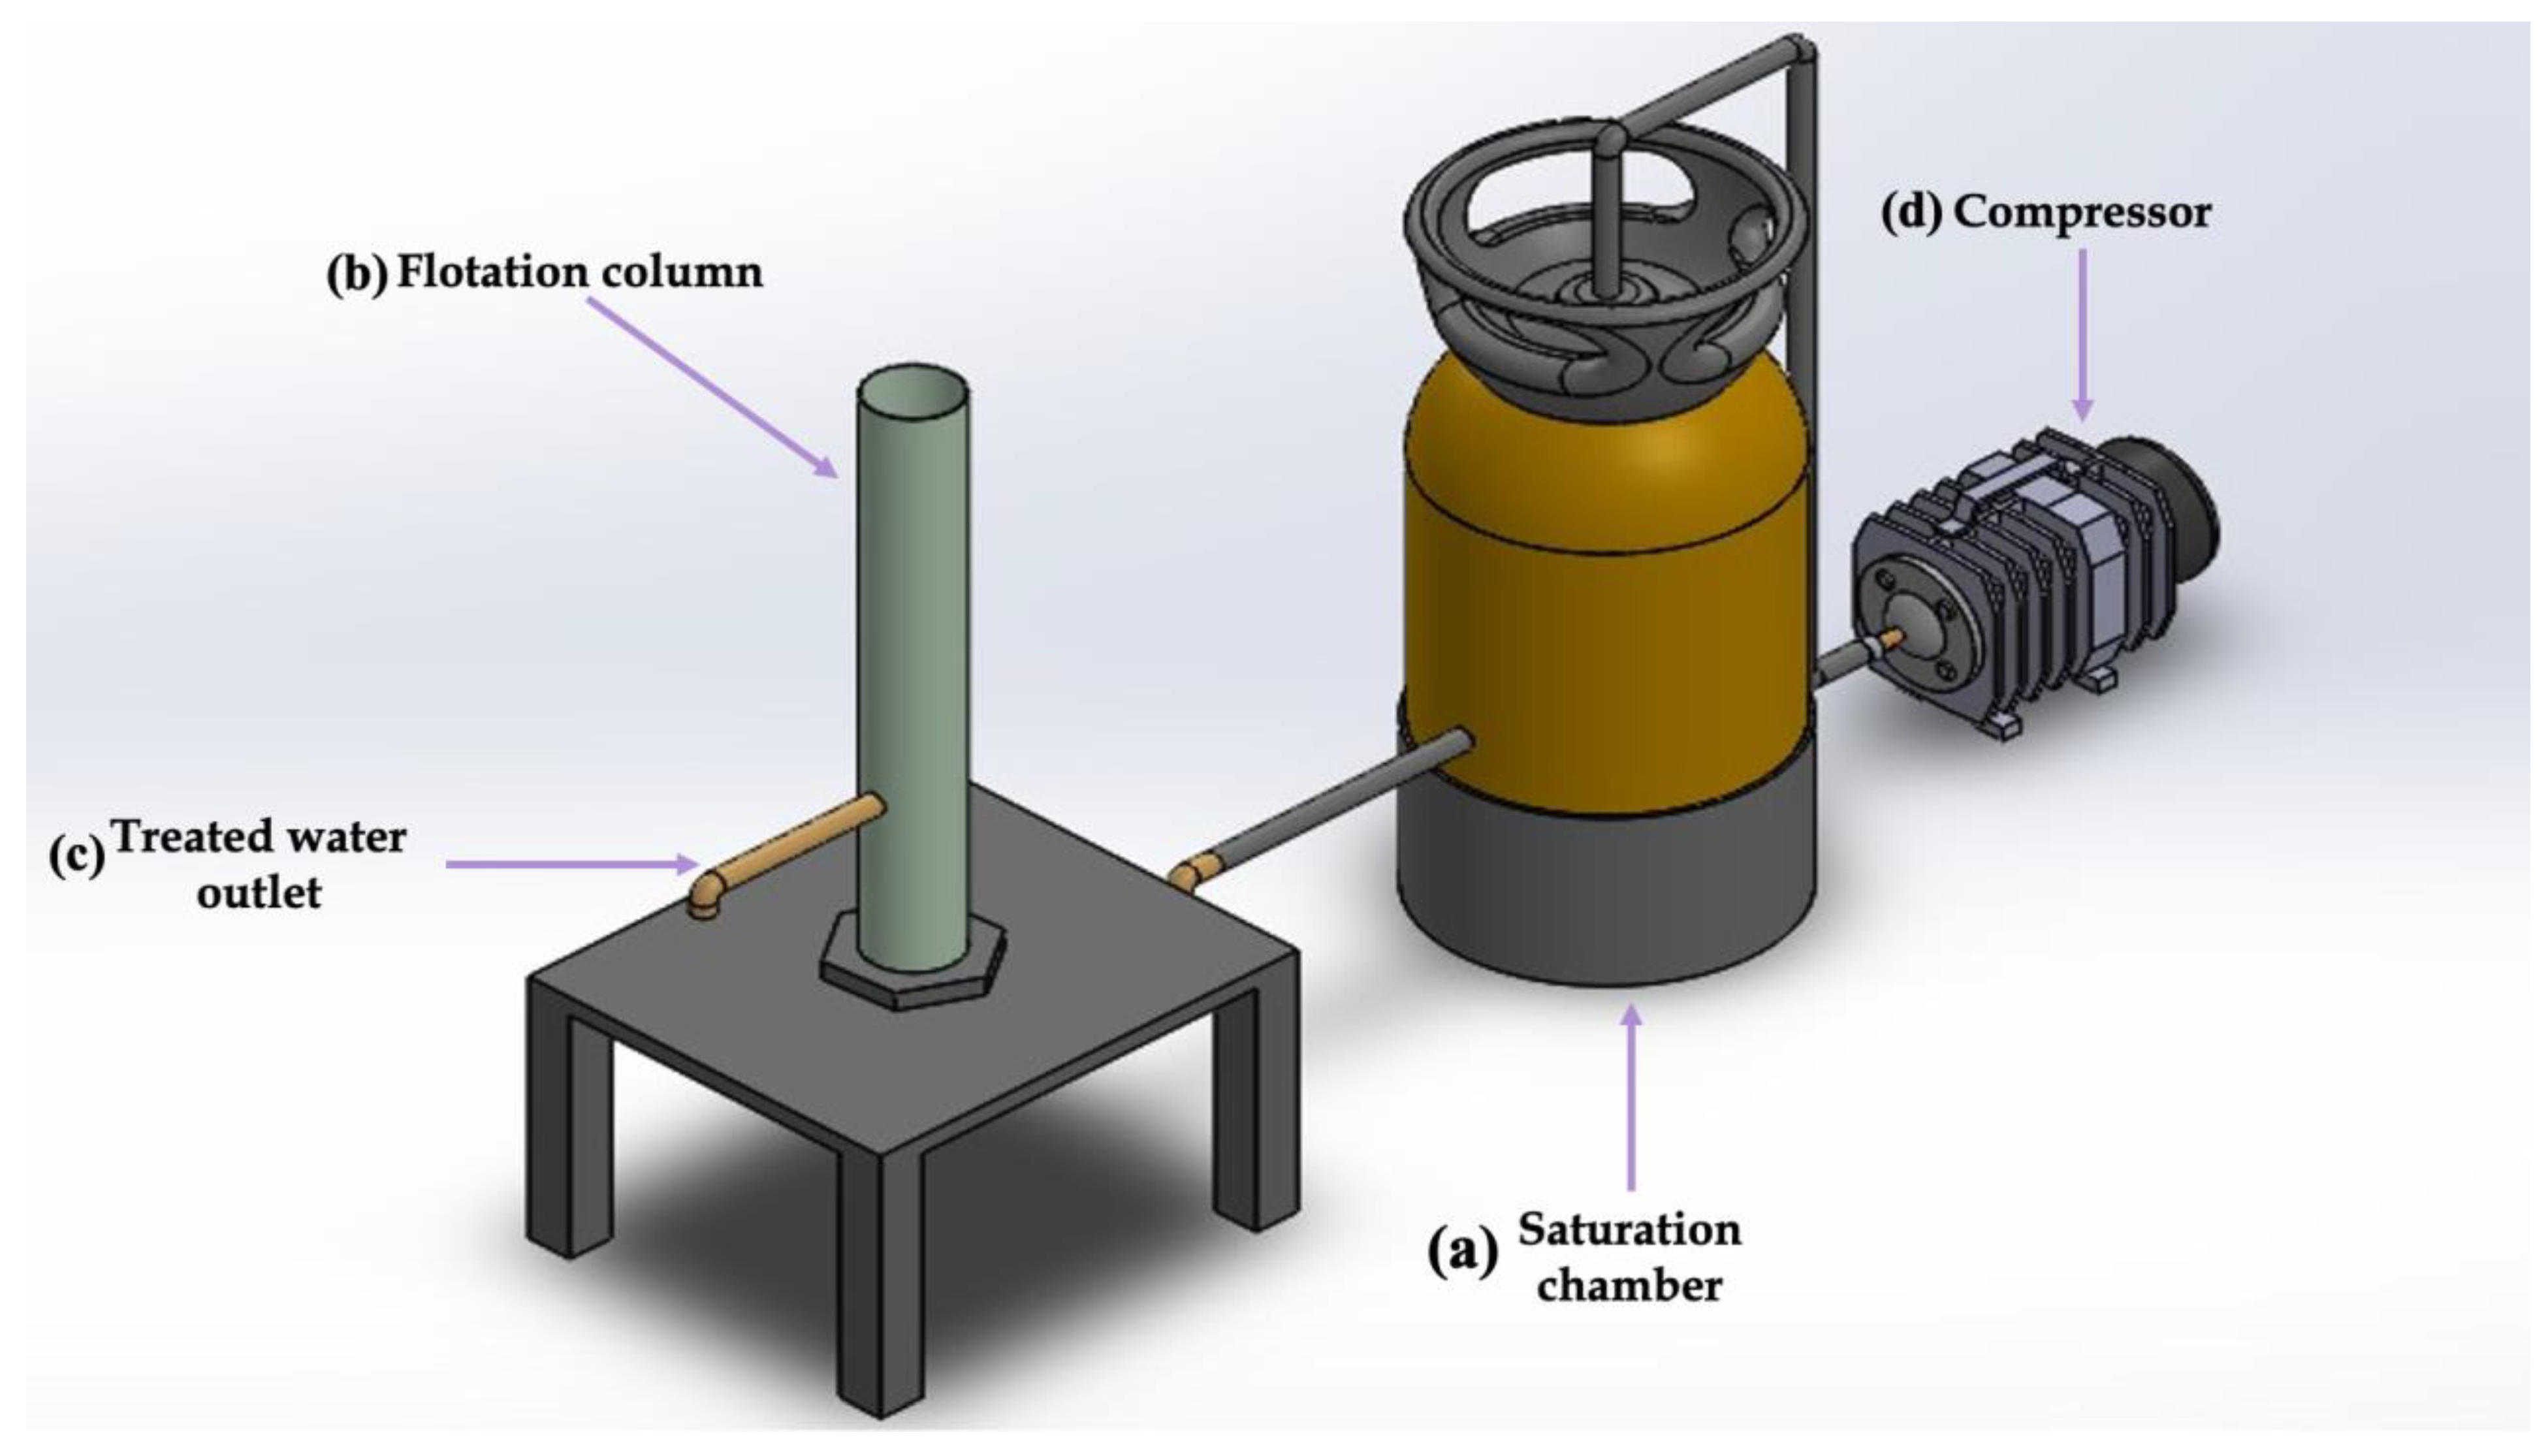
2.2. Implementation of the Dissolved Air Flotation System

A laboratory-scale experimental setup of the DAF system was constructed for the primary treatment of the sampled wastewater. This setup functions as a physicochemical treatment and includes a pressurizing tank and a separation tank. The body of the saturation chamber (Figure 1a) is constructed from high-strength polyethylene terephthalate. At the top, there is an opening measuring 4 cm in diameter for sample introduction, alongside a 5/8” hose that transports high-pressure air from the compressor. This hose connects to a diffuser with a 4 cm diameter and a 40 cm long hose featuring uniform 1 mm perforations. An opening was created on the wall, allowing for the introduction of a net during aeration, serving as a manual skimmer for the sludge. At the base of the tank, a male-threaded connector crafted from stainless steel was installed, paired with a female connector. This setup was linked to a section of pipe featuring a T-joint with two outlets: one equipped with a ball valve functioning as a sludge trap, and the other outlet connected to a 70 cm section of pipe that channels the treated water to the separation tank. The saturation chamber features a diameter of 0.2286 m, a height of 0.6 m, an additional height of 0.02 m, a total capacity of 20 L, and a functional volume of 15 L. The flotation column is mounted on a wooden base (Figure 1b).
The flotation column was linked to the pipe outlined in the preceding section, designed to contain the clarified water within the pressurized tank. A polyurethane container was utilized for its construction, featuring a capacity of 2.4 L, a diameter of 13.2 cm, and a height of 25 cm. The outlet for the treated water (Figure 1c) was constructed using a ½” elbow, which was attached to 15 cm of piping and a nose valve. The construction of the reactor utilized piping and connectors composed of random copolymer polypropylene (PP-R). To generate high-pressure air, an industrial TATSA® brand compressor was utilized (Figure 1d), featuring a capacity of 302 L/s, a diameter of 51 cm, a length of 165 cm, a thickness of 4.7 mm, and a maximum working pressure of 200 PSI. The materials employed in the construction of the laboratory-scale DAF experimental setup are appropriate for enduring the necessary pressures. The setup of the equipment is similar to that of a conventional DAF system.

2.3. Operating Conditions of the DAF System

After the construction of the DAF system, it was activated utilizing the sampled contaminated water. The residence time recorded was 7 min, which is suitable for its operation on laboratory scale [28] in a batch process with a recirculation volume of 1 L/min, and the coagulant used was a 250 ppm/L solution of Al2(SO4)3, as established through a preliminary jar test for that specific effluent. The equipment was operated at a saturation pressure of 40 PSI, the minimum specified by Fanaie et al. [29] to produce microbubbles sufficient for generating a supernatant.

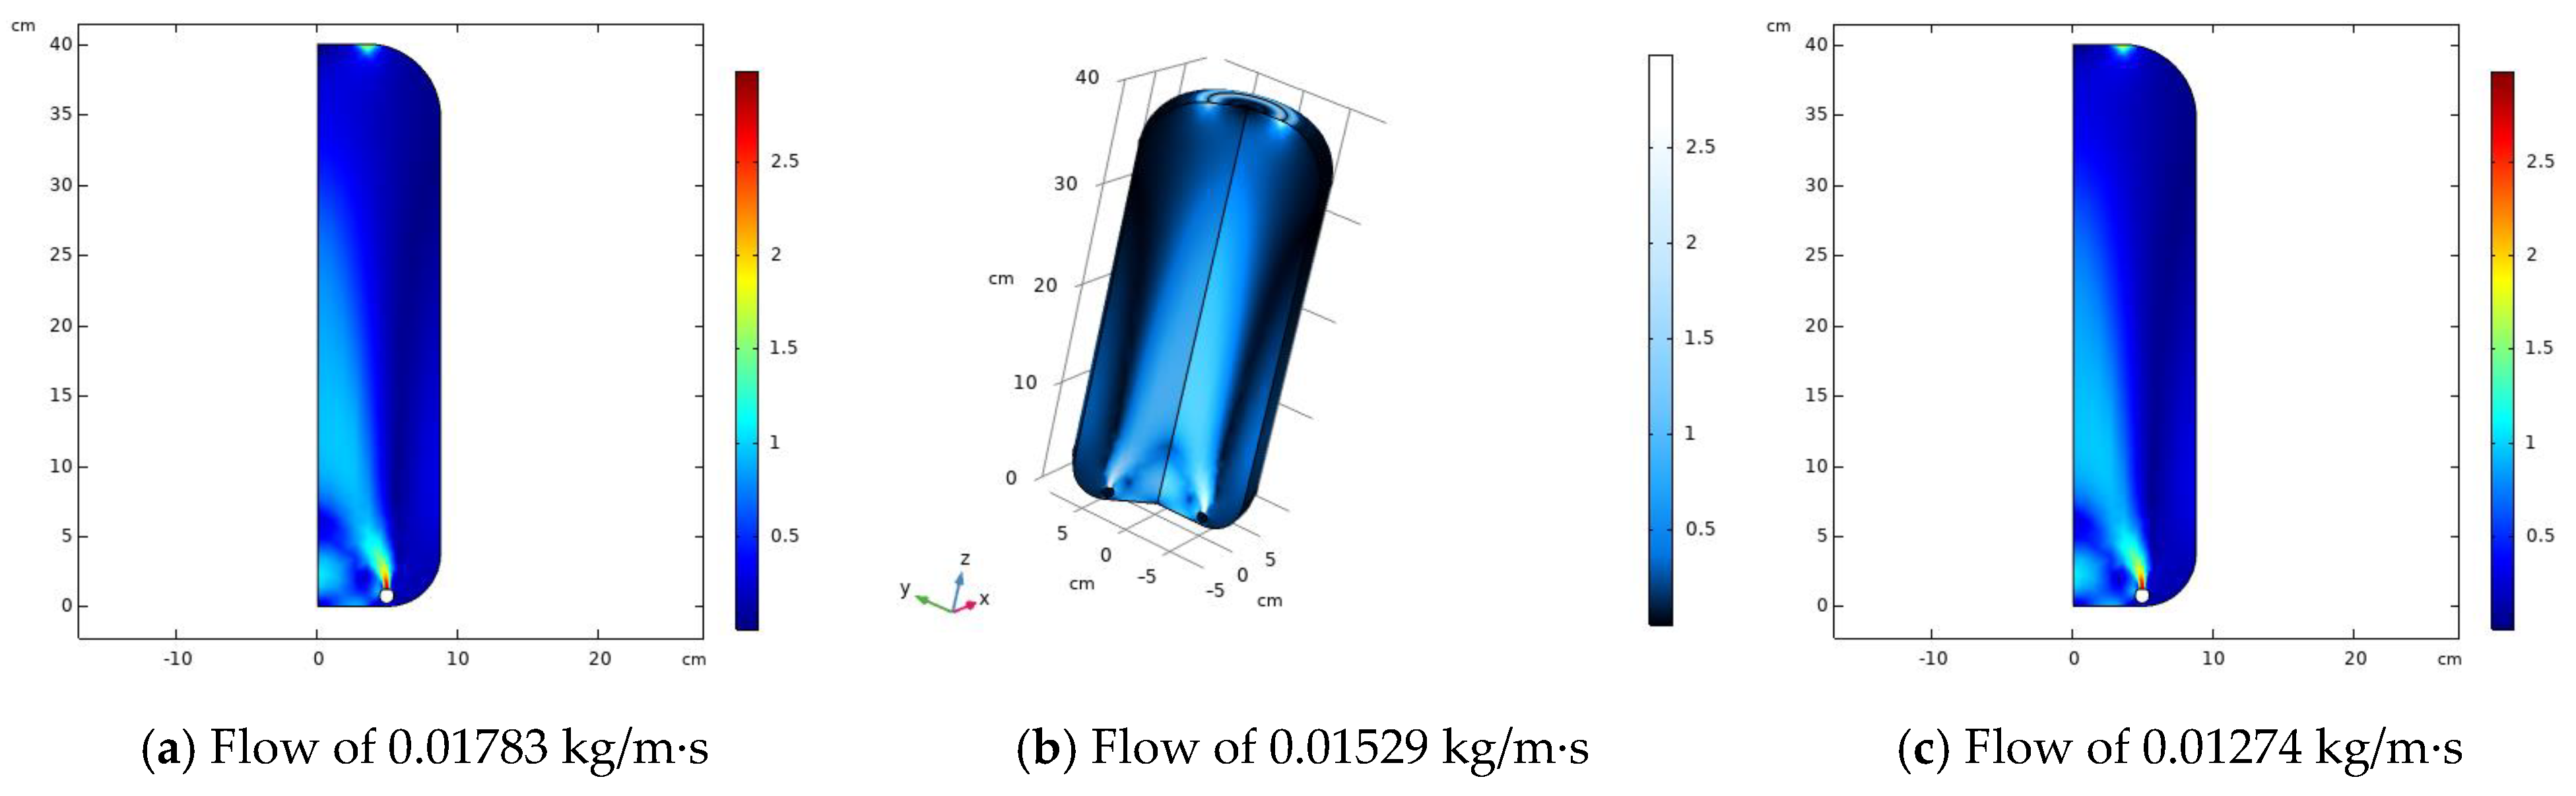
2.4. CFD Simulation of the Compressor Tank

The Comsol® Multiphysics 5.4 program was utilized to create the two-dimensional axial geometry of the pressurized reactor for the DAF system, adhering to the previously defined parameters. The air compressor has a volumetric flow rate of 70 L/min and a bubble exit velocity of 2.982 m/s. The flow rates employed in this study were 0.01783, 0.01529, and 0.01274 kg/m·s. Water was incorporated as the liquid phase and air as the gaseous phase in the reactor within the materials portion. The assessed system is biphasic, featuring suspended or dispersed bubbles; thus, the “Bubbly Flow Re k-e” physical model with a coarse mesh was employed from the software library. Furthermore, to ascertain the flow type within the pressurizer, the Reynolds number was computed utilizing the modified equation proposed by Gutiérrez-Casiano et al. [30]:
R e = ρ   D B U B μ
where ρ is the fluid’s density in kg·m−3, D B is the bubble diameter in m, U B is the bubble speed in m/s, and μ is the viscosity of the fluid in Pa·s.

2.5. Rheological Characterization of the Effluent

A Brookfield® model DV2T rotational viscometer equipped with a ULA spindle and connected to a Brookfield® thermostatic bath was utilized to determine the rheological properties of the contaminated water. Experiments were carried out at four distinct temperatures, 20, 25, 30, and 40 °C, with rotational speeds ranging from 0 to 200 RPM in increments of 10 RPM. The data for shear force and cutting speed were plotted and analyzed using the Herschel–Bulkley and Ostwald–de Waele rheological models in Minitab® 17 Statistitcal Software.
After the completion of wastewater treatment, rheological tests were performed at room temperature (25 °C) on the samples collected from the DAF system and the microphotobioreactors (Mexico City, Mexico). The results were then analyzed by fitting them to the Ostwald model to assess the fluid behavior.

2.6. Obtaining and Propagating the Microalga Nannochloropsis Oculata

The Nannochloropsis oculata strain was obtained from a biological species repository in Mexico City. Thereafter, it was cultivated in the Guillard’s F/2 mineral medium, adjusted to a pH of 6.8 ± 0.2. The constituents per liter for the macronutrient solution are as follows: NaNO3 (0.8 g/L, FAGALAB®, CAS 13477-34-4), CaCl2·2H2O (0.025 g/L, Cicarelli®, CAS 10035-04-8), KH2HPO4 (0.05 g/L, JT Baker®, CAS 7778-77-0), MgSO4·7H2O (0.5 g/L, Cicarelli®, CAS 10034-99-8), and NaCl (27 g/L, FAGALAB®, CAS 7647-14-5). The micronutrients or trace metals and their amounts are H3BO3 (2.8 mg/L), MnCl2 (1.8 mg/L), ZnSO4·7H2O (0.2 mg/L), Na2MoO4·2H2O (0.4 mg/L), CuSO4·5H2O (0.08 mg/L), and CO(NO3)2·5H2O (0.05 mg/L).
This culture media is a water-soluble mineral particularly designed for the development of marine microalgae. The inorganic components facilitate the maintenance of axenic conditions in microalgal cultures. Laboratory-scale photobioreactors with a total volume of 2 L were employed to seed and proliferate the microalgae. The temperature was kept at 25 °C, with air being pumped in at a rate of 1500 cc per minute and a pressure of 3.5 PSI, which helped provide CO2 from the air and kept the microphotobioreactors mixed. Cold light LED bulbs of 20 W with an intensity of 35 μmol/m2·s were utilized for the lighting with light and dark photoperiods of 12 h each.

2.7. Growing Microalgae in Wastewater

The growth kinetics were performed at the laboratory scale in microphotobioreactors with a capacity of 600 mL and an effective volume of 500 mL (Figure 2). The photobioreactors with the microalga cultivated in contaminated water were maintained under the same temperature and lighting conditions described in the previous section. Likewise, such reactors were completely mixed due to the bubbling of pressurized air supplied by the aeration pumps. The temporal conditions and F:M ratio (Food/Microorganism) are delineated in the experimental design.

2.8. Modeling of Microalgal Cell Growth by Mathematical Methods

The behavior of microalgal cells was characterized using the modified Gompertz model as presented in Equation (2):
Y = a e x p ( exp b c T )
In this context, Y is L o g N T N 0 , a denotes the maximum population as time approaches infinity in L o g c e l m L , b is the product of the particular growth rate multiplied by the lag phase plus the maximum population plus one ( μ m a x G λ a ) + 1, and c signifies the lag or latency rate ( μ m a x G λ a ) [31].

2.9. Experimental Design

A completely randomized single-factor design with three replicates was utilized to ascertain the optimal working pressure of the DAF pressurizer. The studied factor was pressure, assessed at three levels: 40, 50, and 60 PSI. Four responses were measured: total and soluble COD, turbidity, and true color, both pre- and post-DAF treatment. The minimal pressure identified by Kim et al. [32] was chosen as the reference point, and thereafter equidistant pressure values were established.
To assess the second phase of the treatment, the adaptation of microalgae to the residual substrate was conducted employing a 32 experimental design, with residence time and the F:M ratio (substrate/inoculum) as factors. The residence time levels were 11, 16, and 21 days, while the wastewater concentration levels were 70, 80, and 90%, as recommended by Sirin et al. [33] for the proliferation of N. oculata, as detailed in Table 2. The assessed parameters comprised total COD, soluble COD, total organic carbon, nitrogen, biomass, cell density, and pH levels. The maximum growth days were determined based on the value published by Martínez-Macías et al. [34]. To diminish the error rate, the data were gathered in triplicate.

2.10. Statistical Techniques

The experimental results from the DAF stage were recorded in Microsoft Excel® 2021. Afterwards, a one-way analysis of variance (ANOVA) was carried out using Minitab® 17 Statistical Software (Minitab LLC, State College, PA, USA).
Data regarding the treatment of water with N. oculata were gathered, and for statistical analysis Minitab® 17 software was utilized, conducting an ANOVA via the general linear model with 95% confidence, succeeded by a multiple mean comparison using Tukey’s HSD test (p ≤ 0.05), in addition to the creation of mean comparison graphs.

3. Results and Discussion

3.1. Physicochemical and Microbiological Characterization of the Sample

Table 3 presents the results from the preliminary characterization of the physical, chemical, and microbiological characteristics examined in the wastewater, alongside the maximum allowable pollutant levels in water as stipulated by NOM-001-SEMARNAT-2021. The pH is mildly acidic, with a temperature around ambient, remaining below the maximum threshold specified by NOM-001 of 35 °C [35]. The sample exhibits low total and soluble COD levels, together with minimal total solids, facilitating its removal and treatment. The turbidity value reflects the concentration of suspended organic materials.
Dissolved oxygen serves as a metric for water quality; a higher percentage facilitates the rapid degradation of pollutants, hence expediting the natural purification of water. Marine organisms necessitate a minimum of 5 mg/L of oxygen, with saturation levels ranging from 80% to 120% for survival [36]. The result obtained fails to satisfy the specified minimum, potentially resulting in the asphyxiation of aquatic biota. No helminth eggs were detected in the microbiological parameters.

3.2. CFD Simulation of Pressurizer Tank

The outcomes derived from each of the previously specified flow inputs are illustrated in the subsequent figures. (Figure 3a,c) indicate that the maximum flow velocity (in red) of 2.5 m/s occurs in proximity to the air diffuser, approximately within the initial 5 cm of the reactor.
Conversely, in Figure 3b, it is evident that the flow converges towards the reactor’s central region, whereas the lateral edges (depicted in dark blue) exhibit low air velocity ranges, fluctuating between 1 and 0.5 m/s, potentially resulting in diminished microbubble generation in the upper section of the tank.
In the DAF system, flows exhibiting Reynolds numbers and velocities exceeding 1 and 0.008 m/s, respectively, are classified as turbulent [37]. This condition is advantageous in water treatment reactors utilizing biphasic systems, as it enhances the interaction between dissolved air and suspended particles in wastewater [38]. The examined pressurizer exhibits a turbulent regime, characterized by a main air flow velocity of 0.7 m/s and a Reynolds number of 118.76.

3.3. Reological Analysis of the Sample

The equations and rheological parameters for each assessed model are shown in Table 4 and Table 5. In both rheological models, the flow index, n, exceeds one, signifying that the fluid is non-Newtonian and dilatant. The consistency index, K, quantifies a fluid’s resistance to deformation and is directly influenced by the sample’s chemical composition and temperature [39]. The viscosity remains constant in both models, exhibiting a decrease with rising temperature (Table 5). This parameter was further up in the part regarding the Herschel model due to spatial constraints. Shear stress and viscosity exhibit an inverse correlation with temperature; as they decrease, shear force escalates, and conversely (Figure 4). The rise in temperature diminishes the cohesive forces binding the particles, hence simplifying the fluid’s chemical structure [40].
Although both models showed good fit for the rheological data, the null result in the yield stress ( τ = 0 ) in the Herschel–Bulkley equation reduces it to the Ostwald one, since the former includes the latter [41], which implies that for high temperatures the Ostwald model is suitable and the Herschel model can be used for temperatures similar to or lower than the ambient.
When plotting the shear rate against the shear force, a characteristic curve of dilatant fluids was obtained, as shown in Figure 4, consistent with the flow index value. This type of fluid is characterized by an increase in viscosity as the applied shear rate increases.
In Table 6, the values obtained for each of the rheological variables measured in the samples after each stage of wastewater treatment are described. It can be observed that the three parameters, consistency index, flow index, and viscosity, increase as the process advances, which indicates that the presence of suspended solids increases the complexity of the fluid, raising its apparent viscosity and resistance to movement [42].
This is confirmed by the rheogram in Figure 5. At the end of the last stage of wastewater treatment, that is, using microalgae, the fluid exhibits greater shear stress, as the high concentration of cells generated in the form of microalgal biomass creates particle–particle interactions that influence the previously mentioned rheological variables [43].
The study of rheological properties in contaminated or wastewater is important for the design of pumping, mixing, and hydrodynamic systems, and monitoring in the treatment of these effluents [44]. The Newtonian and Bingham models were excluded due to the curvature of the rheogram. The rheological behavior of the wastewater aligns with the Ostwald–de Waele model and is comparable with findings from earlier studies involving microalgae growing in the wastewater treatment process [30].

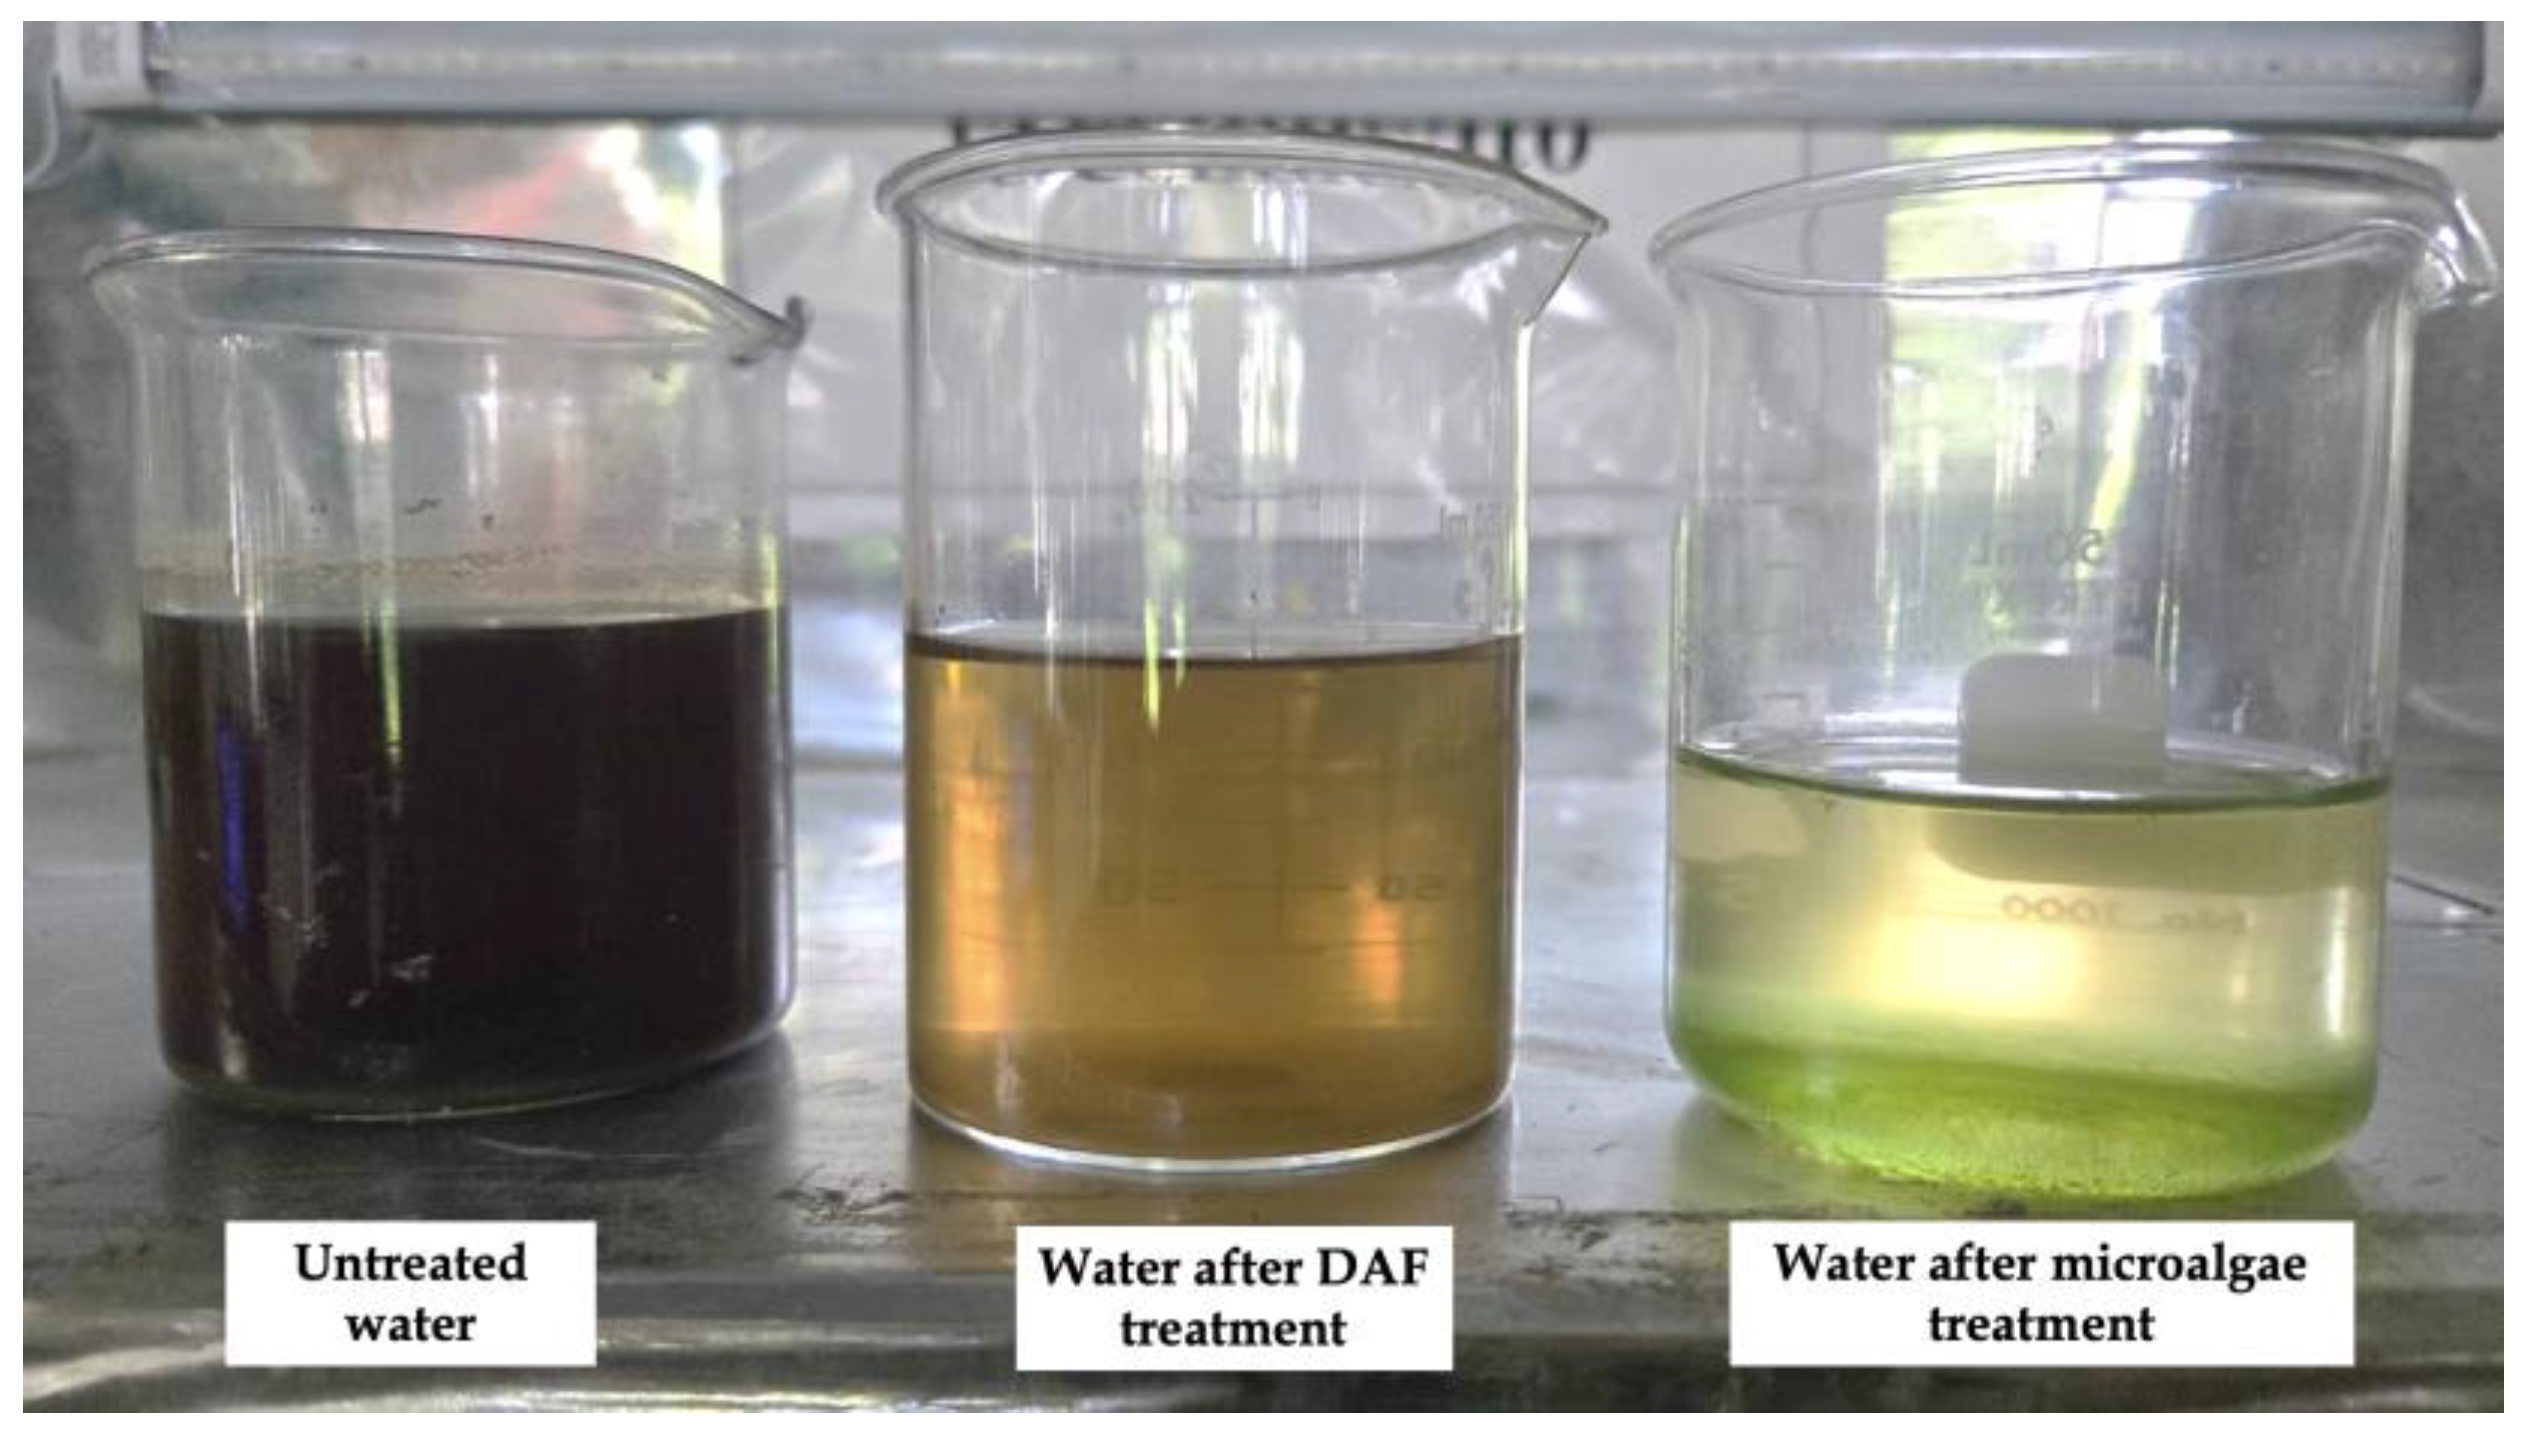
3.4. Primary Treatment of Wastewater with the DAF System

The results of the primary treatment of the contaminated waters are presented in Table 7. These are compared with the values of untreated raw water. After treatment in the DAF system, the removal percentages for total COD were 29.19%, 10.01%, and 5.76% for pressures of 40, 50, and 60 PSI, respectively, while the removal percentages for soluble COD were 17.92%, 27.52%, and 39.54%, corresponding to the same pressures previously described.
Although the saturation pressures of 50 and 60 PSI showed good results in terms of turbidity removal, the best result was obtained at 60 PSI, as it yielded the lowest reading. On the other hand, the color parameter also showed better results at the higher pressure used in the DAF system.
The results were compared with those reported by Díaz-Díaz et al. [45], who treated water contaminated with oils from a refinery using dissolved air flotation. It can be noted that the DAF system has a greater capacity to reduce total COD, turbidity, and true color compared with oily waters, which can be attributed to the nature of the samples.
Pimiento et al. [46] obtained 87% removal of COD in wastewater from the food industry using the DAF system; the difference in removal can be attributed to the nature of the samples used in the experiments. All parameters show a tendency to decrease with treatment in the DAF system, but better results were obtained using a higher pressure of 60 PSI; however, this may mean higher energy consumption. In Figure 6, the main effects graphs for each of the parameters evaluated during the wastewater treatment in the DAF system are shown. The total COD reading was lower when using 40 PSI (Figure 6a), while for the soluble COD, the lowest value was observed at 50 PSI (Figure 6b). Regarding turbidity (Figure 6c) and pH (Figure 6d), an inverse relationship was observed; higher pressure resulted in lower values. Increased pressure leads to the production of more microbubbles that attach to the particles, creating a supernatant that is later removed, hence decreasing the sample’s turbidity [47].
For true color, the lowest indices were obtained at 40 PSI in 620 nm (Figure 6g), while the lower wavelength, 436 nm (Figure 6e), showed less coloration at 60 PSI. The measurement of true color at three wavelengths allows for an analysis of the sample in the visible spectrum range [48].
The results obtained indicate that the dissolved air flotation system is effective in the removal of contaminating macroparticles in wastewater and/or contaminated water.

3.5. Secondary Treatment of Wastewater with Nannochloropsis Oculata

3.5.1. Removal of COD

The total COD (Figure 7a) had a removal of 90.83% at 70% concentration, 42.29% at 80%, and 57.82% at 90%. A complete reduction of the organic matter present in the samples was not achieved, as part of it consists of the algal cells generated as well as the organic compounds released by these organisms during the process [49].
It is observed that the bacteria–microalgae consortium performs better in the removal of organic matter when cultivated in the lowest concentration of wastewater; that is, at 70%. This treatment attained a final concentration of 75.18 mg/L of total COD, adhering to the Mexican regulation that stipulates a maximum acceptable limit of 150 mg/L of total COD [35]. This performance is comparable to previous microalgae water treatment systems, including the one examined by Gutierrez-Casiano et al. [30], which resulted in 200 mg/L residual total COD. This experiment similarly indicated that the suggested treatment train is comparable to current technologies, such as activated sludge, which attain residual COD levels of up to 50 mg/L in the treated effluent [50]. The analysis of variance revealed significant differences in days (p-value 0.014) and interaction between factors (p-value 0.0001), with a confidence range of 0.05.
The removal percentages for soluble COD were recorded as follows: 57.23% at 70% concentration, 38.12% at 80%, and 77.24% at 90% inoculum. The presence of organic matter as microparticles that remain suspended during centrifugation also influences the CODs (Figure 7b). ANOVA revealed significant differences in F:M ratio (p-value 0.0001), days (p-value 0.0001), and their interaction (p-value 0.0001).

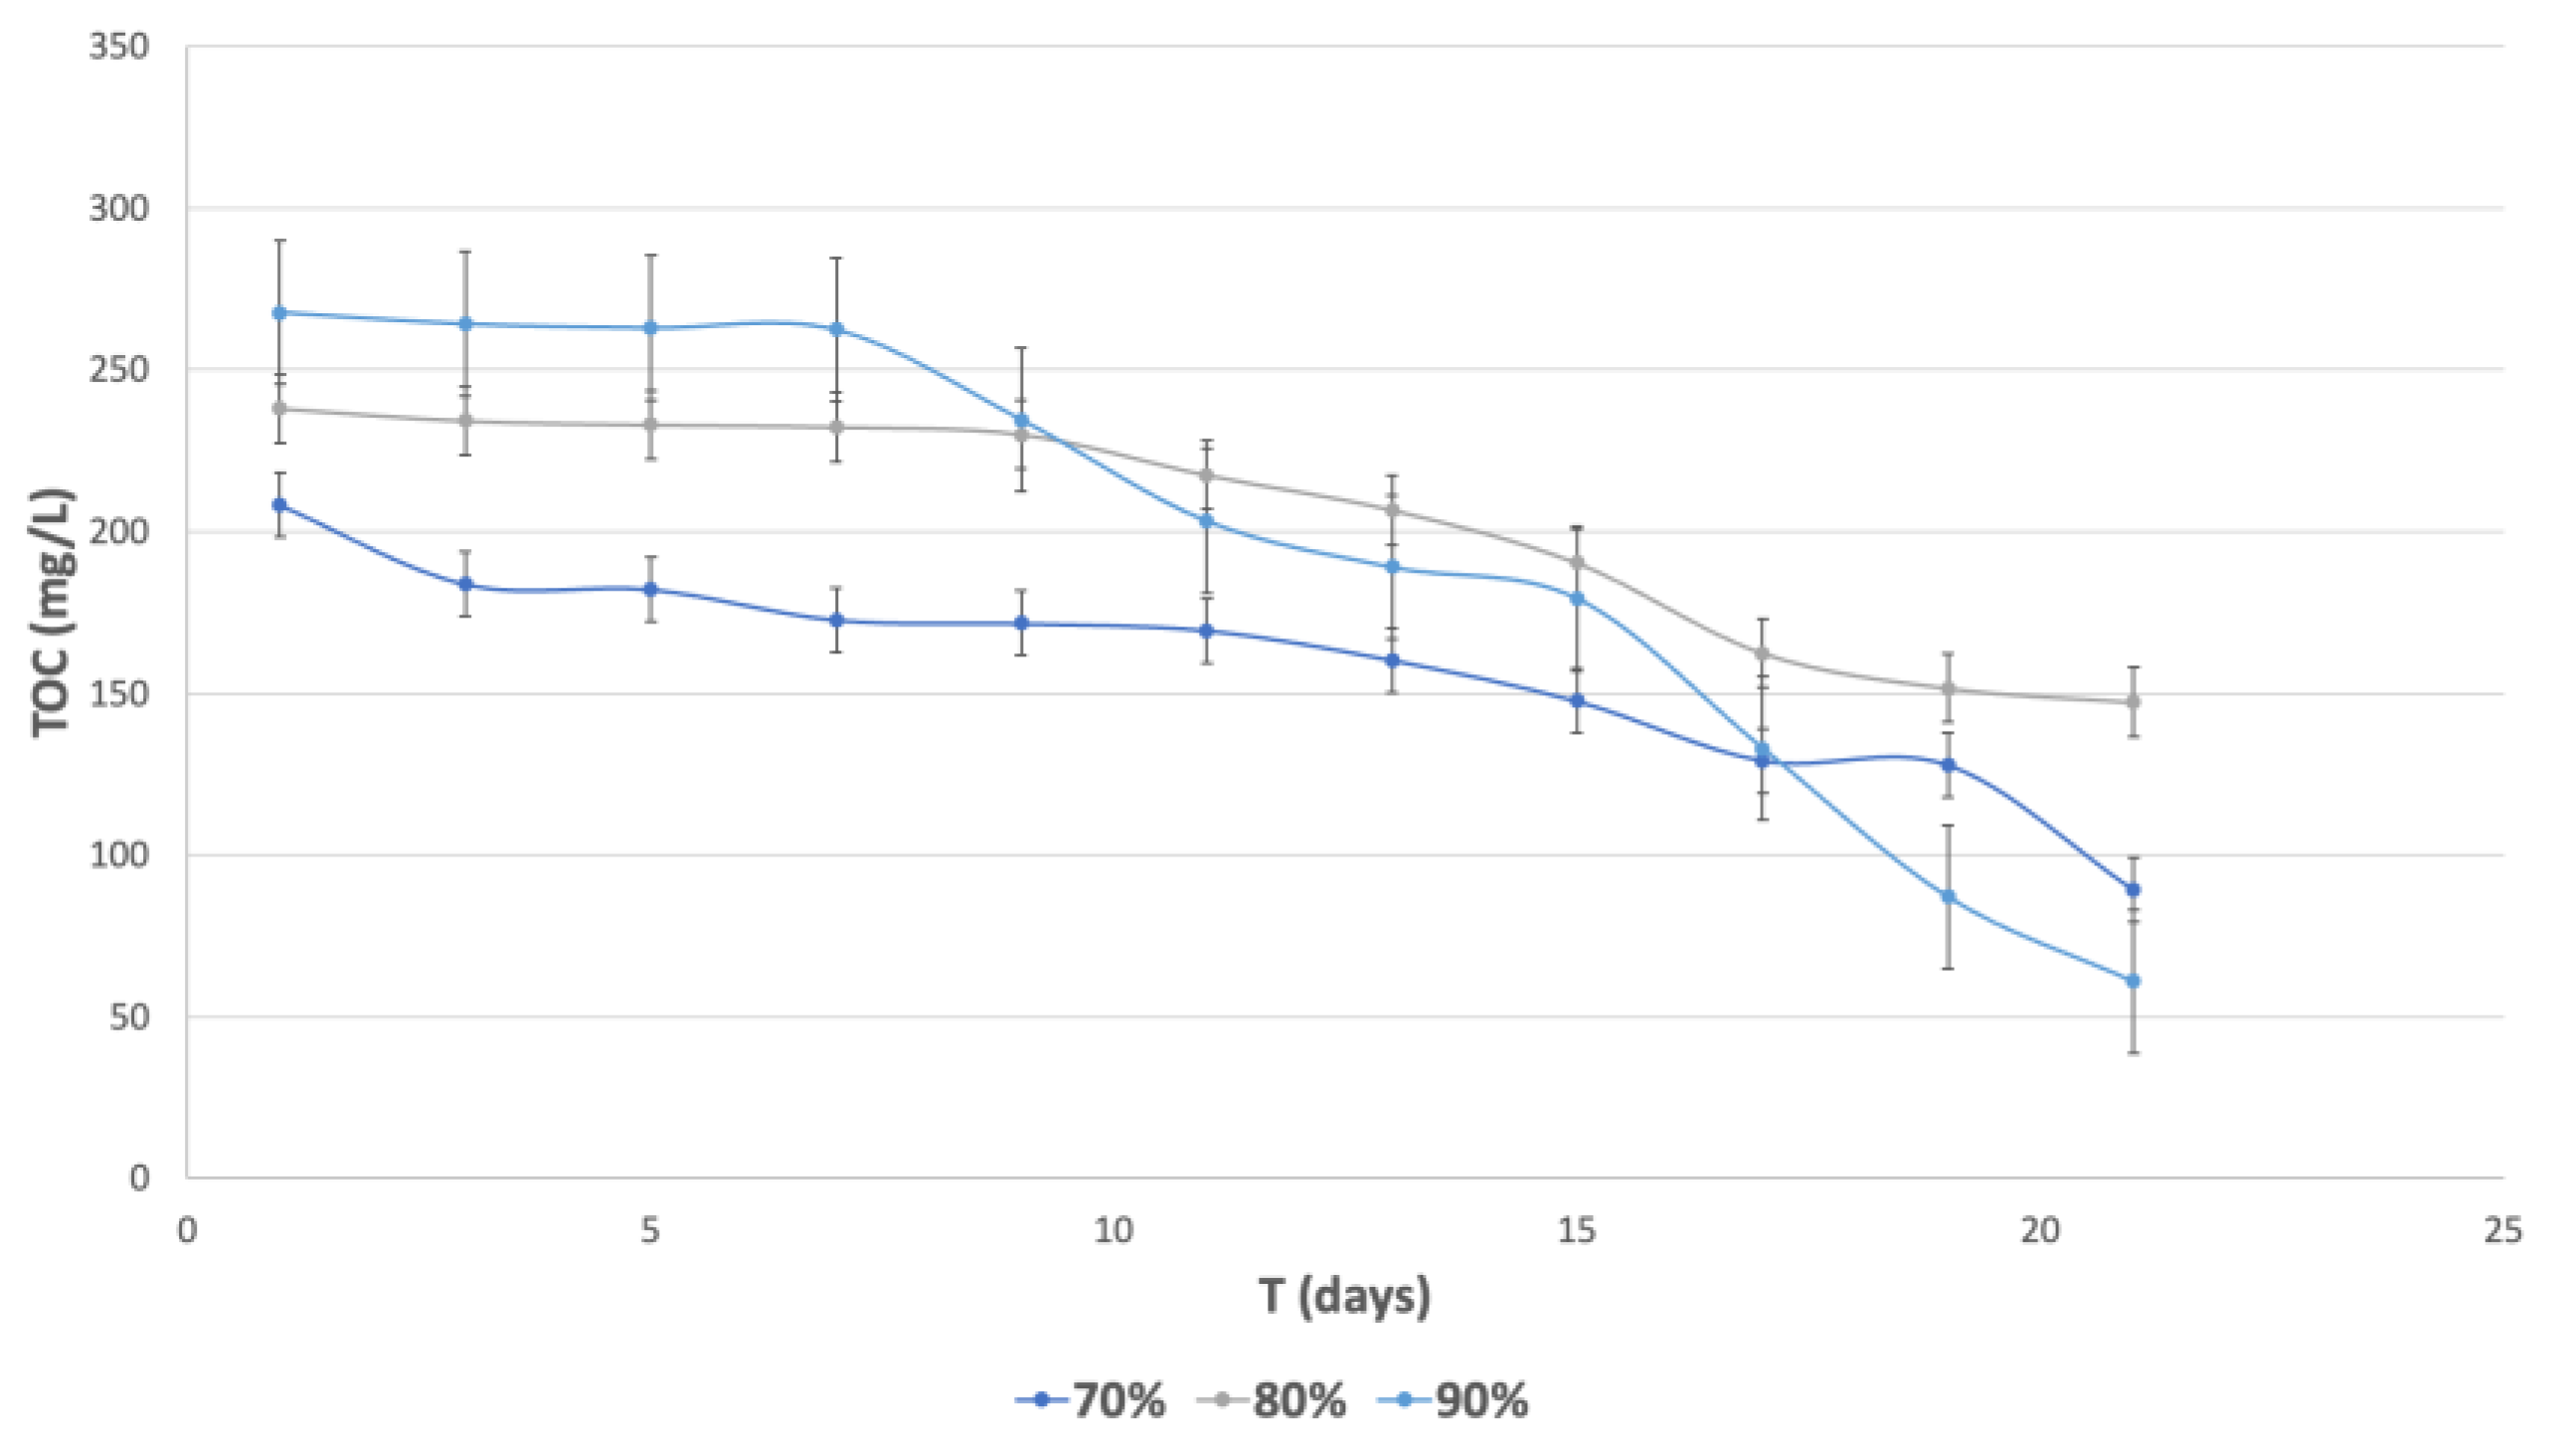
3.5.2. Removal of Total Organic Carbon

This parameter indicates the amount of carbon present in a sample in different oxidation states, and it is used as an indicator of water quality, although less frequently than COD [51]. The removal percentages were 57.23% at 70% concentration, 38.13% at 80%, and 77.24% at 90%. In all three cases, we see a drop in TOC in the sample (Figure 8), which happens through the Calvin–Benson cycle that captures CO2 during photosynthesis and turns it into glucose for the microalgae’s energy. This mechanism makes them suitable for reducing greenhouse gases and generating and releasing oxygen into the environment [52].

3.5.3. Removal of Nitrogen

The highest removal of this compound was carried out in the reactors with the highest concentration of wastewater, reaching 78.34%, while the reactor with the 80% concentration removed 44.88% and the 70% concentration achieved 52.75% (Figure 9). The ammonium ion is the nitrogen compound easily assimilated by microalgae [53]. This ammonia is absorbed into the cellular structure of the microalgae by glutamine synthetase (GS) and glutamate synthase (GOGAT) enzymes via the GS-GOGAT pathway, thereby promoting the fixation and conversion of carbon and nitrogen into amino acids and biomass [54].

3.5.4. Biomass Generation

The CO2 supplied through aeration, as well as nitrogen and phosphorus present in the contaminated water, are chemical requirements necessary for photosynthesis [55], which leads to the reproduction and generation of biomass. It can be observed in the three percentages that starting from day 17, the generation of microalgal biomass decreases, attributable to the microalga’s life cycle or the consumption of the aforementioned nutrients (Figure 10). The analysis of variance revealed significant differences in the F:M ratio (p-value 0.0001), the days (p-value 0.0001), and their interaction (p-value 0.0001), with a confidence range of 0.05.

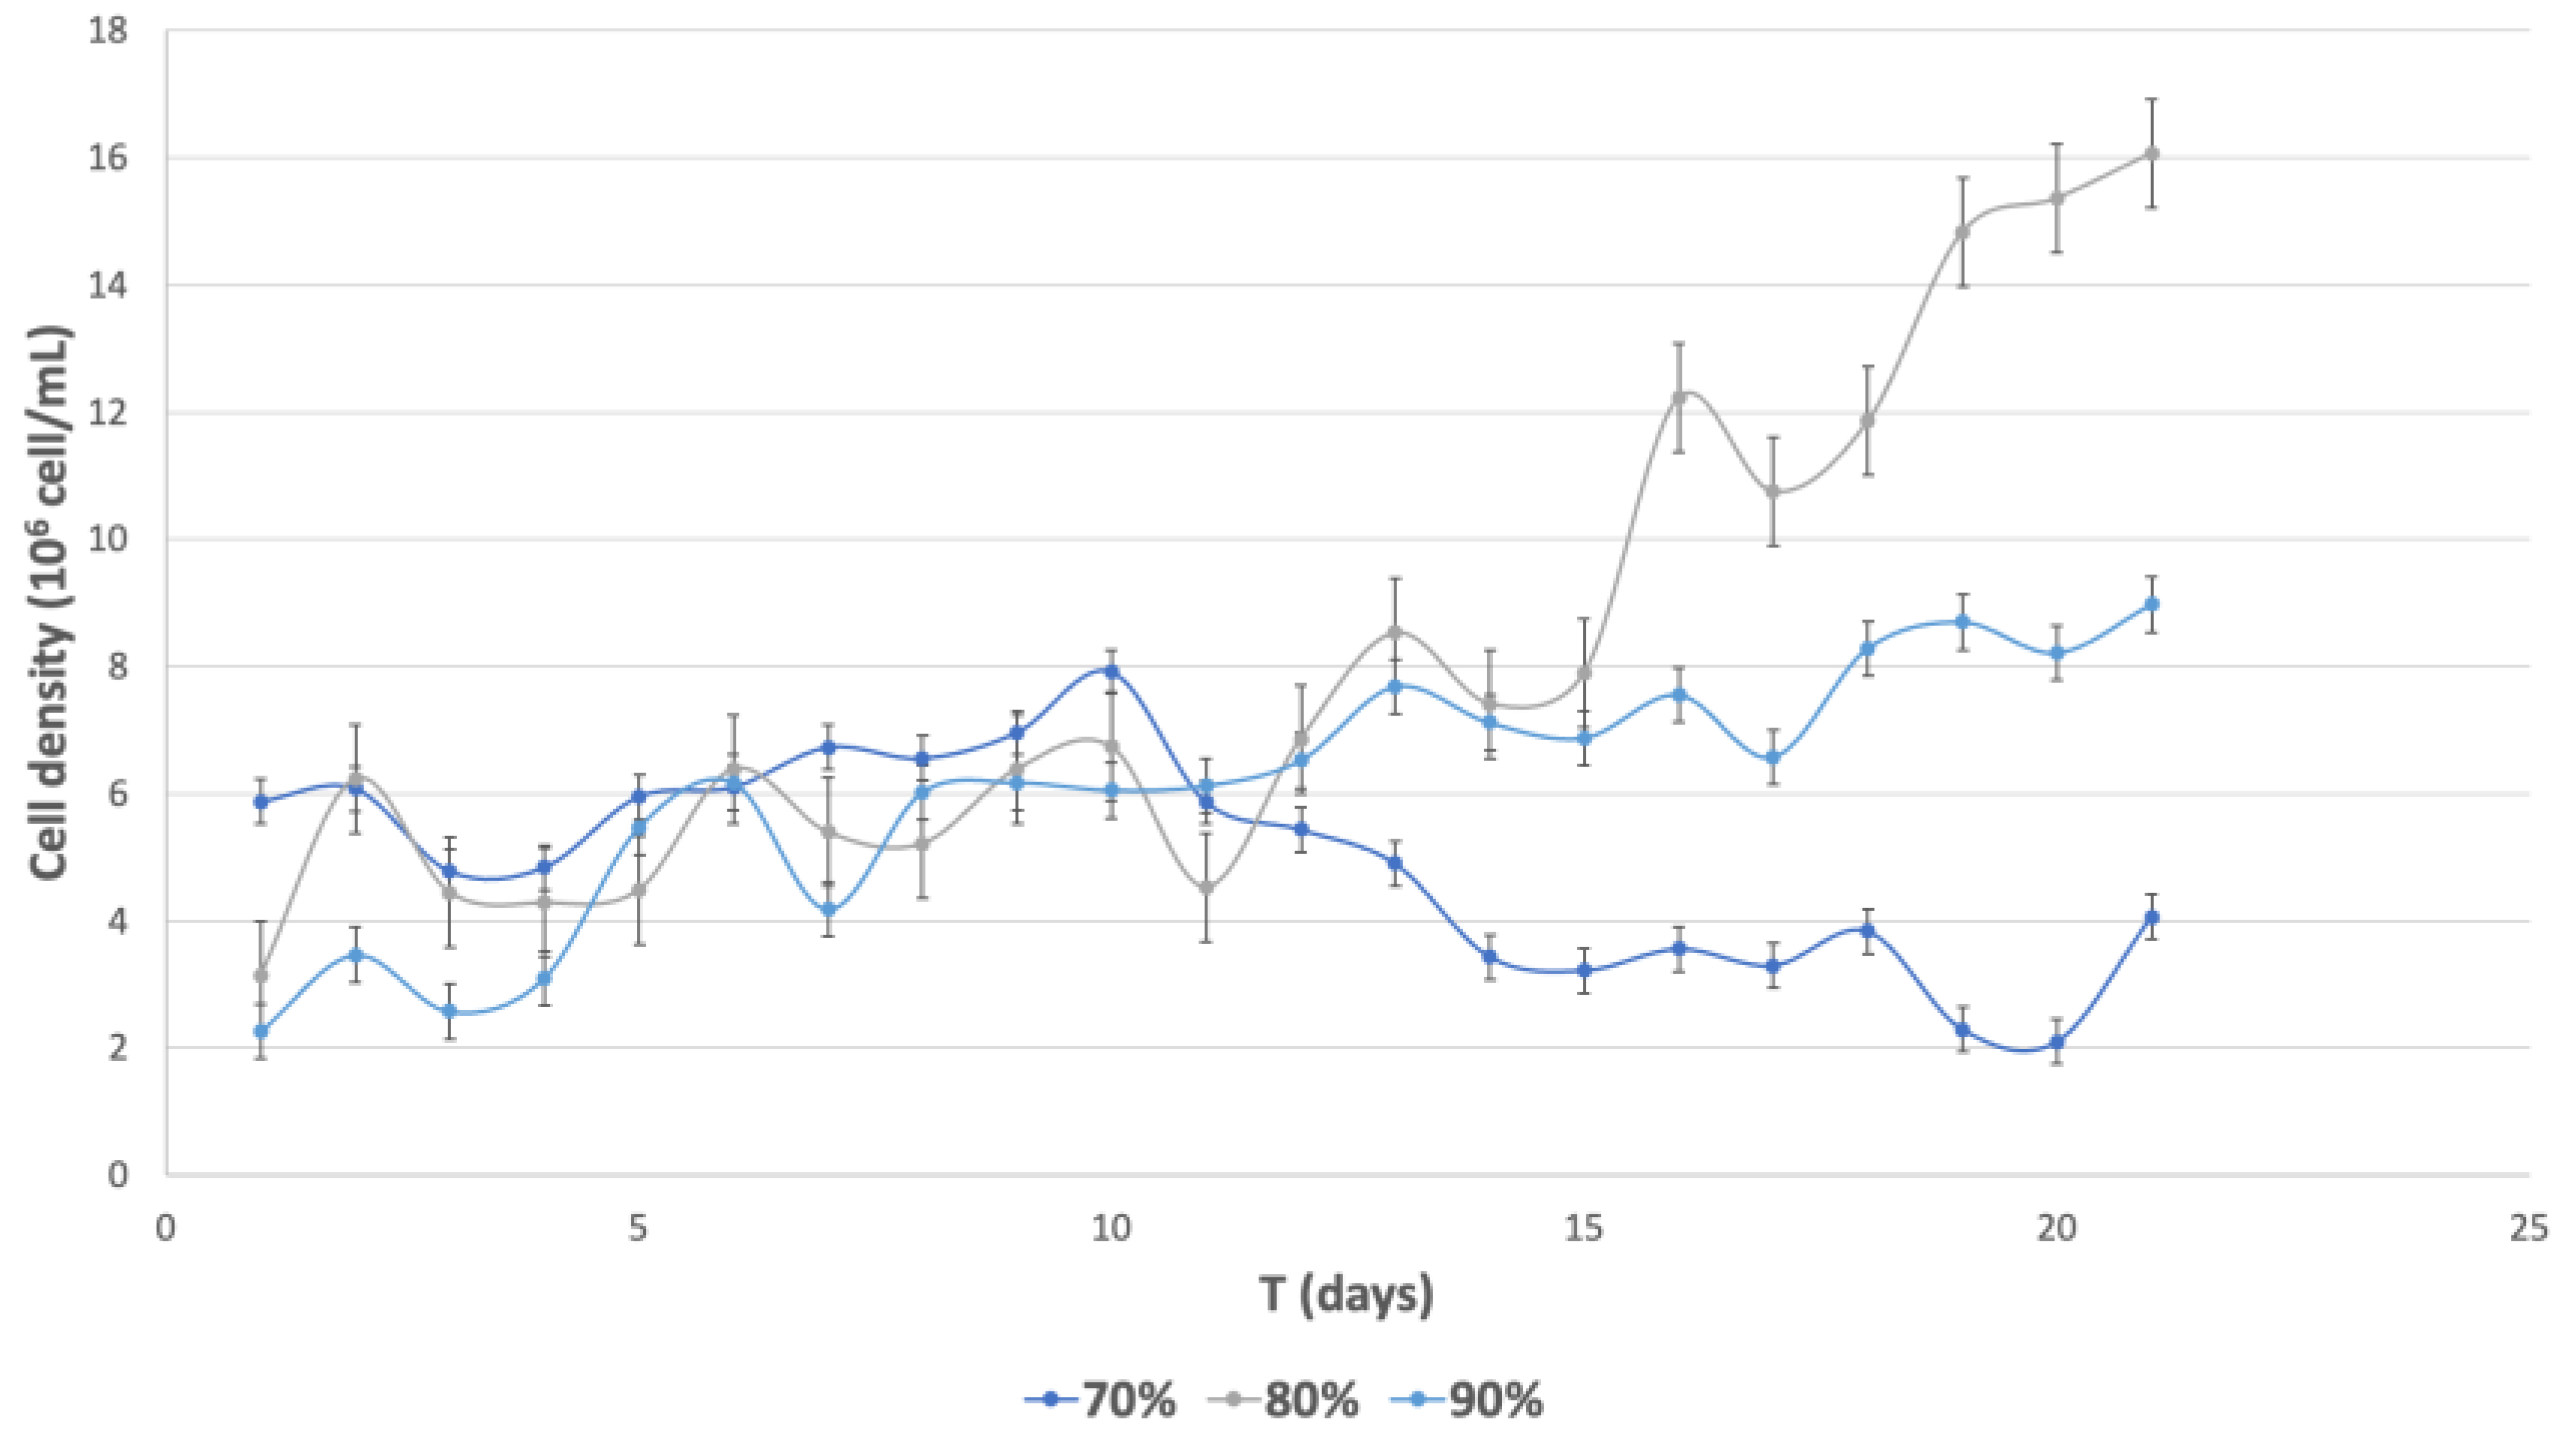
3.5.5. Cell Density Generation

This strain showed the highest growth in the inoculum with 80% concentration, while the lowest performance was observed in the one with the lowest percentage (70%) (Figure 11). This may be due to the fact that both the organic matter and the nutrients contained in the wastewater (P, N, and C) in large quantities inhibit algal growth. This parameter is consistent with the results obtained in the biomass evaluation. There are significant differences in days (p-value 0.0001) and interaction between factors (p-value 0.0001).

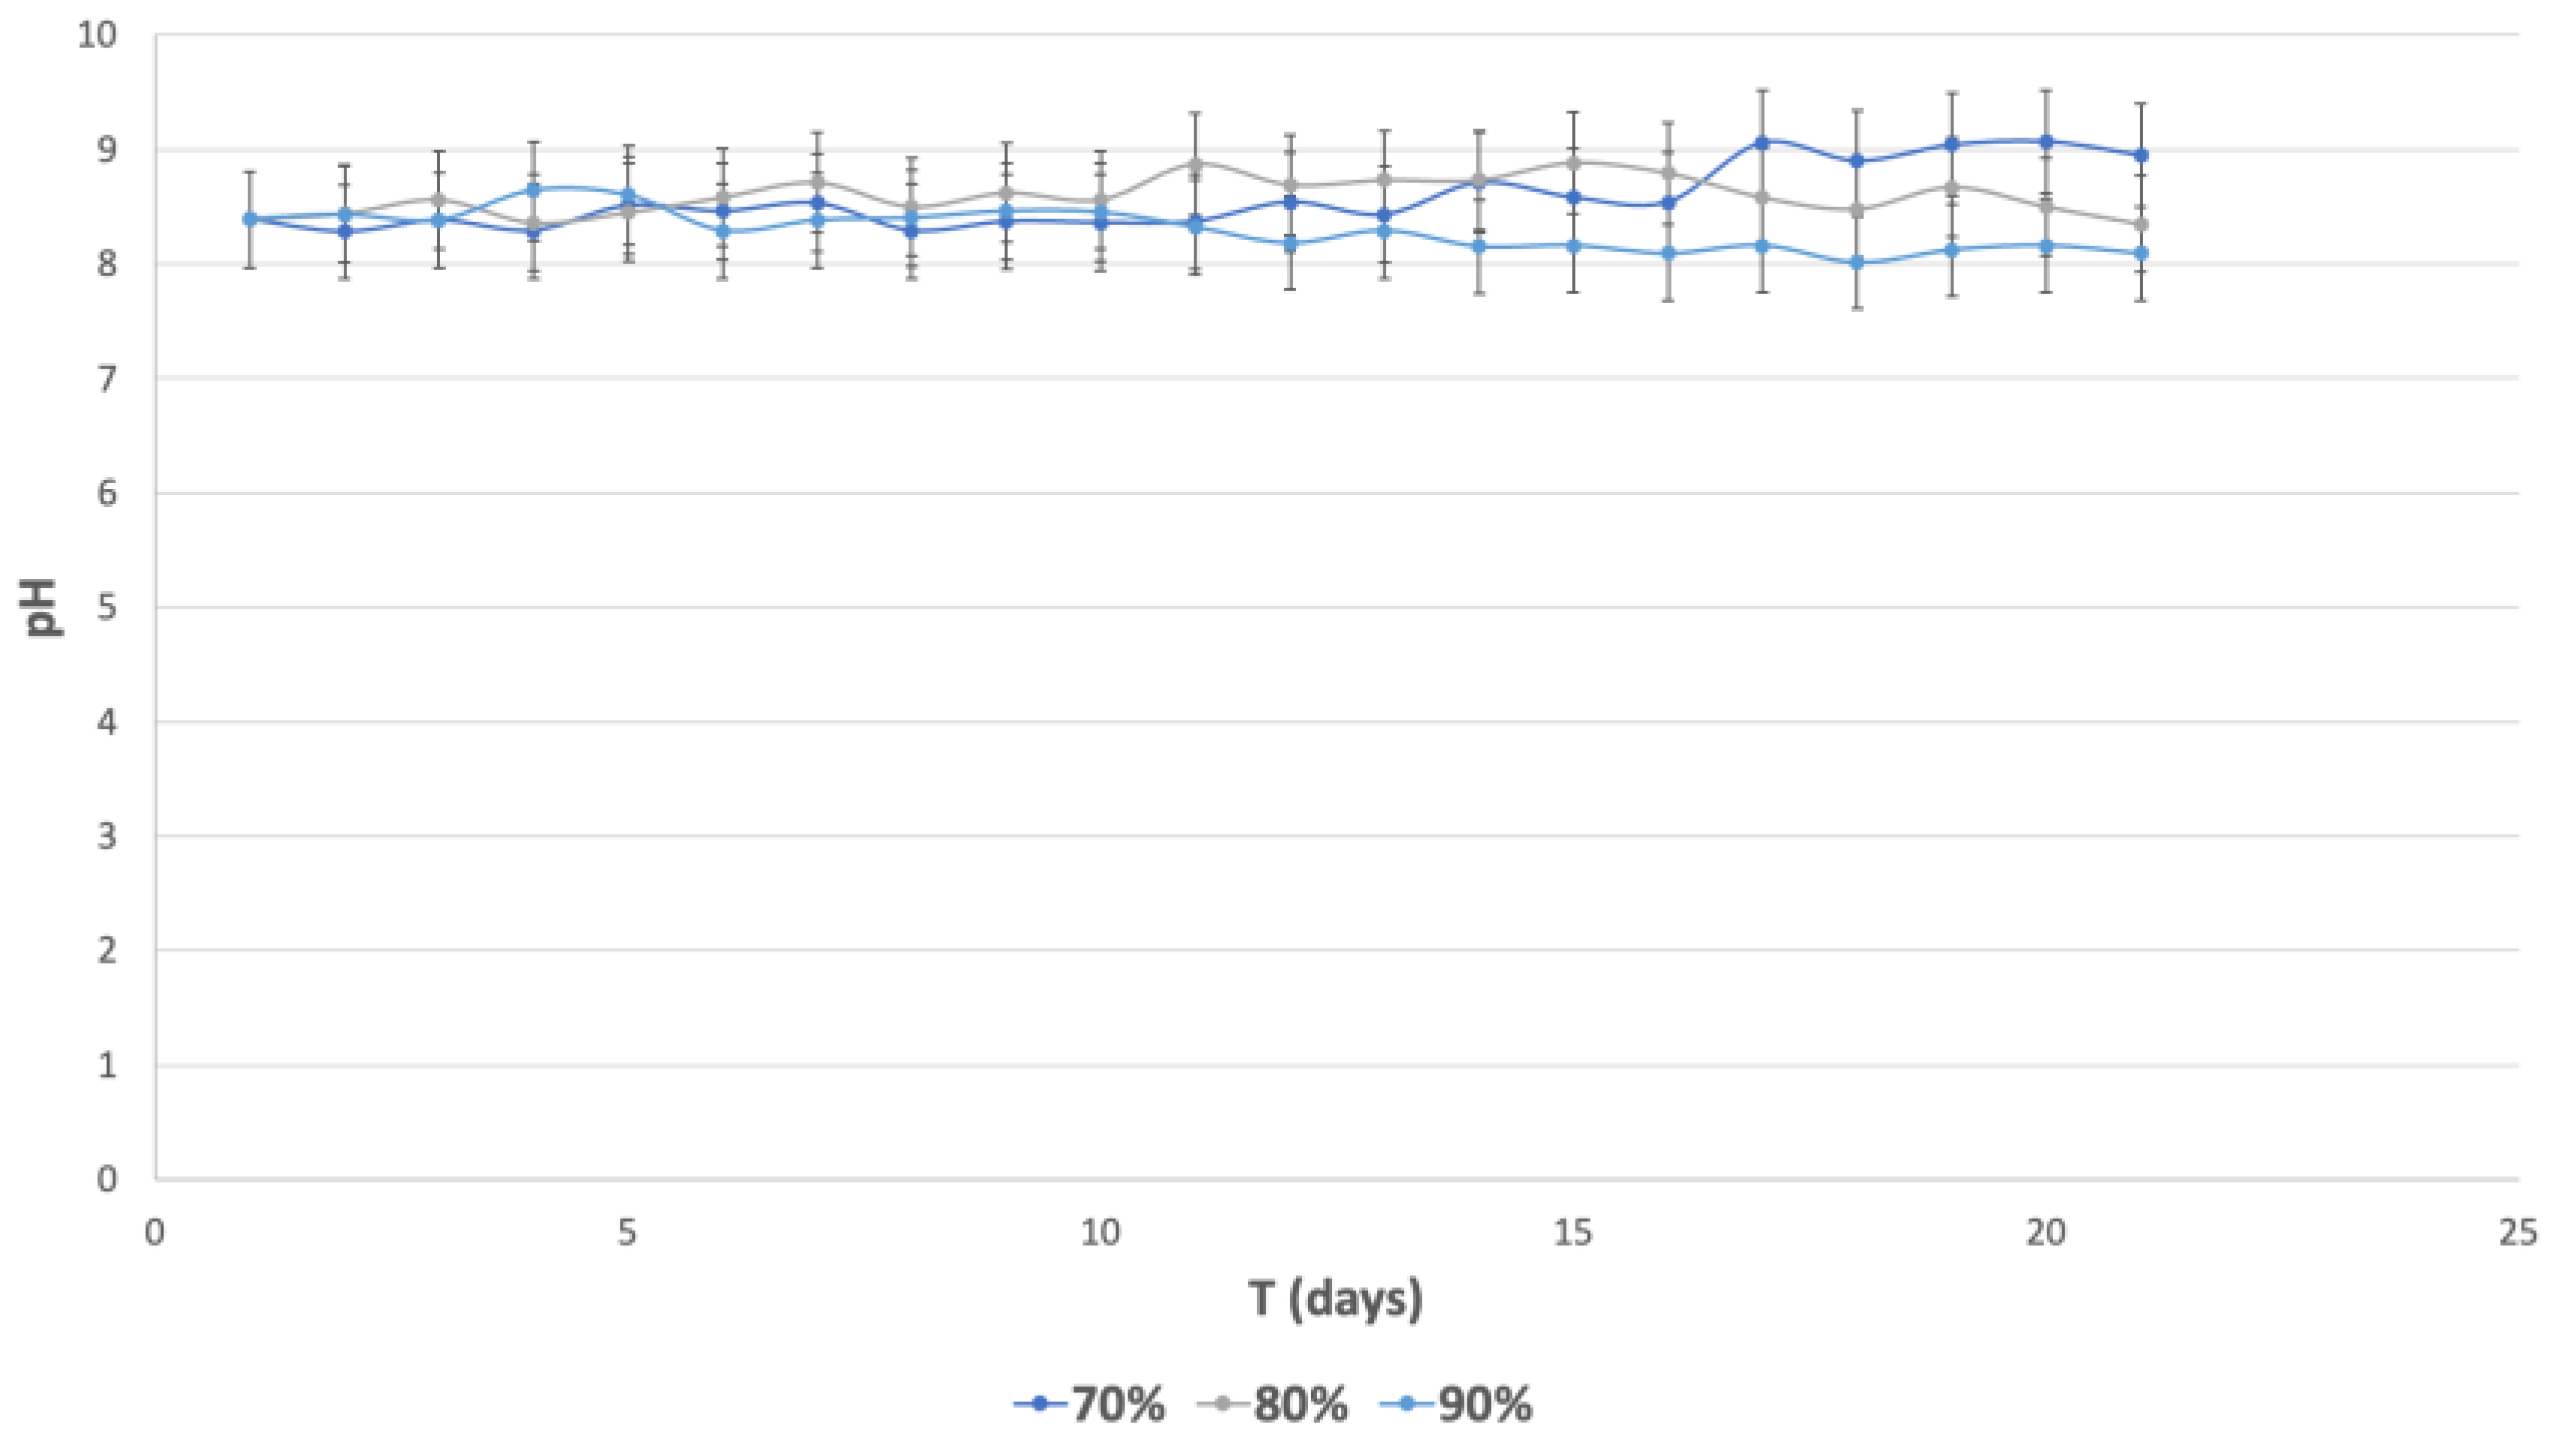
3.5.6. pH Monitoring

During the 21 days, the pH value fluctuated between 7 and 9 (Figure 12). This can affect the development or quality of the biomass obtained as it promotes the flocculation of microalgal cells within the reactor [56]. Moreover, the variation of pH in the medium can influence the development of microalgae as it causes thickening of the cell wall, leading Nannochloropsis to a cyst state, pausing its development. pH showed significant differences in the interaction and both factors (p-value 0.0001), according to the results obtained in the ANOVA.

3.6. Kinetic Variables

The inoculum that reached the maximum population was the 80% concentration, which aligns with the previously described biomass and density results, while the longest generation time was obtained at 70%, meaning there was more time in the algal cell production cycle. On the other hand, the lag phase, represented by λ, is shorter at the 90% concentration. This parameter indicates the adaptation period of the microalga in the substrate (Table 8).
The parameters obtained through the Gompertz model show an adjustment (R2) greater than 99%, adequately describing the experimentally obtained data.
In Figure 13 the samples obtained at the end of each stage of the wastewater treatment process are observed. It is evident that there is a decrease in the turbidity and color of the water, which indicates that the proposed physicochemical and biological treatment train is effectively removing contaminating macroparticles.

4. Conclusions

The effluent exhibited elevated levels of organic matter and turbidity, necessitating treatment prior to its release into any aquatic habitat. The analysis of flow characteristics revealed that the wastewater demonstrates viscous behavior as per the Ostwald–de Waele model, attributable to suspended particles and temperature influence. These attributes will promote the advancement of a DAF-Microalgae Cultivation process.
The DAF stage accomplished a removal of 29.19% of total COD and 39.54% of soluble COD, with a notable reduction in turbidity to 99.92 NTU, consequently enhancing microalgae development by boosting light penetration into the cells. The procedure was finalized in roughly 7 min.
The culture of microalgae effectively decreased total COD by 90.83% and soluble COD by 77.24%, promoting CO2 absorption via air bubbling during the photosynthetic phase of the microalgae. offering a threefold benefit: capturing greenhouse gases, producing valuable biomass, and purifying mixed wastewater.

Author Contributions

Conceptualization, J.M.M.-C.; methodology, J.M.M.-C., S.M.P.-G., E.H.-A., R.E.S.-P. and A.A.-L.; validation, J.M.M.-C. and S.M.P.-G.; formal analysis, J.M.M.-C., S.M.P.-G., E.H.-A. and A.A.-L.; investigation, S.M.P.-G., E.H.-A., R.E.S.-P. and A.A.-L.; resources, J.M.M.-C.; writing—original draft preparation, S.M.P.-G., E.H.-A., R.E.S.-P. and J.M.M.-C.; writing—review and editing, S.M.P.-G., E.H.-A. and J.M.M.-C.; supervision, J.M.M.-C. All authors have read and agreed to the published version of the manuscript.

Funding

This research received no external funding.

Data Availability Statement

The original contributions presented in this study are included in the article. Further inquiries can be directed to the corresponding author.

Acknowledgments

Solmaría Mandi Pérez-Guzmán thanks the National Consejo Nacional de Ciencia y Tecnología (CONACyT) for the scholarship granted for the study of a PhD degree with CVU (scholarship holder) 1103203. The graphical abstract was created with BioRender.com. The authors are grateful for the support of the infrastructure use facilities of the Tecnológico Nacional de México Campus Orizaba.

Conflicts of Interest

The authors declare no conflicts of interest.

Abbreviations

The following abbreviations are used in this manuscript:
DAFDissolved Air Flotation
CODChemical Oxygen Demand
TOCTotal Organic Carbon
TSTotal Solids
TVSTotal Volatile Solids
ULAUltra Low Adapter

References

  1. Vázquez-Tapia, I.; Salazar-Martínez, T.; Acosta-Castro, M.; Meléndez-Castolo, K.A.; Mahlknetch, J.; Cervantes-Avilés, P.; Capparelli, M.V.; Mora, A. Occurrence of emerging organic contaminants and endocrine disruptors in different water compartments in Mexico—A review. Chemosphere 2022, 308, 136285. [Google Scholar] [CrossRef] [PubMed]
  2. Lesser, L.E.; Mora, A.; Moreau, C.; Mahlknetch, J.; Hernández-Antonio, A.; Ramírez, A.I.; Barrios-Piña, H. Survey of 218 organic contaminants in groundwater derived from the world’s largest untreated wastewater irrigation system: Mezquital Valley, Mexico. Chemosphere 2018, 198, 510–521. [Google Scholar] [CrossRef] [PubMed]
  3. Calidad del agua en México. Available online: https://www.gob.mx/conagua/articulos/calidad-del-agua (accessed on 19 May 2025).
  4. CONAGUA. Estadísticas del agua en México 2021, 1st ed.; Secretaría de Medio Ambiente y Recursos Naturales: Mexico City, Mexico, 2022; pp. 166–178. [Google Scholar]
  5. Brandt, M.J.; Johnson, K.M.; Elphinston, A.; Ratnayaka, D.D. Storage, clarification and chemical treatment (chapter 7). In Water Supply, 5th ed.; Twort, A.C., Ratnayaka, D.D., Brandt, M.J., Eds.; Elsevier Ltd.: Berkeley, CA, USA, 2000; pp. 323–366. [Google Scholar]
  6. Muñoz-Alegría, J.A.; Muñoz-España, E.; Flórez-Marulanda, J.F. Dissolved Air Flotation: A Review from the Perspective of System Parameters and Uses in Wastewater Treatment. TecnoLógicas 2021, 24, 281–303. [Google Scholar] [CrossRef]
  7. Fuad, N.; Omar, R.; Kamarudin, S.; Harun, R.; Idris, A.; Azlina, W. Mass harvesting of marine microalgae using different techniques. Food Bioprod. Process. 2018, 112, 169–184. [Google Scholar] [CrossRef]
  8. Aaltonen, A.; Le, T.M.K.; Saari, E.; Dahl, O.; Musuku, B.; Lang, A.; Hiidenheimo, S.; Dixon, R. Improving Nickel Recovery in Froth Flotation by Purifying Concentrators Process Water Using Dissolved Air Flotation. Minerals 2023, 13, 319. [Google Scholar] [CrossRef]
  9. Villar-Navarro, E.; Baena-Nogueras, R.M.; Paniw, M.; Perales, J.A.; Lara-Martín, P.A. Removal of pharmaceuticals in urban wastewater: High rate algae pond (HRAP) based technologies as an alternative to activated sludge based processes. Water Res. 2018, 139, 19–29. [Google Scholar] [CrossRef] [PubMed]
  10. Sanjayasari, D.; Rahmasari, F.; Khasanah, I.; Imlani, A. Density and Growth Rate of Nannochloropsis oculata with Different Photoperiods. MAIYAH 2023, 2, 25–32. [Google Scholar] [CrossRef]
  11. Osorio-Rivera, M.A.; Carrillo-Barahona, W.E.; Negrete-Costales, J.H.; Loor-Larvay, X.A.; Riera-Gualchichulca, E.J. La calidad de las aguas residuales domésticas. Pol. Con. 2020, 6, 228–245. [Google Scholar] [CrossRef]
  12. Zahran, E.; Elbahnaswy, S.; Ahmed, F.; Ibrahim, I.; Khaled, A.A.; Eldessouki, E.A. Nutritional and immunological evaluation of Nannochloropsis oculata as a potential Nile tilapia-aquafeed supplement. BMC Vet. Res. 2023, 19, 65. [Google Scholar] [CrossRef] [PubMed]
  13. Guiscafré Rodea, F.J.; García Trejo, J.F.; Vanthoor Koopmans, M. Cultivo de la microalga nannochloropsis limnetica en agua residual de invernadero. PCT 2018, 1, 10–19. Available online: https://revistas.uaq.mx/index.php/perspectivas/article/view/424 (accessed on 20 May 2025).
  14. Reyimu, Z.; Özçimen, R. Batch cultivation of marine microalgae Nannochloropsis oculata and Tetraselmis suecica in treated municipal wastewater toward bioethanol production. J. Clean. Prod. 2017, 150, 40–46. [Google Scholar] [CrossRef]
  15. Santos, B.; Araújo, J.; Carvalho, B.; Cotrim, C.; Bernardino, R.; Freitas, F.; Sobral, A.J.F.N.; Encarnação, T. Bioremediation of Synthetic Wastewater with Contaminants of Emerging Concern by Nannochloropsis sp. and Lipid Production: A Circular Approach. Bioengineering 2025, 12, 246. [Google Scholar] [CrossRef] [PubMed]
  16. Zezulka, Š.; Maršálek, B.; Maršálková, E.; Odehnalová, K.; Pavlíková, M.; Lamaczová, A. Suspended Particles in Water and Energetically Sustainable Solutions of Their Removal—A Review. Processes 2024, 12, 2627. [Google Scholar] [CrossRef]
  17. Sobolewska, E.; Borowski, S.; Nowicka-Krawczyk, P. Cultivation of Microalgae in Liquid Digestate to Remove Nutrients and Organic Contaminants. Bioenergy Res. 2024, 17, 1843–1855. [Google Scholar] [CrossRef]
  18. NMX-AA-008-SCFI-2016; Análisis de Aguas—Medición del pH en Aguas Naturales, Residuales y Residuales Tratadas. Método de Prueba. Diario Oficial de la Federación: Mexico City, Mexico, 2016.
  19. NMX-AA-007-SCFI-2013; Análisis de Agua—Medición de la Temperatura en Aguas Naturales, Residuales y Residuales Tratadas. Método de Prueba. Diario Oficial de la Federación: Mexico City, Mexico, 2013.
  20. NMX-AA-038-SCFI-2001; Análisis de Agua—Determinación de Turbiedad en Aguas Naturales, Residuales y Residuales Tratadas. Método de Prueba. Diario Oficial de la Federación: Mexico City, Mexico, 2001.
  21. NMX-AA-034-SCFI-2015; Análisis de Agua—Medición de Sólidos y Sales Disueltas en Aguas Naturales, Residuales y Residuales Tratadas. Método de Prueba. Diario Oficial de la Federación: Mexico City, Mexico, 2015.
  22. NMX-AA-012-SCFI-2001; Análisis de Agua—Medición de Color Verdadero en Aguas Naturales, Residuales, Residuales Tratadas y Marinas—Mediante Coeficientes de Absorción Espectral—Método de Prueba. Diario Oficial de la Federación: Mexico City, Mexico, 2021.
  23. NMX-AA-017-SCFI-2021; Análisis de Agua—Determinación de la Conductividad Electrolítica. Método de Prueba. Diario Oficial de la Federación: Mexico City, Mexico, 2000.
  24. NMX-AA-029-SCFI-2001; Diario Oficial de la Federación. Análisis de Aguas—Determinación de Fósforo Total en Aguas Naturales, Residuales y Residuales Tratadas. Método de Prueba. Diario Oficial de la Federación: Mexico City, Mexico, 2001.
  25. NMX-AA-030-SCFI-2001; Análisis de Agua—Determinación de la Demanda Química de Oxígeno en Aguas Naturales, Residuales y Residuales Tratadas. Método de Prueba. Diario Oficial de la Federación: Mexico City, Mexico, 2001.
  26. NMX-AA-026-SCFI-2010; Análisis de Agua—Medición de Nitrógeno Total Kjeldahl en Aguas Naturales, Residuales y Residuales Tratadas. Método de Prueba. Diario Oficial de la Federación: Mexico City, Mexico, 2010.
  27. NMX-AA-113-SCFI-2012; Análisis de Agua—Medición del Número de Huevos de Helminto en Aguas Residuales y Residuales Tratadas por Observación Microscópica. Método de Prueba. Diario Oficial de la Federación: Mexico City, Mexico, 2012.
  28. Ali, S.M.; Aziz, S.Q. Dissolved Air Flotation (DAF) Operational Parameters and Limitations for Wastewaters Treatment with Cost Study. Recycl. Sustain. Dev. 2023, 16, 91–97. [Google Scholar] [CrossRef]
  29. Fanaie, V.R.; Khiadani, M.; Ayres, T. Effects of internal geometry on hydrodynamics of dissolved air flotation (DAF) tank: An experimental study using particle image velocimetry (PIV). Colloids Surf. A 2019, 575, 382–390. [Google Scholar] [CrossRef]
  30. Gutiérrez-Casiano, N.; Hernández-Aguilar, E.; Alvarado-Lassman, A.; Méndez-Contreras, J.M. Removal of carbon and nitrogen in wastewater from a poultry processing plant in a photobioreactor cultivated with the microalga Chlorella vulgaris. J. Environ. Sci. Health Part A Toxic/Hazard. Subst. Environ. Eng. 2022, 57, 620–633. [Google Scholar] [CrossRef] [PubMed]
  31. Pérez-Guzmán, S.M.; Hernández-Aguilar, E.; Alvarado-Lassman, A.; Méndez-Contreras, J.M. Kinetics of Obtaining Microalgal Biomass and Removal of Organic Contaminants in Photobiorreactors Operated with Microalgae—Study Case: Treatment of Wastewater from a Poultry Slaughterhouse. Water 2024, 16, 1558. [Google Scholar] [CrossRef]
  32. Kim, S.J.; Choi, J.; Jeon, J.T.; Lee, I.C.; Won, C.H.; Chung, J. Microbubble-inducing Characteristics Depending on Various Nozzle and Pressure in Dissolved Air Flotation Process. KSCE J. Civ. Eng. 2014, 19, 558–563. [Google Scholar] [CrossRef]
  33. Sirin, S.; Sillanpää, M. Cultivating and harvesting of marine alga Nannochloropsis oculata in local municipal wastewater for biodiesel. Bioresour. Tecnol. 2015, 191, 79–87. [Google Scholar] [CrossRef] [PubMed]
  34. Martínez-Macías, M.R.; Sánchez-Duarte, R.G.; Meza-Escalante, E.R.; Ulloa-Mercado, R.G.; Saldívar-Cabrales, J. Síntesis de lípidos de la microalga Nannochloropsis oculata para su uso potencial en la producción de biodiésel. Rev. Int. Contam. Ambient. 2017, 33, 85–91. [Google Scholar] [CrossRef]
  35. NOM-001-SEMARNAT-2021; Límites Permisibles de Contaminantes en las Descargas de Aguas Residuales en Cuerpos Receptores Propiedad de la Nación. Diario Oficial de la Federación: Mexico City, Mexico, 2021.
  36. Wei, Y.; Jiao, Y.; An, D.; Li, D.; Li, W.; Wei, Q. Review of Dissolved Oxygen Detection Technology: From Laboratory Analysis to Online Intelligent Detection. Sensors 2019, 19, 3995. [Google Scholar] [CrossRef] [PubMed]
  37. Bozorg-Haddad, O.; Delpasand, M.; Loáiciga, H. Water quality, hygiene and health. In Economical, Political and Social Issues in Water Resources; Elsevier: Tehrán, Iran, 2021. [Google Scholar]
  38. Palaniandy, P.; Abdul-Aziz, H.; Fared-Murshed, M. Dissolved Air Flotation (DAF) for Wastewater Treatment. In Waste Treatment in the Service and Utility Industries, 1st ed.; CRC Press: Boca Raton, FL, USA, 2017. [Google Scholar] [CrossRef]
  39. Luo, C.; Guo, L.; Zeng, S.; Long, T. Effects of turbulence fluctuation intensity in bioreactor of sewage treatment on physical and chemical properties of biofilms. Bioprocess Biosyst. Eng. 2021, 44, 1865–1874. [Google Scholar] [CrossRef] [PubMed]
  40. Leyva-De La Cruz, B.; Guillen-Campo, Y.; Laurencio-Alfonso, H.L. Caracterización reológica de un lodo que se genera en el lavado de un árido. Rev. Ing. Mec. 2016, 19, 143–149. [Google Scholar]
  41. Farno, E.; Baudez, J.C.; Parthasarathy, R.; Eshtiaghi, N. Impact of temperature and duration of thermal treatment on different concentrations of anaerobic digested sludge: Kinetic similarity of organic matter solubilisation and sludge rheology. Chem. Eng. J. 2015, 273, 534–542. [Google Scholar] [CrossRef]
  42. Muhereid, M.A. Common Versus Herschel-Bulkley Drilling Fluid Models: Effect of Their Rheological Parameters on Dynamic Particle Settling Velocity. Am. Sci. Res. J. Eng. Technol. Sci. 2016, 16, 155–177. [Google Scholar]
  43. Mouzaoui, M.; Sauceau, M.; Devriendt, L.; Baudez, J.C.; Arlabosse, P. Rheological characterization of sludge in divided granular-like and pasty states using a granular rheometer. Powder Technol. 2020, 378, 521–527. [Google Scholar] [CrossRef]
  44. Button, C.; Poddar, N.; Lacassagne, T.; Pernice, M.; Gupta, V.; Aditya, L.; Kuzhiumparambil, U.; Ralph, P.J. Rheological characterization and modeling of freshwater and marine microalgae and cyanobacteria mixed cultures. Algal Res. 2025, 88, 103988. [Google Scholar] [CrossRef]
  45. Díaz-Díaz, M.A.; Rivas-Trasancos, L.; Fernández-Rangel, D.; Salazar-Alemán, D.; Miller-Palmer, S. Tratamiento de aguas residuales oleosas mediante flotación por aire disuelto. Tecnol. Química 2018, 38, 256–270. [Google Scholar]
  46. Pimiento, K.; Cárdenas-Gónzález, M.J. Evaluación del tratamiento preliminar y primario para las aguas residuales del procesamiento industrial de alimentos en La Grita (Venezuela). INGE 2021, 17, 1–14. [Google Scholar] [CrossRef]
  47. Monira, S.; Bhuiyan, M.A.; Haque, N.; Shah, K.; Roychand, R.; Hai, F.I.; Pramanik, B.K. Understanding the fate and control of road dust-associated microplastics in stormwater. Process. Saf. Environ. Prot. 2021, 152, 47–57. [Google Scholar] [CrossRef]
  48. Osorio-Trujillo, A.F.; Martínez-Cajigas, M.E. Validación de un método para el análisis de color real en agua. Rev. Fac. Cienc. 2018, 7, 143–155. [Google Scholar] [CrossRef]
  49. Lee, S.; Lee, N.; Oh, H.M.; Ahn, C.Y. Enhanced and balanced microalgal wastewater treatment (COD, N and P) by interval inoculation of activated sludge. J. Microbiol. Technol. 2019, 29, 1434–1443. [Google Scholar] [CrossRef] [PubMed]
  50. Pauwels, B.; Ngwa, F.F.; Deconinck, S.; Verstraete, W. Effluent Quality of a Conventional Activated Sludge and a Membrane Bioreactor System Treating Hospital Wastewater. Environ. Technol. 2010, 27, 395–402. [Google Scholar] [CrossRef] [PubMed]
  51. NMX-AA-187-SCFI-2021; Análisis de Agua—Medición de Carbono Orgánico Total en Aguas Naturales, Salinas, Residuales y Residuales Tratadas. Diario Oficial de la Federación: Mexico City, Mexico, 2021.
  52. Patel, A.K.; Choi, Y.Y.; Sim, S.J. Emerging prospects of mixotrophic microalgae: Way forward to sustainable bioprocess for environmental remediation and cost-effective biofuels. Bioresour. Technol. 2020, 300, 122741. [Google Scholar] [CrossRef] [PubMed]
  53. Salbitani, G.; Carfagna, S. Ammonium Utilization in Microalgae: A Sustainable Method for Wastewater Treatment. Sustainability 2021, 13, 956. [Google Scholar] [CrossRef]
  54. Han, P.; Lu, Q.; Fan, L.; Zhou, W. A Review on the Use of Microalgae for Sustainable Aquaculture. Appl. Sci. 2019, 9, 2377. [Google Scholar] [CrossRef]
  55. Suárez-Rumiche, J.A.; Castillo-Valdiviezo, A.; Souza-Najar, R.I. Obtención de azúcares reductores por hidrólisis ácida a partir de un consorcio de microalgas amazónicas cultivadas en agua residual. Rev. Cienc. Tecnol. 2021, 17, 45–51. [Google Scholar] [CrossRef]
  56. Rojo-Cebreros, A.H.; Morales-Plascencia, M.E.; Ibarra-Castro, L.; Martínez-Brown, J.M.; Medina-Jasso, M.A. Floculación de Nannochloropsis sp inducida por hidróxido de sodio: Eficiencia de floculación, efecto sobre la viabilidad microalgal y su uso como alimento para rotíferos. Lat. Am. J. Aquat. Res. 2016, 44, 662–670. [Google Scholar] [CrossRef]
Figure 1. Scheme of laboratory-scale DAF system.
Water 17 02113 g001
Figure 2. Laboratory-scale photobioreactors.
Water 17 02113 g002
Figure 3. Velocity magnitudes in the pressurized tank.
Water 17 02113 g003
Figure 4. Rheogram of wastewater.
Water 17 02113 g004
Figure 5. Rheogram of the stages of water treatment.
Water 17 02113 g005
Figure 6. Main effects on the removal of contaminants.
Water 17 02113 g006aWater 17 02113 g006b
Figure 7. Removal of total COD.
Water 17 02113 g007
Figure 8. Removal of total organic carbon.
Water 17 02113 g008
Figure 9. Removal of nitrogen.
Water 17 02113 g009
Figure 10. Biomass generation.
Water 17 02113 g010
Figure 11. Cell density generation of Nannochloropsis oculata.
Water 17 02113 g011
Figure 12. pH in Nannochloropsis oculata kinetics.
Water 17 02113 g012
Figure 13. Changes in turbidity and color of wastewater in the two treatment stages.
Water 17 02113 g013
Table 1. Parameters, regulation, and equipment utilized in the preliminary physicochemical assessment of the sample.
ParameterRegulationEquipmentEquipment Sensitivity
pHNMX-AA-008-SCFI-2016 [18]Hanna® potentiometer HI2002-01 model, Mexico City, Mexico.0.01
TemperatureNMX-AA-007-SCFI-2013 [19]Brannan® thermometer, Mexico City, Mexico.0.1 °C
TurbidityNMX-AA-038-SCFI-2001 [20]Hatch® turbidimeter 2100Q model, Mexico City, Mexico.0.1 NTU
TS and TVSNMX-AA-034-SCFI-2015 [21]Felisa® stove 4840 model and ThermoScientific® muffle furnace FE363 model, Mexico City, Mexico.1 °C
Dissolved oxygen and saturationNMX-AA-012-SCFI-2001 [22]Hatch® multiparameter HQ40D model, Mexico City, Mexico.0.1 mg/L, 0.1%
True colorNMX-AA-017-SCFI-2021 [23]ThermoScientific® spectrophotometer UV-VIS Genesys 10S Model, Mexico City, Mexico.0.001
Total and soluble CODNMX-AA-030-SCFI-2012 [24]ThermoScientific® spectrophotometer UV-VIS Genesys 10S Model, Mexico City, Mexico.0.001
Total phosphorusNMX-AA-029-SCFI-2001 [25]ThermoScientific® spectrophotometer UV-VIS Genesys 10S Model, Mexico City, Mexico.0.001
Total nitrogenNMX-AA-026-SCFI-2016 [26]Labconco® microdistiller 6030000 model, Mexico City, Mexico.NA
Helminth eggsNMX-AA-113-SCFI-2012 [27]AmScope® microscope B250 model, Mexico City, Mexico.NA
Table 2. Volumes used in adaptation kinetics.
F:M RatiosWastewater Volume (mL)Microalgae Volume (mL)
70:30350150
80:20400100
90:1045050
Table 3. Results of initial assessment of contaminated water.
ParameterResultMaximum PermissibleUnits
pH8.196–9
Temperature2135°C
Total COD155.91150mg/L
Soluble COD53.91mg/L
Phosphorus27.5915mgP/L
Total solids0.212 % w/w
Total volatile solids43.353 % w/w
Turbidity113.33 NTU
Dissolved oxygen1.65mg/L
Saturation22.580%
True color436 nm10.5371/m
525 nm8.0651/m
620 nm6.8331/m
Helminth eggsNot found0HH/100 mL
Table 4. Rheological parameters of wastewater according to the Herschel–Bulkley model.
Temperature (°C)Regression Equationm
(cP)
τ 0
(Pa)
K
(Pa·s)
nR2
20 τ = 0.001685 + 2.791   ×   10 5 γ 1.777 1.880.015660.000049641.6870.9986
25 τ = 0.01128 + 4.366   ×   10 5 γ 1.689 1.760.0089630.000050771.6660.9989
30 τ = 0.00001 + 4.124   ×   10 5 γ 1.69 1.6800.000040131.7180.9983
40 τ = 0.00001 + 4.774   ×   10 5 γ 1.644 1.6800.000044661.6840.9981
Table 5. Rheological parameters of wastewater according to the Ostwald–de Waele model.
Temperature (°C)Equation Regressionm
(cP)
K
(Pa·s)
nR2
20 τ = 3.05 × 10 5 γ 1.762 1.880.00010741.5500.9986
25 τ = 7.696 × 10 5 γ 1.589 1.760.00008111.5830.9980
30 τ = 3.489 × 10 5 γ 1.719 1.680.000037441.7310.9982
40 τ = 3.804 × 10 5 γ 1.684 1.680.000039841.7040.9980
Table 6. Evolution of the rheological parameters of water during the treatment train.
Raw WastewaterWastewater Before DAFWastewater Before MicroalgaeR2
k (Pa·s) n m (cP) k (Pa·s) n m (cP) k (Pa·s) n m (cP)
0.00008111.5831.760.00051.24391.800.00071.18621.840.9981
Table 7. Parameters evaluated in the water sample after DAF.
ParameterRaw Wastewater40 PSI50 PSI60 PSIReference
[45]
Total COD
(mg/L)
1654.671171.614891559.25170
Soluble COD
(mg/L)
625513453377.84
Turbidity
(NTU)
110.44106.08108.6499.9221.9
True Color
436 nm
(m−1)
119.43103.29281(465 nm)
70
525 nm
(m−1)
95.5559.459.674
620 nm
(m−1)
80.428.974.1763.43
pH8.398.137.927.357.7
Table 8. Kinetic parameters of Nannochloropsis oculata.
abcμmλGR2
70%0.60462.01160.13350.08077.57718.585999.58%
80%1.59331.35240.06410.10225.49226.778799.11%
90%0.37461.30766.22702.33230.04940.297099.12%
Std. Dev.0.023010.41430.02570.023672.13181.0127
Disclaimer/Publisher’s Note: The statements, opinions and data contained in all publications are solely those of the individual author(s) and contributor(s) and not of MDPI and/or the editor(s). MDPI and/or the editor(s) disclaim responsibility for any injury to people or property resulting from any ideas, methods, instructions or products referred to in the content.

