Article

Process Limit of Detection for Salmonella Typhi, Vibrio cholerae, Rotavirus, and SARS-CoV-2 in Surface Water and Wastewater

by
Pengbo Liu
*,
Orlando Sablon
,
Anh Nguyen
,
Audrey Long
and
Christine Moe
Center for Global Safe Water, Sanitation, and Hygiene, Hubert Department of Global Health, Rollins School of Public Health, Emory University, Atlanta, GA 30322, USA
*
Author to whom correspondence should be addressed.
Water 2025, 17(14), 2077; https://doi.org/10.3390/w17142077
Submission received: 19 May 2025 / Revised: 25 June 2025 / Accepted: 5 July 2025 / Published: 11 July 2025
(This article belongs to the Section Water and One Health)

Abstract

Wastewater-based epidemiology (WBE) has historically proven to be a powerful surveillance tool, particularly during the SARS-CoV-2 pandemic. Effective WBE depends on the sensitive detection of pathogens in wastewater. However, determining the process limit of detection (PLOD) of WBE through a comprehensive evaluation that accounts for pathogen concentration, nucleic acid extraction, and molecular analysis has rarely been documented. We prepared dilution series with known concentrations of S. Typhi, V. cholerae, rotavirus, and SARS-CoV-2 in surface water and wastewater. Pathogen concentration was performed using Nanotrap particles with the KingFisher™ Apex robotic platform, followed by nucleic acid extraction. Quantitative real-time PCR (qPCR) and digital PCR (dPCR) were used to detect the extracted nucleic acids of the pathogens. The PLODs and recovery efficiencies for each of the four pathogens in surface water and wastewater were determined. Overall, the observed PLODs for S. Typhi, V. cholerae, and rotavirus in surface water and wastewater were approximately 3 log10 loads (2.1–2.8 × 10³/10 mL) using either qPCR or dPCR as the detection method. For SARS-CoV-2, the PLOD in surface water was 2.9 × 10⁴/10 mL with both RT-qPCR and dPCR, one log10 higher than the PLODs of the other three pathogens. In wastewater, the PLOD for SARS-CoV-2 was 2.9 × 10⁴/10 mL using RT-qPCR and 2.9 × 10³/10 mL using dPCR. The mean recovery rates of S. Typhi, V. cholerae, rotavirus, and SARS-CoV-2 for dPCR in both surface water and wastewater were below 10.4%, except for S. Typhi and V. cholerae in wastewater, which showed significantly higher recoveries, from 26.5% at 4.6 × 10⁵/10 mL for S. Typhi to 58.8% at 4.8 × 10⁵/10 mL for V. cholerae. Our study demonstrated that combining qPCR or dPCR analysis with automated Nanotrap particle concentration and nucleic acid extraction using the KingFisher™ platform enables the sensitive detection of S. Typhi, V. cholerae, rotavirus, and SARS-CoV-2 in surface water and wastewater.

1. Background

Wastewater-based epidemiology (WBE) has a long-standing history in disease surveillance, leveraging the analysis of pathogen nucleic acids in wastewater to infer the epidemic status of diseases within communities. While recent WBE studies have predominantly focused on SARS-CoV-2 surveillance on a global scale, this approach is broadly applicable to various human enteric pathogens, including poliovirus, Salmonella Typhi (S. Typhi), Vibrio cholerae (V. cholerae), noroviruses, and rotaviruses [1,2,3,4,5,6]. Notably, numerous WBE studies for disease surveillance and outbreak investigation were conducted well before the COVID-19 pandemic [1,2,7,8]. A particularly successful example is the use of WBE in polio eradication, where wastewater surveillance was integrated into national or regional polio monitoring programs to provide early warnings of community-level polio transmission [8,9,10]. One significant advantage of WBE is its ability to detect both symptomatic and asymptomatic cases [11], making it a critical tool for effective disease control.
Analyzing pathogen presence in wastewater typically involves three key steps: pathogen concentration, nucleic acid extraction, and molecular detection using qPCR or dPCR. Each step offers multiple methodological options, and the choice of method can significantly impact detection outcomes. Due to the complexities of this workflow, various factors can influence the results, potentially leading to false negatives (where the pathogen is present in the wastewater but goes undetected) or reduced sensitivity (where a high pathogen load is detected as low). For example, during the pathogen concentration step, several methods are commonly employed, each with distinct advantages and limitations. These methods include the use of Nanotrap particles [12], membrane filtration [13], polyethylene glycol (PEG) precipitation [14], skim milk flocculation [15], ultracentrifugation [16], and ultrafiltration [17]. The choice of methods can significantly affect the accuracy and sensitivity of pathogen detection.
A robust WBE approach relies on the sensitive detection and quantification of pathogens in wastewater. This involves efficient concentration and extraction processes to minimize pathogen loss, coupled with sensitive detection techniques such as qPCR or dPCR. However, the absence of an optimized and standardized protocol leads to variability, as researchers may combine different available methods for concentration, extraction, and detection. Consequently, the sensitivity and process limit of detection (PLOD), which accounts for the efficiency of primary concentration, nucleic acid extraction, and PCR amplification, can vary significantly between studies. Understanding and accurately determining the PLOD is essential for the effectiveness of any wastewater surveillance system.
This study aimed to determine the PLODs for four pathogens, Salmonella Typhi, Vibrio cholerae, rotavirus, and SARS-CoV-2, in surface water and wastewater. To achieve this goal, we seeded dilution series with known concentrations of these pathogens, followed by concentration, extraction, and analysis using qPCR and dPCR. In addition to determining the PLODs, we compared the sensitivity of qPCR and dPCR assays in detecting the four pathogens in surface water and wastewater. Furthermore, we evaluated the recovery efficiency of dPCR for these pathogens through the combined processes of concentration, extraction, and dPCR analysis.

2. Materials and Methods

2.1. Source of Wastewater and Surface Water Samples

To conduct the PLOD experiments, it was necessary to obtain negative control water samples uncontaminated by the target pathogens. A surface water sample was collected from a small lake on the Emory University campus in Atlanta, GA, USA, which does not receive wastewater inflow from nearby households. Additionally, a negative wastewater sample was collected from a septic tank belonging to a family whose members had no prior history of COVID-19, typhoid, cholerae, or rotavirus infections. Prior to the PLOD experiments, both the surface water and wastewater samples were screened for Salmonella Typhi, Vibrio cholerae, rotavirus, and SARS-CoV-2 using the RT-qPCR or qPCR methods described below. The screening confirmed that the samples were free of these target pathogens.

2.2. S. Typhi, V. cholerae, Rotavirus, and SARS-CoV-2 Sources

Vibrio cholerae (ATCC, Manassas, VA, USA, #39315TM) was cultured in 1% peptone (Ward’s Science, 470301-496) under shaking conditions at 37 °C for 8 h, starting with a single colony inoculated from a Trypticase Soy Agar plate. Salmonella Typhi (ATCC, Manassas, VA, USA, #19430) was cultured overnight in Luria–Bertani (LB) broth at 37 °C under shaking conditions. The overnight cultures were quantified using a spectrophotometer, with the optical density (OD) used to estimate the colony-forming units (CFU) per milliliter of culture (CFU/mL).
The rotavirus Wa strain and its titration were provided by the Viral Disease Branch of the U.S. Centers for Disease Control and Prevention. As previously described [18], the Wa strain was propagated in MA104 cells, and the titration of the cultivated virus was determined using an immunospot assay.
Inactivated SARS-CoV-2 with a known concentration in genome copies (GC) per microliter was obtained from ATCC (Table 1). Prior to the seeding experiments, the viral stock was serially diluted under controlled conditions in a biohazard hood in the laboratory where this study was conducted.

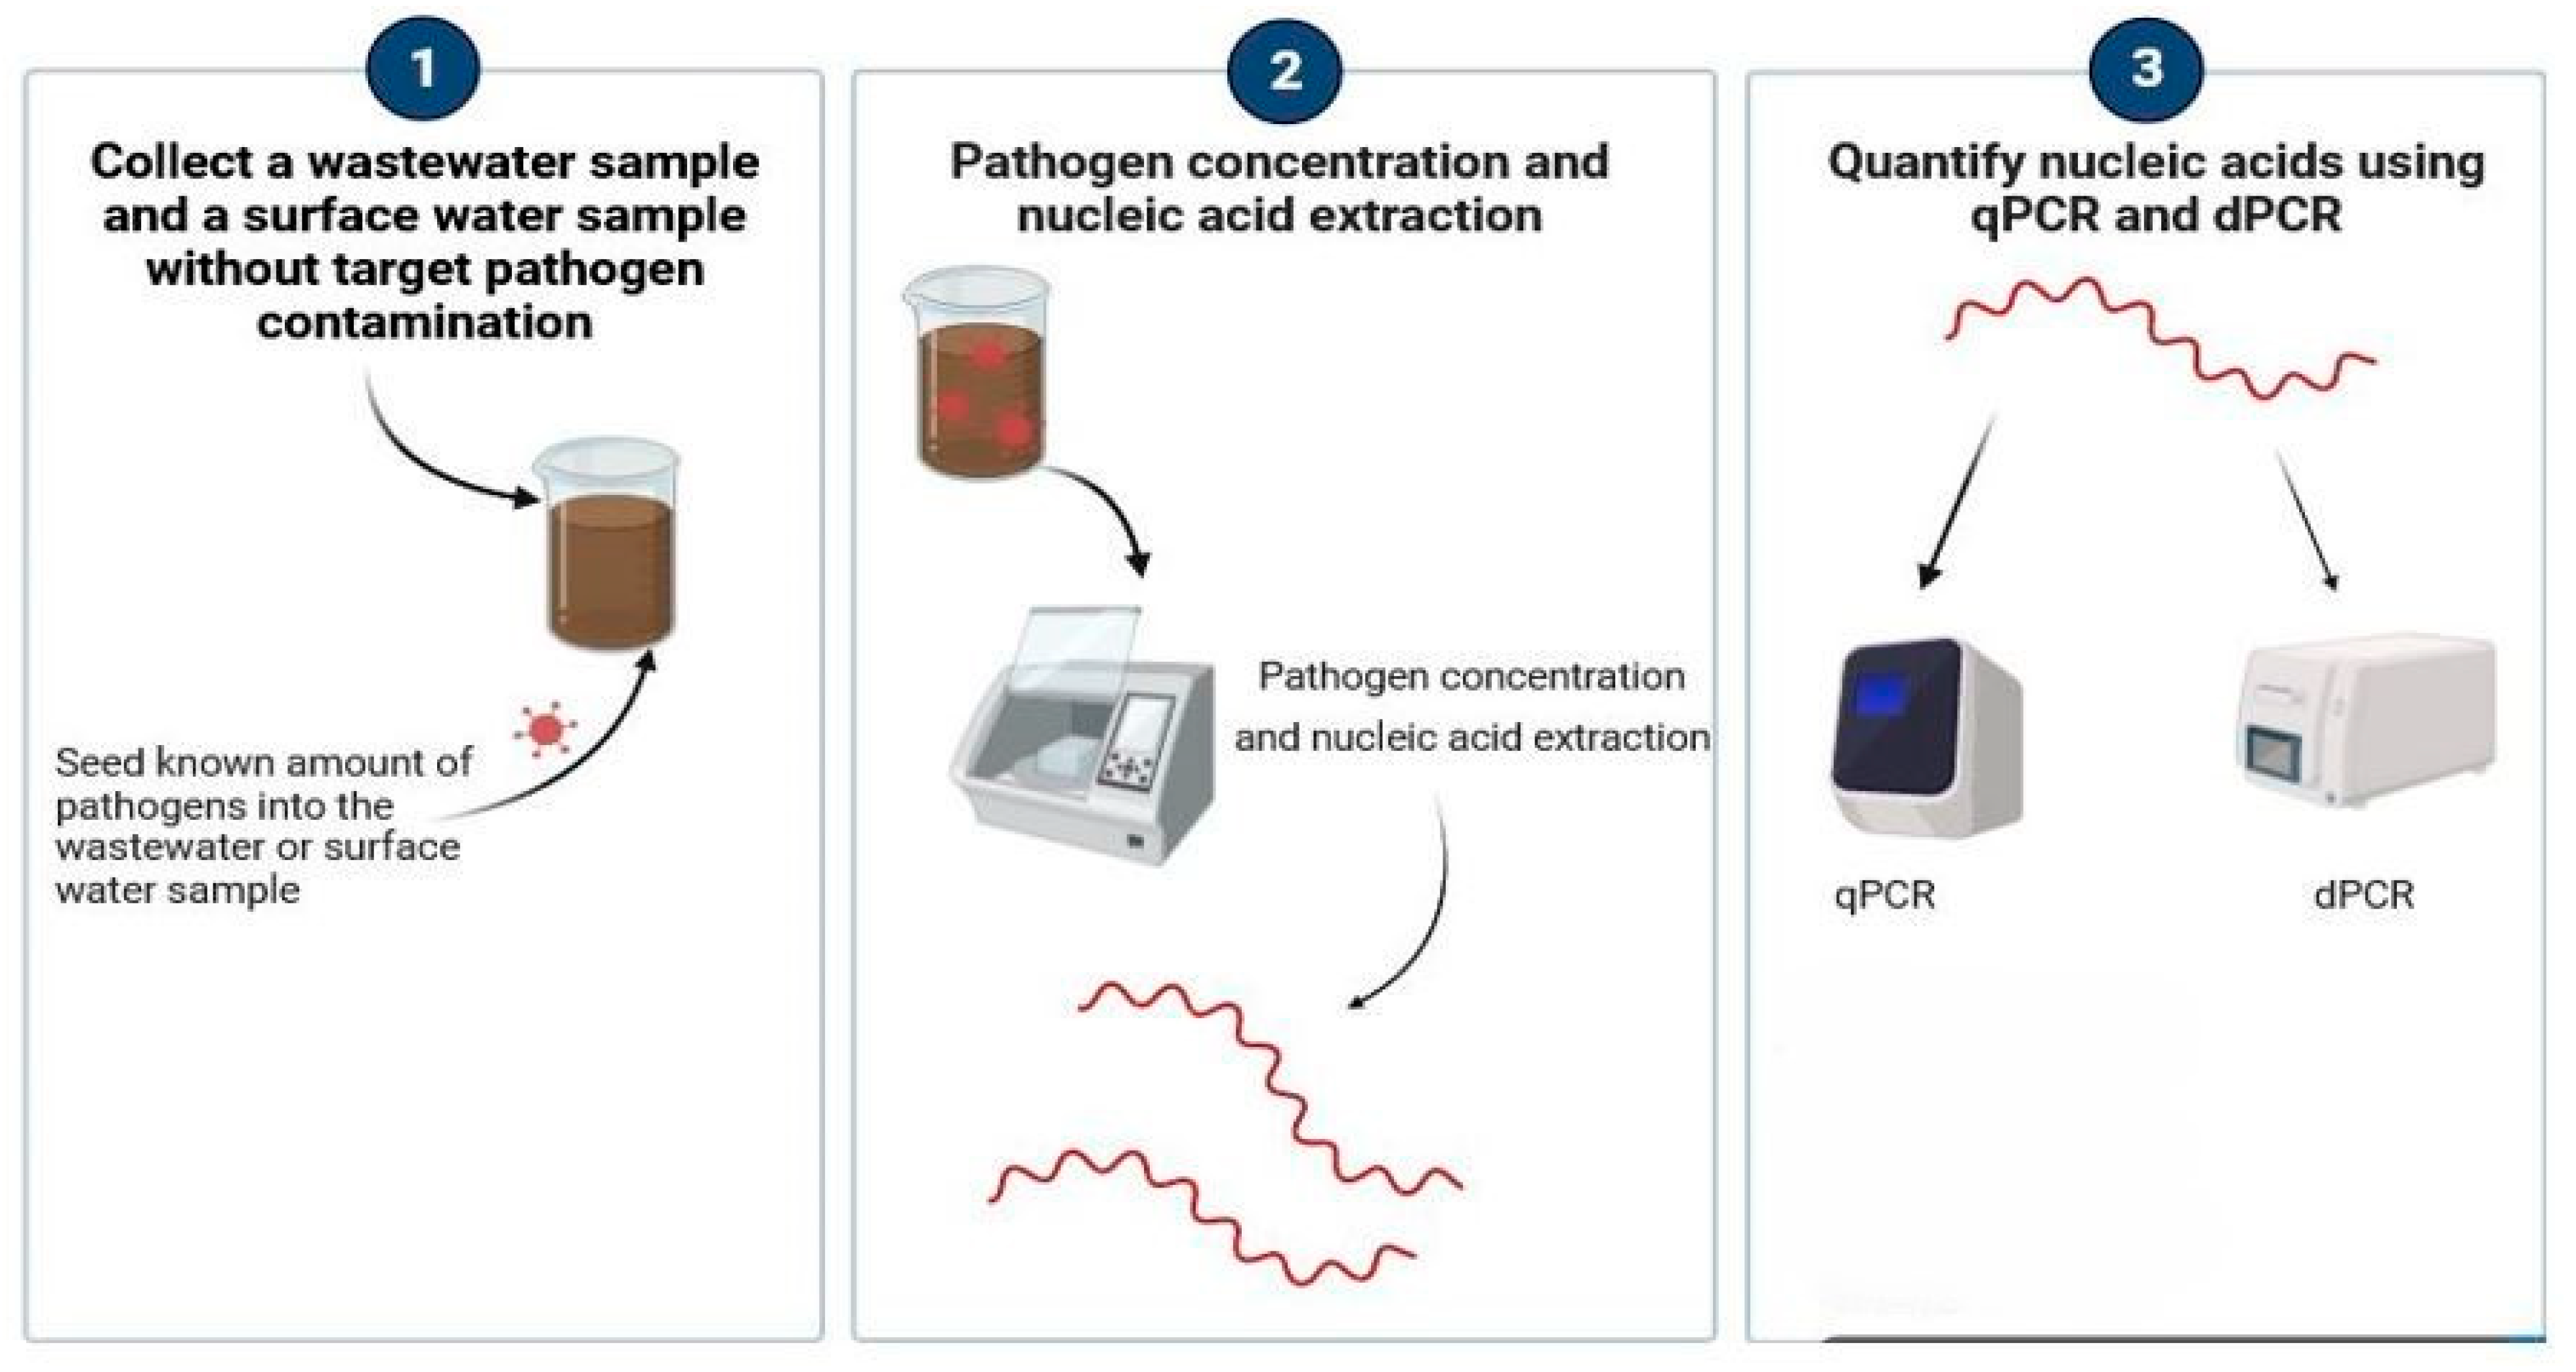
2.3. PLOD Seeding Experimental Workflow

Stock concentrations of Salmonella Typhi, Vibrio cholerae, rotavirus, and SARS-CoV-2 were serially diluted tenfold using 1×PBS. For each PLOD experiment, a specific dilution with a known concentration was seeded into a 10 mL sample of surface water or wastewater. The final seeding levels across the serial dilutions are shown in Table 2, Table 3, Table 4 and Table 5. Each 10 mL water sample was processed using the automated KingFisher™ Apex workflow (Figure 1) and then S. Typhi DNA, V. cholerae DNA, rotavirus RNA, and SARS-CoV-2 RNA were detected using the RT-qPCR and dPCR methods described below. For each pathogen, the experiment was performed in triplicate on different days, and the PLOD was defined as the most diluted concentration of the target pathogen detectable in all three replicate experiments. The average Ct value and the number of positive partitions were calculated based on the results from the three experiments.

2.4. Automated KingFisher™ Apex Workflow

A KingFisher™ Apex robot platform (Thermo Fisher Scientific, Waltham, MA, USA) was used for pathogen concentration and nucleic acid extraction from surface water or wastewater PLOD samples spiked with the target pathogens. Briefly, 50 µL of Nanotrap® enhancement reagent 1 (ER1, Ceres Nanoscience Inc., Manassas, VA, USA, #10111) were mixed with approximately 5 mL of wastewater and two replicate wells with a total of 10 mL of sample were used for each sample. After 10 min of incubation at room temperature, 75 µL of Nanotrap® particles were added and the sample plates were loaded into the KingFisher™ Apex. After pathogen concentration, samples were processed for RNA extraction using the Applied Biosystems MagMaxTM nucleic acid isolation kit on the same platform (Figure 1).

2.5. Quantitative Real-Time PCR Method

SARS-CoV-2 and rotavirus RNA were detected via the TaqPathTM RT-qPCR Master Mix (Thermo Fisher Scientific, Waltham, MA, USA) using the SARS-CoV-2 N1 primers/probe described before [12] or the rotavirus primers/probe targeting the non-structural protein region 3 [19], respectively. The SARS-CoV-2 RT-qPCR program consisted of 25 °C for 2 min, 55 °C for 15 min for reverse transcription, followed by 95 °C for 2 min, 95 °C for 3 s, and 55 °C for 30 s, with a total of 45 cycles. For rotavirus RT-qPCR, we used 25 °C for 2 min, 50 °C for 30 min, 95 °C for 15 min, followed by 45 cycles of 94 °C for 10 s, 57 °C for 30 s, and 72 °C for 20 s. V. cholerae and S. Typhi DNA were detected via qPCR using the cholerae primers/probe targeting the hemolysin gene [20], and the S. Typhi primers/probe described by Karkey et al. [21], respectively. The V. cholerae and S. Typhi qPCR program consisted of 25 °C for 2 min, 53 °C for 10 min, and 95 °C for 2 min with 45 cycles of 95 °C for 15 s and 56.5 °C for 1 min.
Singleplex qPCR analyses were performed in 20 µL reaction mixtures using TaqPathTM qPCR Master Mix (Thermo Fisher Scientific, Waltham, MA, USA). Each reaction contained 5 µL of 4× Master Mix, 0.2 µm probe and 0.2 µm primer mixture of the forward and reverse primers specific to V. cholerae, S. Typhi, SARS-CoV-2, and rotavirus; 8.5 µL of molecular water; and 5 µL of template loaded in duplicate wells in a 96-well plate and placed into a Bio-Rad CFX PCR thermocycler (Bio-Rad, Hercules, CA, USA). Positive results were defined as the presence of Ct values in duplicate reactions from one sample.

2.6. RT-dPCR and dPCR Method

Digital PCR was performed using the QIAcuity digital PCR system (Qiagen, Hilden, Germany) and the same primers/probes against S. Typhi, V. cholerae, rotavirus, and SARS-CoV-2, as described in the above qPCR methods. SARS-CoV-2 and rotavirus RNA were detected via an QIAcuity one-step viral RT-dPCR kit (Qiagen, catalog #1123145, Hilden, Germany) and 26K 24-well Nanoplates (Qiagen, Catalog # 1123145, Hilden, Germany) following the manufacturer’s protocol. dPCR analyses were performed in 40 µL reaction mixtures consisting of 10 µL of 4× One-step Advanced Probe Master Mix, 0.4 µL of 100× OneStep RT Mix, 2 µL of 16× each primer-probe mix, 5 µL of template, and 22.6 µL of RNAse-free water. The master mix was pipetted into a QIAGEN QIAcuity 24 well 26K partition nanoplate. The QIAcuity was configured with reverse transcription at 50 °C for 40 min, PCR initial heat activation with a single cycle at 95 °C for 2 min, and PCR cycling with 45 cycles at 95 °C for 5 s, followed by annealing/extension at 50 °C (56.5 °C for rotavirus) for 30 s. For V. cholerae and S. Typhi dPCR detection, we used initial heat activation at 95 °C for 2 min, followed by a total of 45 cycles of 95 °C for 5 s and 56.5 °C for 30 s. Samples were considered positive if both PCR reactions yielded at least three positive partitions within 45 amplification cycles.

2.7. Recovery Efficiency

The mean recovery efficiency of the four pathogens in surface water and wastewater was calculated using the pathogen copies quantified by dPCR as follows:
Recovery   efficiency   ( % ) = T o t a l   g e n o m e   c o p i e s   r e c o v e r e d T o t a l   g e n o m e   c o p i e s   s e e d e d   ×   100

2.8. Data Analyses

In this study, the PLOD was defined as the presence of PCR positive results in all three replicate experiments in the lowest seeding level of the target pathogen in water samples. For qPCR, Ct values from three positive experiments, a total of six data points, were averaged and the standard deviation was calculated. For dPCR, mean partitions and standard deviations were calculated from three positive experiments, a total of six data points.

3. Results

3.1. S. Typhi Process Limit of Recovery Efficiencies in Surface Water and Wastewater

The process limit of detection of S. Typhi in surface water and wastewater was evaluated through the analysis of serial diluted S. Typhi seeded in samples using qPCR and dPCR. S. Typhi DNA was detected in all surface water and wastewater samples using either qPCR or dPCR assays when seeding levels were 5.6 × 10⁶/10 mL, 4.6 × 10⁵/10 mL, 3.6 × 10⁴/10 mL, and 2.6 × 10³/10 mL in three replicate experiments. When the seeding level in surface water was reduced to 2.6 × 10²/10 mL, qPCR failed to detect S. Typhi DNA in all three experiments, but dPCR yielded positive results in one of the three experiments. In wastewater, at the lowest seeding level of 2.6 × 10²/10 mL, both qPCR and dPCR were able to detect S. Typhi DNA in two of the three experiments (Table 2).
S. Typhi mean recoveries in surface water ranged from 4.3 ± 3.5% to 10.4 ± 7.5% when seeding levels were between 5.6 × 10⁶/10 mL and 2.6 × 10³/10 mL. In wastewater samples, S. Typhi mean recoveries were significantly higher, ranging from 26.5 ± 12.8% to 40.1 ± 28.7% under the same seeding conditions (Table 2).
Table 2. S. Typhi process limit of detection in surface water and wastewater by qPCR and dPCR methods.
Genome Copies/
10 mL Surface Water
No. of Positive
/No. of Experiments
qPCR Ct
Mean (SD )
No. of Positive
/No. of Experiments
dPCR Mean
Partitions (SD)
Mean Recovery
Rate (%) (SD)
5.6 × 1063/327.3 (2.0)3/3911.3 (753.8)4.3 (3.5)
4.6 × 1053/329.6 (2.6)3/3215.2 (155.6)10.4 (7.5)
3.6 × 1043/333.7 (3.2)3/315.5 (17.0)7.4 (8.1)
2.6 × 1033/337.3 (1.2)3/31.3 (1.6)6.4 (7.8)
2.6 × 10²⁰/3-1/3--
Genome copies
/10 mL wastewater
No. of positive
/No. of experiments
qPCR Ct
mean (SD)
No. of positive
/No. of experiments
dPCR mean
partition (SD)
Mean recovery
rate (%) (SD)
5.6 × 1063/325.3 (1.0)3/37492.4 (3579.2)36.8 (14.6)
4.6 × 1053/329.2 (1.9)3/3628.3 (344.4)26.5 (12.8)
3.6 × 1043/332.2 (1.5)3/387.3 (76.6)40.1 (28.7)
2.6 × 1033/335.9 (1.3)3/36.5 (7.2)29.8 (29.6)
2.6 × 10²²/338.72/3--
Standard deviation.

3.2. V. cholerae Process Limit of Detection and Recovery Efficiencies in Surface Water and Wastewater

The PLODs for V. cholerae in surface water and wastewater were evaluated using qPCR and dPCR methods by analyzing serially diluted V. cholerae seeded in samples. V. cholerae DNA was consistently detected in all surface water and wastewater samples at seeding levels of 5.8 × 10⁶/10 mL, 4.8 × 10⁵/10 mL, 3.8 × 10⁴/10 mL, and 2.8 × 10³/10 mL across three experiments using either qPCR or dPCR. At a reduced seeding level of 190 cells per 10 mL in surface water, both qPCR and dPCR detected V. cholerae DNA in one of three replicate experiments. In wastewater, at the lowest seeding level of 190 cells per 10 mL, qPCR detected V. cholerae DNA in two out of three experiments, whereas dPCR detected V. cholerae DNA in one out of three experiments (Table 3).
V. cholerae mean recoveries in surface water ranged from 5.8% ± 4.1% to 9.3% ± 3.9% at seeding levels between 5.8 × 10⁶/10 mL and 2.8 × 10³/10 mL. In wastewater, mean recoveries were significantly higher, ranging from 42.0% ± 19.2% to 58.8% ± 31.6% under the same seeding conditions (Table 3).
Table 3. V. cholerae process limit of detection in surface water and wastewater detected by qPCR and dPCR methods.
Genome Copies/
10 mL Surface Water
No. of Positive
/No. of Experiments
qPCR Ct
Mean (SD )
No. of Positive
/No. of Experiments
dPCR Mean
Partitions (SD)
Mean Recovery
Rate (%) (SD)
5.8 × 1063/326.9 (1.4)3/31590.0 (1779.8)5.9 (6.6)
4.8 × 1053/329.0 (0.4)3/3247.7 (98.5)9.3 (3.9)
3.8 × 1043/333.1 (0.2)3/315.8 (6.7)6.0 (2.6)
2.8 × 1033/336.5 (1.2)3/31.5 (1.0)5.8 (4.1)
1901/3-1/3--
Genome copies
/10 mL wastewater
No. of positive
/No. of experiments
qPCR Ct
mean (SD)
No. of positive
/No. of experiments
dPCR mean
partition (SD)
Mean recovery
rate (%)
5.8 × 1063/325.0 (1.8)3/34485.8 (2997.0)50.6 (34.0)
4.8 × 1053/327.5 (0.9)3/3519.2 (275.7)58.8 (31.6)
3.8 × 1043/331.4 (0.7)3/337.2 (17.5)42.0 (19.2)
2.8 × 1033/334.4 (1.1)3/35.0 (2.5)48.0 (19.3)
1902/336.9 (0.5)1/3--
Standard deviation.

3.3. Rotavirus Process Limit of Detection and Recovery Efficiencies in Surface Water and Wastewater

The process limit of detection of rotaviruses in surface water and wastewater was evaluated through the analysis of serial diluted rotavirus stock seeded in samples using RT-qPCR and dPCR. Rotavirus RNA was detected in all rotaviruses seeded surface water and wastewater samples using either RT-qPCR or dPCR assays when seeding levels were 5.1 × 10⁶/10 mL, 4.1 × 10⁵/10 mL, 3.1 × 10⁴/10 mL, and 2.1 × 10³/10 mL in three replicate experiments. At a reduced seeding level of 110 genome copies per 10 mL surface water, both RT-qPCR and dPCR failed to detect rotavirus RNA in all three experiments. However, under the same seeding level of 110 genome copies in 10 mL wastewater samples, RT-qPCR detected rotavirus RNA in two of the three replicate experiments, whereas dPCR detected rotavirus RNA in one of the three experiments (Table 4).
Rotavirus recovery efficiency was significantly lower in both surface water and wastewater. The mean recoveries in surface water ranged from 0.8 ± 0.9% to 3.5 ± 0.3% when seeding levels were between 5.1 × 10⁶/10 mL and 2.1 × 10³/10 mL. In wastewater samples, rotavirus mean recoveries were between 1.5 ± 1.0% and 2.4 ± 1.0% under the same seeding conditions (Table 4).
Table 4. Rotavirus process limit of detection in surface water and wastewater detected by RT-qPCR and dPCR methods.
Genome Copies/
10 mL Surface Water
No. of Positive
/No. of Experiments
qPCR Ct
Mean (SD )
No. of Positive
/No. of Experiments
dPCR Mean
Partitions (SD)
Mean Recovery
Rate (%) (SD)
5.1 × 1063/326.8 (0.6)3/32977.8 (621.5)2.9 (0.6)
4.1 × 1053/330.5 (0.9)3/3247.0 (31.7)3.5 (0.3)
3.1 × 1043/334.9 (1.5)3/38.2 (9.1)0.8 (0.9)
2.1 × 1033/338.1 (2.0)3/32.1 (2.6)2.1 (2.6)
1100/3-0/3--
Genome copies
/10 mL wastewater
No. of positive
/No. of experiments
qPCR Ct
mean (SD)
No. of positive
/No. of experiments
dPCR mean
partition (SD)
Mean recovery
rate (%)
5.1 × 1063/327.5 (1.1)3/31977.2 (680.0)1.9 (0.7)
4.1 × 1053/330.7 (0.8)3/3171.8 (37.9)1.7 (0.4)
3.1 × 1043/333.7 (0.6)3/324.7 (10.3)2.4 (1.0)
2.1 × 1033/340.4 (0.9)3/31.5 (1.0)1.5 (1.0)
1102/336.9 (0.5)1/3--
Standard deviation.

3.4. SARS-CoV-2 Process Limit Detection and Recovery Efficiencies in Surface Water and Wastewater

The process limit of detection for SARS-CoV-2 in surface water and wastewater was evaluated using RT-qPCR and dPCR by analyzing serially diluted inactivated SARS-CoV-2 seeded into samples. SARS-CoV-2 RNA was detected in all virus-seeded samples using either RT-qPCR or dPCR when seeding levels exceeded 2.9 × 10⁴/10 mL across three replicate experiments, approximately one log higher than the detection limit observed for other evaluated pathogens. At a reduced seeding level of 1.9 × 10³/10 mL genome copies in surface water, both RT-qPCR and dPCR detected SARS-CoV-2 RNA in two out of three replicates. However, in wastewater at the seeding level of 1.9 × 10³/10 mL genome copies, RT-qPCR failed to detect SARS-CoV-2 RNA, whereas dPCR successfully detected it in all three replicate experiments (Table 5).
Similar to the recovery efficiency observed for rotavirus, the recovery efficiency of SARS-CoV-2 was also significantly lower in both surface water and wastewater. In surface water, mean recoveries ranged from 1.5% ± 0.7% to 2.3% ± 0.5% at seeding levels between 4.9 × 10⁶/10 mL and 2.9 × 10⁴/10 mL genome copies per 10 mL. In wastewater, mean recoveries for SARS-CoV-2 ranged from 1.5% ± 1.0% to 2.4% ± 1.0% under the same seeding conditions (Table 5).
Table 5. SARS-CoV-2 assay limit of detection in surface water and wastewater detected by RT-qPCR and dPCR methods.
Genome Copies/
10 mL Surface Water
No. of Positive
/No. of Experiments
qPCR Ct
Mean (SD )
No. of Positive
/No. of Experiments
dPCR Mean
Partitions (SD)
Mean Recovery
Rate (%) (SD)
4.9 × 1063/328.3 (0.1)3/3263.8 (57.4)2.3 (0.5)
3.9 × 1053/333.0 (0.4)3/316.7 (8.4)1.5 (0.7)
2.9 × 1043/336.2 (0.8)3/32.5 (1.9)2.2 (1.7)
1.9 × 1032/339.5 (0.1)2/3--
600/3-1/3--
Genome copies
/10 mL wastewater
No. of positive
/No. of experiments
qPCR Ct
mean (SD)
No. of positive
/No. of experiments
dPCR mean
partition (SD)
Mean recovery
rate (%)
4.9 × 1063/329.4 (0.7)3/31046.5 (201.6)1.9 (0.7)
3.9 × 1053/332.5 (0.8)3/3110.8 (32.3)1.7 (0.4)
2.9 × 1043/336.4 (0.8)3/39.5 (3.1)2.4 (1.0)
1.9 × 1030/340.5 (1.2)3/30.5 (0.6)1.5 (1.0)
600/3-0/3--
Standard deviation.

4. Discussion

In this study, we determined the PLODs for four pathogens in surface water and wastewater using qPCR and dPCR. The PLODs for S. Typhi, V. cholerae, and rotavirus in both surface water and wastewater were approximately 3–4 log10 loads (2.1 × 10³/10 mL to 2.9 × 10⁴/10 mL), consistent across both qPCR and dPCR methods. These PLODs represent the lowest number of genome copies that can be reliably detected by our WBE system in surface water or wastewater, based on the pathogen concentration, nucleic acid extraction, and PCR methods employed in this study.
The mean recovery rates for S. Typhi, V. cholerae, rotavirus, and SARS-CoV-2 in both surface water and wastewater were generally below 10.4% when dPCR was used. However, the recoveries for S. Typhi and V. cholerae in wastewater were significantly higher, ranging from 26.5% at 4.6 × 10⁵/10 mL for S. Typhi to 58.8% at 4.8 × 10⁵/10 mL for V. cholerae. Our analysis indicated that recovery efficiencies were not associated with seeding levels for all four pathogens.
This study assessed the sensitivity of the WBE system for detecting S. Typhi, V. cholerae, rotavirus, and SARS-CoV-2, as measured by the PLOD, which accounts for pathogen concentration, nucleic acid extraction, and qPCR/dPCR analysis procedures. The workflow used in this study can be applied in future studies except that manual nucleic acid extraction can replace the automatic extraction method (may be not available), since our previous study showed no difference between the manual and automatic extraction methods [12]. The PLOD differs from the assay limit of detection (ALOD) that many studies have used to report the analytical sensitivity of the qPCR procedure [22,23,24,25]. For example, Rashid et al. developed a novel real-time PCR assay for detecting V. cholerae and reported that it could detect as few as 5.46 genome copies of V. cholerae in a single qPCR reaction [26]. Thus, the limit of detection for that qPCR assay was 5.46 genome copies, which represents the lowest number of V. cholerae that the qPCR assay can reliably detect. For wastewater surveillance, analytical sensitivity must consider the procedures involved in pathogen concentration, nucleic acid extraction, PCR amplification, and also potential PCR inhibition caused by substances that interfere with the PCR process and reduce its sensitivity. For example, Ahmed et al. [27] seeded a dilution series of known concentrations of SARS-CoV-2 virions into SARS-CoV-2-negative wastewater to evaluate the PLOD, which reflects the sensitivity of the entire processing workflow, including concentration, nucleic acid extraction, and PCR assays. The PLOD ranged from 2.32 × 10³ GC/50 mL to 3.95 × 10³ GC/50 mL across different seeding levels and RT-qPCR assays. In the present study, the PLOD is comparable to the values reported by Ahmed et al. [27] for SARS-CoV-2 in wastewater but there were no reports, as far as we know, that we can compare with for S. Typhi, V. cholerae, and rotavirus.
Since we seeded known concentrations of S. Typhi, V. cholerae, rotavirus, and SARS-CoV-2 into surface water and wastewater and applied dPCR for quantification of recovered pathogens, we could calculate the recovery efficiencies for the seeding levels of the four pathogens. The mean recovery rates for all four pathogens in both surface water and wastewater were generally below 10.4%. However, the recoveries for S. Typhi and V. cholerae in wastewater were significantly higher, between 26.5% and 58.8%. These recovery efficiencies basically are in the range of the recovery efficiency of bacteria and viruses in wastewater reported in the literature [28,29,30,31,32]. Recovery efficiencies varied significantly among studies, pathogen concentration methods, nucleic acid extraction methods, PCR detection methods, and target microorganism (size, structure, and surface properties, etc). For example, the recovery efficiencies of ultrafiltration and membrane adsorption methods for SARS-CoV-2 ranged from 4.0% to 11.0% [31], which are similar to this study. In addition, other factors, including wastewater matrix (turbidity, organic matter, and solid concentration, etc.) and optimization (pretreatment, pH, and chemical additions, etc.) can affect recovery efficiency. For best efficiency, a combination of methods may be used to maximize recovery while minimizing losses during the processing and detection procedures.
qPCR (including RT-qPCR) and digital PCR (dPCR, including droplet digital PCR) have become the two primary methods for detecting pathogen nucleic acids in wastewater. qPCR quantifies pathogens using a standard curve, but its performance can be affected by PCR inhibition. In contrast, digital PCR has recently gained attention as a promising tool for WBE and environmental surveillance. It offers quantification without the need for a standard curve and is less susceptible to PCR inhibition [33]. While some studies [34,35,36,37] have compared these two platforms for clinical samples, there is limited data directly comparing their performance in pathogen detection in wastewater samples. A direct comparison of RT-qPCR and RT-ddPCR for detecting SARS-CoV-2 using N1 primers in wastewater samples from aircraft and cruise ships showed only a small difference between the two assays [38]. In another study, Mark et al. compared RT-ddPCR and RT-qPCR using N2 primers to quantify SARS-CoV-2 RNA in influent wastewater samples collected from southeast Virginia between May and July 2020. The results revealed that the assay limit of detection (ALOD) for RT-ddPCR was 0.25 genome copies/reaction, significantly lower than the ALOD for RT-qPCR at 60 copies/reaction [39]. In the current study, we found no significant difference between qPCR and dPCR for the limit of detection of four pathogens in wastewater and surface water. However, it is worth noting that we used the QIAcuity dPCR platform (QIAgen, Hilden Germany) in our study, in contrast to the ddPCR platform (Bio-Rad) used in the studies mentioned above. While ddPCR may offer higher sensitivity than qPCR and dPCR, further research is needed to better understand the performance differences among dPCR, ddPCR, and qPCR.
This study has several limitations. First, wastewater and surface water are complex mixtures containing substances beyond fecal materials and water. Some of these substances, such as humic acids, fats, and proteins, can partially or completely inhibit PCR amplification of pathogen nucleic acids [40,41], potentially leading to underestimation of pathogen concentrations or false-negative results. In this study, we were unable to evaluate the effects of PCR inhibition on detection, quantification, and recovery efficiency in wastewater and surface water. Second, the stock pathogens used for the seeding experiments were obtained from different sources and quantified using varied methods, including immunospot assay for rotavirus, spectrophotometry for S. Typhi and V. cholerae, and dPCR for SARS-CoV-2. These different quantification methods may introduce biases, and the actual genome copy numbers in the stock pathogens may differ from the quantified values. Third, pathogen concentration in this study was performed using Nanotrap particles, followed by nucleic acid extraction on the KingFisher™ Apex robot platform. While this system is advanced and efficient, the PLODs and recovery efficiencies derived from it may vary compared to those obtained using other concentration and extraction methods. Fourth, we only used molecular based PCR methods to detect seeded pathogens, and we did not culture the pathogens to confirm the molecular results. Despite these limitations, the PLODs and recovery efficiencies of S. Typhi, V. cholerae, rotavirus, and SARS-CoV-2 in surface water and wastewater obtained using qPCR and dPCR analyses provide valuable insights. These findings are significant for advancing wastewater-based epidemiology of these pathogens and estimating their concentrations in wastewater and surface water.
In summary, the observed process limit of detections for S. Typhi, V. cholerae, SARS-CoV-2, and rotavirus in 10 mL of surface water and wastewater were approximately 3–4 log10 loads using either qPCR or dPCR as the detection method. These results provide important information for understanding pathogen surveillance in wastewater or surface water.

Author Contributions

P.L.: Conceptualization, investigation, methodology, and writing. O.S.: Data curation and methodology. A.N.: Data curation and methodology. A.L.: Data curation and methodology. C.M.: Review and editing. All authors have read and agreed to the published version of the manuscript.

Funding

This study was financially supported by the Rockefeller Foundation (Grant number: 2021 HTH 054) to Emory University. We are thankful to Suraja Raj for her leadership. We are grateful to Megan Diamon and Alex Robinson from the Rockefeller Foundation.

Data Availability Statement

The raw data supporting the conclusions of this article will be made available by the authors, without undue reservation.

Conflicts of Interest

No conflict of interest declared.

References

  1. Amin, N.; Liu, P.; Foster, T.; Rahman, M.; Miah, M.R.; Ahmed, G.B.; Kabir, M.; Raj, S.; Moe, C.L.; Willetts, J. Pathogen flows from on-site sanitation systems in low-income urban neighborhoods, Dhaka: A quantitative environmental assessment. Int. J. Hyg. Environ. Health 2020, 230, 113619. [Google Scholar] [CrossRef]
  2. Barrett, T.J.; Blake, P.A.; Morris, G.K.; Puhr, N.D.; Bradford, H.B.; Wells, J.G. Use of Moore swabs for isolating Vibrio cholerae from sewage. J. Clin. Microbiol. 1980, 11, 385–388. [Google Scholar] [CrossRef]
  3. Tao, Z.; Wang, H.; Xu, A.; Zhang, Y.; Song, L.; Zhu, S.; Li, Y.; Yan, D.; Liu, G.; Yoshida, H.; et al. Isolation of a recombinant type 3/type 2 poliovirus with a chimeric capsid VP1 from sewage in Shandong, China. Virus Res. 2010, 150, 56–60. [Google Scholar] [CrossRef]
  4. Kazama, S.; Masago, Y.; Tohma, K.; Souma, N.; Imagawa, T.; Suzuki, A.; Liu, X.; Saito, M.; Oshitani, H.; Omura, T. Temporal dynamics of norovirus determined through monitoring of municipal wastewater by pyrosequencing and virological surveillance of gastroenteritis cases. Water Res. 2016, 92, 244–253. [Google Scholar] [CrossRef]
  5. Giron-Guzman, I.; Cuevas-Ferrando, E.; Barranquero, R.; Diaz-Reolid, A.; Puchades-Colera, P.; Falco, I.; Perez-Cataluna, A.; Sanchez, G. Urban wastewater-based epidemiology for multi-viral pathogen surveillance in the Valencian region, Spain. Water Res. 2024, 255, 121463. [Google Scholar] [CrossRef]
  6. Jahan, F.; Nasim, M.I.; Wang, Y.; Kamrul Bashar, S.M.; Hasan, R.; Suchana, A.J.; Amin, N.; Haque, R.; Hares, M.A.; Saha, A.; et al. Integrating wastewater surveillance and meteorological data to monitor seasonal variability of enteric and respiratory pathogens for infectious disease control in Dhaka city. Int. J. Hyg. Environ. Health 2025, 267, 114591. [Google Scholar] [CrossRef]
  7. Mueller, J.E.; Bessaud, M.; Huang, Q.S.; Martinez, L.C.; Barril, P.A.; Morel, V.; Balanant, J.; Bocacao, J.; Hewitt, J.; Gessner, B.D.; et al. Environmental poliovirus surveillance during oral poliovirus vaccine and inactivated poliovirus vaccine use in Cordoba Province, Argentina. Appl. Environ. Microbiol. 2009, 75, 1395–1401. [Google Scholar] [CrossRef]
  8. Zoni, R.; Mezzetta, S.; Affanni, P.; Colucci, M.E.; Fiore, S.; Fontana, S.; Bracchi, M.; Capobianco, E.; Veronesi, L. Poliovirus and non-polio-enterovirus environmental surveillance in Parma within the “Global Polio Eradication Program” (GPEI). Acta Biomed. Atenei Parm. 2019, 90, 95–97. [Google Scholar]
  9. Lodder, W.J.; Buisman, A.M.; Rutjes, S.A.; Heijne, J.C.; Teunis, P.F.; de Roda Husman, A.M. Feasibility of quantitative environmental surveillance in poliovirus eradication strategies. Appl. Environ. Microbiol. 2012, 78, 3800–3805. [Google Scholar] [CrossRef]
  10. de Oliveira Pereira, J.S.; da Silva, L.R.; de Meireles Nunes, A.; de Souza Oliveira, S.; da Costa, E.V.; da Silva, E.E. Environmental Surveillance of Polioviruses in Rio de Janeiro, Brazil, in Support to the Activities of Global Polio Eradication Initiative. Food Environ. Virol. 2016, 8, 27–33. [Google Scholar] [CrossRef]
  11. Ozawa, H.; Yoshida, H.; Usuku, S. Environmental Surveillance Can Dynamically Track Ecological Changes in Enteroviruses. Appl. Environ. Microbiol. 2019, 85, e01604-19. [Google Scholar] [CrossRef]
  12. Liu, P.; Guo, L.; Cavallo, M.; Cantrell, C.; Hilton, S.P.; Nguyen, A.; Long, A.; Dunbar, J.; Barbero, R.; Barclay, R.; et al. Comparison of Nanotrap((R)) Microbiome A Particles, membrane filtration, and skim milk workflows for SARS-CoV-2 concentration in wastewater. Front. Microbiol. 2023, 14, 1215311. [Google Scholar] [CrossRef]
  13. Ahmed, W.; Angel, N.; Edson, J.; Bibby, K.; Bivins, A.; O’Brien, J.W.; Choi, P.M.; Kitajima, M.; Simpson, S.L.; Li, J.; et al. First confirmed detection of SARS-CoV-2 in untreated wastewater in Australia: A proof of concept for the wastewater surveillance of COVID-19 in the community. Sci. Total Environ. 2020, 728, 138764. [Google Scholar] [CrossRef]
  14. Liu, P.; Ibaraki, M.; Kapoor, R.; Amin, N.; Das, A.; Miah, R.; Mukhopadhyay, A.K.; Rahman, M.; Dutta, S.; Moe, C.L. Development of Moore Swab and Ultrafiltration Concentration and Detection Methods for Salmonella Typhi and Salmonella Paratyphi A in Wastewater and Application in Kolkata, India and Dhaka, Bangladesh. Front. Microbiol. 2021, 12, 684094. [Google Scholar] [CrossRef]
  15. Philo, S.E.; Ong, A.Q.W.; Keim, E.K.; Swanstrom, R.; Kossik, A.L.; Zhou, N.A.; Beck, N.K.; Meschke, J.S. Development and Validation of the Skimmed Milk Pellet Extraction Protocol for SARS-CoV-2 Wastewater Surveillance. Food Environ. Virol. 2022, 14, 355–363. [Google Scholar] [CrossRef]
  16. Wurtzer, S.; Marechal, V.; Mouchel, J.M.; Maday, Y.; Teyssou, R.; Richard, E.; Almayrac, J.L.; Moulin, L. Evaluation of lockdown effect on SARS-CoV-2 dynamics through viral genome quantification in waste water, Greater Paris, France, 5 March to 23 April 2020. Eurosurveillance 2020, 25, 2000776. [Google Scholar] [CrossRef]
  17. Fores, E.; Bofill-Mas, S.; Itarte, M.; Martinez-Puchol, S.; Hundesa, A.; Calvo, M.; Borrego, C.M.; Corominas, L.L.; Girones, R.; Rusinol, M. Evaluation of two rapid ultrafiltration-based methods for SARS-CoV-2 concentration from wastewater. Sci. Total Environ. 2021, 768, 144786. [Google Scholar] [CrossRef]
  18. Resch, T.K.; Wang, Y.; Moon, S.; Jiang, B. Serial Passaging of the Human Rotavirus CDC-9 Strain in Cell Culture Leads to Attenuation: Characterization from In Vitro and In Vivo Studies. J. Virol. 2020, 94, 10-1128. [Google Scholar] [CrossRef]
  19. Jothikumar, N.; Kang, G.; Hill, V.R. Broadly reactive TaqMan assay for real-time RT-PCR detection of rotavirus in clinical and environmental samples. J. Virol. Methods 2009, 155, 126–131. [Google Scholar] [CrossRef]
  20. Huang, J.; Zhu, Y.; Wen, H.; Zhang, J.; Huang, S.; Niu, J.; Li, Q. Quadruplex real-time PCR assay for detection and identification of Vibrio cholerae O1 and O139 strains and determination of their toxigenic potential. Appl. Environ. Microbiol. 2009, 75, 6981–6985. [Google Scholar] [CrossRef]
  21. Karkey, A.; Jombart, T.; Walker, A.W.; Thompson, C.N.; Torres, A.; Dongol, S.; Tran Vu Thieu, N.; Pham Thanh, D.; Tran Thi Ngoc, D.; Voong Vinh, P.; et al. The Ecological Dynamics of Fecal Contamination and Salmonella Typhi and Salmonella Paratyphi A in Municipal Kathmandu Drinking Water. PLoS Negl. Trop. Dis. 2016, 10, e0004346. [Google Scholar] [CrossRef]
  22. Igloi, Z.; Leven, M.; Abdel-Karem Abou-Nouar, Z.; Weller, B.; Matheeussen, V.; Coppens, J.; Koopmans, M.; Molenkamp, R. Comparison of commercial realtime reverse transcription PCR assays for the detection of SARS-CoV-2. J. Clin. Virol. 2020, 129, 104510. [Google Scholar] [CrossRef]
  23. Corman, V.M.; Drosten, C. Authors’ response: SARS-CoV-2 detection by real-time RT-PCR. Eurosurveillance 2020, 25, 2001035. [Google Scholar] [CrossRef]
  24. Kudo, E.; Israelow, B.; Vogels, C.B.F.; Lu, P.; Wyllie, A.L.; Tokuyama, M.; Venkataraman, A.; Brackney, D.E.; Ott, I.M.; Petrone, M.E.; et al. Detection of SARS-CoV-2 RNA by multiplex RT-qPCR. PLoS Biol. 2020, 18, e3000867. [Google Scholar] [CrossRef]
  25. Hayes, E.K.; Gouthro, M.T.; LeBlanc, J.J.; Gagnon, G.A. Simultaneous detection of SARS-CoV-2, influenza A, respiratory syncytial virus, and measles in wastewater by multiplex RT-qPCR. Sci. Total Environ. 2023, 889, 164261. [Google Scholar] [CrossRef]
  26. Rashid, R.B.; Ferdous, J.; Tulsiani, S.; Jensen, P.K.M.; Begum, A. Development and Validation of a Novel Real-time Assay for the Detection and Quantification of Vibrio cholerae. Front. Public Health 2017, 5, 109. [Google Scholar] [CrossRef]
  27. Ahmed, W.; Bivins, A.; Metcalfe, S.; Smith, W.J.M.; Verbyla, M.E.; Symonds, E.M.; Simpson, S.L. Evaluation of process limit of detection and quantification variation of SARS-CoV-2 RT-qPCR and RT-dPCR assays for wastewater surveillance. Water Res. 2022, 213, 118132. [Google Scholar] [CrossRef]
  28. Ahuja, S.; Tallur, S.; Kondabagil, K. Simultaneous microbial capture and nucleic acid extraction from wastewater with minimal pre-processing and high recovery efficiency. Sci. Total Environ. 2024, 918, 170347. [Google Scholar] [CrossRef]
  29. Ahmed, W.; Smith, W.J.M.; Sirikanchana, K.; Kitajima, M.; Bivins, A.; Simpson, S.L. Influence of membrane pore-size on the recovery of endogenous viruses from wastewater using an adsorption-extraction method. J. Virol. Methods 2023, 317, 114732. [Google Scholar] [CrossRef]
  30. Vadde, K.K.; Al-Duroobi, H.; Phan, D.C.; Jafarzadeh, A.; Moghadam, S.V.; Matta, A.; Kapoor, V. Assessment of Concentration, Recovery, and Normalization of SARS-CoV-2 RNA from Two Wastewater Treatment Plants in Texas and Correlation with COVID-19 Cases in the Community. Acs Es&T Water 2022, 2, 2060–2069. [Google Scholar]
  31. Zheng, X.; Deng, Y.; Xu, X.; Li, S.; Zhang, Y.; Ding, J.; On, H.Y.; Lai, J.C.C.; In Yau, C.; Chin, A.W.H.; et al. Comparison of virus concentration methods and RNA extraction methods for SARS-CoV-2 wastewater surveillance. Sci. Total Environ. 2022, 824, 153687. [Google Scholar] [CrossRef]
  32. Betancourt, W.Q.; Schmitz, B.W.; Innes, G.K.; Prasek, S.M.; Pogreba Brown, K.M.; Stark, E.R.; Foster, A.R.; Sprissler, R.S.; Harris, D.T.; Sherchan, S.P.; et al. COVID-19 containment on a college campus via wastewater-based epidemiology, targeted clinical testing and an intervention. Sci. Total Environ. 2021, 779, 146408. [Google Scholar] [CrossRef]
  33. Cao, Y.; Raith, M.R.; Griffith, J.F. Droplet digital PCR for simultaneous quantification of general and human-associated fecal indicators for water quality assessment. Water Res. 2015, 70, 337–349. [Google Scholar] [CrossRef]
  34. Falzone, L.; Musso, N.; Gattuso, G.; Bongiorno, D.; Palermo, C.I.; Scalia, G.; Libra, M.; Stefani, S. Sensitivity assessment of droplet digital PCR for SARS-CoV-2 detection. Int. J. Mol. Med. 2020, 46, 957–964. [Google Scholar] [CrossRef]
  35. Liu, C.; Shi, Q.; Peng, M.; Lu, R.; Li, H.; Cai, Y.; Chen, J.; Xu, J.; Shen, B. Evaluation of droplet digital PCR for quantification of SARS-CoV-2 Virus in discharged COVID-19 patients. Aging 2020, 12, 20997–21003. [Google Scholar] [CrossRef]
  36. Tedim, A.P.; Almansa, R.; Dominguez-Gil, M.; Gonzalez-Rivera, M.; Micheloud, D.; Ryan, P.; Mendez, R.; Blanca-Lopez, N.; Perez-Garcia, F.; Bustamante, E.; et al. Comparison of real-time and droplet digital PCR to detect and quantify SARS-CoV-2 RNA in plasma. Eur. J. Clin. Investig. 2021, 51, e13501. [Google Scholar] [CrossRef]
  37. Liu, X.; Feng, J.; Zhang, Q.; Guo, D.; Zhang, L.; Suo, T.; Hu, W.; Guo, M.; Wang, X.; Huang, Z.; et al. Analytical comparisons of SARS-CoV-2 detection by qRT-PCR and ddPCR with multiple primer/probe sets. Emerg. Microbes Infect. 2020, 9, 1175–1179. [Google Scholar] [CrossRef]
  38. Ahmed, W.; Bertsch, P.M.; Angel, N.; Bibby, K.; Bivins, A.; Dierens, L.; Edson, J.; Ehret, J.; Gyawali, P.; Hamilton, K.A.; et al. Detection of SARS-CoV-2 RNA in commercial passenger aircraft and cruise ship wastewater: A surveillance tool for assessing the presence of COVID-19 infected travellers. J. Travel Med. 2020, 27, taaa116. [Google Scholar] [CrossRef]
  39. Ciesielski, M.; Blackwood, D.; Clerkin, T.; Gonzalez, R.; Thompson, H.; Larson, A.; Noble, R. Assessing sensitivity and reproducibility of RT-ddPCR and RT-qPCR for the quantification of SARS-CoV-2 in wastewater. J. Virol. Methods 2021, 297, 114230. [Google Scholar] [CrossRef]
  40. Sidstedt, M.; Jansson, L.; Nilsson, E.; Noppa, L.; Forsman, M.; Radstrom, P.; Hedman, J. Humic substances cause fluorescence inhibition in real-time polymerase chain reaction. Anal. Biochem. 2015, 487, 30–37. [Google Scholar] [CrossRef]
  41. Schrader, C.; Schielke, A.; Ellerbroek, L.; Johne, R. PCR inhibitors—Occurrence, properties and removal. J. Appl. Microbiol. 2012, 113, 1014–1026. [Google Scholar] [CrossRef] [PubMed]
Figure 1. S. Typhi, V. cholerae, rotavirus, and SARS-CoV-2 seeding experiments in surface water and wastewater. (1) Known amount of S. Typhi, V. cholerae, rotavirus, and SARS-CoV-2 were seeded into a negative wastewater sample or a surface water sample; (2) The sample was concentrated using the KingfisherTM Apex robot platform coupled with Nanotrap® particles for concentration and an Applied Biosystems MagMaxTM nucleic acid isolation kit; (3) Both qPCR (or RT-qPCR) and dPCR (or RT-dPCR) were used for pathogen detection.
Water 17 02077 g001
Table 1. S. Typhi, V. cholerae, rotavirus, and SARS-CoV-2 source for the spiking experiments.
PathogenVendorClassificationSource/Quantification Method
S. TyphiATCC (#19430)Strain Ty2Culture/spectrophotometer
V. choleraeATCC (#39315)EI Tor Inaba N16961Culture/spectrophotometer
RotavirusUS CDCHuman strain WaCulture/immunospot assay
SARS-CoV-2ATCC (VR-1986HK)2019-nCoV/USA-WA1/2020Patient/dPCR
Disclaimer/Publisher’s Note: The statements, opinions and data contained in all publications are solely those of the individual author(s) and contributor(s) and not of MDPI and/or the editor(s). MDPI and/or the editor(s) disclaim responsibility for any injury to people or property resulting from any ideas, methods, instructions or products referred to in the content.

