
Hydroclimatic Trends and Land Use Changes in the Continental Part of the Gambia River Basin: Implications for Water Resources

 ,
,
Abstract
1. Introduction
2. Data and Methods
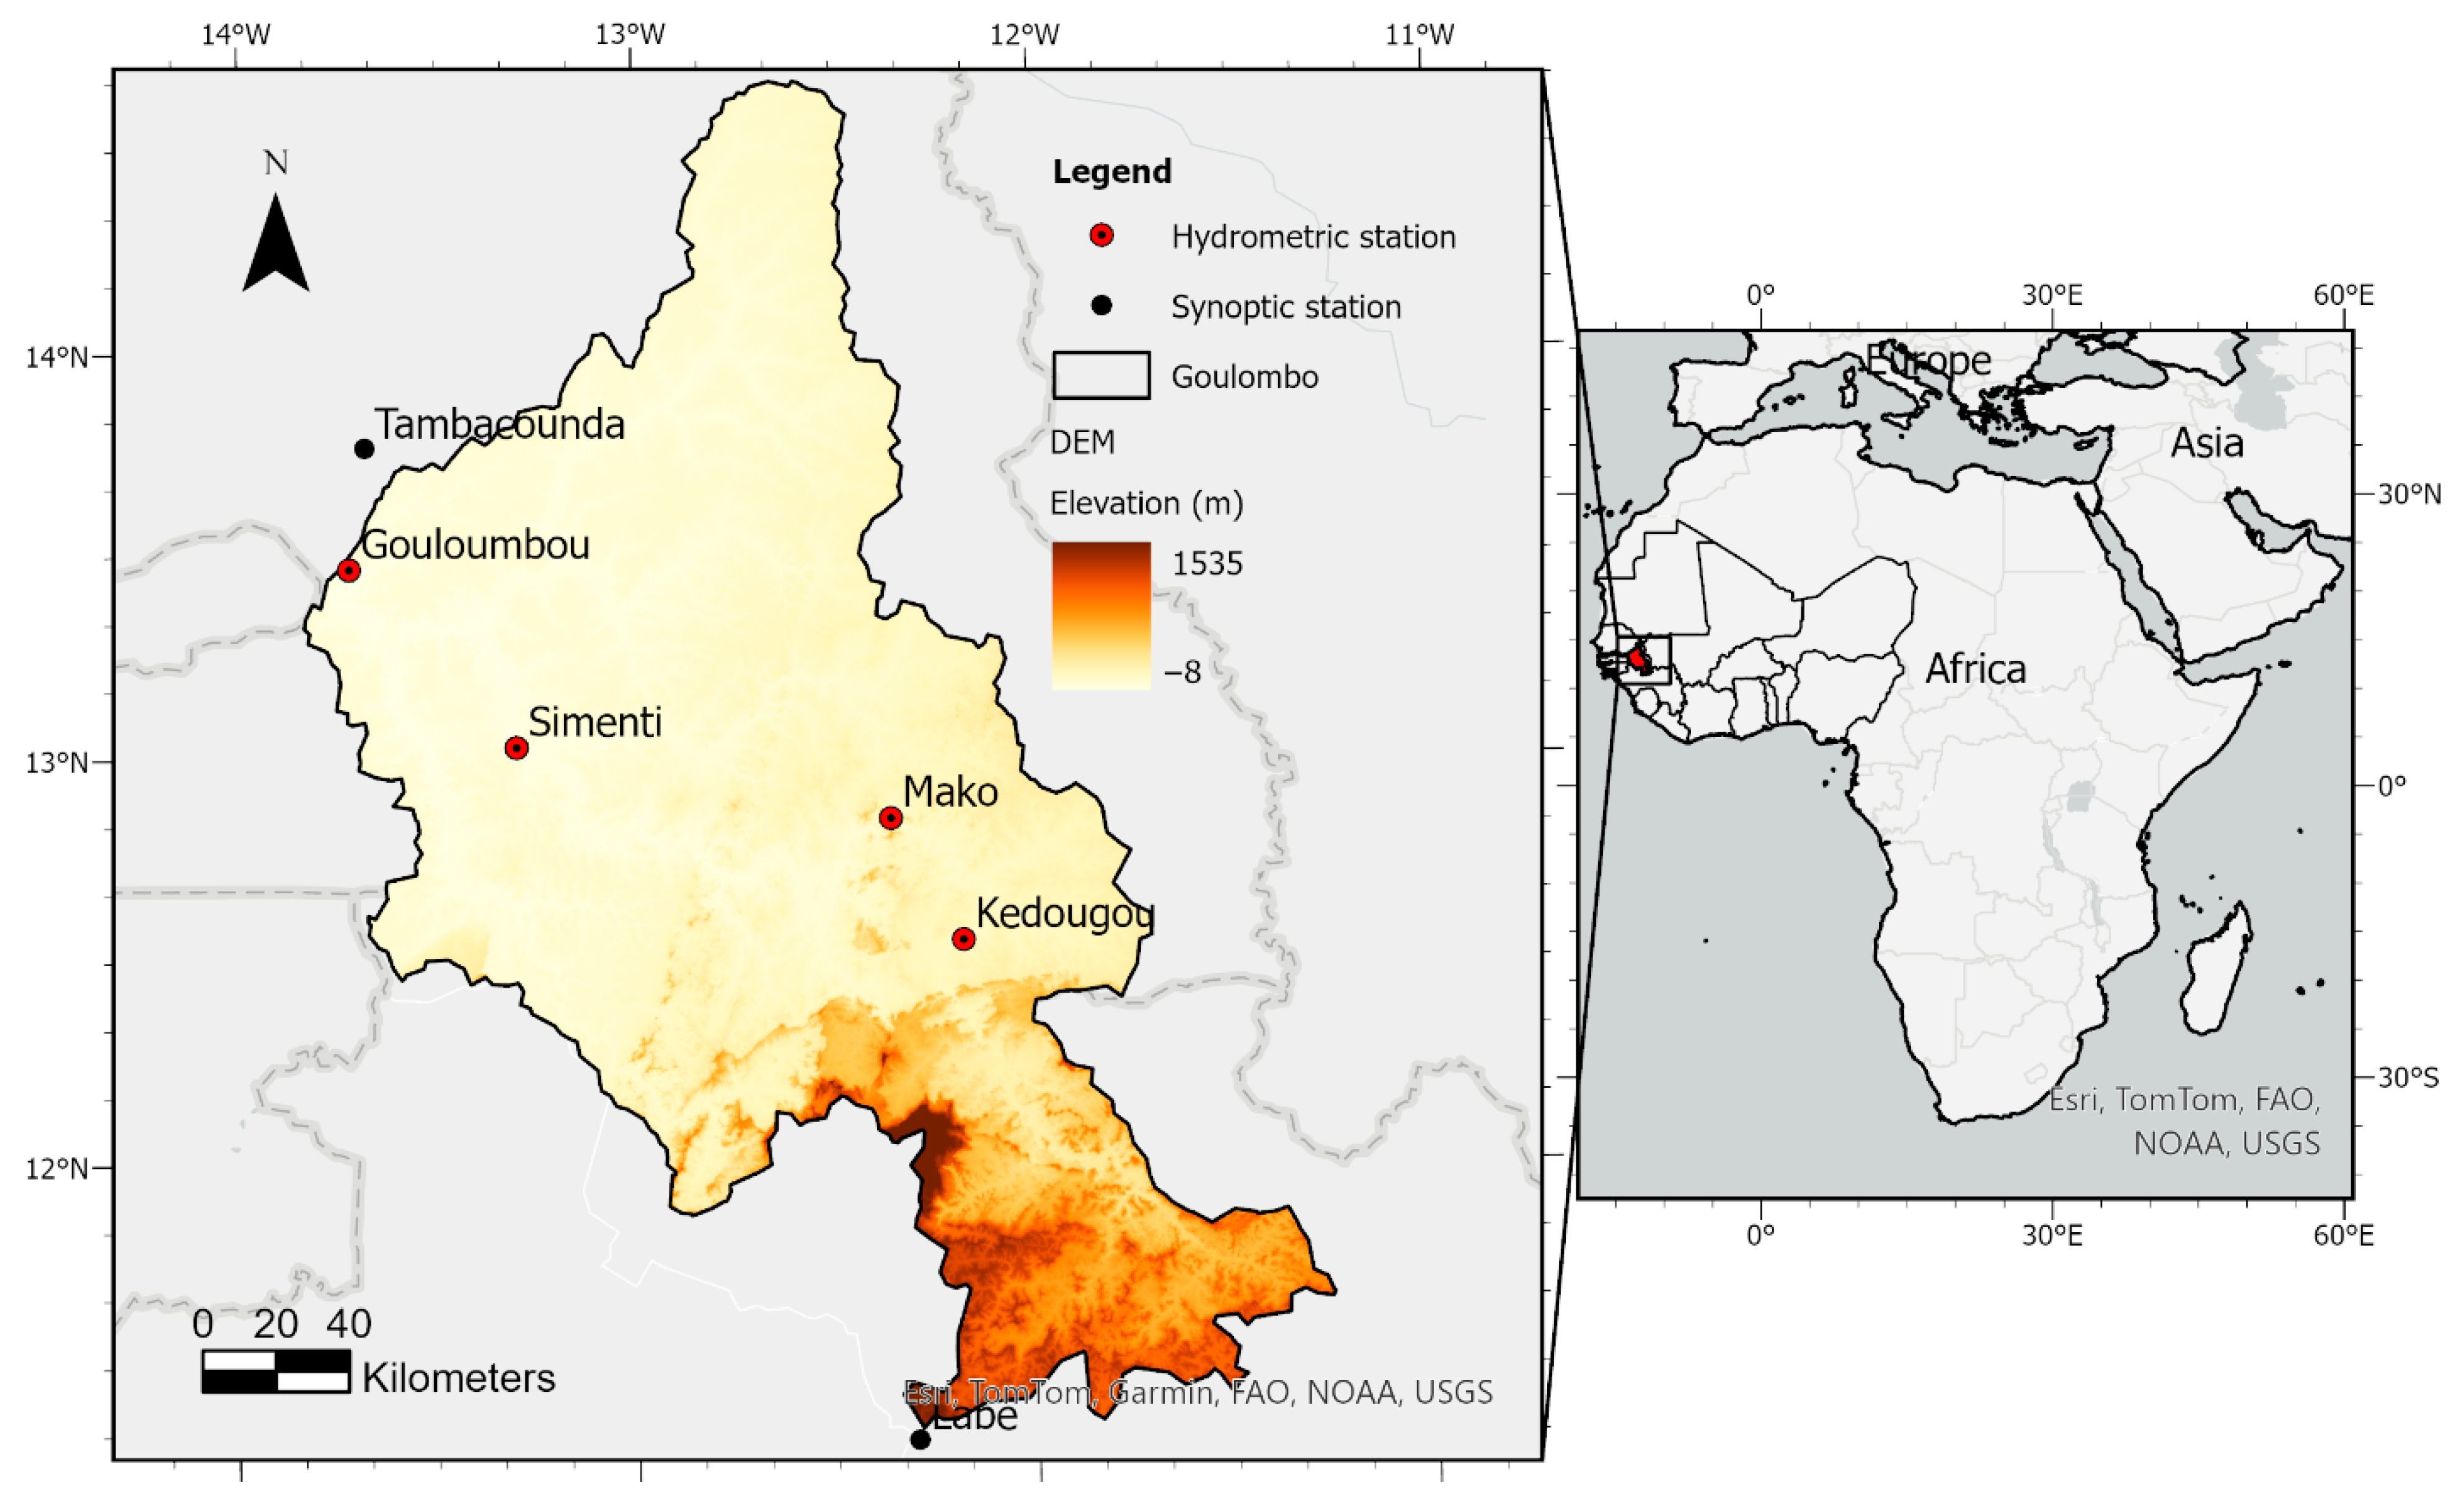
2.1. Study Area
2.2. Data and Methods
2.2.1. Data Sources
Precipitation Data
River Discharge
2.2.2. Methods
Drought Index
Trend Analyses
Breakpoint Analyses
Data Acquisition and Preparation for Land Cover Maps
Processing Method
3. Results and Discussions
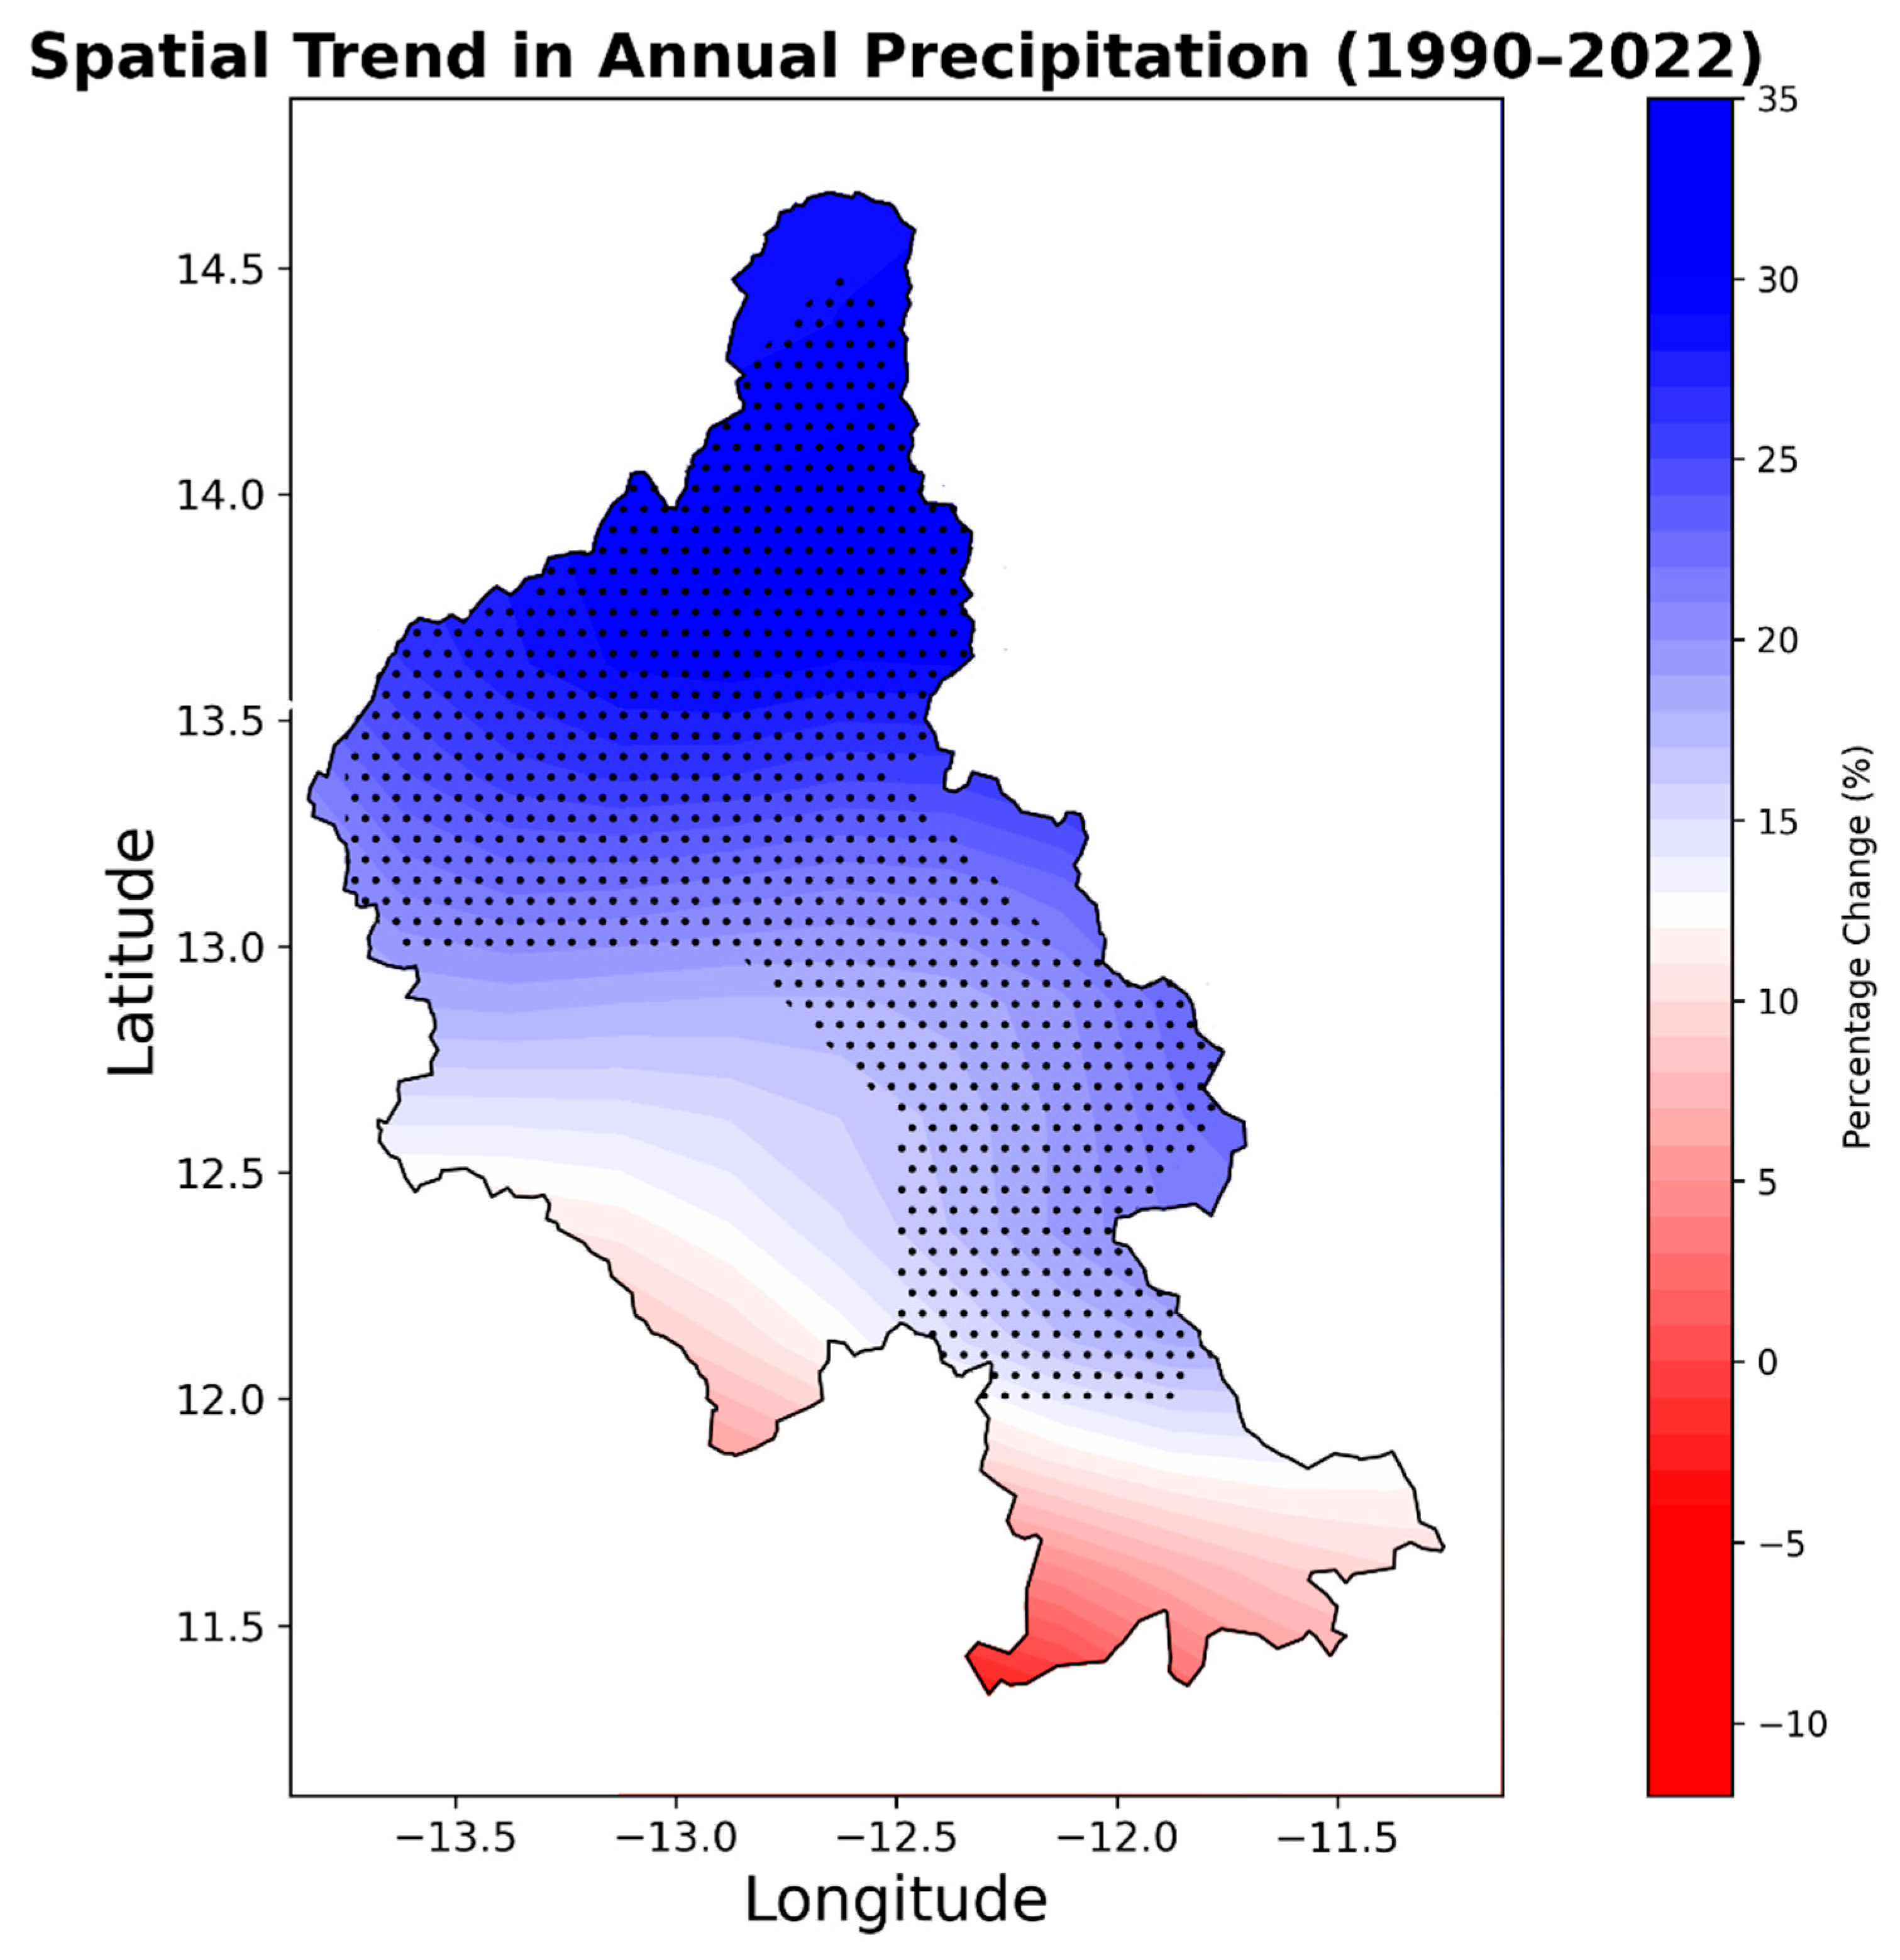
3.1. Spatial Precipitation Trends over the Continental Gambia River Basin
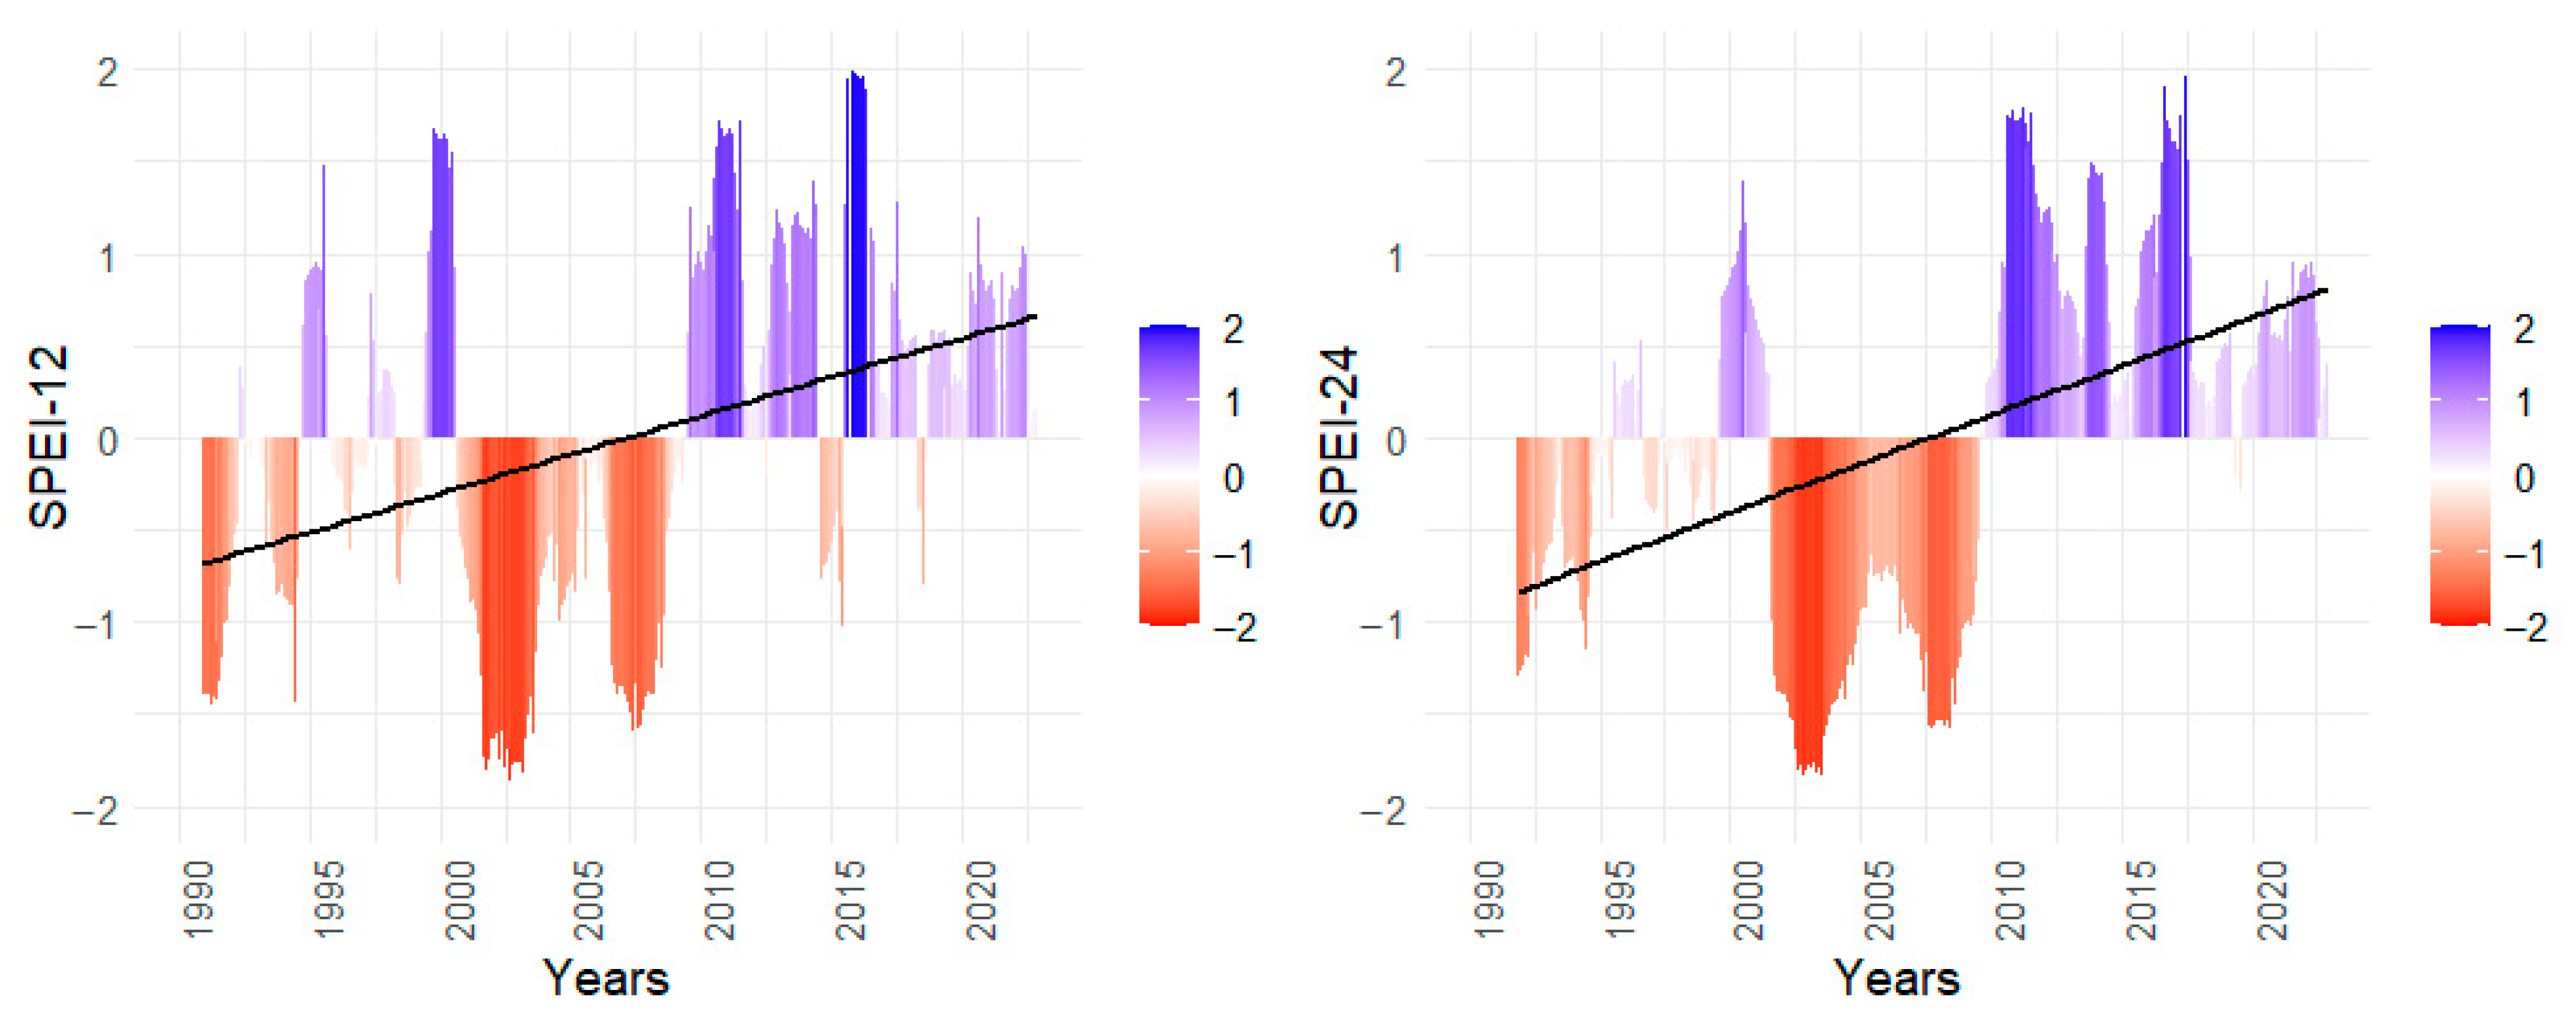
3.2. SPEI Indices
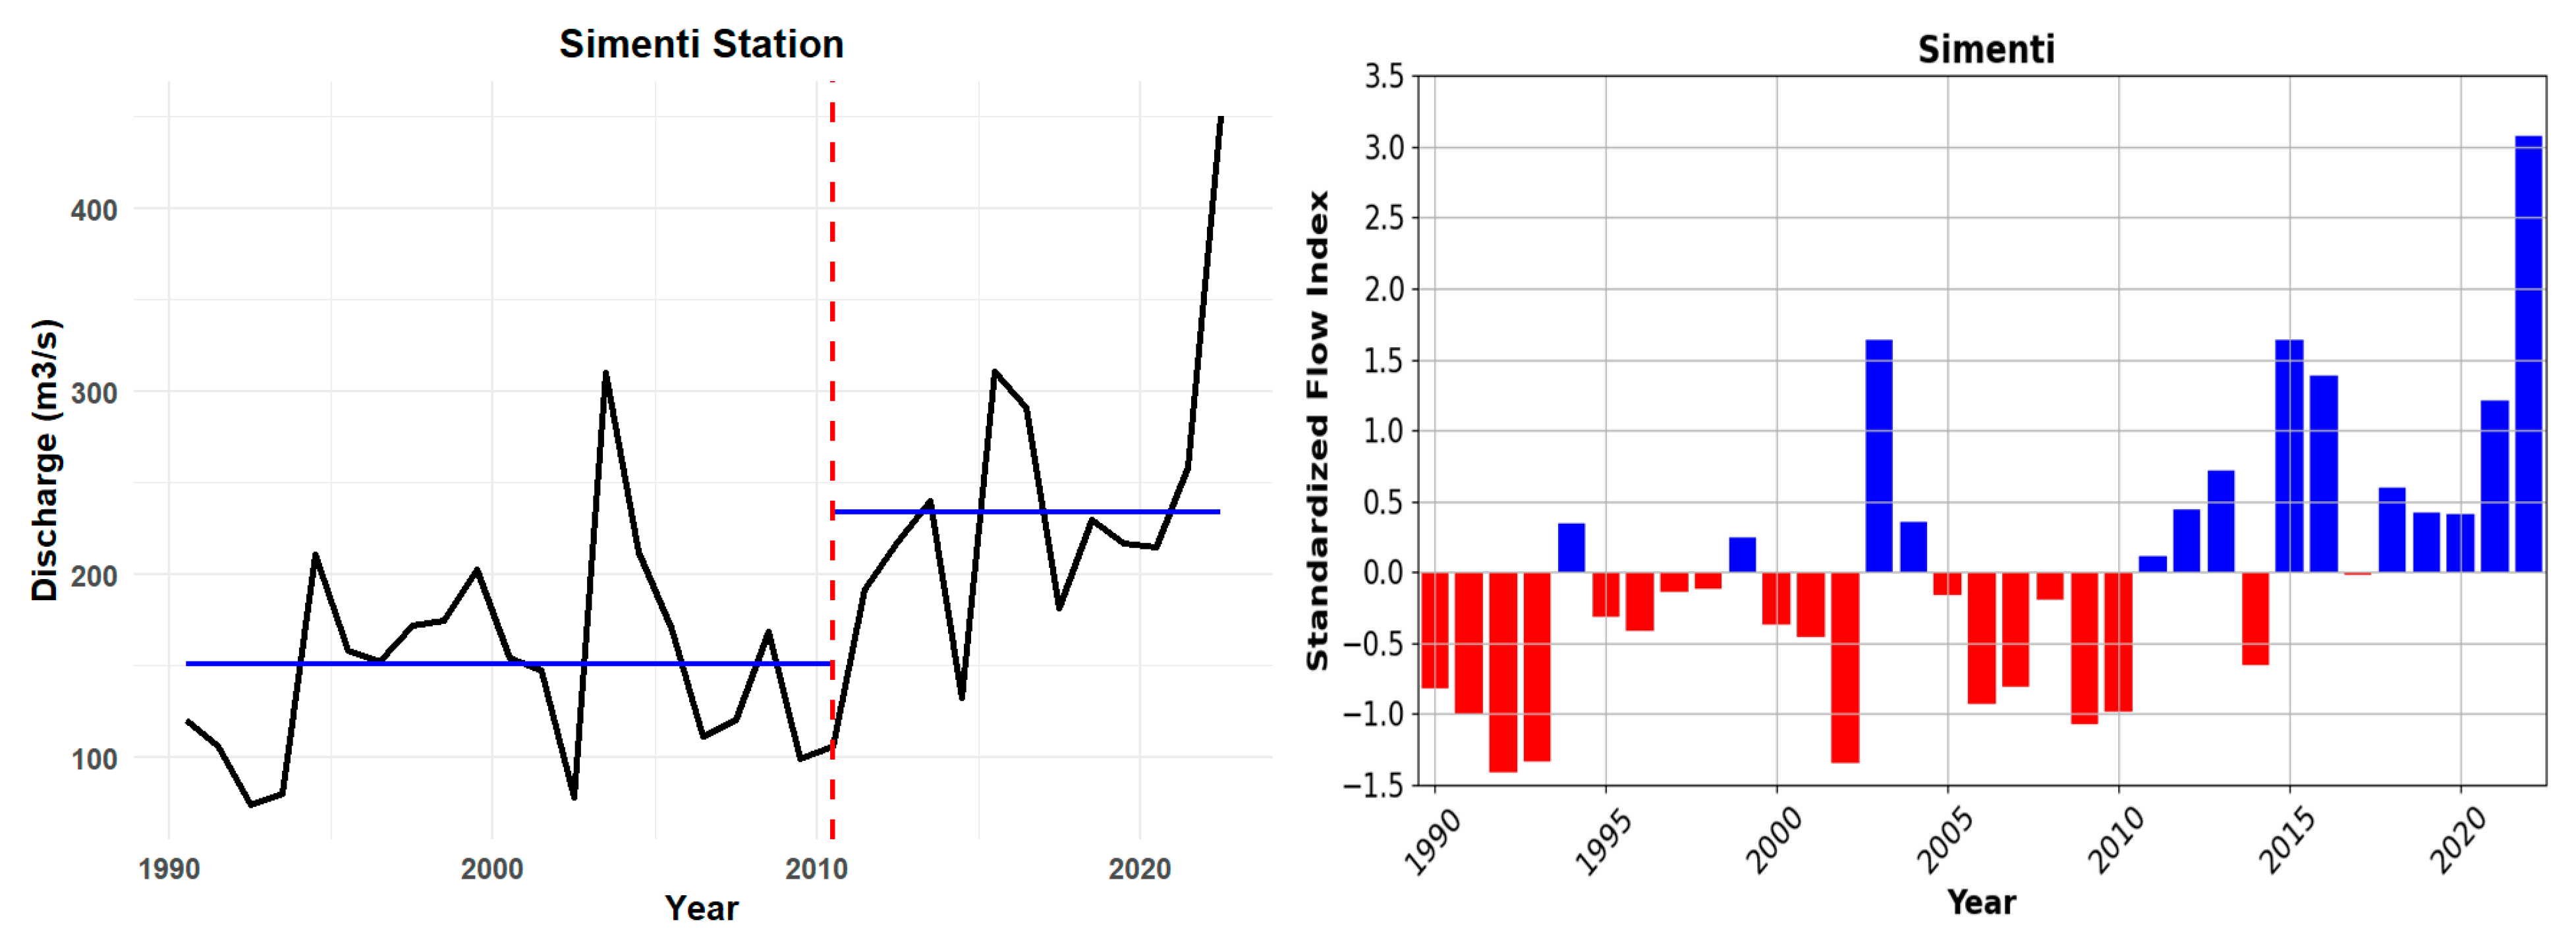
3.3. Discharge Trends at Simenti Station (1990–2022)
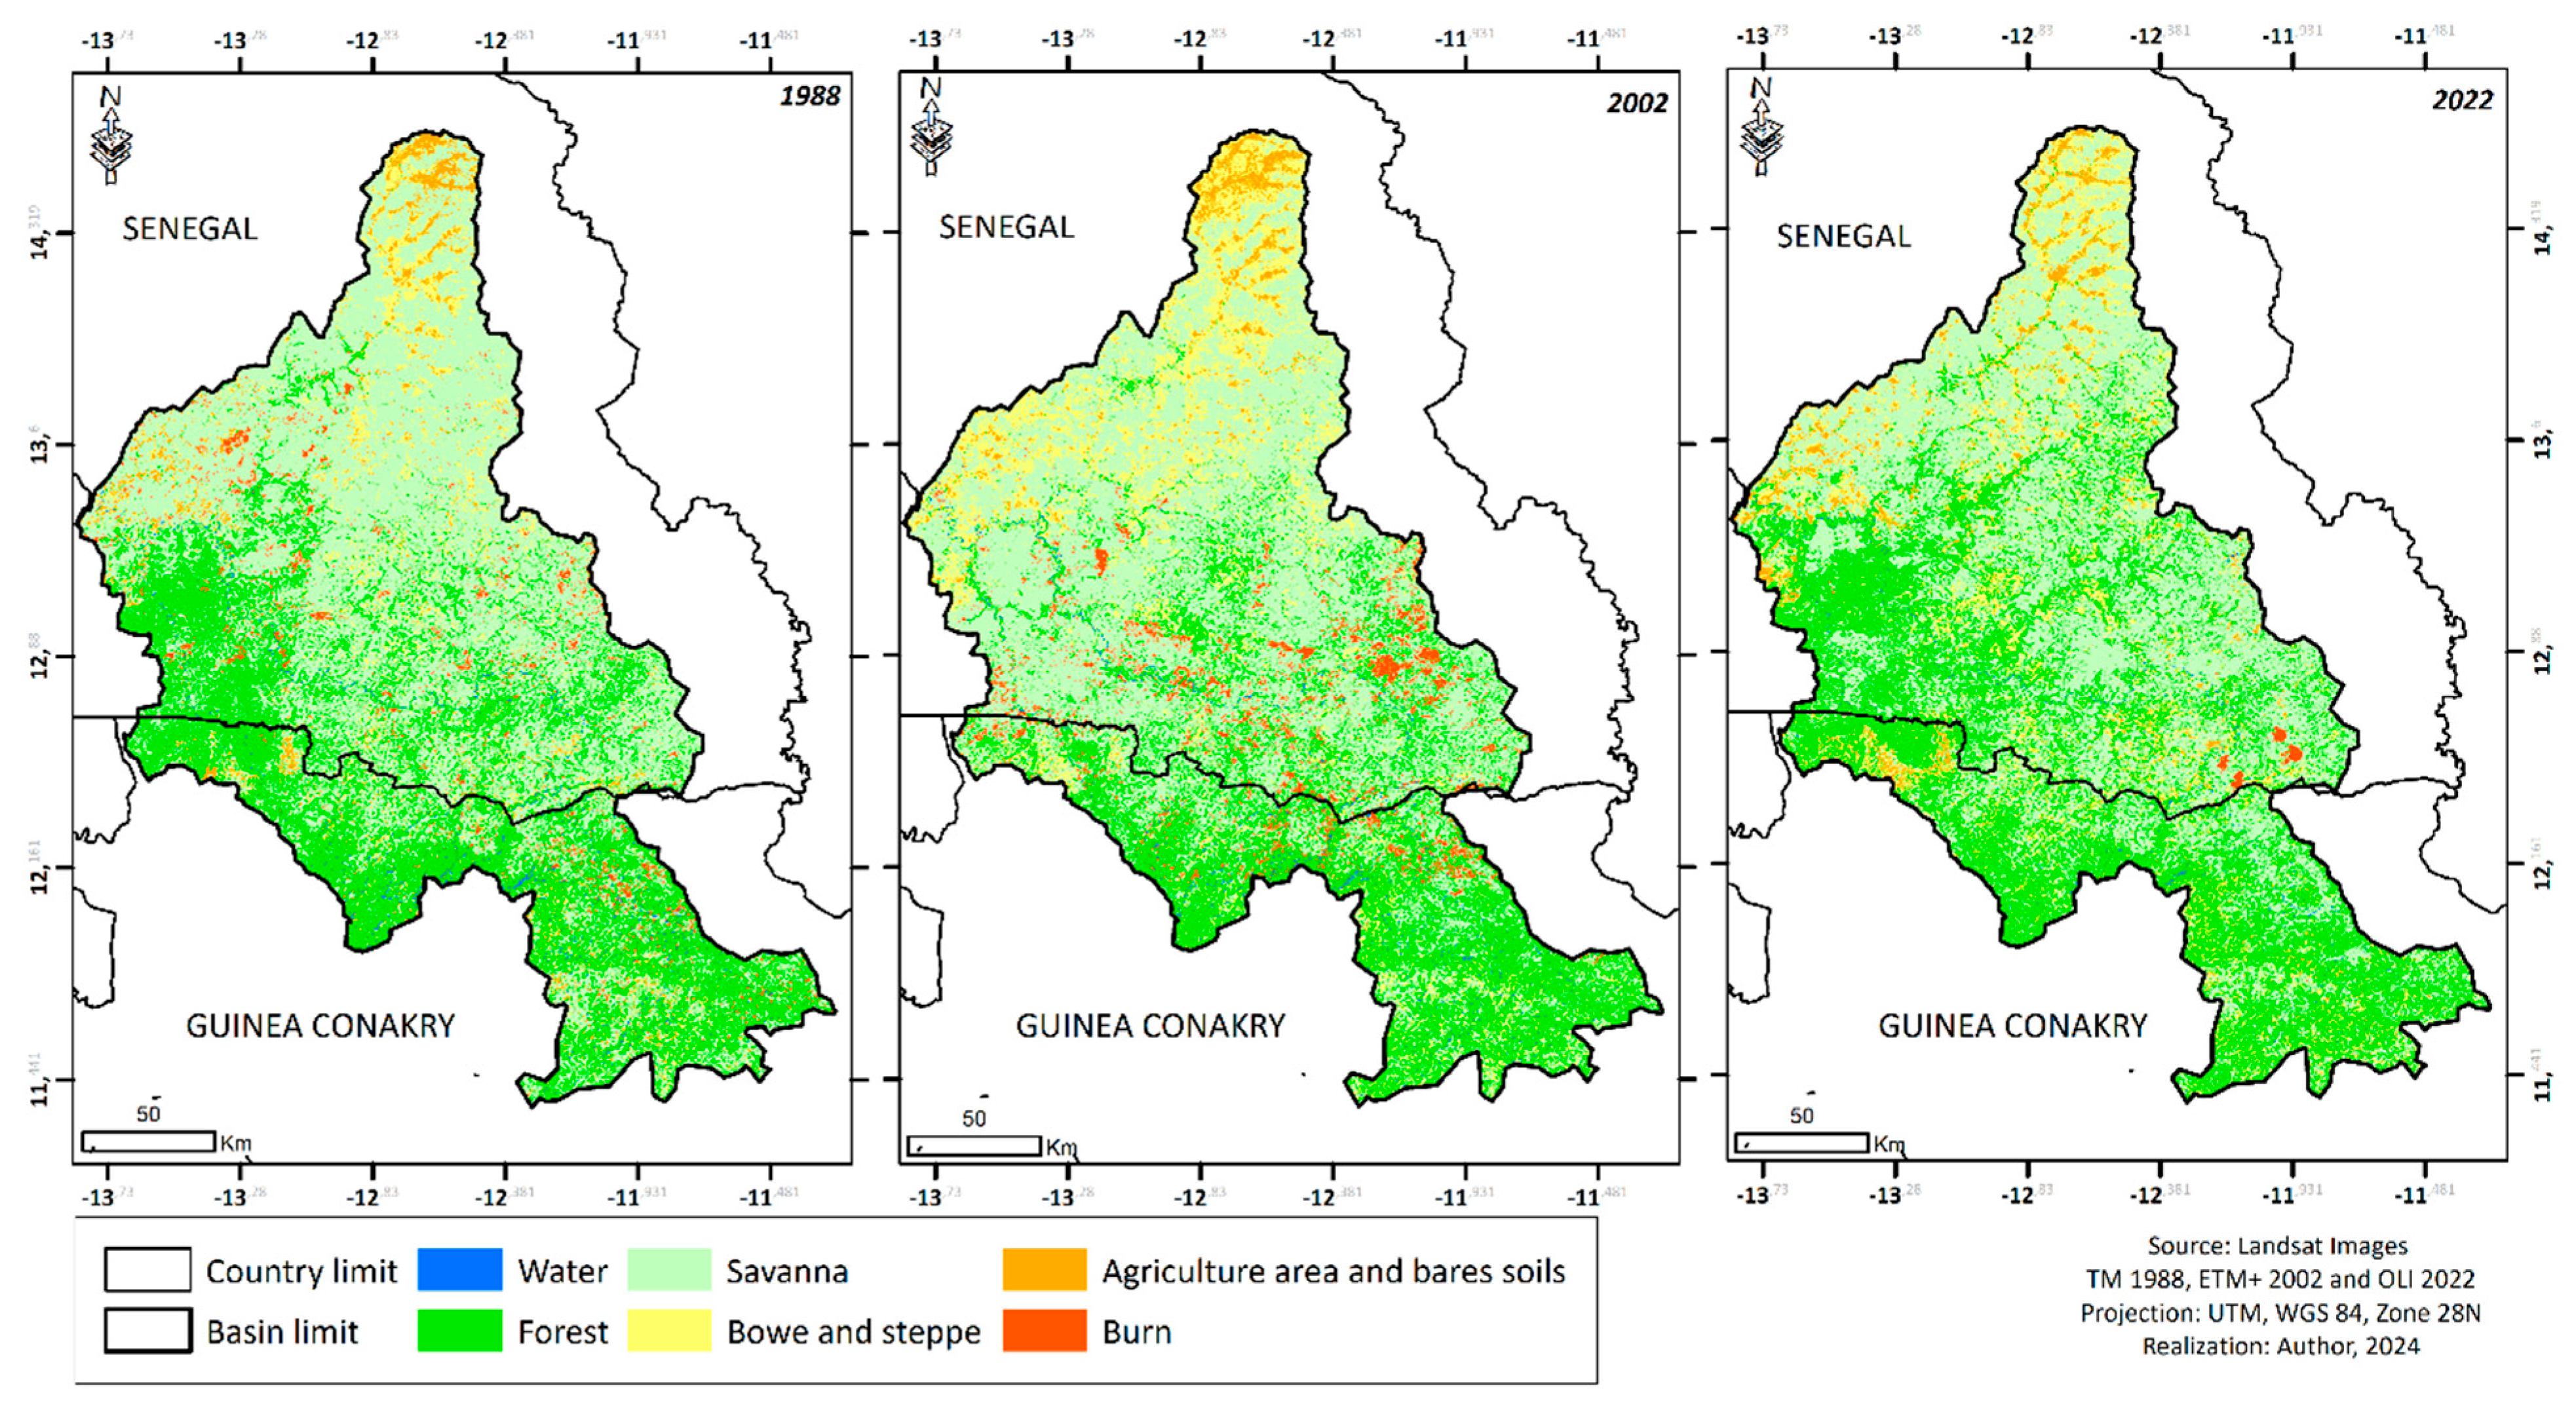
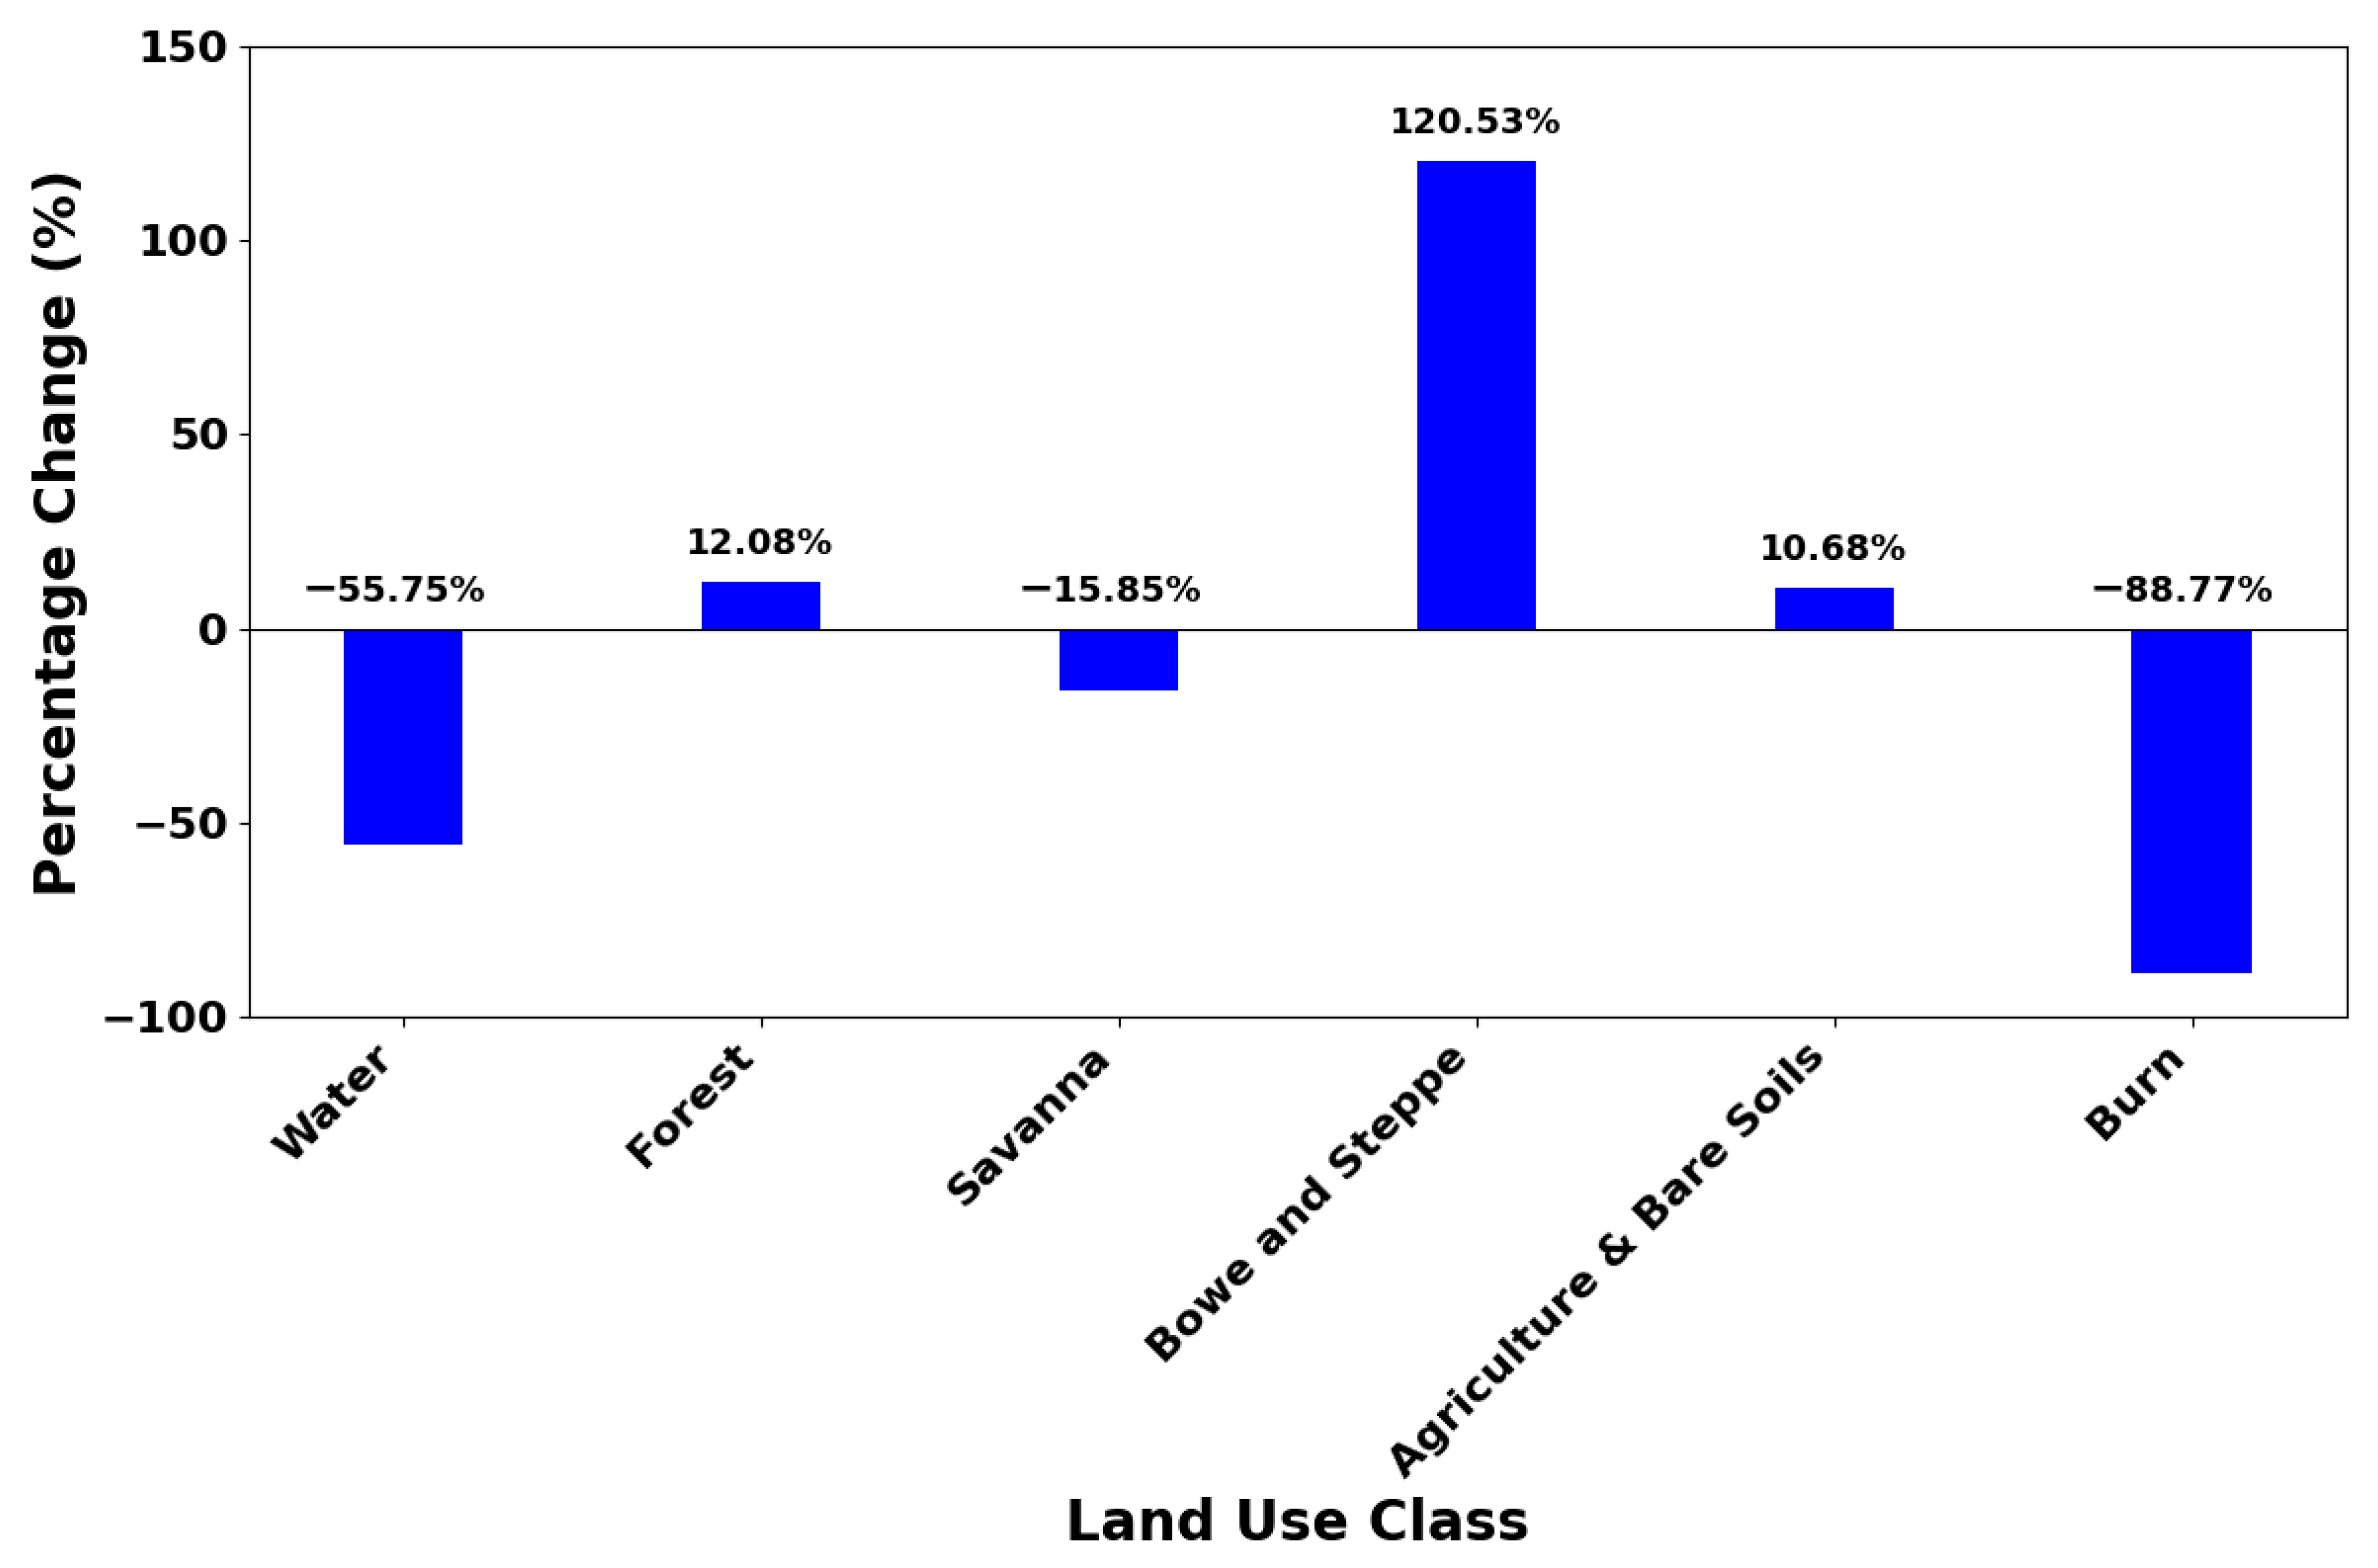
3.4. Spatial Evolution of Land Use/Land Cover
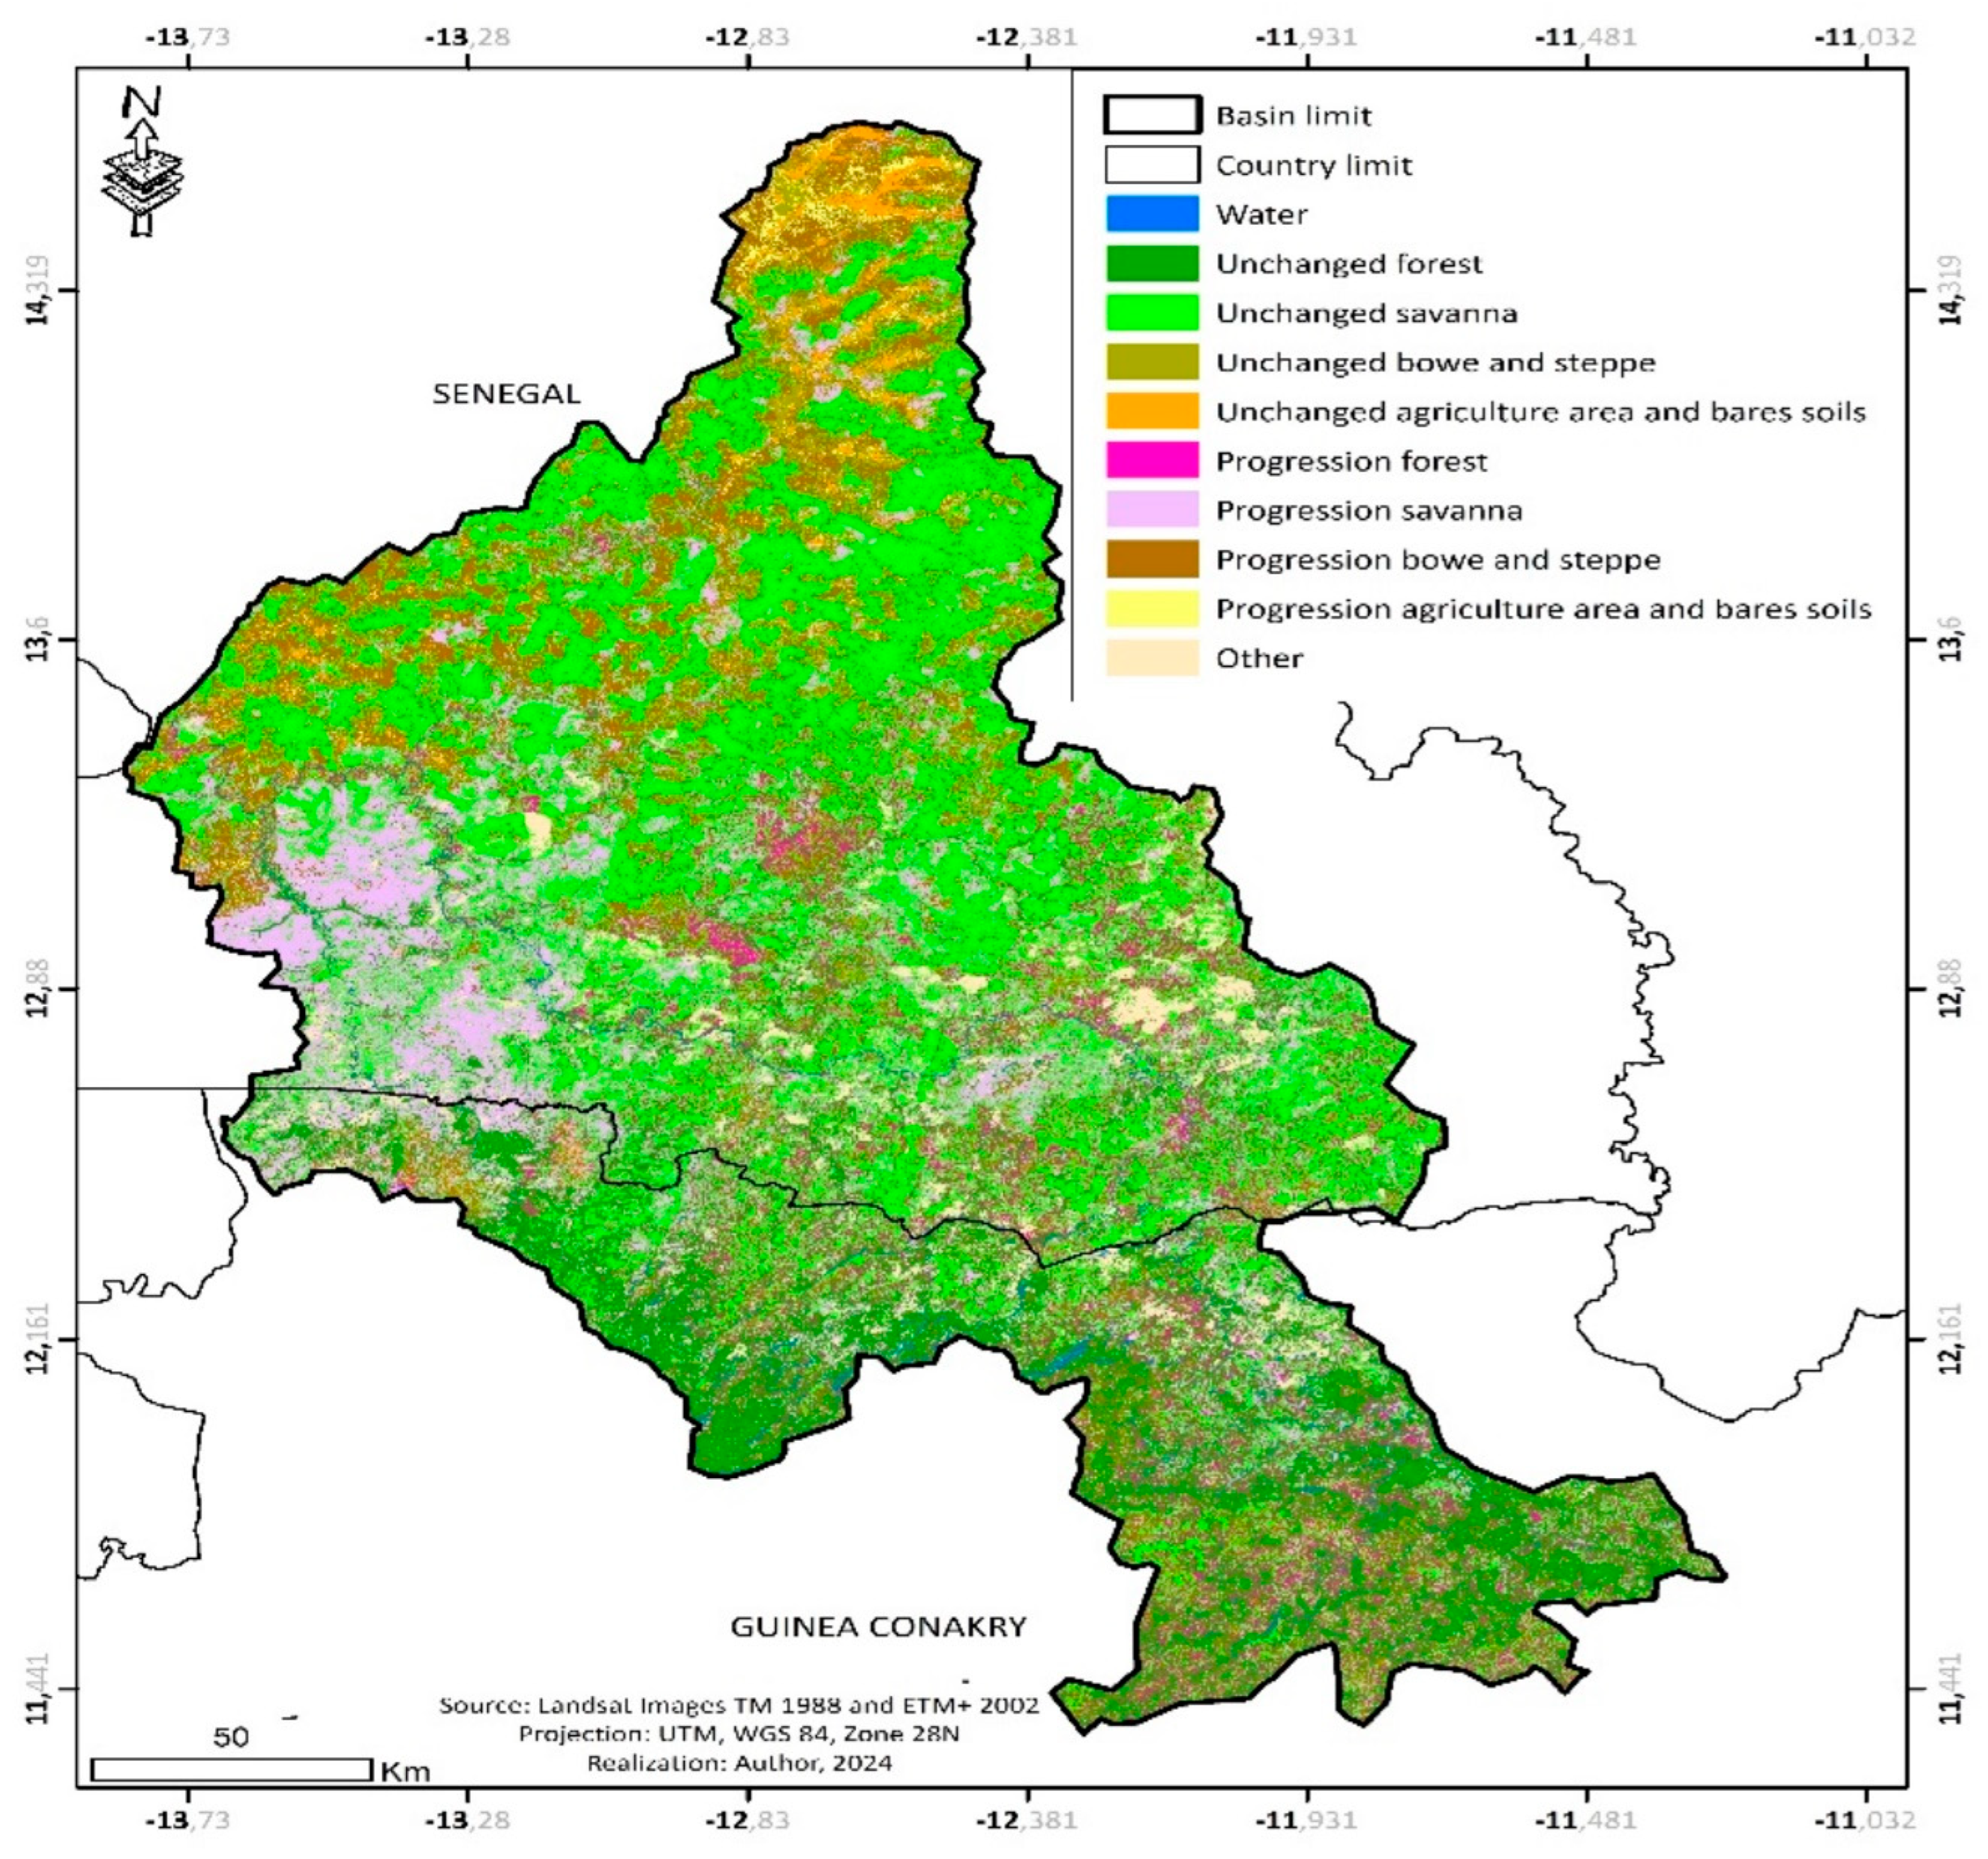
3.5. Changes in Land Use/Land Cover from 1988 to 2002
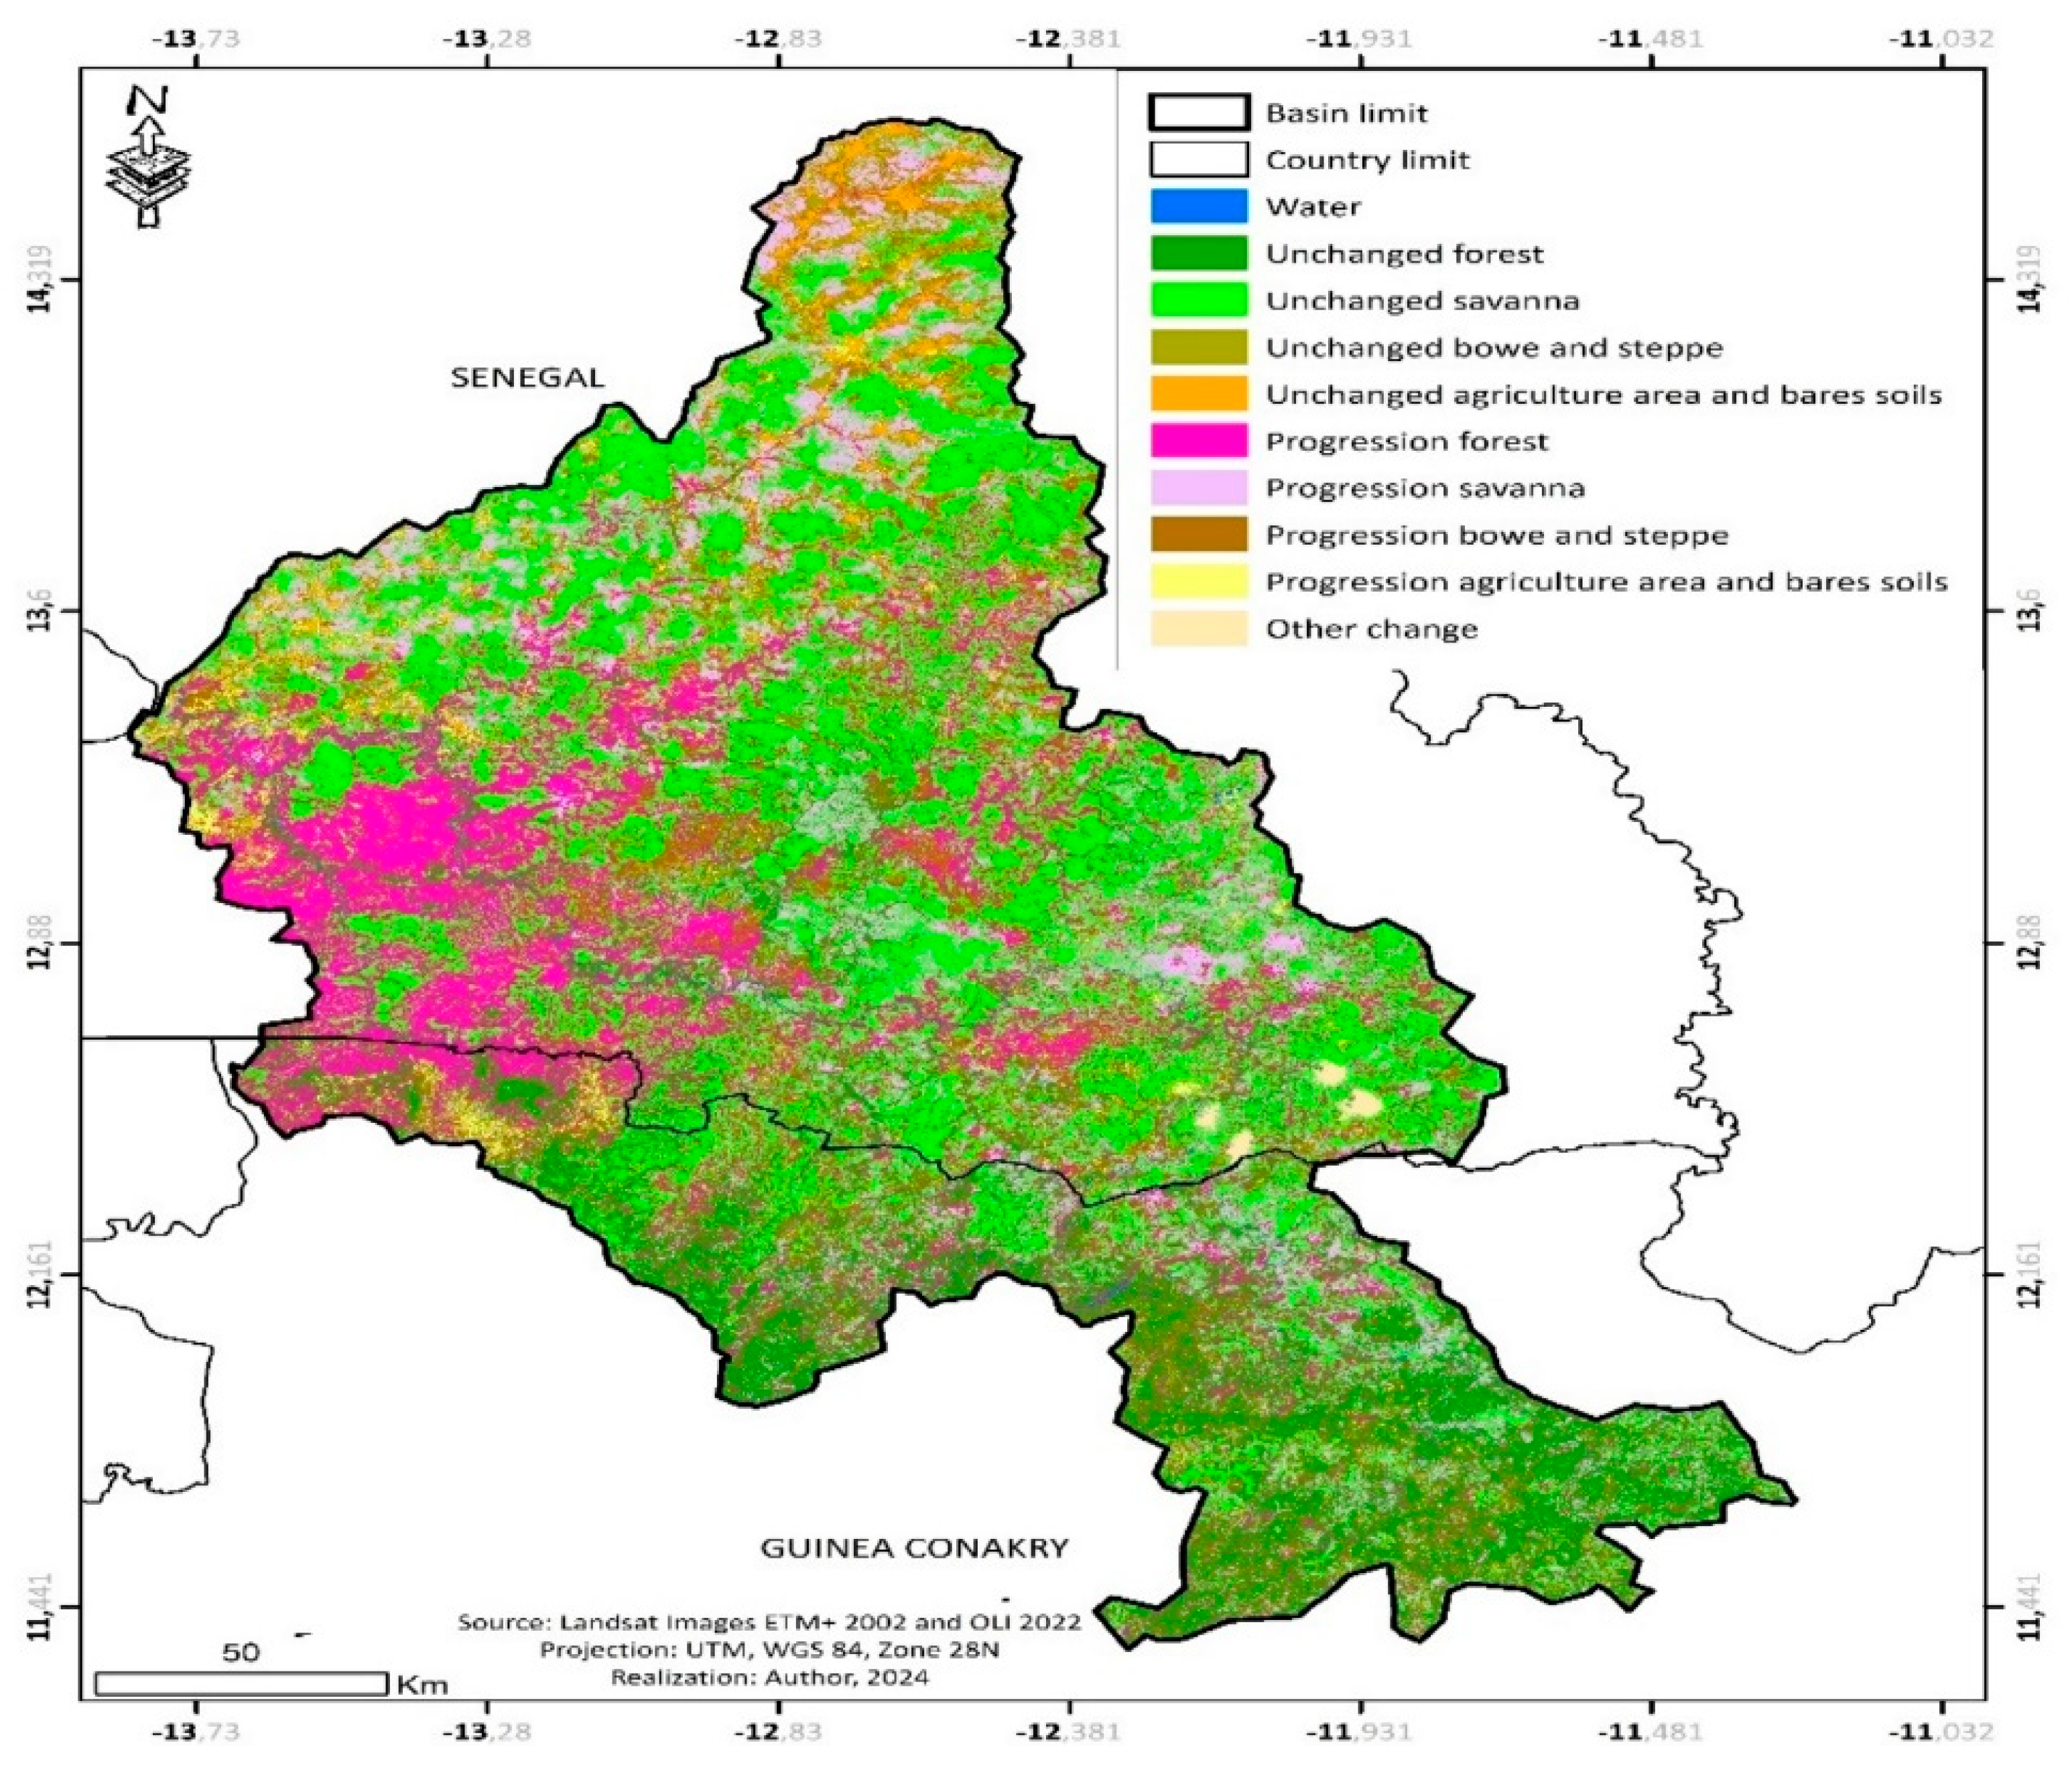
3.6. Changes in Land Use/Land Cover 2002–2022
3.7. Influence of Precipitation on Land Use Transitions
3.8. Local Perceptions of Environmental and Land Use Change
4. Discussion
5. Conclusions
Author Contributions
Funding
Data Availability Statement
Acknowledgments
Conflicts of Interest
References
- Agnew, C.T.; Chappell, A. Drought in the Sahel. GeoJournal 1999, 48, 299–311. [Google Scholar] [CrossRef]
- Hulme, M. Climatic Perspectives on Sahelian Desiccation: 1973–1998. Glob. Environ. Change 2001, 11, 19–29. [Google Scholar] [CrossRef]
- Ruelland, D.; Dezetter, A.; Puech, C.; Ardoin-Bardin, S. Long-Term Monitoring of Land Cover Changes Based on Landsat Imagery to Improve Hydrological Modelling in West Africa. Int. J. Remote Sens. 2008, 29, 3533–3551. [Google Scholar] [CrossRef]
- Mustard, J.F.; Defries, R.S.; Fisher, T.; Moran, E. Land-Use and Land-Cover Change Pathways and Impacts. In Land Change Science; Springer: Berlin/Heidelberg, Germany, 2012; pp. 411–429. [Google Scholar]
- Gao, C.; Zhou, P.; Jia, P.; Liu, Z.; Wei, L.; Tian, H. Spatial Driving Forces of Dominant Land Use/Land Cover Transformations in the Dongjiang River Watershed, Southern China. Environ. Monit. Assess. 2016, 188, 84. [Google Scholar] [CrossRef] [PubMed]
- Wu, Y.; Li, S.; Yu, S. Monitoring Urban Expansion and Its Effects on Land Use and Land Cover Changes in Guangzhou City, China. Environ. Monit. Assess. 2016, 188, 54. [Google Scholar] [CrossRef]
- Arfasa, G.F.; Owusu-Sekyere, E.; Doke, D.A. Past and Future Land Use/Land Cover, and Climate Change Impacts on Environmental Sustainability in Vea Catchment, Ghana. Geocarto Int. 2023, 38, 2289458. [Google Scholar] [CrossRef]
- Tesfay, F.; Tadesse, S.A.; Getahun, Y.S.; Lemma, E.; Gebremedhn, A.Y. Evaluating the Impact of Land Use Land Cover Changes on the Values of Ecosystem Services in the Chacha Watershed, Ethiopia’s Central Highland. Environ. Sustain. Indic. 2023, 18, 100256. [Google Scholar] [CrossRef]
- Wang, Q.; Xiong, K.; Zhou, J.; Xiao, H.; Song, S. Impact of Land Use and Land Cover Change on the Landscape Pattern and Service Value of the Village Ecosystem in the Karst Desertification Control. Front. Environ. Sci. 2023, 11, 1020331. [Google Scholar] [CrossRef]
- Okafor, G.C.; Annor, T.; Odai, S.N.; Larbi, I. Land Use Landcover Change Monitoring and Projection in the Dano Catchment, Southwest Burkina Faso. Int. J. Adv. Remote Sens. GIS 2019, 9, 3185–3204. [Google Scholar] [CrossRef]
- Solly, B.; Balla Dieye, E.H.; Sy, O. Remote Sensing Mapping of Land Use and Land Cover Changes in Upper Casamance, Senegal, 1987–2018. Am. J. Remote Sens. 2020, 8, 35. [Google Scholar] [CrossRef]
- Barnieh, B.A.; Jia, L.; Menenti, M.; Zhou, J.; Zeng, Y. Mapping Land Use Land Cover Transitions at Different Spatiotemporal Scales in West Africa. Sustainability 2020, 12, 8565. [Google Scholar] [CrossRef]
- Akpoti, K.; Antwi, E.O.; Kabo-bah, A.T. Impacts of Rainfall Variability, Land Use and Land Cover Change on Stream Flow of the Black Volta Basin, West Africa. Hydrology 2016, 3, 26. [Google Scholar] [CrossRef]
- Obahoundje, S.; Diedhiou, A.; Ofosu, E.A.; Anquetin, S.; François, B.; Adounkpe, J.; Amoussou, E.; Kouame, Y.M.; Kouassi, K.L.; Bi, V.H.N.; et al. Assessment of Spatio-Temporal Changes of Land Use and Land Cover over South-Western African Basins and Their Relations with Variations of Discharges. Hydrology 2018, 5, 56. [Google Scholar] [CrossRef]
- Faty, A.; Kouame, F.; Fall, A.N.; Kane, A. Land Use Dynamics in the Context of Variations in Hydrological Regimes in the Upper Senegal River Basin. Int. J. Hydrol. 2019, 3, 185–192. [Google Scholar] [CrossRef]
- Barry, N.Y.; Traore, V.B.; Ndiaye, M.L.; Isimemen, O.; Celestin, H.; Sambou, B. Assessment of Climate Trends and Land Cover/Use Dynamics within the Somone River Basin, Senegal. Am. J. Clim. Change 2017, 6, 513–538. [Google Scholar] [CrossRef]
- Nicholson, S.E. A Revised Picture of the Structure of the “Monsoon” and Land ITCZ over West Africa. Clim. Dyn. 2009, 32, 1155–1171. [Google Scholar] [CrossRef]
- Antle, J.M.; Capalbo, S.M.; Elliott, E.T.; Paustian, K.H. Adaptation, Spatial Heterogeneity, and the Vulnerability of Agricultural Systems to Climate Change and CO2 Fertilization: An Integrated Assessment Approach. Clim. Change 2004, 64, 289–315. [Google Scholar] [CrossRef]
- Séne, S.M.K.; Faye, C.; Pande, C.B. Assessment of Current and Future Trends in Water Resources in the Gambia River Basin in a Context of Climate Change. Environ. Sci. Eur. 2024, 36, 32. [Google Scholar] [CrossRef]
- Faty, B.; Sterk, G.; Ali, A.; Sy, S.; Dacosta, H.; Diop, S.; Descroix, L. Satellite-Based Rainfall Estimates to Simulate Daily Streamflow Using a Hydrological Model over Gambia Watershed. Water Sci. 2023, 37, 151–168. [Google Scholar] [CrossRef]
- Lamagat, J.P.; Albergel, J.; Bouchez, J.M. Orstom-Omvg Monographie Hydrologique Du Fleuve Gambie L. Descroix; Paris, France. 1990. Available online: https://horizon.documentation.ird.fr/exl-doc/pleins_textes/divers12-05/010005949.pdf (accessed on 3 June 2025).
- Funk, C.; Peterson, P.; Landsfeld, M.; Pedreros, D.; Verdin, J.; Shukla, S.; Husak, G.; Rowland, J.; Harrison, L.; Hoell, A.; et al. The Climate Hazards Infrared Precipitation with Stations—A New Environmental Record for Monitoring Extremes. Sci. Data 2015, 2, 150066. [Google Scholar] [CrossRef]
- Vicente-Serrano, S.M.; Beguería, S.; López-Moreno, J.I. A Multiscalar Drought Index Sensitive to Global Warming: The Standardized Precipitation Evapotranspiration Index. J. Clim. 2010, 23, 1696–1718. [Google Scholar] [CrossRef]
- Calvin, K.; Dasgupta, D.; Krinner, G.; Mukherji, A.; Thorne, P.W.; Trisos, C.; Romero, J.; Aldunce, P.; Barrett, K.; Blanco, G.; et al. IPCC, 2023: Climate Change 2023: Synthesis Report. Contribution of Working Groups I, II and III to the Sixth Assessment Report of the Intergovernmental Panel on Climate Change; Arias, P., Bustamante, M., Elgizouli, I., Flato, G., Howden, M., Méndez-Vallejo, C., Pereira, J.J., Pichs-Madruga, R., Rose, S.K., Saheb, Y., et al., Eds.; [Core Writing Team, H. Lee and J. Romero (Eds.)]; IPCC: Geneva, Switzerland, 2023. [Google Scholar]
- Hargreaves, G.H.; Samani, Z.A. Reference Crop Evapotranspiration from Temperature. Appl. Eng. Agric. 1985, 1, 96–99. [Google Scholar] [CrossRef]
- Zarei, A.R.; Mahmoudi, M.R. Assessment of the Effect of PET Calculation Method on the Standardized Precipitation Evapotranspiration Index (SPEI). Arab. J. Geosci. 2020, 13, 182. [Google Scholar] [CrossRef]
- Ortiz-Gómez, R.; Flowers-Cano, R.S.; Medina-García, G. Sensitivity of the RDI and SPEI Drought Indices to Different Models for Estimating Evapotranspiration Potential in Semiarid Regions. Water Resour. Manag. 2022, 36, 2471–2492. [Google Scholar] [CrossRef]
- Almorox, J.; Quej, V.H.; Martí, P. Global Performance Ranking of Temperature-Based Approaches for Evapotranspiration Estimation Considering Köppen Climate Classes. J. Hydrol. 2015, 528, 514–522. [Google Scholar] [CrossRef]
- Li, Z.; Yang, Y.; Kan, G.; Hong, Y. Study on the Applicability of the Hargreaves Potential Evapotranspiration Estimation Method in CREST Distributed Hydrological Model (Version 3.0) Applications. Water 2018, 10, 1882. [Google Scholar] [CrossRef]
- Barker, L.J.; Hannaford, J.; Chiverton, A.; Svensson, C. From Meteorological to Hydrological Drought Using Standardised Indicators. Hydrol. Earth Syst. Sci. 2016, 20, 2483–2505. [Google Scholar] [CrossRef]
- Yue, S.; Wang, C. The Mann-Kendall Test Modified by Effective Sample Size to Detect Trend in Serially Correlated Hydrological Series. Water Resour. Manag. 2004, 18, 201–218. [Google Scholar] [CrossRef]
- Shahid, S. Rainfall Variability and the Trends of Wet and Dry Periods in Bangladesh. Int. J. Climatol. 2010, 30, 2299–2313. [Google Scholar] [CrossRef]
- Hamed, K.H.; Rao, A.R. Hydrology A Modified Mann-Kendall Trend Test for Autocorrelated Data. J. Hydrol. 1998, 204, 182–196. [Google Scholar] [CrossRef]
- Pettitt, A.N. A Non-Parametric Approach to the Change-Point Problem. Appl. Stat. 1979, 28, 126–135. [Google Scholar] [CrossRef]
- Wijngaard, J.B.; Klein Tank, A.M.G.; Können, G.P. Homogeneity of 20th Century European Daily Temperature and Precipitation Series. Int. J. Climatol. 2003, 23, 679–692. [Google Scholar] [CrossRef]
- Solly, B. Dynamique des Formations Forestières de la Haute-Casamance (Sénégal) de 1965 à 2018, Incidences sur les Activités Agro-Sylvo-Pastorales et Stratégies D’adaptation. Ph.D. Thesis, Université Assane Seck de Ziguinchor, Ziguinchor, Senegal, 2021. Available online: https://hal.science/tel-03287888 (accessed on 3 June 2025).
- Andrieu, J.; Mering, C. Cartographie Par Télédétection des Changements de La Couverture Végétale Sur La Bande Littorale Ouest-Africaine: Exemple Des Rivières Du Sud Du Delta Du Saloum Au Rio Geba. Teledetection, Editions des Archives Contemporaines/Editions scientifiques GB/Gordon and Breach Scientific Publishers. Télédétection 2008, 8, 93–118. [Google Scholar]
- Michel-Claude, G.; Marie, G.C. Traitement Des Données de Télédétection: Environnement et Ressources Naturelles, 2nd ed.; Dunod: Paris, France, 2010; Available online: https://www.eyrolles.com/Sciences/Livre/traitement-des-donnees-de-teledetection-9782100763702/ (accessed on 3 June 2025).
- Stancioff, A.; Staljanssens, M.; Tappan, G. Cartographie et Télédétection des Ressources de la République du Sénégal. Étude de la Géologie, de L’hydrogéologie, des Sols, de la Végétation et des Potentiels D’utilisation des Sols; RSI-SDSU: San Diego, CA, USA, 1986. [Google Scholar]
- CSE. Utilisation de L’imagerie Satellitaire à Haute Résolution; Centre de Suivi Ecologique: Dakar, Senegal, 1996. [Google Scholar]
- CILSS. Les Paysages de l’Afrique de l’Ouest: Une Fenêtre Sur Un Monde en Pleine Évolution; CILSS: Ouagadougou, Burkina Faso, 2016. [Google Scholar]
- Diédhiou, I.; Mering, C.; Sy, O.; Sané, T. Cartographier Par Télédétection l’occupation Du Sol et Ses Changements. EchoGéo 2020, 54, 20510. [Google Scholar] [CrossRef]
- Diéye, E.H.B.; Sané, T.; Solly, B.; Ba, B.D.; Ndour, N.; Sy, O.; Thior, M.; Mendy, V.; Tall, E.H.S.B.; Mering, C.; et al. Dynamique de La Mangrove et Perceptions Locales Dans Le Département d’Oussouye (Basse-Casamance, Sénégal) Entre 1972 et 2018. Tropicultura 2022, 40, 27. [Google Scholar] [CrossRef]
- MacQueen, J. Some Methods for Classification and Analysis of Multivariate Observations. In Proceedings of the Fifth Berkeley Symposium on Mathematical Statistics and Probability, Berkeley, CA, USA, 21 June–18 July 1965 and 27 December 1965–7 January 1966; University of California Press: Oakland, CA, USA, 1967; Volume 1, Statistics: Volume 5.1, pp. 281–298. [Google Scholar]
- Ducrot, D. Méthodes d’analyse et d’interprétation d’images de Télédétection Multi-Sources. Extraction de Caractéristiques Du Paysage. Extraction de caractéristiques du paysage. Mémoire Rech. 2005. Available online: https://documentation.ensg.eu/index.php?lvl=notice_display&id=81619 (accessed on 3 June 2025).
- Tappan, G.G.; Sall, M.; Wood, E.C.; Cushing, M. Ecoregions and Land Cover Trends in Senegal. J. Arid. Environ. 2004, 59, 427–462. [Google Scholar] [CrossRef]
- Solly, B.; Andrieu, J.; Dieye, E.H.B.; Jarju, A.M. Dynamiques Contrastées de Reverdissement et Dégradation de La Couverture Végétale Au Sénégal Révélées Par Analyse de Série Temporelle Du NDVI MODIS. VertigO 2022, 22. [Google Scholar] [CrossRef]
- Li, X.; He, B.; Quan, X.; Liao, Z.; Bai, X. Use of the Standardized Precipitation Evapotranspiration Index (SPEI) to Characterize the Drying Trend in Southwest China from 1982–2012. Remote Sens. 2015, 7, 10917–10937. [Google Scholar] [CrossRef]
- Vicente-Serrano, S.M.; Beguería, S.; Lorenzo-Lacruz, J.; Camarero, J.J.; López-Moreno, J.I.; Azorin-Molina, C.; Revuelto, J.; Morán-Tejeda, E.; Sanchez-Lorenzo, A. Performance of Drought Indices for Ecological, Agricultural, and Hydrological Applications. Earth Interact. 2012, 16, 1–27. [Google Scholar] [CrossRef]
- Manatsa, D.; Mushore, T.; Lenouo, A. Improved Predictability of Droughts over Southern Africa Using the Standardized Precipitation Evapotranspiration Index and ENSO. Theor. Appl. Clim. 2017, 127, 259–274. [Google Scholar] [CrossRef]
- Tirivarombo, S.; Osupile, D.; Eliasson, P. Drought Monitoring and Analysis: Standardised Precipitation Evapotranspiration Index (SPEI) and Standardised Precipitation Index (SPI). Phys. Chem. Earth 2018, 106, 1–10. [Google Scholar] [CrossRef]
- Faye, C. Comparative Analysis of Meteorological Drought Based on the SPI and SPEI Indices. HighTech Innov. J. 2022, 3, 15–27. [Google Scholar] [CrossRef]
- Nicholson, S.E. The West African Sahel: A Review of Recent Studies on the Rainfall Regime and Its Interannual Variability. ISRN Meteorol. 2013, 2013, 453521. [Google Scholar] [CrossRef]
- Nouaceur, Z. La Reprise des Pluideset La Recrudescence des Inondesions En Afrique de l’Ouest Sahélienne. Physio-Géo 2020, 15, 89–109. [Google Scholar] [CrossRef]
- Biasutti, M. Rainfall Trends in the African Sahel: Characteristics, Processes, and Causes. Wiley Interdiscip. Rev. Clim. Change 2019, 10, e591. [Google Scholar] [CrossRef] [PubMed]
- Dong, B.; Sutton, R. Dominant Role of Greenhouse-Gas Forcing in the Recovery of Sahel Rainfall. Nat. Clim. Change 2015, 5, 757–760. [Google Scholar] [CrossRef]
- Kayitesi, N.M.; Guzha, A.C.; Tonini, M.; Mariethoz, G. Land Use Land Cover Change in the African Great Lakes Region: A Spatial–Temporal Analysis and Future Predictions. Environ. Monit. Assess. 2024, 196, 852. [Google Scholar] [CrossRef] [PubMed]
- Leblanc, M.J.; Favreau, G.; Massuel, S.; Tweed, S.O.; Loireau, M.; Cappelaere, B. Land Clearance and Hydrological Change in the Sahel: SW Niger. Glob. Planet Change 2008, 61, 135–150. [Google Scholar] [CrossRef]
- Lambin, E.F.; Turner, B.L.; Geist, H.J.; Agbola, S.B.; Angelsen, A.; Bruce, J.W.; Coomes, O.T.; Dirzo, R.; Fischer, G.; Folke, C.; et al. The Causes of Land-Use and Land-Cover Change: Moving beyond the Myths. Glob. Environ. Change 2001, 11, 261–269. [Google Scholar] [CrossRef]
- FAO. State of the World’s Forests 2011; Food and Agriculture Organization of the United Nations: Rome, Italy, 2011; p. 164. [Google Scholar]
- Lee, E.; He, Y.; Zhou, M.; Liang, J. Potential Feedback of Recent Vegetation Changes on Summer Rainfall in the Sahel. Phys. Geogr. 2015, 36, 449–470. [Google Scholar] [CrossRef]
- Taylor, C.M.; Belusic, D.; Guichard, F.; Parker, D.J.; Vischel, T.; Bock, O.; Harris, P.P.; Janicot, S.; Klein, C.; Panthou, G. Frequency of Extreme Sahelian Storms Tripled since 1982 in Satellite Observations. Nature 2017, 544, 475–478. [Google Scholar] [CrossRef] [PubMed]
- Sanogo, S.; Fink, A.H.; Omotosho, J.A.; Ba, A.; Redl, R.; Ermert, V. Spatio-Temporal Characteristics of the Recent Rainfall Recovery in West Africa. Int. J. Climatol. 2015, 35, 4589–4605. [Google Scholar] [CrossRef]
- Nicholson, S.E.; Fink, A.H.; Funk, C. Assessing Recovery and Change in West Africa’s Rainfall Regime from a 161-Year Record. Int. J. Climatol. 2018, 38, 3770–3786. [Google Scholar] [CrossRef]
- Chagnaud, G.; Panthou, G.; Vischel, T.; Lebel, T. A Synthetic View of Rainfall Intensification in the West African Sahel. Environ. Res. Lett. 2022, 17, 044005. [Google Scholar] [CrossRef]
- Dieng, M.; Mbow, C.; Skole, D.L.; Ba, B. Sustainable Land Management Policy to Address Land Degradation: Linking Old Forest Management Practices in Senegal with New REDD+ Requirements. Front Environ. Sci. 2023, 11, 1088726. [Google Scholar] [CrossRef]
- Fitzpatrick, F.A.; Knox, J.C. Spatial and Temporal Sensitivity of Hydrogeomorphic Responceand Recovery to Deforestation, Agriculture, And Floods. Phys. Geogr. 2000, 21, 89–108. [Google Scholar] [CrossRef]
- Schiesari, L.; Ilha, P.R.; Negri, D.D.B.; Prado, P.I.; Grillitsch, B. Ponds, Puddles, Floodplains and Dams in the Upper Xingu Basin: Could We Be Witnessing the ‘Lentification’ of Deforested Amazonia? Perspect. Ecol. Conserv. 2020, 18, 61–72. [Google Scholar] [CrossRef]
- Doso, S.J. Land Degradation and Agriculture in the Sahel of Africa: Causes, Impacts and Recommendations. J. Agric. Sci. Appl. 2014, 3, 67–73. [Google Scholar] [CrossRef]
- Ahmed, A.; Jibrin, M.A.; Gambo, J.; Mamman, B.; Siriki, A. It Has Been with Us in One Form or Another: Drought and The Sahel Crisis. Ethiop. J. Environ. Stud. Manag. 2021, 14, 737–754. [Google Scholar]
- Njoki, F.W. Environmental Stress and Conflicts in the Sahel Region: A Case Study of Mali. Ph.D. Thesis, University of Nairobi, Nairobi, Kenya, 2023. [Google Scholar]
- Boland, J. Rainfall Enhances Vegetation Growth but Does the Reverse Hold? Water 2014, 6, 2127–2143. [Google Scholar] [CrossRef]
- Abera, T.A.; Heiskanen, J.; Pellikka, P.; Maeda, E.E. Rainfall–Vegetation Interaction Regulates Temperature Anomalies during Extreme Dry Events in the Horn of Africa. Glob. Planet. Change 2018, 167, 35–45. [Google Scholar] [CrossRef]
- Zhou, J.; Jia, L.; Menenti, M.; van Hoek, M.; Lu, J.; Zheng, C.; Wu, H.; Yuan, X. Characterizing Vegetation Response to Rainfall at Multiple Temporal Scales in the Sahel-Sudano-Guinean Region Using Transfer Function Analysis. Remote Sens. Environ. 2021, 252, 112108. [Google Scholar] [CrossRef]
- Nielsen, T.T.; Rasmussen, K.; Mbow, C.; Touré, A. The Fire Regime of Senegal and Its Determinants. Geogr. Tidsskr. Dan. J. Geogr. 2003, 103, 43–53. [Google Scholar] [CrossRef]
- Mbow, C.; Nielsen, T.T.; Rasmussen, K. Savanna Fires in East Central Senegal: Distribution Patterns, Resource Management and Perceptions. Hum. Ecol. 2000, 28, 561–583. [Google Scholar] [CrossRef]
- Samb, C.O.; Aw, O.A.; Ndiaye, O.; Goudiaby, M.; Thiam, M.; Ndiaye, S. Dynamique Spatio-Temporelle Des Feux de Brousse de 2010 à 2020: Cas de l’arrondissement de Dioulacolon (Kolda, Sénégal). J. Anim. Plant Sci. 2025, 62, 11673–11688. [Google Scholar]
- Peuple, U.; But, U.; Foi, U. République du Sénégal Ministère de L’environnement et de la Transition Ecologique. Direction Des Eaux et Forêts, Chasses et de la Conservation Des Sols. Available online: https://www.geosenegal.gouv.sn/+-direction-des-eaux-et-forets-chasse-et-conservation-des-sols-+.html (accessed on 3 June 2025).
- Mbow, C.; Sambou, B.; Ba, A.T.; Goudiaby, A. Vegetation and Fire Readiness in Main Morphological Units of Niokolo Koba National Park (Southeast Senegal). Geogr. Tidsskr. 2003, 103, 55–62. [Google Scholar] [CrossRef]
- Land Use Account in Senegal 2010–2015. Project “Economic and Environmental Accounting for Evidence-Based Policy in Senegal”. 2023. Available online: https://www.ansd.sn/sites/default/files/2023-05/Rapport%20OCSOL_22_05_2023_Publication_0.pdf (accessed on 4 July 2025).
- Republique du Senegal Un Peuple-Un But-Une Foi Commission Nationale de Reforme Fonciere Document de Politique Fonciere. 2016. Available online: https://faolex.fao.org/docs/pdf/Sen182115.pdf (accessed on 3 June 2025).
- Abdoulaye Dieng, P.; Faso, B. Evaluation du Potentiel d’amélioration du Disponible Fourrager Cultivé Dans Les Six (6) Pays du PRAPS. Available online: https://www.praps-cilss.org/content/download/4775/35974/version/1/file/Rapport-final-cultures_fourrage-CORAF.pdf (accessed on 3 June 2025).
- Macia, E.; Allouche, J.; Sarr, P.; Cesaro, J.D.; Sagna, M.B.; Diallo, A.H.; Boëtsch, G.; Guisse, A.; Duboz, P. The Great Green Wall in Senegal: Questioning the Idea of Acceleration through the Conflicting Temporalities of Politics and Nature among the Sahelian Populations. Ecol. Soc. 2023, 28, 280131. [Google Scholar] [CrossRef]
- Sarr, M.S.; Diallo, A.M.; King-Okumu, C. A Review of Public versus Private Reforestation Programs in the Senegalese Sahel: Taking Stock of Realities and Challenges. Restor. Ecol. 2022, 30, e13582. [Google Scholar] [CrossRef]
- Winterbottom, R.; McGahuey, M.; Tappan, G. Adoption of Farmer Managed Regeneration in Senegal. ETFRN Newsl. 2020, 60, 69–76. [Google Scholar]
- Karambiri, M.; Bourne, M.; Bayala, J.; Ndiaye, A.D.; Sanogo, D. ‘Trees Are Not All the Same’ Assessing the Policy and Regulatory Barriers to the Upscaling of Famer Managed Natural Regeneration (FMNR) in Senegal. For. Trees Livelihoods 2023, 32, 221–243. [Google Scholar] [CrossRef]
- Fanchette, S. Densité de Population et Intensification Agro-Pastorale En Haute-Casamance. Espace Popul. Soc. 1999, 17, 67–81. [Google Scholar] [CrossRef]
- Sidibé, M. Migrants de l’Arachide; IRD Editions: Marseille, France, 2005. [Google Scholar]
- Souleymane, G. Collecte et Analyse de Données Pour l’aménagement Durable Des Forêts-Joindre Les Efforts Nationaux et Internationaux Programme de Partenariat CE-FAO (1998–2002) Etude Sur Les Ressources Forestieres et Les Plantations Forestieres du Senegal Periode: 1992–99; 2000. Available online: https://openknowledge.fao.org/server/api/core/bitstreams/adc92edf-b88c-45ac-b034-7988b32401d7/content (accessed on 3 June 2025).
- Tappan, G.G.; Hadj, A.; Wood, E.C.; Lletzow, R.W. ChangUse of Argon, Corona, and Landsat Imagery to Assess 30 Years of Land Resource Changes in West-Central Senegal. Photogramm. Eng. Remote Sens. 2000, 66, 727–736. [Google Scholar]
- Hummel, D. Climate Change, Land Degradation and Migration in Mali and Senegal—Some Policy Implications. Migr. Dev. 2016, 5, 211–233. [Google Scholar] [CrossRef]
- Cabral, A.I.R.; Costa, F.L. Land Cover Changes and Landscape Pattern Dynamics in Senegal and Guinea Bissau Borderland. Appl. Geogr. 2017, 82, 115–128. [Google Scholar] [CrossRef]
- Kaag, M.; Baltissen, G.; Steel, G.; Lodder, A. Migration, Youth, and Land in West Africa: Making the Connections Work for Inclusive Development. Land 2019, 8, 60. [Google Scholar] [CrossRef]
- Faye, B.; Diéne, J.C.; Du, G.; Liang, C.; Kouadio, Y.D.; Mbaye, E.; Li, Y. Decentralization Policies and Rural Socio-Economic Growth in Senegal: An Exploration of Their Contributions to Development and Transformation. World 2024, 5, 1054–1076. [Google Scholar] [CrossRef]
- Wood, E.C.; Tappan, G.G.; Hadj, A. Understanding the Drivers of Agricultural Land Use Change in South-Central Senegal. J. Arid. Environ. 2004, 59, 565–582. [Google Scholar] [CrossRef]
- Brandt, M.; Romankiewicz, C.; Spiekermann, R.; Samimi, C. Environmental Change in Time Series—An Interdisciplinary Study in the Sahel of Mali and Senegal. J. Arid. Environ. 2014, 105, 52–63. [Google Scholar] [CrossRef]
- Baddianaah, I. We All Share the Blame: Analyzing the Root Causes of Flooding in African Cities with Specific Reference to Harper City, Liberia. Environ. Chall. 2023, 13, 100790. [Google Scholar] [CrossRef]
- Amogu, O.; Descroix, L.; Yéro, K.S.; Breton, E.L.; Mamadou, I.; Ali, A.; Vischel, T.; Bader, J.C.; Moussa, I.B.; Gautier, E.; et al. Increasing River Flows in the Sahel? Water 2010, 2, 170–199. [Google Scholar] [CrossRef]
- Mahe, G.; Lienou, G.; Descroix, L.; Bamba, F.; Paturel, J.E.; Laraque, A.; Meddi, M.; Habaieb, H.; Adeaga, O.; Dieulin, C.; et al. The Rivers of Africa: Witness of Climate Change and Human Impact on the Environment. Hydrol. Process 2013, 27, 2105–2114. [Google Scholar] [CrossRef]
- Descroix, L.; Guichard, F.; Grippa, M.; Lambert, L.A.; Panthou, G.; Mahé, G.; Gal, L.; Dardel, C.; Quantin, G.; Kergoat, L.; et al. Evolution of Surface Hydrology in the Sahelo-Sudanian Strip: An Updated Review. Water 2018, 10, 748. [Google Scholar] [CrossRef]

| Date | Acquisition Date | Satellite | Path/Row | Spatial Resolution |
|---|---|---|---|---|
| 1988 | 1988/12/03 1988/12/10 1988/12/10 1988/12/10 1988/11/15 1988/12/01 | Landsat 5 | 201/052 202/050 202/051 202/052 203/050 203/051 | 30 m |
| 2002 | 2002/12/18 2002/12/25 2002/12/25 2022/12/25 2002/12/16 2003/01/01 | Landsat 7 | 201/052 202/050 202/051 202/052 203/050 203/051 | 30 m |
| 2022 | 2022/12/25 2022/12/24 2022/12/24 2022/12/24 2022/12/23 2022/12/23 | Landsat 9 Landsat 8 Landsat 8 Landsat 8 Landsat 9 Landsat 9 | 201/052 202/050 202/051 202/052 203/050 203/051 | 30 m |
| Land Cover | 1988 | 2002 | 2022 | |||
|---|---|---|---|---|---|---|
| ha | % | ha | % | ha | % | |
| Water | 26,807 | 0.63 | 25,337 | 0.6 | 11,862 | 0.28 |
| Forest | 1,374,975 | 32.36 | 1,092,177 | 25.7 | 1,541,035 | 36.27 |
| Savanna | 2,400,358 | 56.49 | 2,292,801 | 53.96 | 2,019,953 | 47.54 |
| Bowe and steppe | 243,284 | 5.73 | 610,811 | 14.37 | 536,513 | 12.63 |
| Agriculture area and bare soils | 117,717 | 2.77 | 79,453 | 1.87 | 130,289 | 3.07 |
| Burn | 86,192 | 2.03 | 148,753 | 3.5 | 9680 | 0.23 |
| Total | 4,249,333 | 100 | 4,249,333 | 100 | 4,249,333 | 100 |
| Classes | Water | Forest | Savanna | Bowe and Steppe | Agriculture Area and Bares Soils | Burn | Total | Regression |
|---|---|---|---|---|---|---|---|---|
| Water | 17,903.5 | 7491.5 | 2412.5 | 253.9 | 127.0 | 1523.7 | 29,712.1 | 11,808.7 |
| Forest | 7872.4 | 770,864.2 | 468,283.2 | 51,551.8 | 1396.7 | 68,312.5 | 1,368,280.7 | 597,416.6 |
| Savanna | 1142.8 | 290,391.4 | 1,601,025.6 | 408,858.9 | 25,141.0 | 72,121.7 | 2,398,681.5 | 797,655.9 |
| Bowe and steppe | 127.0 | 10,665.9 | 125,070.2 | 94,723.2 | 11,681.7 | 3936.2 | 246,204.2 | 151,481.0 |
| Agriculture area and bares soils | 0.0 | 2539.5 | 33,140.4 | 44,441.2 | 40,124.0 | 888.8 | 121,134.0 | 81,009.9 |
| Burn | 127.0 | 10,031.0 | 54,345.2 | 10,792.9 | 380.9 | 10,158.0 | 85,835.0 | 75,677.0 |
| Total | 27,172.6 | 1,091,983.5 | 2,284,277.1 | 610,621.9 | 78,851.4 | 156,940.9 | 4,249,847.5 | 1,715,049.0 |
| Progression | 9269.2 | 321,119.3 | 683,251.5 | 515,898.7 | 38,727.3 | 146,782.9 | 1,715,049.0 |
| Classes | Water | Forest | Savanna | Bowe and Steppe | Agriculture Area and Bares Soils | Burn | Total | Regression |
|---|---|---|---|---|---|---|---|---|
| Water | 8507.3 | 14,348.2 | 3936.2 | 380.9 | 0.0 | 0.0 | 27,172.6 | 18,665.3 |
| Forest | 761.8 | 811,623.1 | 211,159.1 | 60,820.9 | 4825.0 | 2793.4 | 1,091,983.5 | 280,360.4 |
| Savanna | 761.8 | 580,275.0 | 1,393,548.7 | 261,441.2 | 41,520.8 | 6729.7 | 2,284,277.1 | 890,728.4 |
| Bowe and steppe | 0.0 | 82,914.6 | 303,215.9 | 181,701.0 | 42,663.5 | 127.0 | 610,621.9 | 428,921.0 |
| Agriculture area and bare soils | 0.0 | 1523.7 | 11,173.8 | 22,093.6 | 44,060.3 | 0.0 | 78,851.4 | 34,791.1 |
| Burn | 253.9 | 64,122.3 | 81,898.8 | 8888.2 | 1650.7 | 127.0 | 156,940.9 | 156,813.9 |
| Total | 10,285.0 | 1,554,806.8 | 2,004,932.5 | 535,325.9 | 134,720.3 | 9777.1 | 4,249,847.5 | 1,810,280.1 |
| Progression | 1777.6 | 743,183.7 | 611,383.8 | 353,624.9 | 90,660.0 | 9650.1 | 1,810,280.1 |
| Land Conversion | Period | Correlation (r) | p-Value |
|---|---|---|---|
| Agricultural Areas and Bare Soil to Bowe and Steppe | 1988–2002 | 0.268 | 0.034 |
| Forest to Bowe and Steppe | 1988–2002 | 0.225 | 0.007 |
| Forest to Water | 1988–2002 | −0.633 | 0.001 |
| Savanna to Bowe and Steppe | 2002–2022 | −0.073 | 0.034 |
| Savanna to Forest | 2002–2022 | 0.058 | 0.048 |
Disclaimer/Publisher’s Note: The statements, opinions and data contained in all publications are solely those of the individual author(s) and contributor(s) and not of MDPI and/or the editor(s). MDPI and/or the editor(s) disclaim responsibility for any injury to people or property resulting from any ideas, methods, instructions or products referred to in the content. |
© 2025 by the authors. Licensee MDPI, Basel, Switzerland. This article is an open access article distributed under the terms and conditions of the Creative Commons Attribution (CC BY) license (https://creativecommons.org/licenses/by/4.0/).
Share and Cite
Kah, M.; Faye, C.; Mbaye, M.L.; Yalo, N.; Gunnar, L. Hydroclimatic Trends and Land Use Changes in the Continental Part of the Gambia River Basin: Implications for Water Resources. Water 2025, 17, 2075. https://doi.org/10.3390/w17142075
Kah M, Faye C, Mbaye ML, Yalo N, Gunnar L. Hydroclimatic Trends and Land Use Changes in the Continental Part of the Gambia River Basin: Implications for Water Resources. Water. 2025; 17(14):2075. https://doi.org/10.3390/w17142075
Chicago/Turabian StyleKah, Matty, Cheikh Faye, Mamadou Lamine Mbaye, Nicaise Yalo, and Lischeid Gunnar. 2025. "Hydroclimatic Trends and Land Use Changes in the Continental Part of the Gambia River Basin: Implications for Water Resources" Water 17, no. 14: 2075. https://doi.org/10.3390/w17142075
APA StyleKah, M., Faye, C., Mbaye, M. L., Yalo, N., & Gunnar, L. (2025). Hydroclimatic Trends and Land Use Changes in the Continental Part of the Gambia River Basin: Implications for Water Resources. Water, 17(14), 2075. https://doi.org/10.3390/w17142075