Article

Integrating Inverse Modeling to Investigate Hydrochemical Evolution in Arid Endorheic Watersheds: A Case Study from the Qaidam Basin, Northwestern China

1
College of Geology and Environment, Xi’an University of Science and Technology, Xi’an 710054, China
2
Tianjin Center, China Geological Survey, Tianjin 300170, China
*
Author to whom correspondence should be addressed.
Water 2025, 17(14), 2074; https://doi.org/10.3390/w17142074
Submission received: 2 June 2025 / Revised: 29 June 2025 / Accepted: 8 July 2025 / Published: 11 July 2025
(This article belongs to the Special Issue Soil and Groundwater Quality and Resources Assessment, 2nd Edition)

Abstract

The hydrochemical characteristics and evolution mechanisms of groundwater are critical for accurately understanding the input–output budget of hydrochemical constituents in pristine groundwater. However, few studies have analyzed the changes in mineral precipitation and dissolution equilibrium along the groundwater flow path, especially in arid regions. This study integrated hydrochemical analysis, stable isotopes, and inverse hydrochemical modeling to identify groundwater recharge sources, hydrochemical evolution, and controlling mechanisms in an arid endorheic watershed, northwestern China. A stable isotope signature indicated that groundwater is primarily recharged by high-altitude meteoric precipitation and glacial snowmelt. The regional hydrochemical type evolved from HCO3·Cl-Ca·Mg·Na types in phreatic aquifers to more complex HCO3·Cl-Ca·Mg Na and HCO3·Cl-Na Mg types in confined aquifers and a Cl-Mg·Na type in high-salinity groundwater. The dissolution of halite, gypsum, calcite, K-feldspar, and albite was identified as the primary source of dissolved substances and a key factor controlling the hydrochemical characteristics. Meanwhile, hydrochemical evolution is influenced by cation exchange, mineral dissolution–precipitation, and carbonate equilibrium mechanisms. Inverse hydrochemical modeling demonstrated that high-salinity groundwater has experienced intensive evaporation and quantified the transfer amounts of associated minerals. This study offers deeper insight into hydrochemical evolution in the Golmud River watershed and elucidates mineral transport and enrichment mechanisms, providing a theoretical basis for investigating hydrochemical metallogenic processes.

1. Introduction

Groundwater, as a stable source of freshwater supply, constitutes an indispensable component in the global response to escalating climate change challenges [1,2]. The hydrochemical characteristics of groundwater during recharge, runoff, and discharge processes are primarily governed by water–rock interactions, including mineral dissolution and precipitation, ion exchange, adsorption, and redox reactions. The processes and patterns of hydrochemical evolution are closely related to the spatial distribution and availability of freshwater resources [3,4]. To elucidate regional hydrochemical evolution and controlling mechanisms, various methods have been employed, including ratio relationships of hydrochemical parameters, graphical analysis, multivariate statistical methods, and inverse hydrochemical models [5]. Piper diagrams, Gibbs diagrams, and ionic ratios are integrated to analyze the hydrochemical distribution comprehensively and the controlling factors of both surface water and groundwater [6,7]. Hydrochemical components, stable isotopes (2H, 18O), and radiogenic isotopes (14C, 222Rn) enable the identification of groundwater recharge sources and the analysis of the impacts of processes such as evaporation and mixing on hydrochemical features, thereby revealing the spatial variability of surface water and groundwater interactions [8,9]. On the other hand, Phreeqc, a widely used geochemical modeling tool, facilitates the quantitative assessment of hydrochemical processes by calculating mineral saturation indices and simulating water–rock interactions between groundwater and the surrounding aquifer medium [10,11,12].
The Golmud River watershed, located in the middle of the southern margin of the Qaidam Basin, is a typical inland river system within the arid region of northwestern China. The study area is characterized by extremely high surface evaporation and a vulnerable ecological environment, where groundwater serves as a critical component in sustaining ecological stability [13,14]. Regional water balance and ecosystem functionality are strongly governed by the continuous exchange and interaction between surface water and groundwater [15,16]. Groundwater in the study area exhibits distinct spatial hydrochemical profiles, and previous studies have explored its geochemical evolution based on regional hydrochemical characteristics [15], isotopic tracing [8,17], and numerical modeling approaches [18,19]. However, the dissolution–precipitation equilibria of multiple mineral systems, including carbonates, sulfates, and silicates, during hydrochemical evolution in the study area remain poorly understood, hindering an accurate understanding of water–rock interactions in shaping regional hydrochemical characteristics [20].
To address these gaps, this study integrates inverse hydrochemical modeling to investigate hydrochemical evolution and its controlling mechanisms in the Golmud River watershed. The study objective is (1) to elucidate the hydrochemical evolution processes and (2) to evaluate the amounts of mineral transfer during water–rock interactions. Hydrochemical compositions and stable isotopic signatures (δ2H-δ18O) were used to trace groundwater recharge sources and identify the dominant hydrochemical evolution processes. This study enhances the understanding of the formation and evolution of hydrochemical characteristics in the Golmud River watershed and provides valuable scientific insights for the sustainable development of groundwater resources in the Qaidam Basin, as well as for preserving ecological balance.

2. Materials and Methods

2.1. Regional Hydrogeological Backgrounds

The Golmud River watershed is in the central part of the southern margin of the Qaidam Basin, originating from the Kunlun Mountains and flowing northward into Dabusun Lake, with elevations ranging from 2442 to 6212 m (Figure 1). The study area is characterized by intense evaporation, arid conditions with low precipitation, and large diurnal temperature variations. It exhibits a typical plateau continental climate, with a multi-year average precipitation of 42.3 mm and an average annual evaporation of 2626.9 mm [17]. Water resources in the study area are recharged primarily from snow and glacial meltwater in the Kunlun Mountains, as well as atmospheric precipitation. Groundwater and the Golmud River are closely interconnected, forming an endorheic groundwater–river system. The distribution of groundwater in the study area is influenced and constrained by regional stratigraphy, lithology, geological formations, and geomorphological conditions [21]. The Golmud River originates from the Kunlun Mountains, where the geological strata exhibit complex and diverse lithologies, and rock fractures is heterogeneous, leading to low overall permeability [22]. The piedmont alluvial fan is primarily composed of alluvial deposits, including gravel and sand. This area is characterized by thick, unconfined aquifers with broad distribution and high groundwater yield. In contrast, the central plain area mainly consists of fine-grained lacustrine and fluvial sediments, including clay, silt, and fine sand. These deposits form multi-layered heterogeneous confined aquifers whose hydraulic properties are governed by the texture and compaction of the deposits [23].

2.2. Hydrochemical Sampling and Measurement

In this study, a total of 43 water samples were collected in August 2022, including 16 river samples, 6 phreatic water samples, 17 confined water samples, and 4 high salinity water samples. Surface water samples were collected along the Golmud River, while groundwater samples were obtained from boreholes or artesian wells (Figure 1). Groundwater samples were collected in field after at least 10 min of pumping or flowing until pH, dissolved oxygen (DO), and redox potential (ORP) had stabilized, ensuring that the samples accurately represent the native hydrochemical characteristics. Prior to sampling, all sample bottles were rinsed three times with the original water to be collected. Hydrogen and oxygen isotope samples were stored in 60 mL brown polyethylene bottles, while samples for cations, anions, and trace elements were stored in 500 mL polyethylene bottles. All water samples were filtered through 0.45 μm filter in the field. For cation analysis, 2–3 drops HNO3 (analytical grade) were added to prevent precipitation. All sampling bottles were filled to avoid headspace.
pH, ORP, DO, and electrical conductivity (EC) were measured in the field with a set of portable hydrochemical testers (CLEAN, Shanghai ZhenMai Instruments, Shanghai, China). Cl, SO42−, F, and NO3 were analyzed using Ion Chromatography (ICS-90, Dionex Thermo Scientific, Sunnyvale, CA, USA), while HCO3 and CO32− were measured by Acid-base titration auto-analyzer (905 Titrando, Metrohm AG, Herisau, Switzerland). Ca2+, Mg2+, Na+, and K+, as well as trace elements including Sr and Li, were determined using an Inductively Coupled Plasma Optical Emission Spectrometer (ICP-OES, SPECTRO Analytical Instruments, Kleve, Germany). TDS was calculated as the sum of major ions minus half the concentration of HCO3. Si and HSiO3 were analyzed using spectrophotometry. Stable isotopes (2H and 18O) were measured using a gas isotope ratio mass spectrometry (LGR LWIA-24d, Los Gatos Research, Inc., Los Gatos, CA, USA) and reported with respect to the Vienna Standard Mean Ocean Water (VSMOW) standard. All analytical results met the charge balance requirements for hydrochemical cation–anion equilibrium, which was within the 5% error limit [24].

2.3. Hydrochemical Analyses

This study calculated the correlations among hydrochemical variables to assess the similarity of dissolved component sources in groundwater and to identify potential sources of dissolved minerals [25]. The correlation matrix, using color gradients and significance markers, was employed to visually display the magnitude and statistical significance of the relationships among hydrochemical variables. The Piper diagram was used to identify groundwater types and to analyze hydrochemical evolution processes along the groundwater flow path [26]. The Gibbs diagram was applied to identify the controlling mechanisms of major ionic compositions in groundwater by examining the relationships among Na+/(Na++Ca2+), Cl/(HCO3+Cl), and TDS [27,28]. Based on the geochemical characteristic variations of weathering products from different rock types (silicate, carbonate, and evaporites), this study analyzed the distribution patterns of Mg2+/Na+ and HCO3/Na+ ratios relative to Ca2+/Na+ to identify the primary sources of dissolved components in groundwater [29]. In addition, the precipitation and dissolution processes of various minerals determine the quantitative relationships among hydrochemical parameters in groundwater. This study conducted a comprehensive analysis of ionic ratios to identify the potential mineral sources [30]. The evaporation–concentration process and cation exchange are also important mechanisms constraining the hydrochemical characteristics of groundwater [31]. The chlor-alkaline index (CAI) was used to assess whether cation exchange occurs in groundwater:
CAI I = Cl ( Na + + K + ) Cl
CAI II = Cl ( Na + + K + ) HCO 3 + SO 4 2 + CO 3 2 + NO 3
Negative values of CAI-I and CAI-II indicate that Ca2+ and/or Mg2+ in groundwater have been exchanged with Na+ and/or K+ from the surrounding aquifer medium. Conversely, positive values suggest the opposite exchange direction [32].

2.4. Inverse Hydrochemical Modeling Approach

The inverse hydrochemical modeling approach applies the principle of mass conservation to calculate the possible water–rock interactions that may occur along a flow path between two points (a starting point and an endpoint), providing multiple potential solutions for the mineral reactions involved [33]. In detail, inverse modeling primarily involves the following key points. First, appropriate simulation paths are selected according to actual groundwater flow directions and hydrochemical characteristics. Next, the dissolution or precipitation status of potential minerals is identified based on groundwater hydrochemical data. This step includes quantifying the chemical compositions at the start and end points of the flow path and defining potential mineral and constraint phases based on the hydrogeological background and saturation index (SI) [30]. The saturation index is a quantitative measure to assess the equilibrium state of a specific mineral in hydrochemical samples, where
SI = log ( IAP K sp )
IAP is the ion activity product of the dissolved ions that form the specific mineral. Ksp is the solubility product constant of the corresponding mineral at the given temperature. Then, the inverse hydrochemical model is launched to generate possible reaction pathways. Inverse hydrochemical modeling was performed using Phreeqc software (version 3.3.5) [12]. The most plausible solution is evaluated and selected according to regional hydrogeological conditions, and the dissolution and precipitation processes and transfer amounts of minerals along the simulated path are interpreted accordingly [34]. Cation exchange was also considered, as determined by mole-balance modeling [12].

3. Results and Discussion

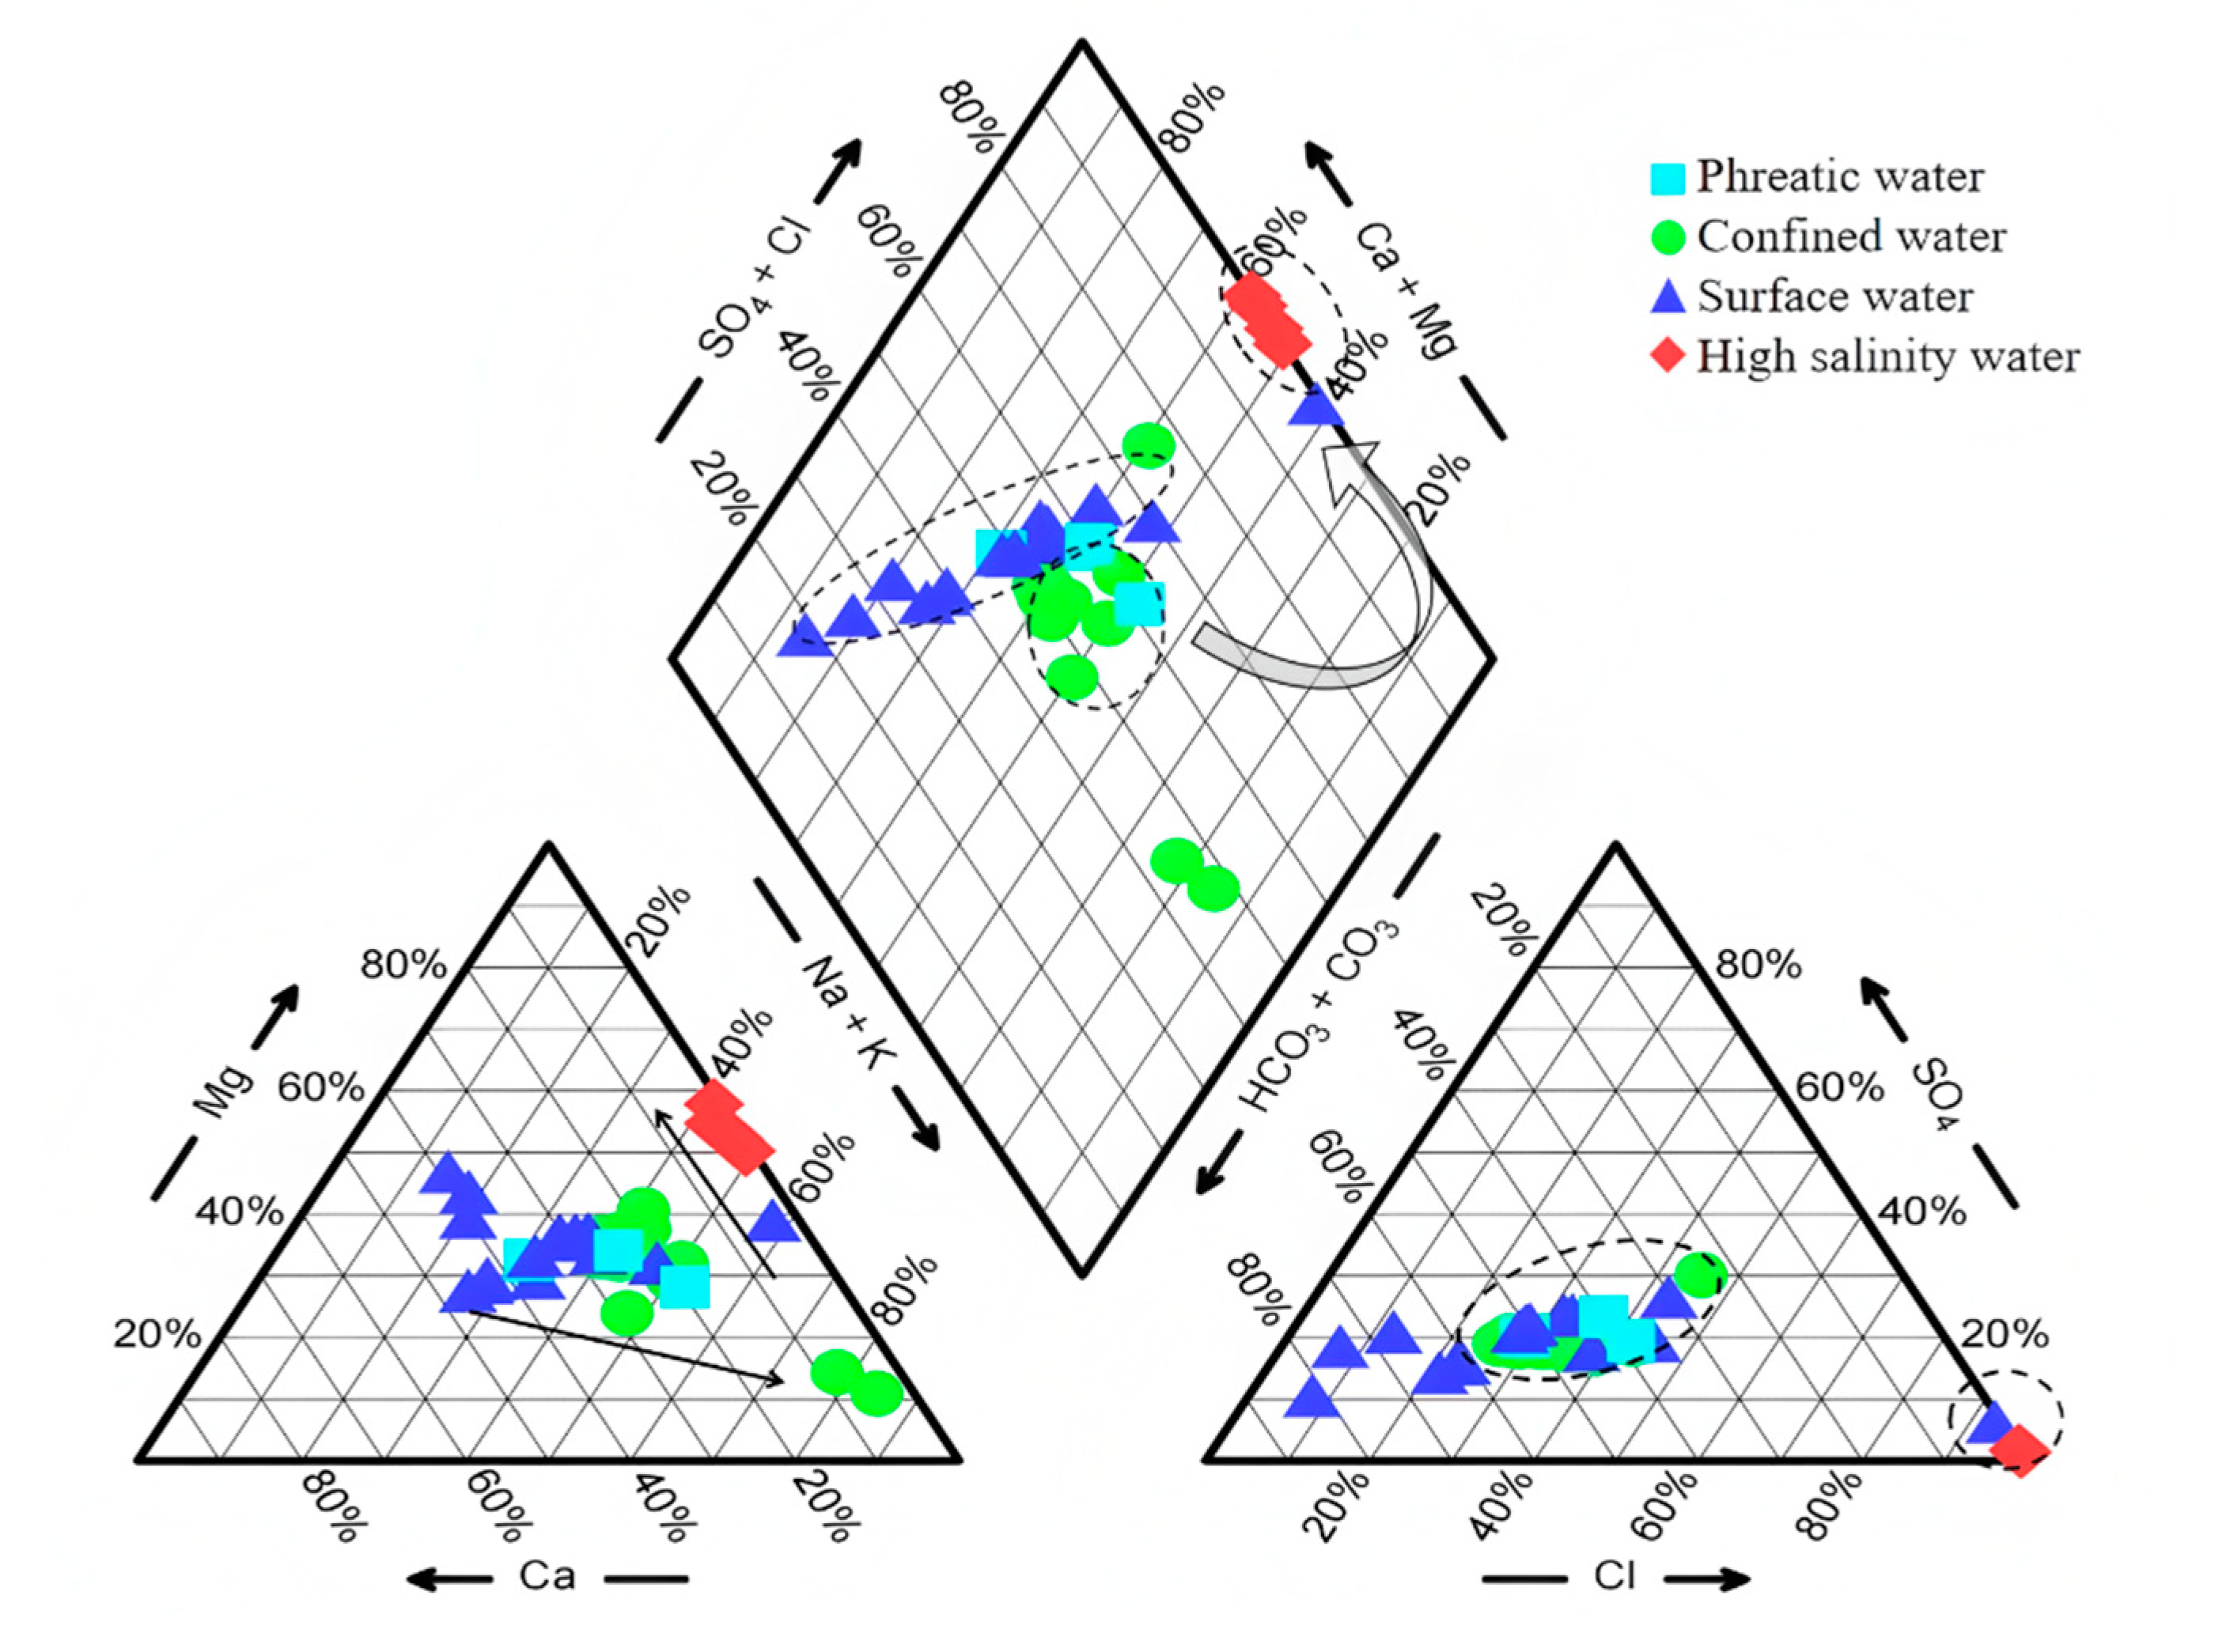
3.1. Hydrochemical Characterization in the Golmud River Watershed

The hydrochemical data of groundwater and river water in the study area are summarized in Table 1, and the results reveal pronounced variations in key hydrochemical parameters across surface river water, phreatic groundwater, confined groundwater, and high-salinity groundwater. The pH values ranged from 6.5 to 9.5, with phreatic groundwater (8.05) and confined groundwater (8.05) showing relatively small fluctuations and indicating weakly alkaline conditions. River water exhibited a slightly higher pH (8.48) compared to phreatic and artesian groundwater, while high-salinity groundwater had the lowest pH values (6.6), representing neutral to slightly acidic conditions. The total dissolved solids (TDS) of groundwater ranged from 230.19 mg/L to 302,909.31 mg/L, showing a continuous accumulation of dissolved ionic components along the groundwater flow path (Table 1). Similarly, surface water exhibited a comparable trend of accumulation, with TDS values ranging from 230.19 mg/L to 14,247.12 mg/L. Meanwhile, the concentration of DO decreased from unconfined groundwater (43.42%) to confined groundwater (26.94%) and ORP also showed a similar decline from an average of 208 mV in unconfined groundwater to −3.76 mV in confined groundwater, indicating a transition from oxidizing to reducing conditions along the groundwater flow path (Table 1). These systematic variations reflect distinct hydrochemical evolutionary pathways governed by regional hydrological and geochemical processes.
To investigate the interrelationships among different hydrochemical variables, a correlation analysis was conducted (Spearman, Figure 2). The results showed that the major cations (Na+, K+, and Mg2+) and anions (Cl and SO42−) in groundwater are significantly positively correlated (p < 0.05), suggesting that these ions likely originated from a relatively consistent source. Both Li+ and Sr2+ also exhibited significant correlations with major cations (Na+, K+, and Mg2+) and anions (Cl and SO42−), hinting that these components may derive from common mineral sources. The primary sources of Li+ and Sr2+ are largely released from the weathering and dissolution of carbonate and silicate minerals. Their enrichment is jointly controlled by water–rock interactions and evaporation concentration processes [35,36,37]. Studies have shown that groundwater in arid regions normally contains higher concentrations of Li+ and Sr2+ [36]. The pH values displayed significant correlations with HCO3 and CO32− (p < 0.05), indicating the control of carbonate equilibrium on HCO3 and CO32− in the groundwater system. A positive correlation was also observed between HSiO3 and HCO3, suggesting that the carbonate equilibrium influences the dissolution of silicate minerals. This implies that multiple hydrochemical processes interact to form a complex hydrochemical environment, highlighting the need for further investigation into its evolution and controlling mechanisms. Additionally, NO3 exhibited weak correlations with other hydrochemical variables, and its concentration showed minimal variation among river water, unconfined groundwater, and confined groundwater, suggesting limited anthropogenic influence in the study area [38].
The Piper diagram revealed a systematic variation in hydrochemical types along the groundwater flow path (Figure 3). The hydrochemical type of phreatic groundwater was mainly composed of HCO3·Cl-Ca·Mg Na, while confined groundwater exhibited more complex types, including HCO3·Cl-Ca·Mg Na and HCO3·Cl-Na Mg. In contrast, high-salinity groundwater was predominantly of the Cl-Mg·Na type. The hydrochemical evolution from phreatic to high-salinity groundwater followed a clear ‘two-step’ pattern [24]. In the first stage, while the proportions of major anions remained stable, the dominant cations shifted from Ca2+ and Mg2+ in the phreatic aquifer to Na+ and K+ in the confined aquifer. During this stage, the hydrochemical type experienced a significant transformation with little variation in TDS (Table 1). The second stage was characterized by a sharp increase in TDS along the groundwater flowpath, with Cl and Mg2+ emerging as the dominant ions in terms of ionic proportions. This pattern has also been identified in previous studies [21,24]. The complex hydrochemical evolution is controlled by multiple interacting mechanisms and merits further investigation [14]. In addition, surface river water was mainly characterized by HCO3·Mg-Ca and HCO3·Cl-Mg Na·Ca types and displayed evolutionary trends similar to those of low TDS groundwater.

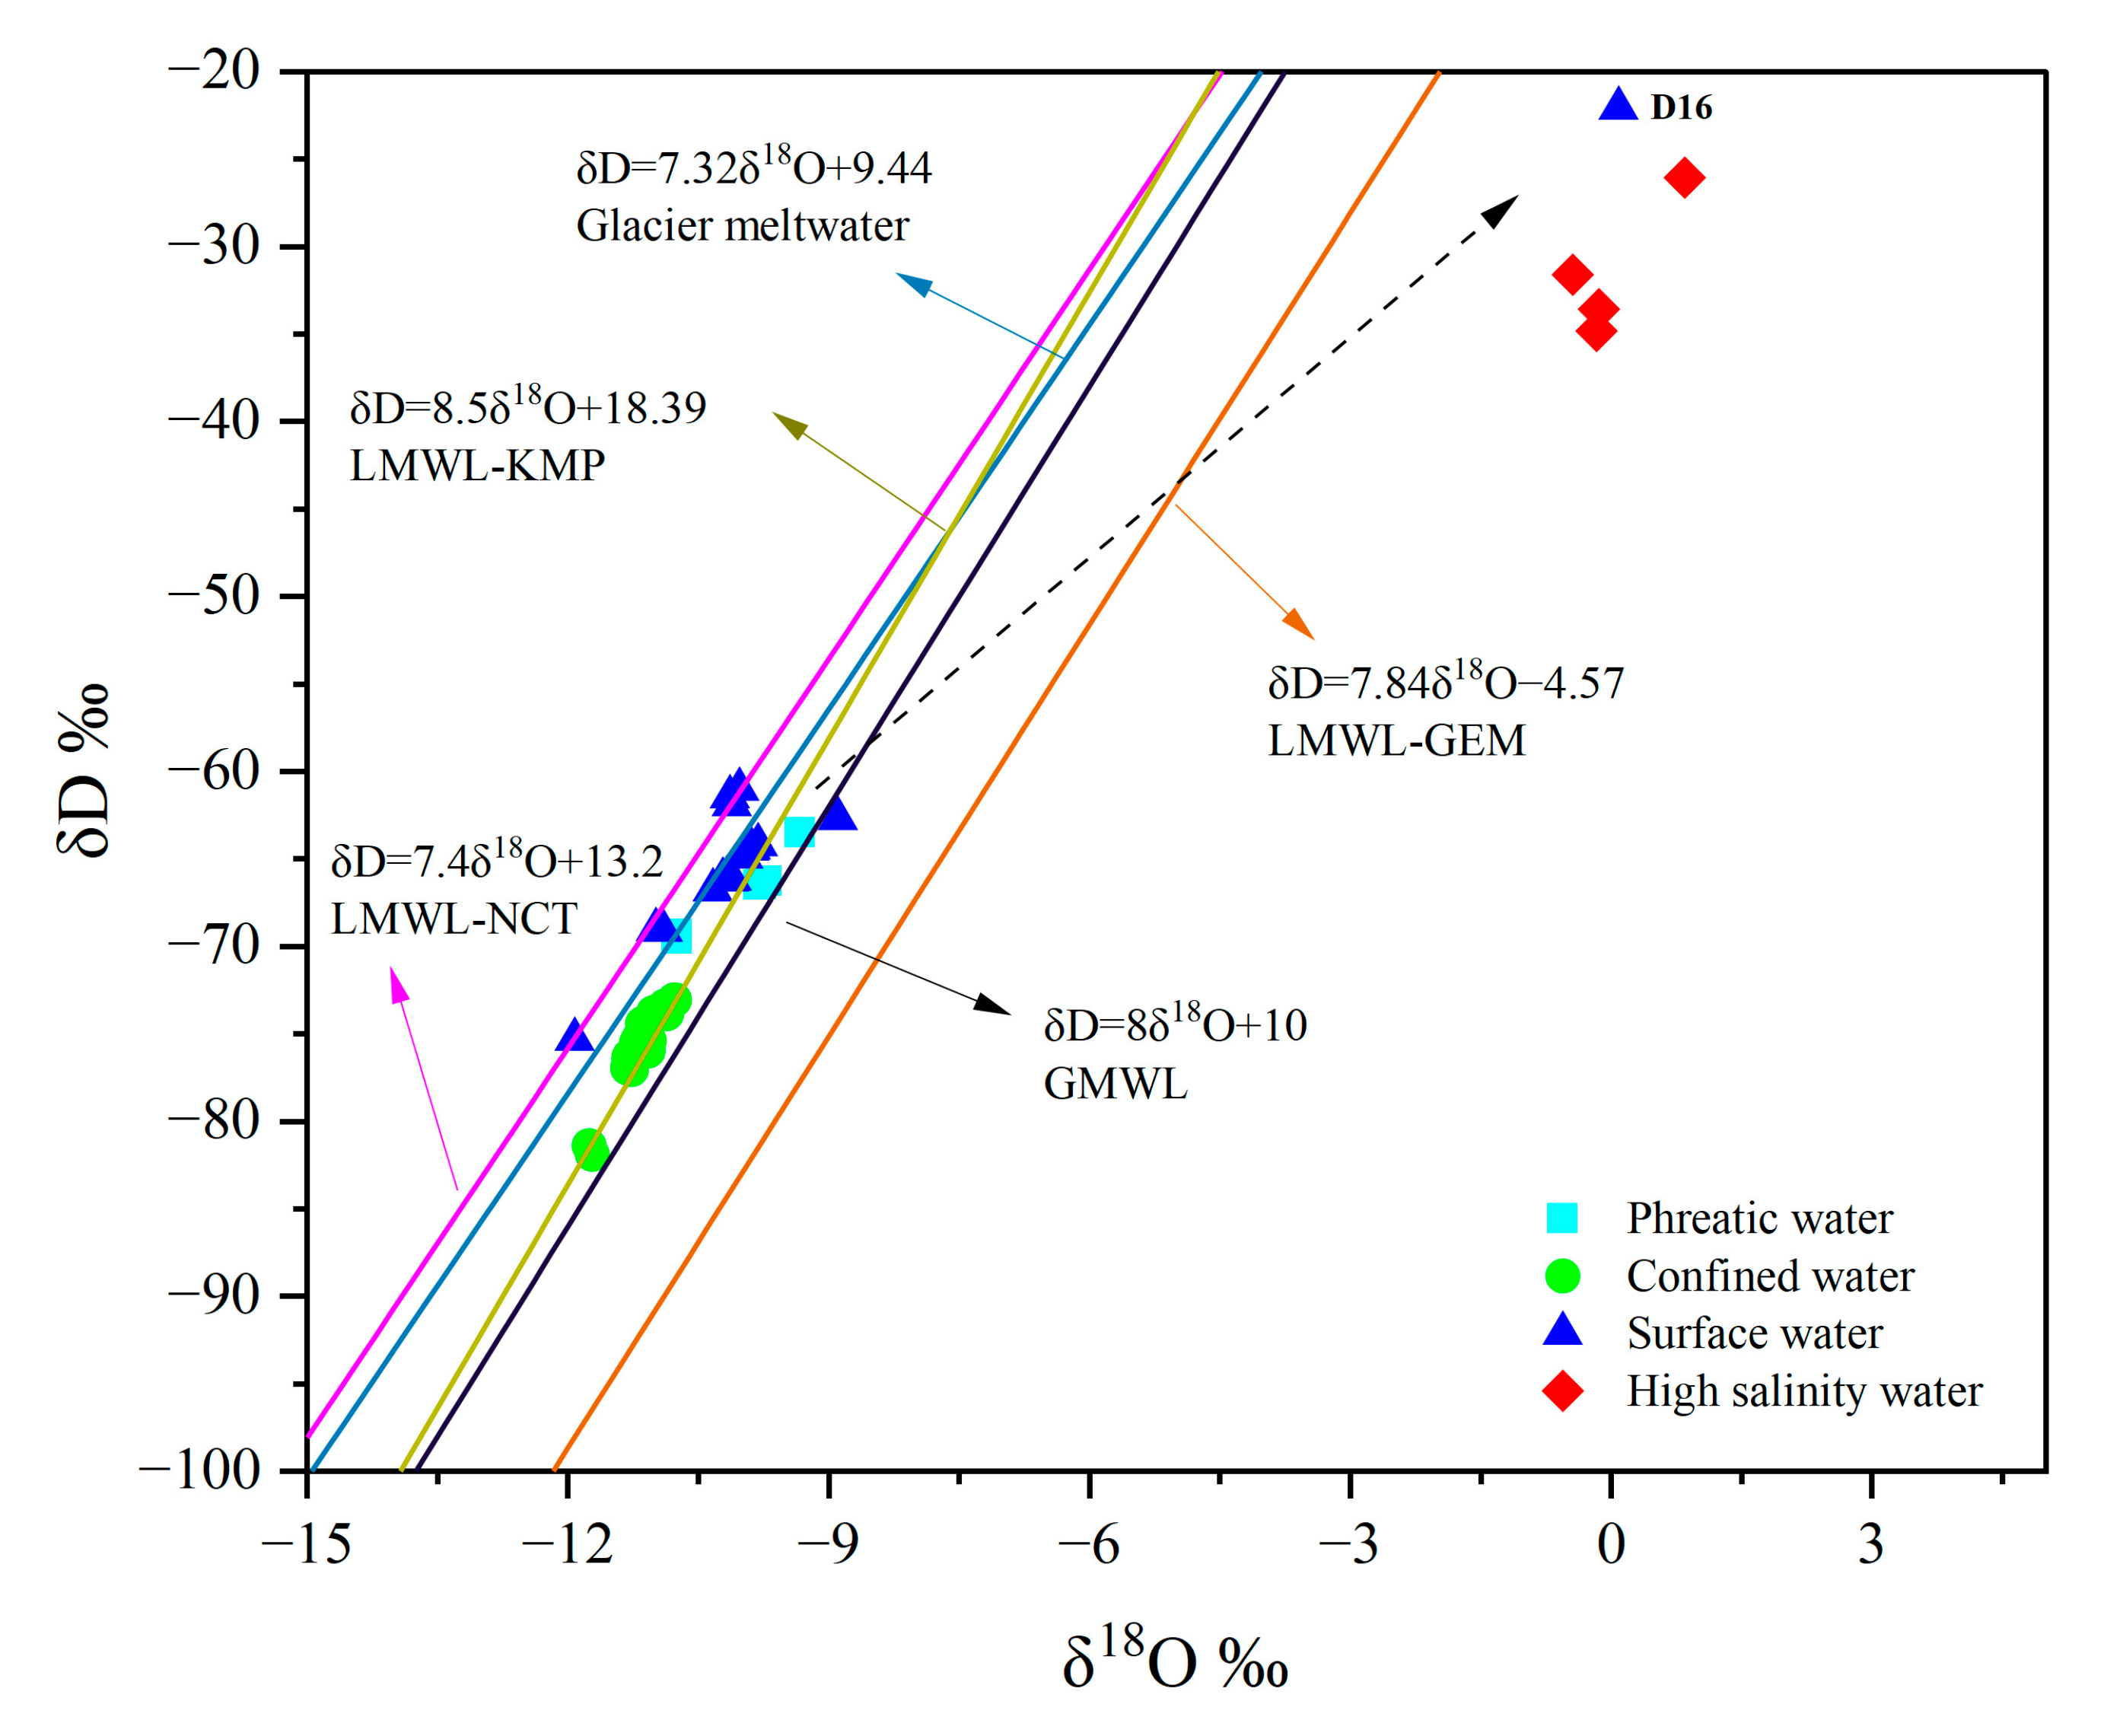
3.2. Hydrogen and Oxygen Isotopes

The relationship between stable hydrogen (D) and oxygen (18O) isotopes in groundwater and surface water can be used to identify groundwater recharge sources and the interactions between surface water and groundwater, thereby providing insights into the groundwater circulation and evolution processes [39]. In the study area, the δ18O and δD values of phreatic groundwater ranged from −10.74‰ to −9.32‰ and from −69.58‰ to −63.49‰, respectively. For groundwater in confined aquifers, δ18O values ranged from −11.76‰ to −10.78‰ and δD values from −81.88‰ to −73.05‰. In contrast, isotopic compositions of surface water ranged from of −11.92‰ to 0.09‰ in δ18O and from −75.31‰ to −22.11‰ in δD values (Figure 4). The δ18O and δD values of all samples deviated significantly from the local meteoric water line of the Golmud River watershed (LMWL-GEM, δD = 7.84δ18O−4.5) [40], indicating that precipitation in the study area was not the primary recharge source for either groundwater or surface water [17]. Most river water, phreatic groundwater, and confined groundwater samples were distributed close to the atmospheric precipitation lines of high-altitude meteorological stations, including the Kunlun Mountain Pass station (LMWL-KMP, δD = 8.5δ18O + 18.39, >4700 m above sea level [m a.s.l.]) and the Nachitai station (LMWL-NCT, δD = 7.4δ18O + 13.2, 3552 m a.s.l.), as well as the glacier meltwater line (δD = 7.32δ18O + 9.44) [41,42]. This distribution illustrates that groundwater is mainly recharged by high-altitude atmospheric precipitation and glacier/snow meltwater. Compared to phreatic groundwater, the δD and δ18O values of confined groundwater are more depleted and fall along the LMWL-KMP line, suggesting that the confined groundwater was recharged under colder climatic conditions, which led to lower isotopic values. In contrast, the isotopic signatures of river water and phreatic groundwater were closer to the glacier meltwater line, reflecting a significant contribution of glacier meltwater to river recharge [17]. The δD and δ18O values of phreatic groundwater were close to those of river water, indicating hydraulic connectivity between river and unconfined aquifer (Figure 4). The δ18O and δD values of high-salinity groundwater ranged from −0.44‰ to 0.85‰ and from −34.84‰ to −26.07‰, respectively, and deviated significantly from the local meteoric water line, suggesting that high-salinity groundwater was strongly affected by evaporation (Figure 4). In addition, there was a river sample (D16) which collected adjacent to the lake inlet, exhibiting enriched isotopic compositions similar to those of high-salinity groundwater, which was also attributed to strong surface evaporation and concentration processes.

3.3. Hydrochemical Evolution and Its Controlling Mechanisms

3.3.1. Shift from Water–Rock Interaction to Evaporation Dominance

The dissolution–precipitation of evaporites and carbonate minerals, as well as the weathering of silicate minerals, significantly influenced the hydrochemical composition of groundwater [43,44]. The controlling mechanisms of hydrochemical evolution were assessed using the Gibbs diagram to identify rock weathering, evaporation, and atmospheric precipitation dominance in hydrochemical formation and evolution. The results showed that both phreatic and confined groundwater were mainly controlled by water–rock interactions (Figure 5). The release of Ca2+ and Mg2+ through mineral dissolution led to low Na+/(Na++Ca2+) and Cl/(Cl+HCO3) ratios. In contrast, the hydrochemical composition of high-salinity groundwater was predominantly influenced by evaporation, resulting in elevated TDS levels and higher Na+/(Na++Ca2+) and Cl/(Cl+HCO3) ratios. Along the groundwater flow path, the dominant hydrochemical processes gradually shift from water–rock interaction to evaporation dominance [14]. A similar hydrochemical process and evolutionary trend was also observed in river water (Figure 5). Evaporation in both surface river water and groundwater promotes TDS accumulation. This process elevates the proportions of Na+ and Cl, leading to a higher Na+/(Na++Ca2+) and Cl/(Cl+HCO3) ratios.

3.3.2. Major Sources of Hydrochemical Constituents

Water–rock interaction governs hydrochemical evolution and the major hydrochemical components in groundwater are primarily derived from interactions with host aquifer minerals [45]. Mineral dissolution typically occurs alongside precipitation, with the directions and rates of these reactions governed by equilibrium constants [46]. Analysis of major ionic stoichiometry in groundwater serves as a well-established methodology for identifying dissolved substrate sources and reconstructing hydrochemical processes [47]. The results showed that Na++K+ and Cl generally distributed along the 1:1 line in low TDS samples, consistent with the observed corresponding ionic correlations, indicating that Na++K+ and Cl primarily originated from halite dissolution (Figure 6a). However, high-salinity groundwater deviated significantly from the 1:1 line, with Na++K+ concentrations much higher than those of Cl, suggesting the possible involvement of cation exchange or additional input sources such as the weathering of carbonate or silicate minerals. The relationships between (Ca2++Mg2+) and (SO42−+HCO3) are widely used to identify the dissolution and precipitation of sulfate and carbonate minerals [24]. Similar to the relationship observed in Figure 6a, most low TDS groundwater and river water were distributed near the 1:1 line in Figure 6b, indicating that Ca2+ and Mg2+ largely originated from the dissolution of sulfate and carbonate minerals. In contrast, the high-salinity groundwater samples deviated from the 1:1 line and exhibited substantial enrichment in Ca2+ and Mg2+, which may be attributed to cation exchange or weathering of other minerals such as silicates [6,7].
The dissolution–precipitation equilibria of silicate, carbonate, and evaporite minerals typically resulted in distinct characteristic ranges of Ca2+/Na+, Mg2+/Na+ and HCO3/ Na+ molar ratios in groundwater, which can be used to infer the dominant hydrochemical processes governing water–rock interactions [48]. High-salinity groundwater samples in the study area mainly plotted adjacent to the evaporite weathering and dissolution area (Figure 6c,d), indicating that evaporite minerals (e.g., halite and potash) played a dominant role in controlling the hydrochemical characteristics. Elevated Na+ and K+ concentrations during evaporite weathering resulted in lower Ca2+/Na+ and Mg2+/Na+ ratios. The result suggests a significant contribution of evaporite dissolution to the hydrochemistry of high-salinity groundwater. However, the relatively elevated Mg2+/Na+ ratios observed in high-salinity groundwater deviated from the typical evaporite dissolution signature, suggesting Mg2+ and Na+ concentrations were modulated by additional processes requiring further discrimination (Figure 6d). Low TDS samples were mostly located between the silicate, carbonate, and evaporite endmembers, with a tendency toward the silicate weathering domain, indicating that their hydrochemical composition was influenced by multiple mineral sources, particularly by silicate weathering.

3.3.3. Silicate Mineral Equilibrium Diagram

The results as mentioned above suggested that silicate minerals exerted notable influences on the hydrochemical evolution in the Golmud River watershed. To further examine the role of silicate weathering, the activities among Ca2+/H+, Mg2+/H+, Na+/H+, K+/H+, and H4SiO4 were analyzed. These relationships provide insight into the equilibrium state of silicate minerals, thereby clarifying the impact of silicate weathering on hydrochemical evolution in the study area [49,50,51]. All groundwater samples in the study area fell to the left of the quartz equilibrium line, indicating that groundwater was undersaturated with respect to quartz and exhibited a tendency for further dissolution. This result reflects the relatively low concentration of dissolved SiO2 in groundwater. Under such conditions, additional soluble SiO2 may be released through the weathering and dissolution of silicate minerals. In the equilibrium diagrams of anorthite, K-feldspar, and albite and their secondary minerals, the surface water, phreatic groundwater, and confined groundwater samples were all located within the stability fields of gibbsite, kaolinite, and Na-montmorillonite (Figure 7a,c,d). This indicates that during the hydrochemical evolution of the groundwater flow path, anorthite, K-feldspar, and albite tend to dissolve, contributing to the formation of corresponding secondary minerals [48]. In the chlorite equilibrium diagram, almost all groundwater samples were located within the stability range of chlorite, while only a few fell into the gibbsite field, indicating a state of equilibrium between chlorite and groundwater (Figure 7b). High-salinity groundwater exhibited relatively low concentrations of dissolved SiO2. Due to elevated TDS and low pH, these samples consistently fell within the equilibrium fields of aluminosilicate minerals relative to groundwater (Figure 7), which reflects that related aluminosilicate minerals existed in the study area are generally in a state of equilibrium and, thus, exert limited influences on hydrochemical evolution in the high-salinity groundwater of the study area.

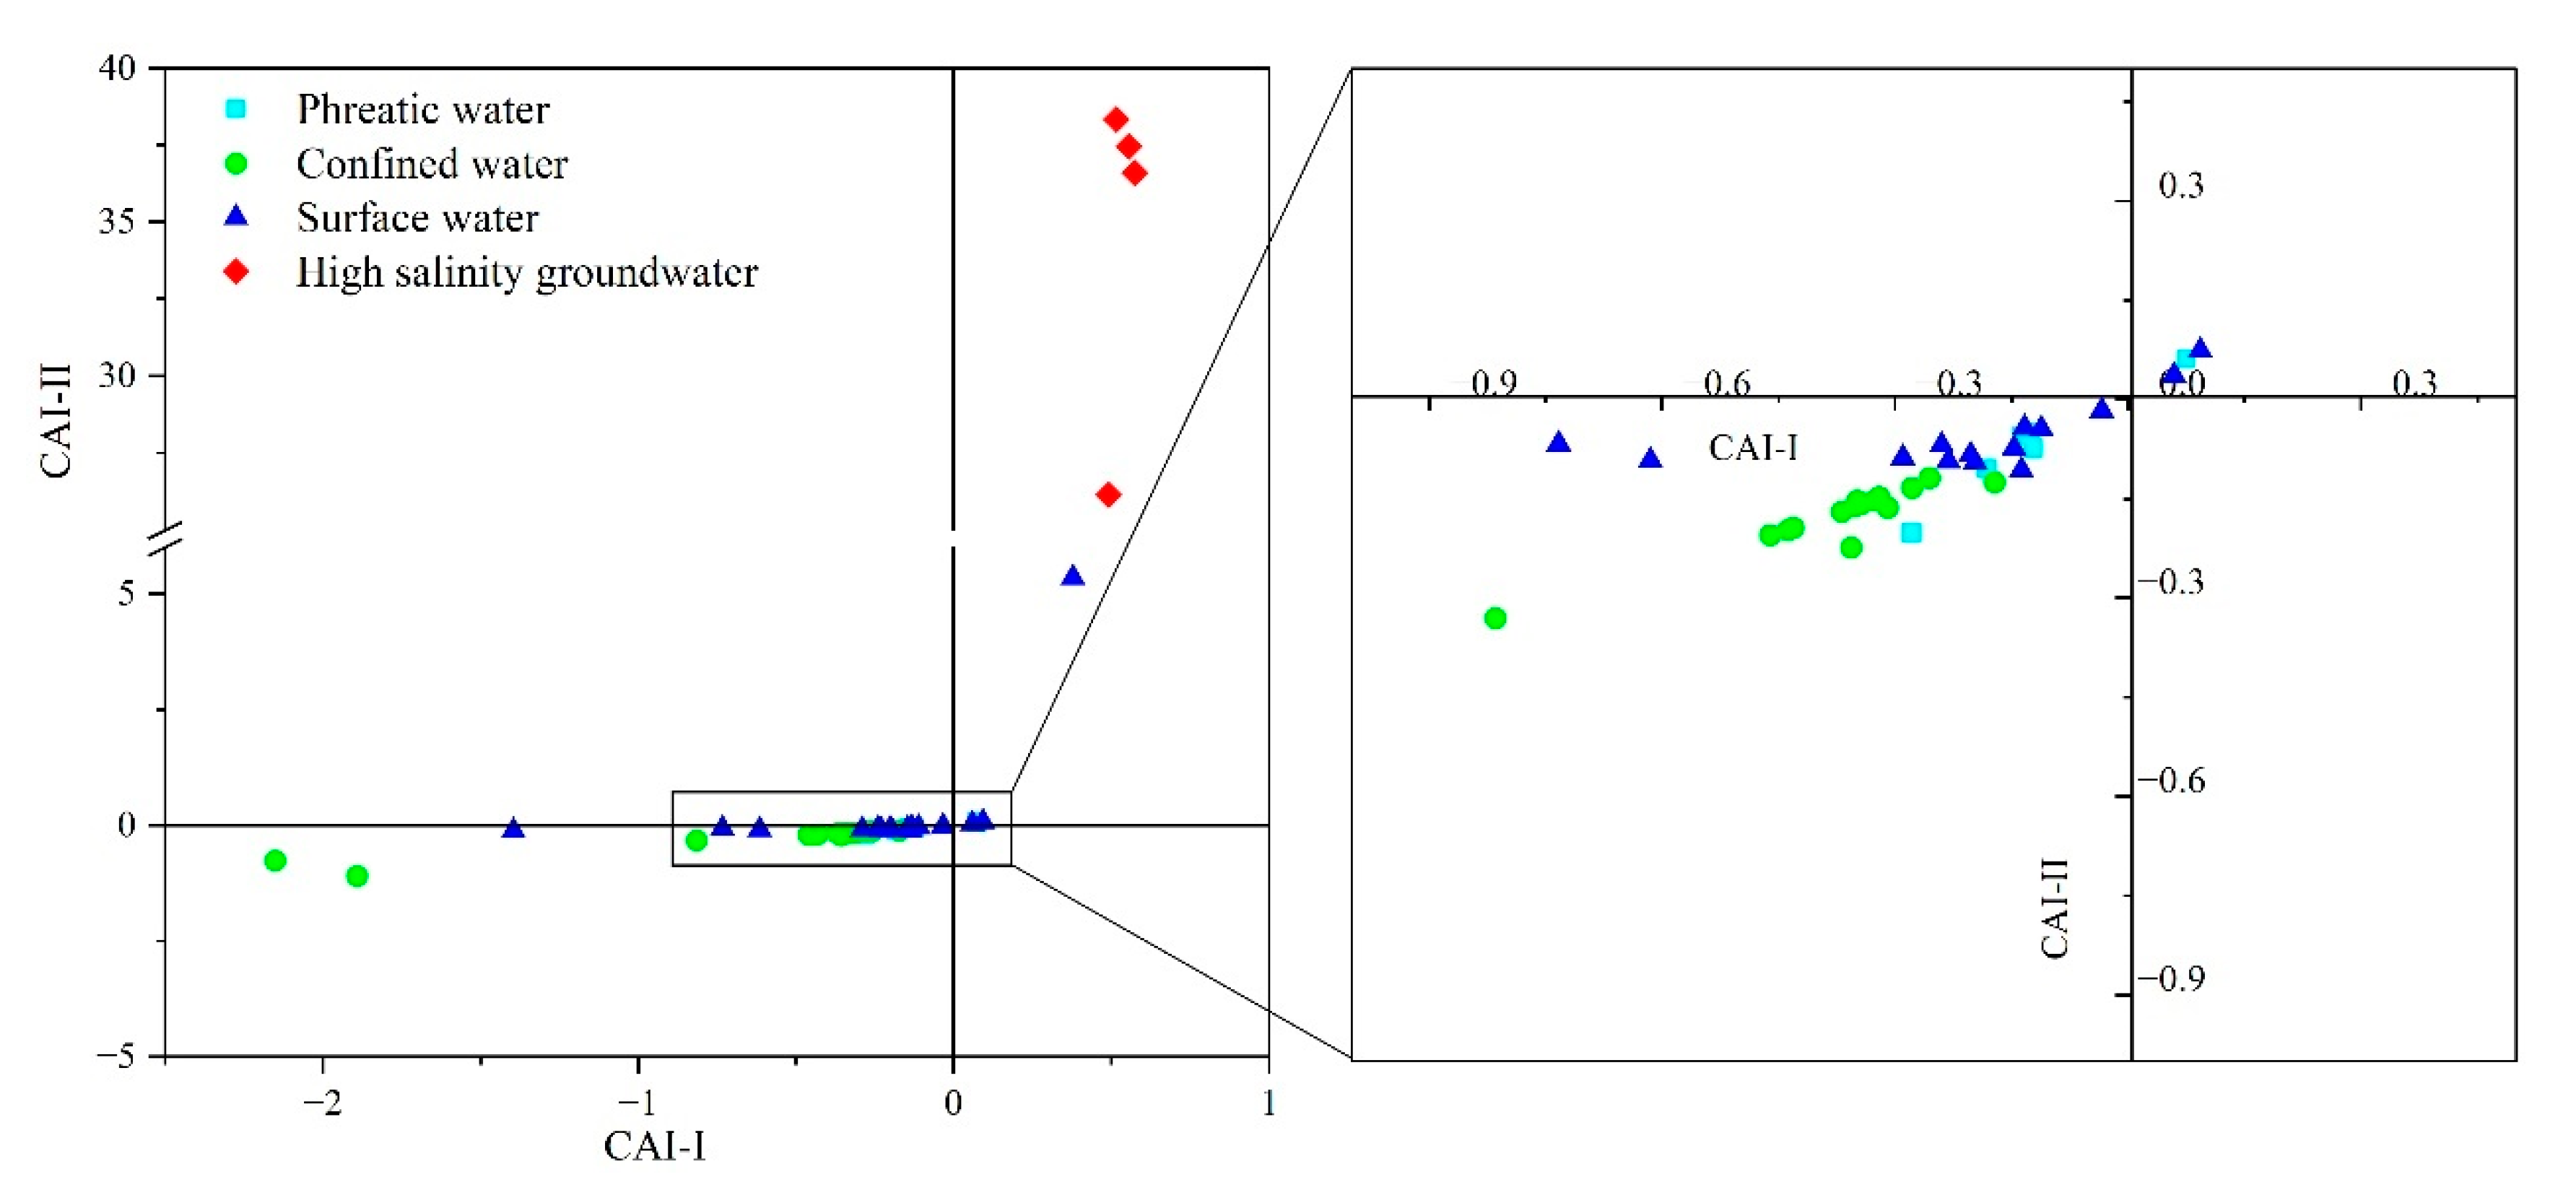
3.3.4. Cation Exchange in the Groundwater Flow System

In the study area, some hydrochemical anomalies could not be fully explained by mineral dissolution–precipitation and evaporation processes or silicate mineral equilibrium states. A notable example is the enrichment of Mg2+ ratios in high-salinity groundwater. According to the previous results, we propose that cation exchange has exerted a significant influence on hydrochemical evolution. This study employed chlor-alkaline indices (CAI-I and CAI-II) to evaluate the occurrence of cation exchange processes in groundwater [28,46]. The results showed that the CAI-I and CAI-II values of river water and phreatic groundwater samples clustered together with near zero values, suggesting a negligible cation exchange process in these hydrological compartments (Figure 8). Further, confined groundwater samples located in the third quadrant showed negative CAI values. This trend suggests an increase in Na+ and K+ relative to Cl, implying that the replacement of Na+ and K+ in the aquifer medium by dissolved Ca2+ and Mg2+ occurred in the confined aquifer, ultimately leading to the enrichment of Na+ and K+ in confined groundwater. High-salinity groundwater samples were plotted in the first quadrant with positive CAI values, indicating a profoundly reverse cation exchange process, where dissolved Na+ and K+ exchange mineral-bound Ca2+ and Mg2+ in aquifer medium. It is noteworthy that, due to the limited solubility of carbonate minerals, the reverse exchange in high-salinity groundwater does not result in a substantial release of Ca2+., in line with the hydrochemical dataset. Instead, Mg2+ is predominantly exchanged and released into groundwater, which explains the continuous increase in Mg2+ concentrations while Ca2+ remains relatively stable in high-salinity groundwater.

3.4. Inverse Hydrochemical Modeling

The preceding results qualitatively delineated the hydrochemical variations and their controlling mechanisms in the Golmud River watershed. However, the accuracy of these interpretations lacked validation through quantitative simulations. To address this limitation, representative groundwater flow paths were selected for inverse hydrochemical modeling based on the regional groundwater flow system. The simulation route included Q3-Q5, C1-C3, C5-C11, and C11-G3 to capture the evolution from phreatic groundwater to high-salinity groundwater. The modeling framework identified dominant water–rock interactions during hydrochemical evolution by tracking hydrochemical variations along the groundwater flow path.

3.4.1. Possible Mineral Phases and Constraints

Considering the aforementioned results and lithological features of the Golmud River watershed, silicates, evaporites, and carbonates represent the dominant mineral assemblages in the study area [52]. The saturation indices (SI) of representative minerals were calculated using Phreeqc to assess their potential dissolution and precipitation equilibrium states (Figure 9). The SI values of gypsum ranged from −6 to −2, indicating that it was undersaturated and tended to dissolve in groundwater. Calcite and quartz showed SI values between −2 and 2, suggesting near-saturation and a dynamic equilibrium between precipitation and dissolution. Dolomite exhibited SI values of 4 and 6, reflecting a supersaturated state and a tendency to precipitate. Albite and K-feldspar had negative SI values, indicating undersaturation to near-saturation states. Combined with the earlier results of silicate mineral equilibrium state (Figure 7), albite and K-feldspar were inferred to dissolve in groundwater. In all, the selected mineral phases for inverse hydrochemical modeling include gypsum, dolomite, calcite, halite, K-feldspar, albite, and quartz. The effect of carbonate equilibrium CO2 (g) on hydrochemical evolution is also considered, reflecting its role in regulating dissolution–precipitation equilibrium along the groundwater flow path [53].
Previous results have shown that water–rock interactions and evaporation concentration, with additional influence from processes such as cation exchange, primarily control hydrochemical evolution [54,55]. Based on these findings, the potential mineral-groundwater reactions were selected accordingly (Table 2).

3.4.2. Results of Inverse Modeling

Due to the non-uniqueness solutions of inverse hydrochemical modeling, the optimal solution requires a comprehensive consideration of the hydrogeological conditions, saturation indices, and hydrochemical analysis of the study area. The results of the mass balance simulation are listed below (Table 3).
In the phreatic aquifer of the piedmont alluvial fan, hydrochemical evolution was primarily driven by the dissolution of calcite (0.348 mmol/L) and halite (0.645 mmol/L) and the precipitation of dolomite (−0.182 mmol/L), coupled with minor dissolution of sylvite (0.004 mmol/L) and CO2 (0.023 mmol/L). The dissolution of calcite, halite, and potash minerals served as the dominant mechanism in shaping the hydrochemical characteristics of phreatic groundwater. Continuous input of Ca2+ led to a small amount of dolomite precipitation. Meanwhile, cation exchange between dissolved Ca2+ and mineral-bound Na+ limited Ca2+ concentrations in groundwater. These processes collectively explained the deviation of phreatic groundwater from the 1:1 stoichiometric line of (Ca2++Mg2+) and (SO42−+HCO3) towards the anion-dominant side (Figure 6b).
In the transitional zone from the piedmont alluvial fan to the upper part of the alluvial-lacustrine plain, changes in aquifer composition and structure led to the shift from phreatic to confined groundwater. The confined groundwater along the C1–C3 modeling path was primarily influenced by the dissolution of calcite (0.478 mmol/L), gypsum (0.059 mmol/L), halite (0.144 mmol/L), and sylvite (0.031 mmol/L). Due to the intrinsic features of confined aquifer, increased CO2 dissolution enhanced the weathering of silicate minerals such as K-feldspar (0.015 mmol/L). The formation of kaolinite (−0.008 mmol/L) from K-feldspar dissolution is consistent with the results of the silicate equilibrium state (Figure 7c). The alluvial-lacustrine plain was the main distribution zone of confined groundwater in the study area, particularly for artesian groundwater. Followed the modeling path from C5 to C11, the hydrochemical processes were generally similar to those observed upstream (C1–C3), including the dissolution of calcite (2.508 mmol/L), gypsum (0.415 mmol/L), halite (2.508 mmol/L), and albite (0.01 mmol/L) and the precipitation of dolomite (−0.716 mmol/L). Throughout the hydrochemical evolution of the confined aquifer, a continuous cation exchange process, where dissolved Ca2+ replaced mineral-bound Na+, modified the spatial distribution of Ca2+, Na+, and Mg2+, serving as an important mechanism that constrains hydrochemical evolution [56].
C11-G3 was chosen to simulate and quantify the hydrochemical evolutionary process from confined groundwater to high-salinity groundwater. The modeling results suggested that the initial groundwater sample (C11) would need to undergo a 32.7-fold concentration to reproduce the hydrochemical characteristics observed in the high-salinity groundwater at the terminal point, confirming that evaporation concentration is the dominant process controlling the formation of high-salinity groundwater. The dissolution of gypsum (0.514 mmol/L), halite (222.263 mmol/L), and sylvite (5.768 mmol/L) was the primary source of dissolved ions during the modeling path. This model also revealed an intense reversed cation exchange process, wherein dissolved Na+ in groundwater exchanges mineral-bound Mg2+ and Ca2+ in aquifer minerals. However, due to the limited solubility of carbonate minerals, the exchange primarily involves Na+ replacing Mg2+, which supports the observed increase in Mg2+ concentrations from confined to high-salinity groundwater (stage 2). The substantial precipitation of H2O in the simulation corresponds to water loss caused by evaporation.
Based on the modeling results, mass balance equations (in mmol/L) were obtained for each modeling path.
Q3 + 0.348 Calcite + 0.646 Halite + 0.004 Sylvite + 0.790 NaX + 0.023 CO2 (g) − 0.185 Dolomite − 0.002 Fluorite − 0.395 CaX2 = Q5
C1 + 0.059 Gypsum + 0.478 Calcite + 0.144 Halite + 0.031 Sylvite + 0.01 K-Feldspar + 1.197 NaX + 0.144 MgX2 + 0.523 CO2 (g) − 0.002Fluorite − 0.008 kaolinite = C3
C5 + 0.415 Gypsum + 2.508 Calcite + 0.585 Halite + 0.01 Albite + 5.727 NaX +2.090 CO2 (g) − 0.716 Dolomite − 0.005 K-Feldspar − 0.002 kaolinite − 2.864 CaX2 = C11
C11 + 0.514 Gypsum + 222.263 Halite + 5.768 Sylvite + 2.249 CaX2 + 65.046 MgX2 − 134.557 NaX = G3/32.7

4. Conclusions

This study integrated hydrochemical analysis, hydrogen and oxygen isotopes, and inverse hydrochemical modeling to investigate hydrochemical evolution in a typical arid endorheic watershed from the Qaidam Basin, northwestern China. The δD and δ18O values indicated that the primary recharge sources of groundwater are from high-altitude atmospheric precipitation and glacier/snowmelt. Regionally, groundwater types evolved from HCO3·Cl-Ca·Mg·Na types in phreatic aquifers to HCO3·Cl-Ca·Mg Na and HCO3·Cl-Na Mg types in confined aquifers, with terminal high-salinity groundwater dominated by Cl-Mg·Na type, characterized by progressive TDS enrichment along the groundwater flow path. The hydrochemical evolution of regional groundwater in the Golmud River watershed is predominantly controlled by water–rock interactions and evaporation concentration processes, with the dominant mechanism shifting from water–rock interaction to evaporation concentration along the groundwater flow path. The dissolution of halite, gypsum, calcite, K-feldspar, and albite provided the primary source of dissolved components in shaping hydrochemical characteristics. Additionally, precipitation dissolution equilibrium, cation exchange, and carbonate equilibrium influenced hydrochemical evolution. Inverse hydrochemical modeling confirmed the findings of the hydrochemical analysis and further demonstrated that high-salinity groundwater has experienced intense evaporation concentration. The enrichment of Mg2+ in high-salinity groundwater was mainly attributed to reverse cation exchange, highlighting that hydrochemical evolution processes in the Golmud River watershed act as a major driving force for regional geochemical cycling. The study area hosts abundant strategic mineral resources (e.g., Li, K). Integrating the multidisciplinary approaches employed at the present study, future investigations could elucidate mineral transport processes and enrichment mechanisms from a hydrochemical evolution perspective, providing a theoretical basis for understanding hydrochemical metallogenic processes.

Author Contributions

Conceptualization, L.G., W.J. and N.Y.; Data curation, Y.D.; Formal analysis, Y.D., H.F. and C.A.; Funding acquisition, L.G. and N.Y.; Investigation, L.G. and N.Y.; Methodology, C.A.; Project administration, L.G.; Software, Y.D. and H.F.; Supervision, W.J. and N.Y.; Validation, L.G. and C.A.; Visualization, H.F.; Writing—original draft, L.G. and Y.D.; Writing—review and editing, L.G., W.J. and N.Y. All authors have read and agreed to the published version of the manuscript.

Funding

This work was financially supported by grants from the National Natural Science Foundation of China (42107101), the China Postdoctoral Science Foundation (2022MD723822), and the Natural Science Basic Research Program of Shaanxi Province (2023-JC-QN-0317).

Data Availability Statement

The data presented in this study are available on request from the corresponding author due to their complexity and ongoing use in further analyses.

Acknowledgments

We sincerely thank Guangcai Wang and Hairu Mao for the valuable discussion and Xinming Song, Luoyao Xiong, Chenyu Wang for their assistance during the field investigation and sampling collection.

Conflicts of Interest

The authors declare that the research was conducted without any commercial or financial relationships that could be construed as potential conflicts of interest.

References

  1. Kuang, X.; Liu, J.; Scanlon, B.R.; Jiao, J.J.; Jasechko, S.; Lancia, M.; Biskaborn, B.K.; Wada, Y.; Li, H.; Zeng, Z.; et al. The Changing Nature of Groundwater in the Global Water Cycle. Science 2024, 383, eadf0630. [Google Scholar] [CrossRef] [PubMed]
  2. Scanlon, B.R.; Fakhreddine, S.; Rateb, A.; de Graaf, I.; Famiglietti, J.; Gleeson, T.; Grafton, R.Q.; Jobbagy, E.; Kebede, S.; Kolusu, S.R.; et al. Global Water Resources and the Role of Groundwater in a Resilient Water Future. Nat. Rev. Earth Environ. 2023, 4, 87–101. [Google Scholar] [CrossRef]
  3. Elango, L.; Kannan, R. Rock–Water Interaction and Its Control on Chemical Composition of Groundwater. Dev. Environ. Sci. 2007, 5, 229–243. [Google Scholar]
  4. Yuan, R.; Li, Z.; Guo, S. Hydrochemical evolution of groundwater in a river corridor: The compounded impacts of various environmental factors. Discov. Water 2024, 4, 32. [Google Scholar] [CrossRef]
  5. Hou, Z.; Huang, L.; Zhang, S.; Han, X.; Xu, J.; Li, Y. Identification of Groundwater Hydrogeochemistry and the Hydraulic Connections of Aquifers in a Complex Coal Mine. J. Hydrol. 2024, 628, 130496. [Google Scholar] [CrossRef]
  6. Li, P.; Qian, H.; Wu, J.; Zhang, Y.; Zhang, H. Major Ion Chemistry of Shallow Groundwater in the Dongsheng Coalfield, Ordos Basin, China. Int. J. Mine Water 2013, 32, 195–206. [Google Scholar] [CrossRef]
  7. Zhang, B.; Zhao, D.; Zhou, P.; Qu, S.; Liao, F.; Wang, G. Hydrochemical Characteristics of Groundwater and Dominant Water–Rock Interactions in the Delingha Area, Qaidam Basin, Northwest China. Water 2020, 12, 836. [Google Scholar] [CrossRef]
  8. Ma, B.; Jin, M.; Liang, X.; Li, J. Groundwater Mixing and Mineralization Processes in a Mountain–Oasis–Desert Basin, Northwest China: Hydrogeochemistry and Environmental Tracer Indicators. Hydrogeol. J. 2018, 26, 233–250. [Google Scholar] [CrossRef]
  9. Yang, N.; Zhou, P.; Wang, G.; Zhang, B.; Shi, Z.; Liao, F.; Li, B.; Chen, X.; Guo, L.; Dang, X.; et al. Hydrochemical and Isotopic Interpretation of Interactions between Surface Water and Groundwater in Delingha, Northwest China. J. Hydrol. 2021, 598, 126243. [Google Scholar] [CrossRef]
  10. Mao, H.; Wang, C.; Shen, Q.; Fu, L.; Wang, G.; Shi, Z. Source and Evolution of Sulfate in the Multi-Layer Groundwater System in an Abandoned Mine—Insight from Stable Isotopes and Bayesian Isotope Mixing Model. Sci. Total Environ. 2023, 859, 160368. [Google Scholar] [CrossRef]
  11. Belkhiri, L.; Boudoukha, A.; Mouni, L.; Baouz, T. Application of Multivariate Statistical Methods and Inverse Geochemical Modeling for Characterization of Groundwater—A Case Study: Ain Azel Plain (Algeria). Geoderma 2010, 159, 390–398. [Google Scholar] [CrossRef]
  12. Plummer, L.N.; Parkhurst, D.L. Application of the Pitzer Equations to the PHREEQE Geochemical Model. In Chemical Modeling of Aqueous Systems II; Chapter 10; ACS: Washington, DC, USA, 1990; pp. 128–137. [Google Scholar]
  13. Sun, Y.; Wang, Y.; Zhang, W.; Ye, S. Regional water resources carrying capacity in China based on analytic hierarchy process and system dynamics model: A case study of Golmud City. Front. Environ. Sci. 2024, 12, 1450747. [Google Scholar] [CrossRef]
  14. Xiao, Y.; Shao, J.; Frare, S.; Cui, Y.; Dang, X.; Wang, S.; Ji, Y. Groundwater Origin, Flow Regime and Geochemical Evolution in Arid Endorheic Watersheds: A Case Study from the Qaidam Basin, Northwestern China. Hydrol. Earth Syst. Sci. 2018, 22, 4381–4400. [Google Scholar] [CrossRef]
  15. Xiao, Y.; Liu, K.; Yan, H.; Zhou, B.; Huang, X.; Hao, Q.; Zhang, Y.; Zhang, Y.; Liao, X.; Yin, S. Hydrogeochemical Constraints on Groundwater Resource Sustainable Development in the Arid Golmud Alluvial Fan Plain on Tibetan Plateau. Environ. Earth Sci. 2021, 80, 750. [Google Scholar] [CrossRef]
  16. Guo, L.; Wang, G.; Sheng, Y.; Shi, Z.; Sun, X. Groundwater Microbial Communities and Their Connection to Hydrochemical Environment in Golmud, Northwest China. Sci. Total Environ. 2019, 695, 133848. [Google Scholar] [CrossRef]
  17. Yang, N.; Wang, G.; Hou, E.; Guo, L.; Xiong, L.; Song, X. Triple Isotopes (δD, δ18O, δ17O) Characteristic of River Water and Groundwater in an Arid Watershed from Qaidam Basin, Northwestern China: Implications for Hydrological Cycle. Sci. Total Environ. 2024, 927, 172229. [Google Scholar] [CrossRef] [PubMed]
  18. Xiao, Y.; Liu, K.; Zhang, Y.; Yang, H.; Wang, S.; Qi, Z.; Hao, Q.; Wang, L.; Luo, Y.; Yin, S. Numerical Investigation of Groundwater Flow Systems and Their Evolution Due to Climate Change in the Arid Golmud River Watershed on the Tibetan Plateau. Front. Earth Sci. 2022, 10, 943075. [Google Scholar] [CrossRef]
  19. Yi, L.; Chen, F.; Han, J.; Liu, X.; Yang, J.; Zhou, Z.; Lu, X.; Ma, Z.; Wei, H.; Han, F. SWAT-based Distributed Hydrologic Simulation and Runoff Prediction in the Upper Golmud River Watershed. Int. J. Sediment Res. 2024, 32, 509. [Google Scholar] [CrossRef]
  20. Hou, W.; Li, X.; Yang, L.; Ta, W.; Jia, X. Carrying Capacity of Water Resources for Renewable Energy Development in Arid Regions in Northwest China: A Case Study of Golmud, Qinghai. Front. Environ. Sci. 2022, 10, 892414. [Google Scholar] [CrossRef]
  21. Jiang, W.; Sheng, Y.; Shi, Z.; Guo, H.; Chen, X.; Mao, H.; Liu, F.; Ning, H.; Liu, N.; Wang, G. Hydrogeochemical Characteristics and Evolution of Formation Water in the Continental Sedimentary Basin: A Case Study in the Qaidam Basin, China. Sci. Total Environ. 2024, 957, 177672. [Google Scholar] [CrossRef]
  22. Wang, J.; Huang, J.; Fang, T.; Song, G.; Sun, F. Relationship of Underground Water Level and Climate in Northwest China’s Inland Basins under the Global Climate Change: Taking the Golmud River Catchment as an Example. China Geol. 2021, 4, 402–409. [Google Scholar] [CrossRef]
  23. Hu, X.; Sun, Q.; Huang, J.; Geng, J.; Wang, J. Pore Structure and Radon Emission Characteristics of Shallow Soil in the Golmud River Basin of the Qinghai–Tibet Plateau. Phys. Chem. Earth Parts A/B/C 2025, 139, 103911. [Google Scholar] [CrossRef]
  24. Guo, L.; Ding, Y.; Fang, H.; An, C.; Wang, G.; Mao, H.; Yang, N. Regional Variations and Hydrochemical Evolution in Golmud River Watershed (Qaidam Basin, China): An Integration of Self-Organizing Maps and Multi-Statistic Approaches. Environ. Earth Sci. 2025, 84, 143. [Google Scholar] [CrossRef]
  25. Wang, Y.; Jiao, J.J. Origin of Groundwater Salinity and Hydrogeochemical Processes in the Confined Quaternary Aquifer of the Pearl River Delta, China. J. Hydrol. 2012, 438–439, 112–124. [Google Scholar] [CrossRef]
  26. Piper, A.M. A Graphic Procedure in the Geochemical Interpretation of Water-analyses. Neurochem. Int. 1984, 6, 27–39. [Google Scholar]
  27. Gibbs, R.J. Mechanisms Controlling World Water Chemistry. Science 1970, 170, 1088–1090. [Google Scholar] [CrossRef]
  28. Huang, X.; Wang, G.; Liang, X.; Cui, L.; Ma, L.; Xu, Q. Hydrochemical and Stable Isotope (δD and δ18O) Characteristics of Groundwater and Hydrogeochemical Processes in the Ningtiaota Coalfield, Northwest China. Mine Water Environ. 2018, 37, 119–136. [Google Scholar] [CrossRef]
  29. Liu, Z.; Wang, X.; Wan, X.; Jia, S.; Mao, B. Evolution Origin Analysis and Health Risk Assessment of Groundwater Environment in a Typical Mining Area: Insights from Water-Rock Interaction and Anthropogenic Activities. Environ. Res. 2024, 252, 118792. [Google Scholar] [CrossRef]
  30. Yu, F.; Zhou, D.; Li, Z.; Li, X. Hydrochemical Characteristics and Hydrogeochemical Simulation Research of Groundwater in the Guohe River Basin (Henan Section). Water 2022, 14, 1461. [Google Scholar] [CrossRef]
  31. Dong, F.; Yin, H.; Cheng, W.; Li, Y.; Qiu, M.; Zhang, C.; Tang, R.; Xu, G.; Zhang, L. Study on Water Inrush Pattern of Ordovician Limestone in North China Coalfield Based on Hydrochemical Characteristics and Evolution Processes: A Case Study in Binhu and Wangchao Coal Mine of Shandong Province, China. J. Clean. Prod. 2022, 380, 134954. [Google Scholar] [CrossRef]
  32. Liu, J.; Hao, Y.; Gao, Z.; Wang, M.; Liu, M.; Wang, Z.; Wang, S. Determining the Factors Controlling the Chemical Composition of Groundwater Using Multivariate Statistics and Geochemical Methods in the Xiqu Coal Mine, North China. Environ. Earth Sci. 2019, 78, 364. [Google Scholar] [CrossRef]
  33. Lecomte, K.L.; Pasquini, A.I.; Depetris, P.J. Mineral Weathering in a Semiarid Mountain River: Its Assessment through PHREEQC Inverse Modeling. Aquat. Geochem. 2005, 11, 173–194. [Google Scholar] [CrossRef]
  34. Jia, Z.; Zang, H.; Hobbs, P.; Zheng, X.; Xu, Y.; Wang, K. Application of Inverse Modeling in a Study of the Hydrogeochemical Evolution of Karst Groundwater in the Jinci Spring Region, Northern China. Environ. Earth Sci. 2017, 76, 312. [Google Scholar] [CrossRef]
  35. Li, D.; Gan, S.; Li, J.; Dong, Z.; Long, Q.; Qiu, S.; Zhou, Y.; Lu, C. Hydrochemical Characteristics and Formation Mechanism of Strontium-Rich Groundwater in Shijiazhuang, North China Plain. J. Chem. 2021, 2021, 5547924. [Google Scholar] [CrossRef]
  36. Lindsey, B.D.; Belitz, K.; Cravotta, C.A.; Toccalino, P.L.; Dubrovsky, N.M. Lithium in Groundwater Used for Drinking-Water Supply in the United States. Sci. Total Environ. 2021, 767, 144691. [Google Scholar] [CrossRef]
  37. Qiu, Y.; Zhou, A.; Gao, L.; Wang, Z.; Hu, X.; Li, Y.; Zhang, F.; Ma, C. Cation Exchange and Leakage as Dominant Processes in Controlling Salinity and Strontium in Sandy and Argillaceous Coastal Aquifer: Insights from Hydrochemistry and Multi-Isotopes. J. Hydrol. 2024, 638, 131529. [Google Scholar] [CrossRef]
  38. Guo, W.; Zhang, D.; Zhang, W.; Li, S.; Pan, K.; Jiang, H.; Zhang, Q. Anthropogenic Impacts on the Nitrate Pollution in an Urban River: Insights from a Combination of Natural-Abundance and Paired Isotopes. J. Environ. Manag. 2023, 333, 117458. [Google Scholar] [CrossRef] [PubMed]
  39. Chung, C.H.; You, C.F.; Yeh, Y.L. Strontium Isotopes and Rare Earth Elements as Tracers of Water–Rock Interactions in Taiwan Hot Springs. Water 2024, 17, 71. [Google Scholar] [CrossRef]
  40. Zhu, J.; Chen, H.; Gong, G. Hydrogen and Oxygen Isotopic Compositions of Precipitation and Its Water Vapor Sources in Eastern Qaidam Basin. Huan Jing Ke Xue 2015, 36, 2784–2790. [Google Scholar]
  41. Yang, Y.; Wu, Q.; Jin, H. Evolutions of Water Stable Isotopes and the Contributions of Cryosphere to the Alpine River on the Tibetan Plateau. Environ. Earth Sci. 2016, 75, 49. [Google Scholar] [CrossRef]
  42. Rao, W.; Li, Y. Stable Hydrogen-Oxygen Isotope Composition and Atmospheric Moisture Sources of Precipitation in an Arid-Alpine Region: A Case Study of the Golmud River Watershed on the North Slope of the Kunlun. J. Hydraul. Eng. 2021, 52, 1116–1125. [Google Scholar]
  43. Xu, J.; Gui, H.; Chen, J.; Li, C.; Li, Y.; Zhao, C.; Guo, Y. Hydrogeochemical Characteristics and Formation Mechanisms of the Geothermal Water in the Qingdong Coal Mine, Northern Anhui Province, China. Mine Water Environ. 2022, 41, 1015–1026. [Google Scholar] [CrossRef]
  44. Hao, Q.; Li, Y.; Xiao, Y.; Yang, H.; Zhang, Y.; Wang, L.; Liu, K.; Liu, G.; Wang, J.; Hu, W.; et al. Hydrogeochemical Fingerprint, Driving Forces and Spatial Availability of Groundwater in a Coastal Plain, Southeast China. Urban Clim. 2023, 51, 101611. [Google Scholar] [CrossRef]
  45. Luo, A.; Wang, G.; Dong, S.; Wang, H.; Shi, Z.; Ji, Z.; Xue, J. Effect of Large-Scale Mining Drainage on Groundwater Hydrogeochemical Evolution in Semi-Arid and Arid Regions. Front. Environ. Sci. 2022, 10, 926866. [Google Scholar] [CrossRef]
  46. Li, P.; Wu, J.; Qian, H. Assessment of Groundwater Quality for Irrigation Purposes and Identification of Hydrogeochemical Evolution Mechanisms in Pengyang County, China. Environ. Earth Sci. 2013, 69, 2211–2225. [Google Scholar] [CrossRef]
  47. Chen, Z.; Zhou, X.; Du, J.; Xie, C.; Liu, L.; Li, Y.; Yi, L.; Liu, H.; Cui, Y. Hydrochemical Characteristics of Hot Spring Waters in the Kangding District Related to the Lushan MS Combining Double Low Line 7.0 Earthquake in Sichuan, China. Nat. Hazards Earth Syst. Sci. 2015, 15, 1149–1156. [Google Scholar] [CrossRef]
  48. Mao, H.; Wang, G.; Rao, Z.; Liao, F.; Shi, Z.; Huang, X.; Chen, X.; Yang, Y. Deciphering spatial pattern of groundwater chemistry and nitrogen pollution in Poyang Lake Basin (Eastern China) using self-organizing map and multivariate statistics. J. Clean. Prod. 2021, 329, 129697. [Google Scholar] [CrossRef]
  49. Xing, L.; Guo, H.; Zhan, Y. Groundwater Hydrochemical Characteristics and Processes along Flow Paths in the North China Plain. J. Asian Earth Sci. 2013, 70, 250–264. [Google Scholar] [CrossRef]
  50. Raju, N.J.; Patel, P.; Reddy, B.C.S.R.; Suresh, U.; Reddy, T.V.K. Identifying Source and Evaluation of Hydrogeochemical Processes in the Hard Rock Aquifer System: Geostatistical Analysis and Geochemical Modeling Techniques. Environ. Earth Sci. 2016, 75, 1157. [Google Scholar] [CrossRef]
  51. Werner, S.; Morgan, J.J. Aquatic Chemistry: Chemical Equilibria and Rates in Natural Waters, 3rd ed.; John Wiley & Sons, Inc.: Hoboken, NJ, USA, 1996. [Google Scholar]
  52. Xiao, L.; Wang, J.; Dang, Y.; Cheng, Z.; Huang, T.; Zhao, J.; Xu, Y.; Huang, J.; Xiao, Z.; Komatsu, G. A new terrestrial analogue site for Mars research: The Qaidam Basin, Tibetan Plateau (NW China). Earth Sci. Rev. 2017, 164, 84–101. [Google Scholar] [CrossRef]
  53. Gaillardet, J.; Dupré, B.; Louvat, P.; Allègre, C.J. Global Silicate Weathering and CO2 Consumption Rates Deduced from the Chemistry of Large Rivers. Chem. Geol. 1999, 159, 3–30. [Google Scholar] [CrossRef]
  54. Jiang, W.; Sheng, Y.; Wang, G.; Shi, Z.; Liu, F.; Zhang, J.; Chen, D. Cl, Br, B, Li, and noble gases isotopes to study the origin and evolution of deep groundwater in sedimentary basins: A review. Environ. Chem. Lett. 2022, 20, 1497–1528. [Google Scholar] [CrossRef]
  55. Stober, I.; Zhong, J.; Bucher, K. From freshwater inflows to salt lakes and salt deposits in the Qaidam Basin, W China. Swiss J. Geosci. 2023, 116, 5. [Google Scholar] [CrossRef]
  56. Möller, P.; De Lucia, M. The impact of Mg2+ ions on equilibration of Mg-Ca carbonates in groundwater and brines. Geochemistry 2020, 80, 125611. [Google Scholar] [CrossRef]
Figure 1. Topographical map of the Golmud River watershed and sampling locations along the groundwater flowpath.
Water 17 02074 g001
Figure 2. Correlation matrix of hydrochemical variables.
Water 17 02074 g002
Figure 3. Piper diagram showing the hydrochemical characteristics of the study area.
Water 17 02074 g003
Figure 4. Stable isotope composition (δD and δ18O) of phreatic, confined, and high-salinity groundwater, as well as the river water. Reference lines in the plot consist of the Global Meteoric Water Line (GMWL) and various Local Meteoric Water Lines (LMWLs).
Water 17 02074 g004
Figure 5. Gibbs diagram illustrates the controlling hydrochemical processes shifts in the study area. (a): TDS vs. Na+/(Na++Ca2+), (b): TDS vs. Cl/(Cl+HCO3).
Water 17 02074 g005
Figure 6. Scatter plot of hydrochemical variables and their ionic ratios. (a) Na++K+ vs. Cl, (b) Ca2+ + Mg2+ vs. HCO3 + SO42−, (c) HCO3/ Na+ vs. Ca2+/Na+, and (d) Mg2+/Na+ vs. Ca2+/Na+.
Water 17 02074 g006
Figure 7. Log activity diagrams of (a) CaO-Al2O3-SiO2-H2O, (b) MgO-Al2O3-SiO2-H2O, (c) K2O-Al2O3-SiO2-H2O, and (d) Na2O-Al2O3-SiO2-H2O versus H4SiO4, illustrating the thermodynamic stability fields of relevant silicate minerals and the chemical equilibrium states of different water types in relation to mineral dissolution or precipitation.
Water 17 02074 g007
Figure 8. Chlor-alkaline indices (CAI-I and CAI-II) of different water types, indicating ion exchange processes between groundwater and aquifer medium.
Water 17 02074 g008
Figure 9. Saturation index (SI) of potential minerals in the study area. The saturation index is characterized by a threshold value of 0 (SI > 0: supersaturation; SI < 0: undersaturation; SI = 0: equilibrium).
Water 17 02074 g009
Table 1. Groundwater hydrochemical parameters in the Golmud River watershed.
VariablesPhreatic WaterConfined WaterHigh-Salinity WaterSurface Water
MaximumMinimumAverageMaximumMinimumAverageMaximumMinimumAverageMaximumMinimumAverage
pH8.377.618.058.577.448.056.666.556.609.358.198.48
DO56.8033.3043.4263.306.0026.94///77.5044.7053.17
ORP245.00207.00208.00201.00−234−3.76///249.00149.00209.92
Alkalinity198.00168.00185.17311.90173.00211.70263.00178.00217.75217.0097.10159.57
TDS755.03420.59522.991048.00391.36500.34302,909.31290,478.31295,928.8514,247.12230.191201.58
Na122.0054.5086.28374.0864.80105.0061,385.0051,087.0053,878.503338.0014.20250.56
K5.383.014.326.992.685.5116,739.002969.007238.75200.001.8015.66
Ca68.3038.7051.9773.004.9336.802804.001052.001619.25196.0033.9050.79
Mg54.7030.6037.6742.207.7732.4339,785.0034,250.0036,763.501186.0015.8097.84
Cl209.0077.20123.77200.5679.70102.63194,240.00189,970.00192,451.258573.0013.70594.19
SO4188.0073.30102.27139.9662.6078.974655.003336.003840.25641.0021.3092.76
CO30.000.000.009.360.001.070.000.000.0058.600.004.71
HCO3241.00205.00225.50404.77211.00258.46320.00218.00265.75264.00108.00184.94
NO34.873.564.334.770.002.7247.1030.9040.904.291.472.92
F0.390.280.322.340.440.795.313.854.480.520.100.24
Li0.070.040.060.060.020.0466.481.7645.0459.710.024.02
Si3.853.243.467.104.095.580.560.430.512.830.392.09
Sr1.240.690.901.060.430.8533.923.0421.1036.130.283.10
HSiO39.589.469.5320.1011.5015.309.937.448.868.716.617.32
Note: “/” represents data not available.
Table 2. Chemical reaction of possible minerals in the groundwater flow system.
Mineral PhaseChemical FormulaChemical Reaction
CalciteCaCO3CaCO3 ⇌ Ca2+ + CO32−
GypsumCaSO4·2H2OCaSO4·2H2O ⇌ Ca2+ + SO42− + 2H2O
QuartzSiO2SiO2 + 2H2O ⇌ H4SiO4
DolomiteCaMg (CO3)2CaMg (CO3)2 ⇌ Ca2+ + Mg2+ + 2CO32−
HaliteNaClNaCl → Na+ + Cl
SylviteKClKCl → K+ + Cl-
AlbiteNaAlSi3O8NaAlSi3O8 + 8H2O ⇌ Na+ + Al (OH)4− + 3H4SiO4
K-feldspar2KAlSi3O82KAlSi3O8 + 11H2O + 2CO2 ⇌ 2K+ + 2HCO3 + 4H4SiO4 + Al2Si2O5(OH)4
Cation exchangeCaX2Ca2+ + 2NaX ⇌ 2Na+ + CaX2
MgX2Mg2+ + 2NaX ⇌ 2Na+ + MgX
Table 3. Groundwater inverse simulation results (in mmol/L).
Modeling PathQ3-Q5C1-C3C5-C11C11-G3
Gypsum/0.05950.414916.81
Calcite0.34780.47832.508/
Quartz////
Dolomite−0.1852 −0.7159
Halite0.64550.14410.58517268
Sylvite0.00380.0311/188.6
Albite//0.0096/
K-Feldspar/0.0152−0.0053/
Fluorite−0.0023−0.0023//
kaolinite/−0.0076−0.0021/
CaX2−0.3949−0.7426−2.86473.53
NaX0.78991.1975.727−4400
MgX2/0.1442/2127
CO2 (g)0.02280.52262.09/
Note: /: data not available, +: dissolve, −: precipitation.
Disclaimer/Publisher’s Note: The statements, opinions and data contained in all publications are solely those of the individual author(s) and contributor(s) and not of MDPI and/or the editor(s). MDPI and/or the editor(s) disclaim responsibility for any injury to people or property resulting from any ideas, methods, instructions or products referred to in the content.

