1. Introduction
Imidazoles, a class of synthetic heterocyclic compounds characterized by a stable five-membered ring (three carbons and two nitrogens), are extensively utilized as broad-spectrum anthelmintic and antimicrobial agents in both veterinary and human medicine due to their high efficacy and low toxicity [
1]. These entirely human-made compounds do not occur naturally in the environment. The polar imidazole core confers enhanced water solubility and structural stability, contributing to their environmental persistence [
2]. These compounds are broadly subdivided into benzimidazoles (e.g., albendazole) and nitroimidazoles (e.g., metronidazole), each exhibiting distinct environmental behaviors. This behavioral divergence stems from fundamental molecular differences: while ben-zimidazoles typically undergo Phase I metabolic transformations (oxidation/hydrolysis), primarily mediated by cytochrome P450 enzymes in hepatic tissues and forming metabolite-based residue markers, nitroimidazoles persist largely as parent compounds owing to limited degradation pathways, attributed to the electron-withdrawing nitro group that stabilizes the imidazole ring against biotic and abiotic degradation [
3,
4]. The widespread dissemination of imidazoles into the environment through veterinary excretion [
5,
6,
7], agricultural runoff [
8], and incomplete wastewater treatment [
9,
10,
11] has resulted in trace-level contamination (ng·L
−1–ng·g
−1) in diverse environmental compartments. This raises growing concerns regarding their ecological impact, including multi-organ toxicity, antimicrobial resistance, and endocrine disruption [
12,
13,
14]. Asia dominates global veterinary pharmaceutical consumption, accounting for over 55% of antiparasitic drug sales according to international surveillance data [
15], which has led to increasing detection of these compounds in the environment as evidenced by recent studies [
16,
17,
18].
The environmental mobility of imidazoles necessitates multi-compartment monitoring. These contaminants do not remain confined to a single environmental medium. Instead, imidazoles exhibit dynamic transfer and transformation across interconnected compartments such as water, sediment, and soil. For example, compounds discharged into surface waters may adsorb onto suspended particles and be buried in sediment layers, while land-applied veterinary waste and agricultural runoff can introduce residues into soils, where leaching, volatilization, or microbial degradation may subsequently reintroduce them into aquatic systems. This inter-compartmental cycling not only prolongs environmental persistence but also amplifies ecological exposure pathways [
19]. Consequently, studies focusing exclusively on one or two environmental compartments provide an incomplete understanding of imidazole fate and transport, potentially underestimating their total environmental burden and associated risks. Therefore, to comprehensively assess the environmental fate, mobility, and risk of imidazoles, it is essential to develop analytical strategies that can reliably detect and quantify these compounds across all three major environmental sinks. This integrated approach overcomes the inherent limitations of single-medium studies by capturing the full cycle of inter-compartmental transfer. Notably, while the quantification of these compounds in aqueous environments has become relatively routine, their accurate determination in complex matrices such as sediments and soils remains highly challenging. Matrix–analyte interactions often reduce extraction efficiency, while co-eluting organic and inorganic constituents can suppress ionization during mass spectrometric detection [
20,
21]. These analytical interferences frequently compromise sensitivity and reliability, underscoring the need for improved methods that can adapt to matrix-specific complexities.
Current extraction approaches for solid matrices (e.g., sediments and soils) predominantly rely on liquid–solid extraction (LSE) or solid-phase microextraction (SPME) [
22,
23], often enhanced by auxiliary techniques such as ultrasonication [
24,
25] or microwave irradiation [
26]. Various extraction solvents—methanol, acetonitrile, or buffer systems such as McIlvaine [
24,
25,
26], sodium citrate buffer [
27,
28], or phosphate buffers [
29]—are employed to mitigate matrix interferences and enhance analyte recovery. In contrast, aqueous samples typically undergo filtration followed by solid-phase extraction (SPE), omitting the extraction step entirely. For SPE purification, hydrophilic–lipophilic balance (HLB) cartridges are widely adopted due to their bifunctional polymeric composition (
N-vinylpyrrolidone–divinylbenzene), which supports stable retention over a wide polarity and pH range (1–14) [
26,
27,
29]. The high polarity of imidazoles facilitates solubility in methanol and acetonitrile, especially under acidic or alkaline conditions, making these solvents ideal for LC–MS/MS applications [
30,
31]. Thus, optimizing solvent systems, extraction techniques, and sorbent selection remains critical for ensuring comprehensive recovery and minimal interference—particularly for multi-class imidazoles in environmental matrices.
High-performance liquid chromatography coupled with tandem mass spectrometry (HPLC-MS/MS) currently serves as the gold standard for imidazole drug analysis, offering superior separation efficiency, sensitivity, and structural identification capabilities [
32,
33,
34]. However, existing analytical standards primarily focus on veterinary tissues, animal products, or feed matrices [
35,
36,
37,
38], with limited application to environmental samples. Moreover, current methodologies predominantly target specific subclasses (e.g., benzimidazoles or nitroimidazoles) and fail to achieve simultaneous quantification of all imidazole derivatives due to insufficient pretreatment specificity [
39,
40,
41,
42]. This limitation mirrors broader challenges in environmental monitoring, where established protocols overlook emerging imidazoles, such as Fenbendazole Sulfone and Thiabendazole, despite their documented ecological risks [
43,
44,
45]. Developing robust multi-residue methods capable of covering diverse imidazole classes in complex environmental matrices thus remains an urgent priority.
To address these limitations, the present study developed and validated a robust LC–MS/MS method incorporating SPE for the simultaneous determination of 21 imidazoles—comprising 12 benzimidazoles and 9 nitroimidazoles—across three representative environmental matrices: water, sediment, and soil. These matrices were strategically selected, as they represent the major environmental sinks for pharmaceutical pollutants and collectively capture the broad spectrum of compartments likely to accumulate imidazole residues. For solid matrices (sediment and soil), a phosphate-buffered acetonitrile system was optimized to enhance analyte recovery through solvent-based extraction. In contrast, aqueous samples required no extraction step and were directly subjected to SPE following filtration. Despite these differences in initial sample handling, all matrices were subsequently purified using a unified SPE procedure, employing Oasis HLB cartridges with acidified methanol elution to ensure consistent retention and recovery performance. An isotope-labeled surrogate quantitation strategy was also introduced to mitigate matrix effects and enhance analytical accuracy. The method was successfully applied to environmental samples from the Jiulong River basin, China, revealing widespread contamination across all matrices. Overall, this work establishes the first harmonized multi-matrix protocol for comprehensive imidazole monitoring, bridging critical gaps in pharmaceutical pollutant surveillance and providing a valuable tool for regulatory and ecological risk assessment.
2. Materials and Methods
2.1. Chemicals and Reagents
All standard compounds and isotope-labeled surrogates listed in
Table 1 (the structural formula can be found in
Figure S1) were purchased from Anpel (Shanghai, China) and A Chemtek (Woburn, MA, USA). Primary stock solutions of imidazole derivatives were prepared at a concentration of 100 mg·L
−1 in methanol. These stock solutions were subsequently diluted with methanol–water (20/80,
v/
v) to obtain working solutions at 1 mg·L
−1. All standard solutions were stored at −20 °C in amber glass containers to prevent degradation until further use.
Six isotope-labeled compounds (Fenbendazole-D3, Albendazole-D3, Mebendazole-D3, Flubendazole-D3, Metronidazole-D4, Dimetridazole-D3) were employed as surrogate standards. Their selection was based on structural analogy to major subclasses of the target analytes (e.g., benzimidazoles, nitroimidazoles), ensuring similar physicochemical properties, chromatographic behavior, and susceptibility to matrix effects. Furthermore, their commercial availability provided a practical and cost-effective solution for compensating matrix interferences across the diverse suite of 21 imidazoles, circumventing the need for synthesizing individually labeled analogs for each compound.
HPLC-grade solvents, including methanol, acetonitrile, formic acid, and dichloromethane, were supplied by Tedia (Fairfield, IA, USA). Disodium ethylenediaminetetraacetate (Na2EDTA), trisodium phosphate dodecahydrate (Na3PO4·12H2O), and sodium citrate dihydrate (Na3C6H5O7·2H2O) were of analytical grade and obtained from Xilong Chemical (Shantou, China). Reagent water with a resistivity of 18.2 MΩ·cm was prepared using a Milli-Q water purification system (Millipore, Bedford, MA, USA). Solid-phase extraction cartridges (Oasis HLB 500 mg/6 mL) were purchased from Waters (Milford, MA, USA).
Phosphate-buffered saline (PBS, pH 10.56): 2.76 g of Na3PO4·12H2O, 1.29 g of Na3C6H5O7·2H2O, and 1.5 g of Na2EDTA dissolved in 100 mL of Milli-Q.
2.2. Sample Collection and Treatment
For method validation (spike recovery tests), surface sediment samples (0–10 cm) and surface water samples (0.2–2 m depth) were collected from Taihu Lake (freshwater, Jiangsu Province, China) and the Ningde coastal area (seawater, Fujian Province, China) in August 2023. Soil samples, including black soil, brown soil, and red soil, were collected from Heilongjiang Province (black soil), Anhui Province (brown soil), and Fujian Province (red soil), China, in July 2023, respectively. These diverse matrices were strategically selected to represent major environmental compartments in China: freshwater and seawater for the predominant aquatic systems, and black, brown, and red soils from northern, central, and southern regions as key zonal soil types. Collectively, they provide broad coverage of the major environmental sinks for imidazoles. To assess method applicability and reliability in environmental monitoring, surface freshwater samples (0.2–2 m depth) and corresponding sediment samples (0–10 cm) were collected from 12 sites along the Jiulong River, Fujian Province, China, in October 2023.
Sediment samples and soil samples were moved into pre-cleaned glass jars, lyophilized at −18 °C using a Labconco freeze dryer (Kansas City, MO, USA), homogenized by passing through a 100-mesh sieve, and stored at −18 °C until analysis.
Water samples were collected in brown glass bottles and stored at 4 °C. Prior to analysis, all samples were filtered through 0.45 μm cellulose nitrate membrane filters (Whatman, Maidstone, UK) at room temperature.
2.3. Sample Extraction and Purification
Soil and sediment samples were accurately weighed, and 2.0 g of each was placed into 100 mL polypropylene centrifuge tubes and spiked with 20 ng of surrogate standards in triplicate. Buffer A (6 mL) and acetonitrile (14 mL) were added to each tube, followed by thorough mixing for 2 min. The samples were then subjected to ultrasonic oscillation for 10 min. After centrifugation at 4000 rpm for 5 min, the solid and liquid phases were separated. The extraction procedure was repeated twice under identical conditions. The three extracts were combined in a 150 mL round-bottom flask and evaporated at 35 °C until the volume was reduced to 0.5 mL. The concentrated extracts were reconstituted twice with 2 mL of Milli-Q water and once with 2 mL of methanol–water (20/80, v/v, MeOH-H2O), and subsequently loaded through HLB cartridges (6 mL, 500 mg) that were preconditioned sequentially with 6 mL methanol and 6 mL Milli-Q water. The cartridges were washed with 6 mL of Milli-Q water, dried under vacuum, and then eluted with 6 mL of methanol and 6 mL of acidified methanol (2/98, v/v, FA-MeOH). The eluates were evaporated to dryness at 35 °C under a gentle nitrogen stream. The residues were then reconstituted in 1 mL of acidified methanol–water (0.1/20/79.9, v/v, FA-MeOH-H2O) and filtered through a PTFE syringe filter (0.22 μm pore size) for HPLC-MS/MS analysis.
Water samples were accurately measured: 500 mL of sample was passed through a 0.45 μm filter membrane into a glass bottle. Then, 0.25 g of Na
2EDTA was added, and the solution was allowed to stand for 30 min. Subsequently, 20 ng of surrogate standards was added. The HLB cartridge (20 mL, 1 g) was preconditioned sequentially with 10 mL of methanol and 10 mL of ultrapure water. The sample was loaded at a flow rate of 5 mL/min. After loading, the cartridge was washed with 6 mL of ultrapure water and dried under vacuum. The subsequent procedures followed identical steps as described for sediment pretreatment. The complete workflows were shown in
Figure S2.
2.4. Instrumental Analysis and Parameters
The target compounds were analyzed using an HPLC-MS/MS system (Shimadzu LCMS-8040, Kyoto, Japan) equipped with a positive electrospray ionization (ESI+) source. Separation was achieved by injecting 10 μL of the sample onto an Accucore C18 column (100 mm × 3.0 mm i.d., particle size 2.6 μm, Thermo Fisher Scientific, Waltham, MA, USA). The mobile phase for positive ionization mode (ESI+) detection consisted of acidified water (0.1/99.9,
v/
v, FA-H
2O) and acidified acetonitrile (0.1/99.9,
v/
v, FA-ACN). The mobile phase was delivered at a flow rate of 0.25 mL·min
−1, and the column temperature was maintained at 40 °C. Separation was achieved using the following gradient program: initial 90% A/10% B; linear gradient to 70% A/30% B at 4 min; to 30% A/70% B at 14 min; to 5% A/95% B at 15 min; hold until 20 min; return to initial conditions at 20.01 min; and re-equilibrate until 25 min (see also
Table S1).
For MS/MS detection, the ESI source was operated in positive ionization mode using nitrogen gas as the drying gas and collision gas. The instrument was configured with a nebulizing gas flow rate of 3.0 L/min, drying gas flow rate of 15.0 L/min, heating block temperature of 400 °C, desolvation line (DL) temperature of 250 °C, interface voltage of 4.8 kV, conversion dynode voltage of 6.0 kV, detector voltage of 1.84 kV, and collision-induced dissociation (CID) gas pressure of 230 kPa. Under these conditions, optimization was performed for the precursor ions, product ions, collision energy (CE), Q1 pre-bias voltage, and Q3 pre-bias voltage of the target analytes, as detailed in
Table 1.
2.5. Quantification and Quality Control
The method was validated by evaluating linearity, recovery, sensitivity, precision, and matrix effects for each target compound. Linearity across the full concentration range was determined by spiking target compounds into extracts from blank samples or solvents, and correlation coefficients (R2) were calculated for all compounds. Recoveries were accessed by spiking standard solutions into samples at 2, 10, and 20 times the method quantification limits (MQLs). All experiments were conducted in quadruplicate, and relative standard deviations (RSDs) were calculated to evaluate the method’s precision. The MQLs and method detection limitations (MDLs) for target imidazoles were defined as the minimum detectable concentrations with signal-to-noise ratios of 10 and 3, respectively. These limits (MDL and MQL) were determined in matrix-matched samples based on signal-to-noise ratio (S/N). Instrumental detection and quantification limits (IDLs and IQLs) were also determined in solvent standards using the same S/N criteria (3 and 10, respectively).
2.6. Matrix Effect Assessment
It is essential to evaluate matrix effects in the analysis using HPLC-MS/MS, primarily due to the coelution of unknown matrix components that may suppress or enhance analyte ionization at the electrospray interface [
46]. The matrix effect is calculated according to Equation (1).
This equation calculates the relative difference (in percentage) between the response of the analyte in the matrix and the response in pure solvent, after subtracting the contribution from the blank. A value of 0% indicates no matrix effect.
Amatrix,
Ablank, and
Asolvent represent the peak areas obtained in HPLC-MS/MS analysis for target analytes in the matrix-matched standard, blank sample, and standard solution, respectively [
47]. Matrix effects (MEs) were evaluated individually for each of the 21 target analytes. Positive or negative values of the matrix effect indicate whether the ionization of the target compounds was enhanced or suppressed by interfering substances. When |ME| ≤ 20%, the signal enhancement or suppression is considered negligible. If 20% < |ME| ≤ 50%, moderate enhancement or suppression has occurred. When |ME| > 50%, the effect is deemed significant. To ensure analytical accuracy, strict quality control procedures were implemented for all samples. The concentrations of target compounds were quantified using a calibration curve constructed with isotope-labeled surrogate standards.
2.7. Isotope-Labeled Surrogate Quantitation Method
Isotope-labeled internal standards represent the most effective approach for compensating for matrix effects and correcting losses in analytical products. However, their practical application in multi-residue analysis is often constrained by the difficulty in obtaining matched isotope-labeled counterparts for each target analyte.
To overcome this limitation, we implemented an innovative extension of the traditional isotope dilution methodology by employing only six isotopically labeled surrogate standards to represent the 21 target analytes sharing similar physicochemical properties, chromatographic behaviors (retention time windows), recoveries, and matrix effects. This strategy was necessitated by the high cost and limited commercial availability of isotope-labeled standards for all analytes, making a one-to-one correspondence impractical. This approach has previously demonstrated effectiveness for veterinary drug quantification in sediment matrices [
48].
The pairing of specific surrogates to groups of target analytes was rigorously based on their structural similarity (e.g., belonging to the same subclass like benzimidazoles or nitroimidazoles), closely matched physicochemical properties (e.g., log P, pKa), comparable chromatographic retention times (ensuring they elute in similar windows and experience analogous matrix co-elution), and demonstrated similarities in extraction recovery profiles and matrix effects during method development (as observed in preliminary experiments). The definitive assignment of each target analyte to its representative surrogate standard is detailed in
Appendix A.
In data processing, the relative response factor (
RRF) is first obtained through calculation methods, and then, the content of the target substance is calculated:
where
RRFx/Su represents the relative response factor of the target compound relative to the surrogate in instrumental analysis.
Ax and
Asu denote the peak areas of the target compound and surrogate in the standard calibration curve, respectively.
Cx and
CSu correspond to the concentrations of the target compound and surrogate in the standard calibration curve (mg·kg
−1).
C indicates the concentration of the target compound in the sample (μg·kg
−1).
ax and
aSu represent the peak areas of the target compound and surrogate in the concentrated sample extract.
WSu specifies the amount of surrogate added prior to sample pretreatment (μg).
VS refers to the sample volume before pretreatment (g).
The detailed surrogate-to-target analyte correspondence relationship and validation data are provided in
Appendix A. The pairing strategy was validated by comparing physicochemical properties (log P, pKa) and chromatographic behaviors (retention time) within each surrogate group. As demonstrated in
Supplementary Table S2, most groups (e.g., MBZ-D
3, FLUZ-D
3, MNZ-D
4) showed high intra-group consistency (SD < 1.0 for log P/pKa/RT), confirming the suitability of surrogates for correction. For groups with larger variations (e.g., FBZ-D
3: log P SD = 1.57; DMZ-D
3: mixed subclasses), the pairing was justified by comparable recovery and matrix effects observed during validation (
Section 3.4.3 and
Section 3.4.4).
3. Results and Discussion
3.1. Optimization of MS/MS Parameters
To achieve ideal sensitivity, the mass spectrometry parameters for each target analyte were optimized at concentrations ranging from 1 to 10 mg·L
−1 under ESI+ modes according to molecular structure and polarity properties (listed in
Table 1).
3.2. Optimization of LC Separation Conditions
During the optimization of chromatographic conditions, significant variations in response values (>100-fold difference between the highest-responding analyte, Febantel [FEB], and the lowest-responding analyte, Hydroxy-metronidazole [MNZOH]) were observed in the single-concentration mixed standard chromatogram, which might compromise quantitative accuracy; to mitigate this effect, target analyte concentrations in the mixed standard were stratified into three tiers (1:5:10) based on response intensity, as detailed in
Table 2.
During gradient elution optimization for LC analysis, the mobile phase composition was dynamically programmed to achieve optimal separation for all target analytes, with the final gradient profile detailed in
Table S1. The addition of 0.1% (
v/
v) formic acid significantly enhanced both ionization efficiency and chromatographic resolution. Consequently, a mobile phase consisting of ultrapure water with 0.1% (
v/
v) formic acid (A) and acetonitrile with 0.1% (
v/
v) formic acid (B) was employed at a 0.25 mL·min
−1 flow rate and a 10 μL injection volume. Separation was performed on an Accucore C18 column (2.6 μm, 150 × 3.0 mm i.d.). Through iterative adjustments of mobile phase ratios and segment durations using the stratified mixed standard (
Section 2.1), maximal separation efficiency was achieved, as demonstrated in
Figure S3. The exceptionally high response of Febantel (FEB) is attributed to its inherent high ionization efficiency in ESI+ mode, likely due to protonatable basic sites in its structure. Detector saturation was avoided by maintaining all concentrations within the instrument’s linear dynamic range. The chromatographic resolution achieved (
Figure S3) and the compound-specific MRM transitions employed (
Table 1) effectively preclude interference from known isomers or enantiomers of the target analytes.
3.3. Optimization of Sample Preparation Procedures
Sample preparation required distinct approaches for aqueous versus solid matrices. Water samples underwent direct SPE, necessitating optimization of pre-SPE conditioning: Na2EDTA addition to mitigate metal interference and sample loading volume to prevent analyte breakthrough. Conversely, sediment and soil samples required initial LSE prior to SPE. Subsequent SPE procedures (cartridge selection and elution) and final filtration were optimized using universal conditions applicable to all matrices. Therefore, core optimizations focused on Na2EDTA dosage and loading volume (water), LSE conditions (sediments/soil), SPE conditions, and filter membrane selection.
3.3.1. Optimization of Na2EDTA Dosage and Sample Loading Volume for Water Samples
Heavy metals in natural water bodies may form complexes with target analytes, thereby compromising SPE efficiency. Na
2EDTA effectively chelates divalent metal ions (e.g., Ca
2+, Mg
2+, Fe
2+) into stable complexes, mitigating their interference during the SPE of environmental water samples [
49]. Concurrently, the adsorption capacity of SPE cartridges is intrinsically limited by the breakthrough volume—the maximum sample volume processable without analyte loss [
50]. Exceeding this volume reduces extraction accuracy. To address these factors, combinatorial experiments optimizing Na
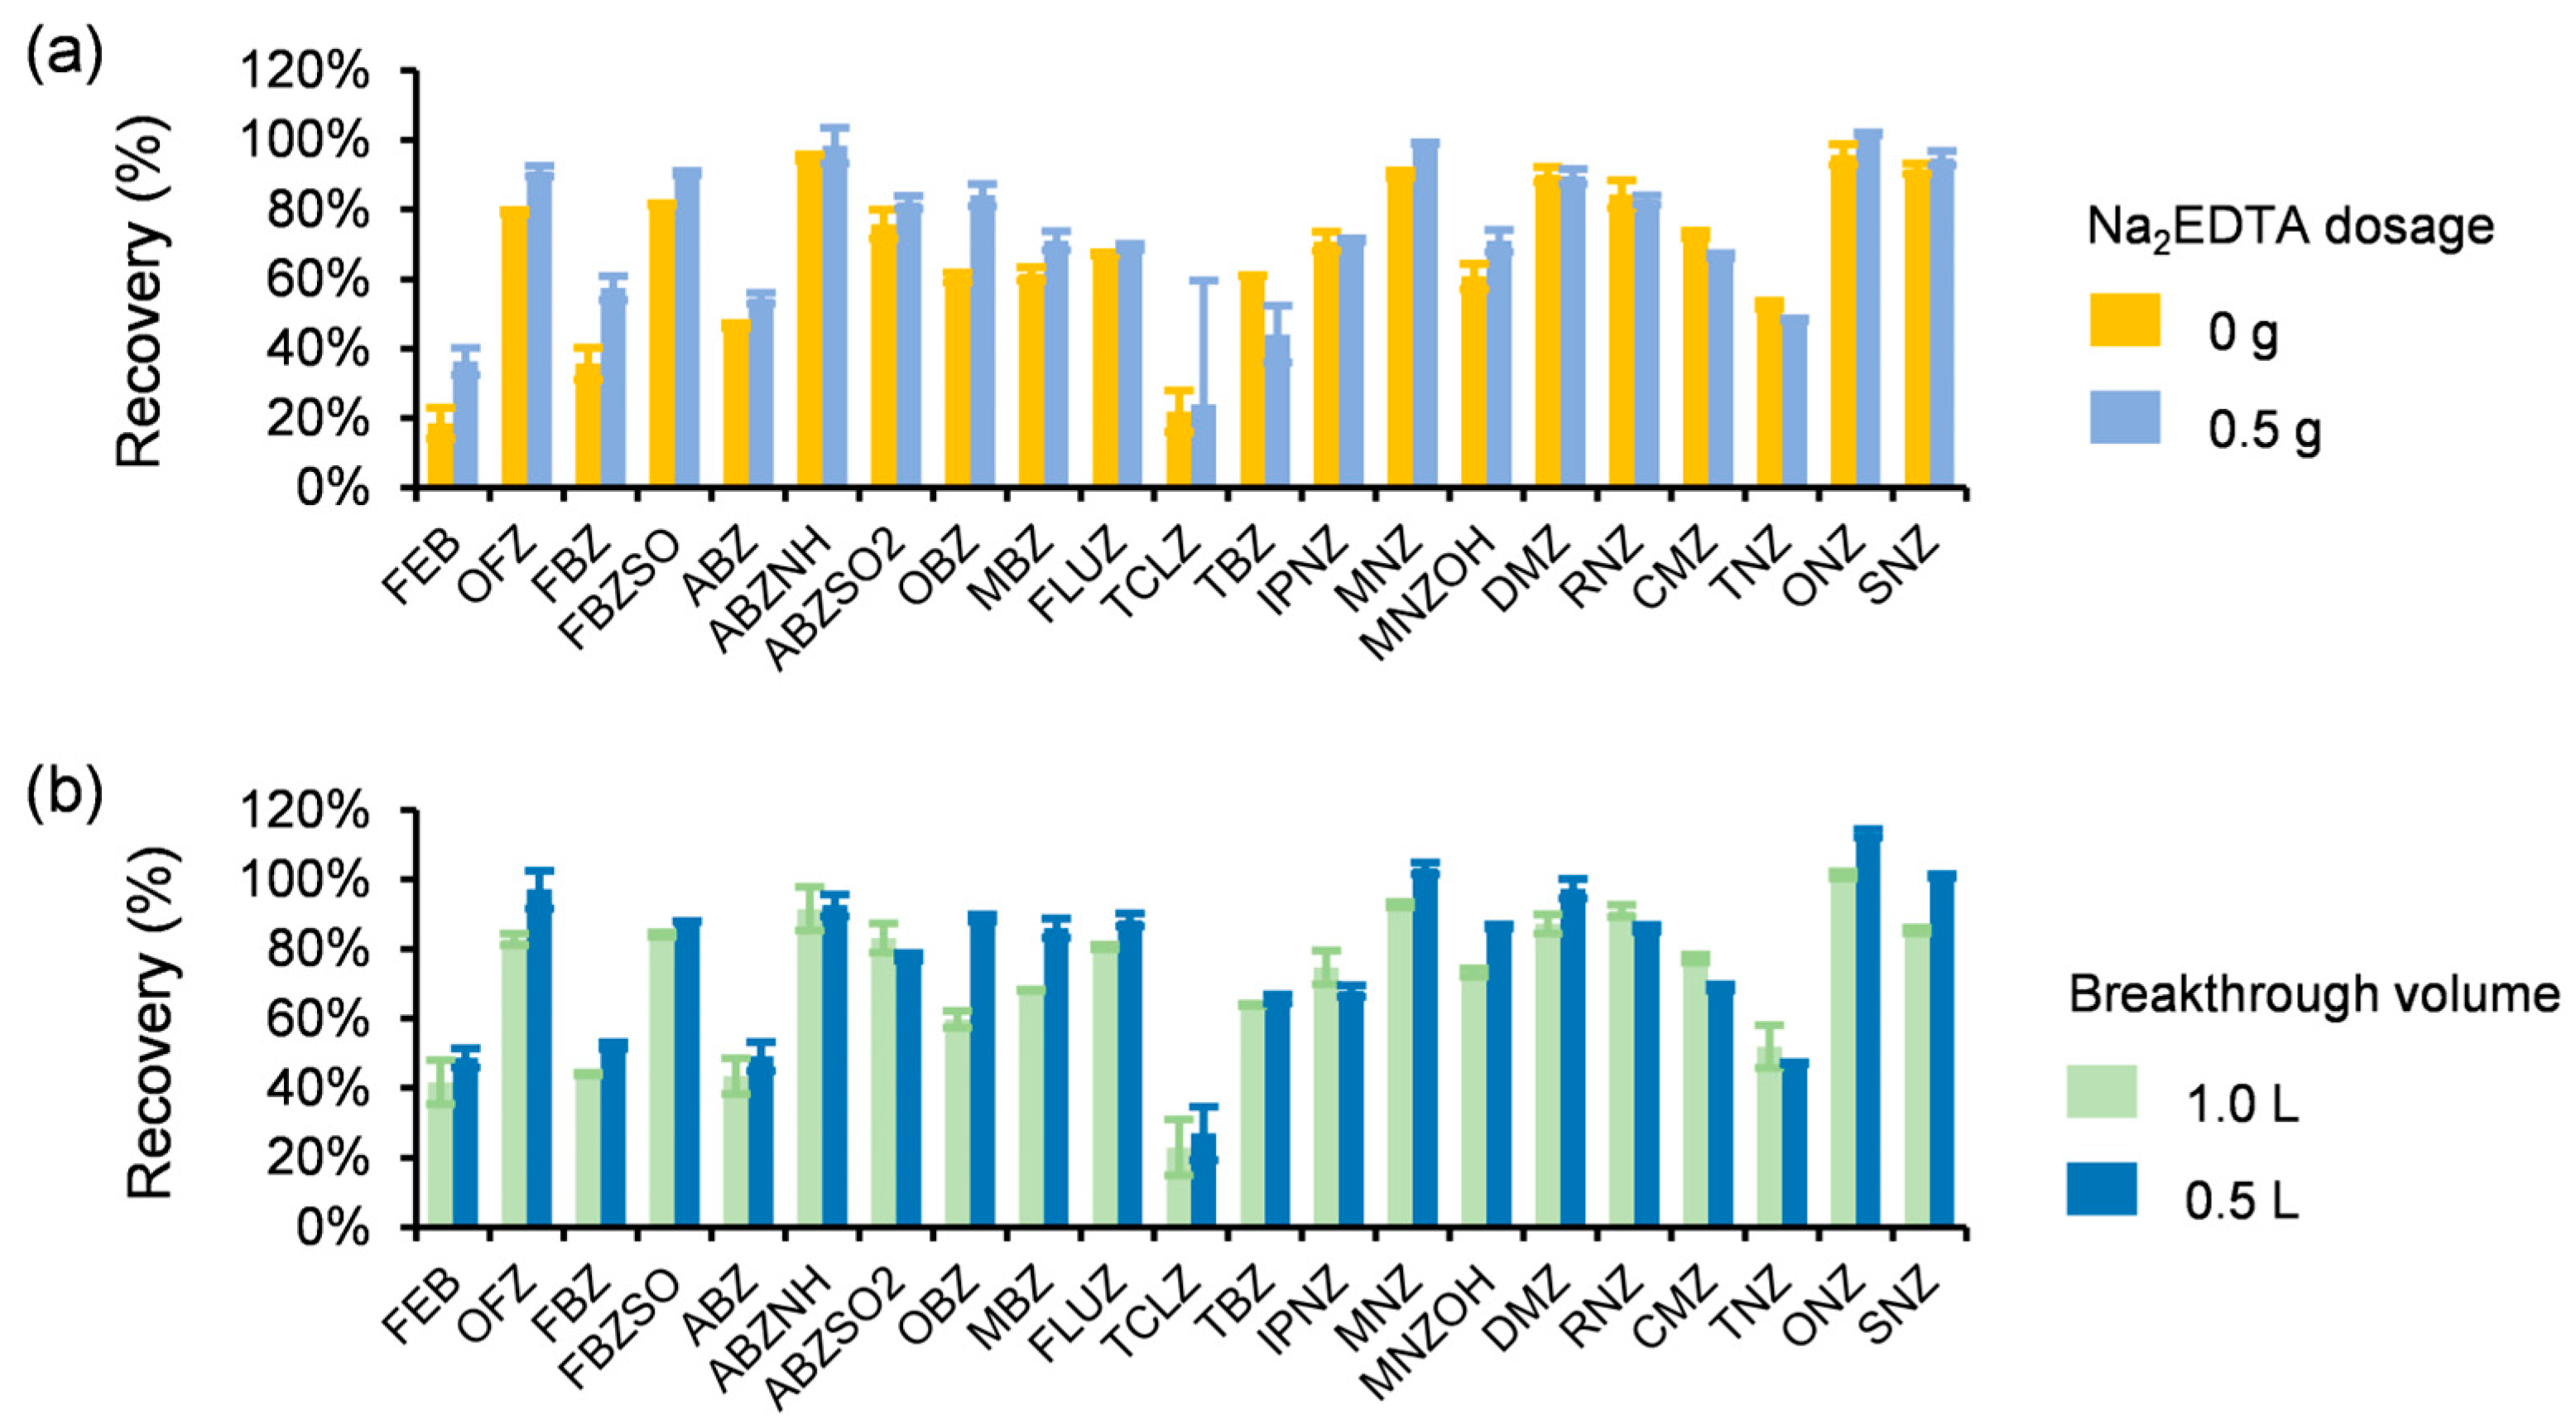
2EDTA dosage and water loading volume were conducted in triplicate using Taihu Lake water as the matrix. Analyte recoveries across conditions are detailed in
Supplementary Table S3-1 and
Figure 1.
LC-MS/MS analysis of 1.0 L samples processed through HLB cartridges (1 g, 20 mL) demonstrated significant differential effects: a comparative analysis of samples without versus with 0.5 g Na
2EDTA (
Figure 1a) revealed uniform recovery increases for benzimidazoles, with Febantel (FEB), Fenbendazole (FBZ), and Thiabendazole (TBZ) exhibiting ~20% enhancement, whereas nitroimidazoles showed negligible variation post-addition; a comparison between 1.0 L (0.5 g Na
2EDTA) and 0.5 L (0.25 g Na
2EDTA) samples (
Figure 1b) indicated significantly higher recoveries for most analytes in the latter group, particularly Oxibendazole (OBZ) with 59.80%→88.88% improvement, while Oxfendazole (OFZ), Mebendazole (MBZ), and Secnidazole (SNZ) showed >15% increases. The significantly improved recoveries, particularly for benzimidazoles like FEB and FBZ, are attributed to Na
2EDTA’s ability to chelate divalent metal ions (Ca
2+, Mg
2+, Fe
2+) ubiquitous in natural waters. These metal ions form insoluble complexes with nitrogen-containing heterocycles or sulfonyl groups in imidazoles, reducing their free concentration and impeding retention on HLB sorbents. Chelation liberates analytes into freely dissolved forms, enhancing SPE efficiency. Based on comprehensive recovery data, the optimized protocol was determined: the addition of 0.25 g Na
2EDTA to 0.5 L water samples prior to HLB cartridge processing. This configuration maximizes analyte retention while minimizing reagent consumption and operational time.
3.3.2. Optimization of Buffer Dosage for Soil and Sediment Samples
Acetonitrile was selected as the extraction solvent for soil and sediment samples, with phosphate-buffered saline (PBS, pH 10.56) added to mitigate pH-mediated interference during extraction. Using Lake Tai sediments as the matrix, vortex and ultrasound-assisted extractions were performed to optimize PBS volume while maintaining a total extraction volume of 20 mL. Experimental groups included (1) 20 mL ultrapure water (UPW) and (2) PBS additions of 2–6 mL supplemented with acetonitrile to a 20 mL volume. All conditions underwent triplicate determinations, with recovery data detailed in
Supplementary Table S3-3 and
Figure 2.
The analysis revealed three response patterns among the 21 target analytes: Febantel (FEB), Fenbendazole (FBZ), Albendazole (ABZ), Thiabendazole (TBZ), and Ipronidazole (IPNZ) exhibited positive dose response, achieving >75% recovery at ≥4 mL PBS; Metronidazole (MNZ) showed gradually decreasing recovery (>75% across all volumes); and the remaining 15 compounds demonstrated negligible variation (<±5%) irrespective of PBS dosage. The differential response patterns originate from pH-mediated speciation changes: At pH 10.56, weakly acidic benzimidazoles (e.g., carbamate-containing FEB/FBZ/ABZ) undergo deprotonation to neutral species with higher organic solvent affinity, explaining their enhanced extraction with increased PBS volume. Nitroimidazoles remain ionized or exhibit different solubility profiles, resulting in PBS-insensitive behavior. Additionally, phosphate/citrate ions disrupt hydrogen bonding between analytes and soil organic matter. Based on comprehensive recovery profiles, the final extraction solvent was optimized as 6 mL PBS + 14 mL acetonitrile.
3.3.3. Optimization of SPE Cartridges
Based on the characteristics of the 21 polar amphoteric imidazole drugs (pKa 2–10) and the Tai Lake water matrix,
Table 3 details the optimized SPE procedures for four cartridges: Hydrophilic–Lipophilic Balance (HLB), Weak Cation Exchange (WCX), Strong Cation Exchange (SCX), and Mixed-mode Cation Exchange (MCX). All cartridges used a 500 mg adsorbent loading and processed 500 mL aqueous samples, with identical activation steps involving 6 mL ultrapure water followed by 6 mL methanol. Divergence occurred in washing and elution protocols:
HLB: Washed with 6 mL ultrapure water and eluted using 6 mL methanol combined with 6 mL 2% formic acid in methanol (v/v).
WCX: Washed with 6 mL 5% ammonium hydroxide (v/v) and eluted with the same methanol/2% formic acid in methanol mixture as HLB.
SCX/MCX: Both washed with 6 mL 2% formic acid solution (v/v) and eluted with 6 mL methanol plus 6 mL 5% ammoniated methanol (v/v).
These protocol variations were designed to leverage the distinct retention mechanisms of each adsorbent chemistry (e.g., HLB’s hydrophilic–lipophilic balance vs. MCX/SCX’s mixed-mode cation exchange), ensuring optimal recovery of the chemically diverse imidazoles. Triplicate determinations under each condition enabled robust statistical validation of recovery data (
Supplementary Table S3-1,
Figure 3).
The results demonstrated that among the four cartridges, the HLB cartridge exhibited the highest recoveries for all 20 imidazoles except Febantel (FEB). Recoveries exceeded 40% for 20 targets (excluding Triclabendazole, TCLZ), meeting the requirements for isotope-labeled surrogate quantitation method correction. Consequently, the HLB cartridge was selected for the subsequent SPE processing of samples.
3.3.4. Optimization of Elution Solvents
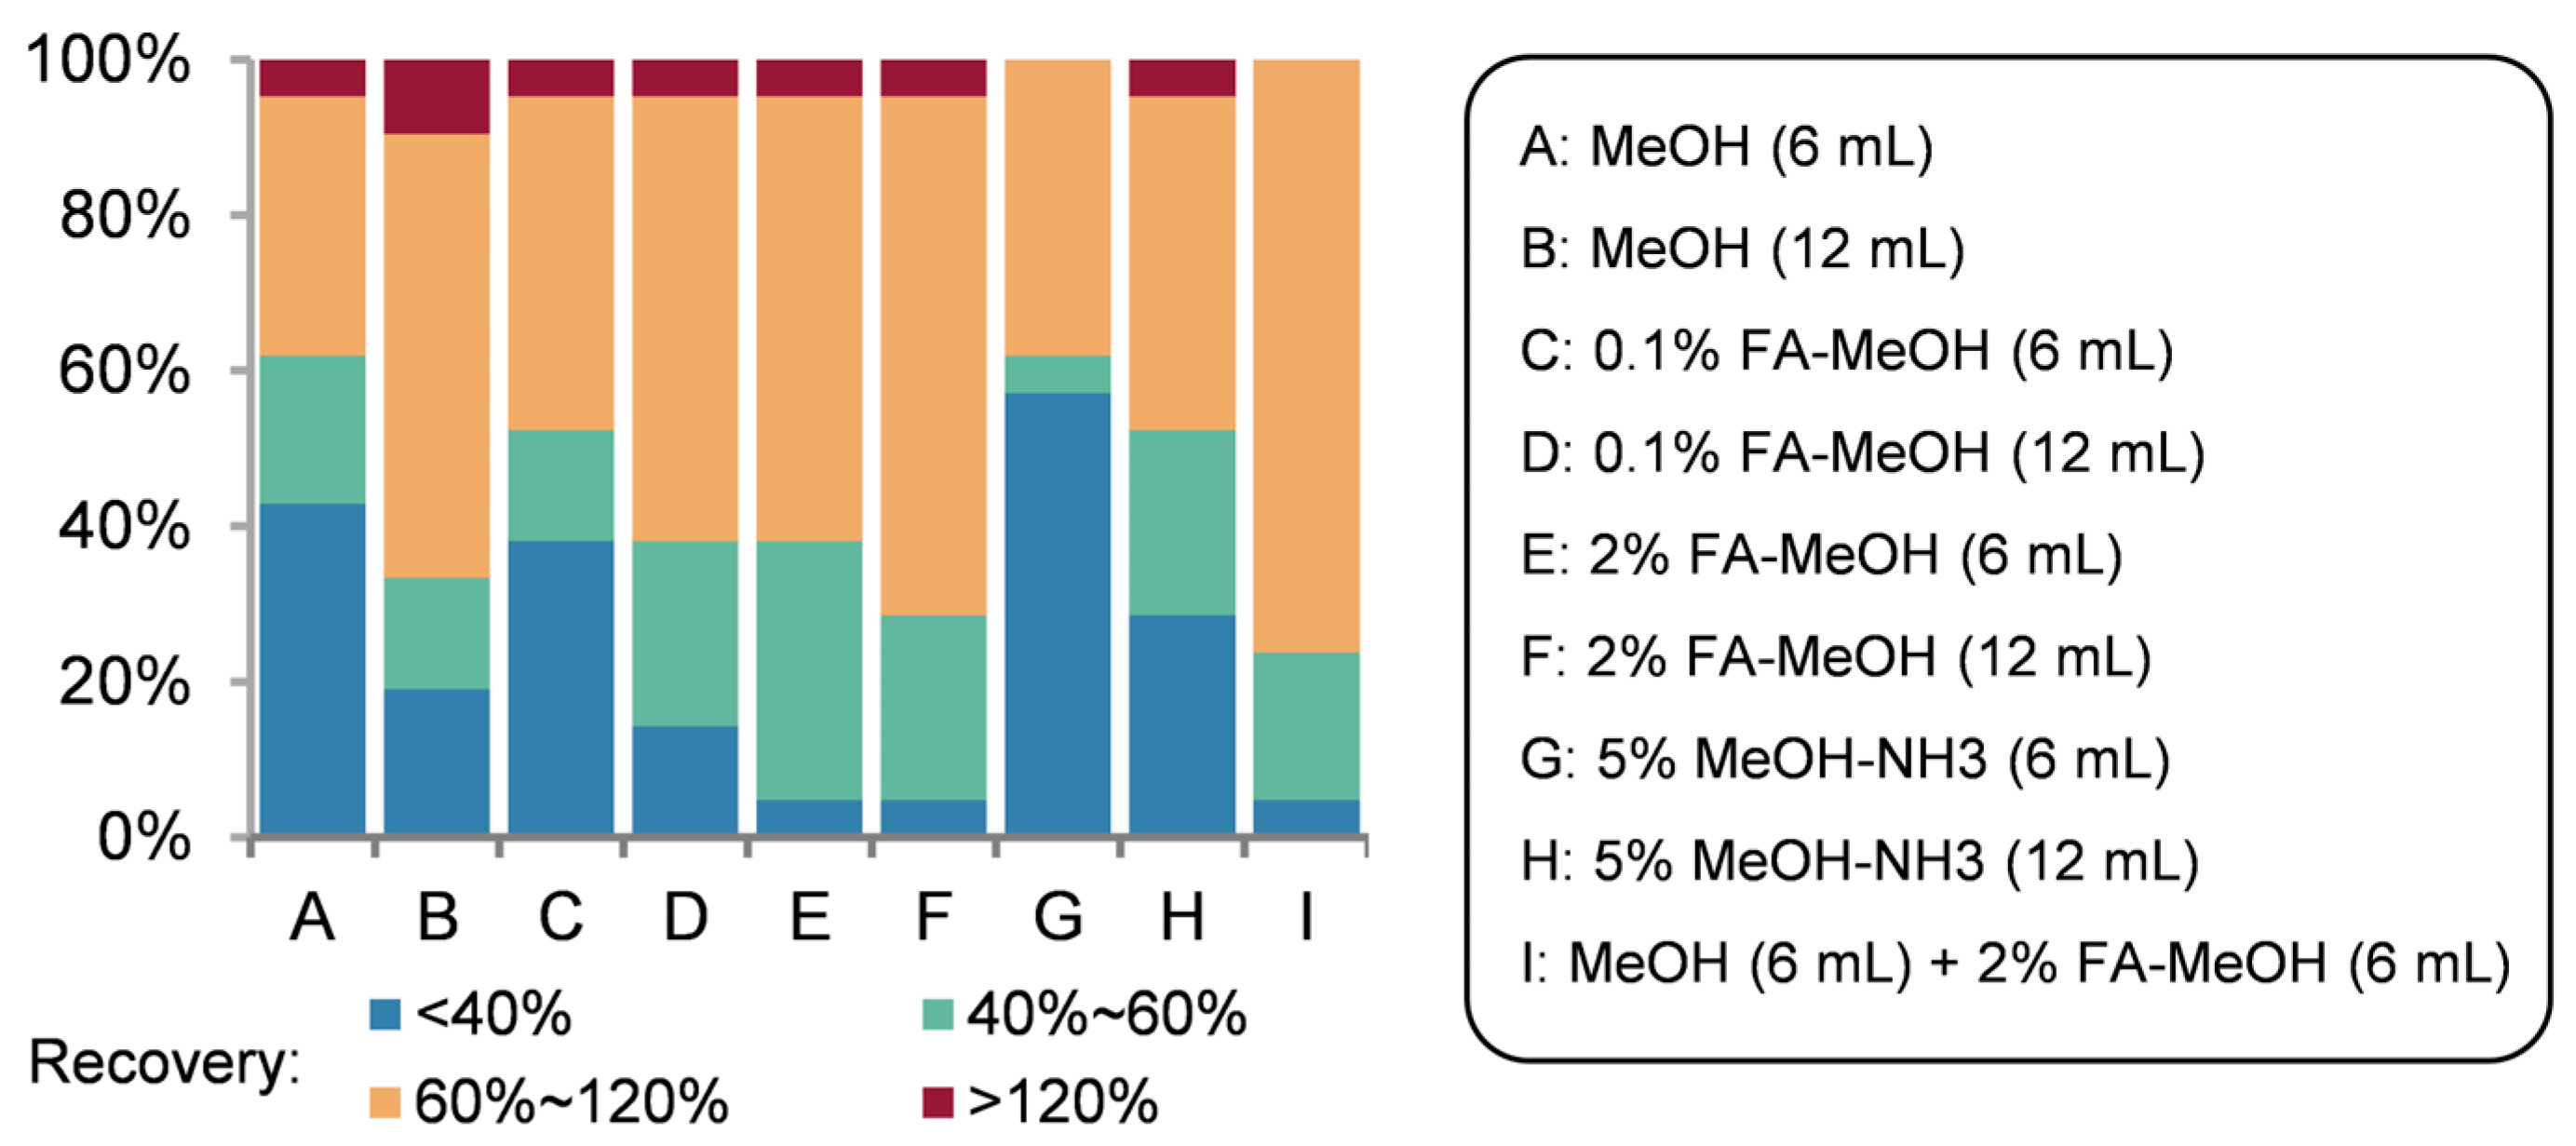
The elution solvent directly influences impurity removal efficiency and target analyte recovery. Given methanol’s strong polarity and compatibility with imidazole drugs under the polarity compatibility principle, it was prioritized for elution optimization. Using reservoir water as the matrix, we evaluated methanol volume, formic acid (FA) or ammonium hydroxide (NH
4OH) additives, and combined solvent systems, with triplicate determinations per condition. Detailed recoveries for individual targets are provided in
Supplementary Table S3-2, while
Figure 4 summarizes overall trends. Nine experimental groups were tested: two total elution volumes (6 mL and 12 mL) comparing pure methanol, 0.1% FA in methanol (
v/
v), 2% FA in methanol (
v/
v), 5% NH
4OH in methanol (
v/
v), and a sequential combination of 6 mL methanol followed by 6 mL methanol containing 2% FA (
v/
v).
Increased elution volume significantly improved recovery for the most challenging analytes. Methanol and 0.1% FA in methanol exhibited comparable efficacy, whereas 2% FA in methanol markedly enhanced recovery for polar benzimidazoles—notably elevating Fenbendazole (FBZ) recovery from 21.96% to 97.68%. Ammoniated methanol underperformed across all tests. The sequential elution with 6 mL methanol + 6 mL methanol containing 2% FA (v/v) proved optimal, achieving 40–120% recovery for 20 of 21 targets (excluding Triclabendazole, TCLZ), thereby meeting the calibration requirements for the isotope-labeled surrogate quantitation method.
3.3.5. Optimization of Filter Membrane
Liquid chromatography–tandem mass spectrometry (LC-MS/MS) employs stationary phases with small particle sizes, which are susceptible to clogging by salts, macromolecular organics, or fine particulates in samples. This compromises separation efficiency and shortens column lifespan. Consequently, sample filtration prior to analysis is typically required. However, filter membranes of different materials may exhibit varying degrees of analyte retention and adsorption, potentially impacting result accuracy. In this experiment, mixed standard working solutions were filtered through four types of 0.22 μm membranes—Polytetrafluoroethylene (PTFE), Polyvinylidene Fluoride (PVDF), Polyethersulfone (PES), and nylon (NL)—followed by LC-MS/MS analysis. Triplicate determinations were performed for each condition, with two consecutive injections per replicate. Responses were compared against an unfiltered mixed standard working solution of identical concentration. Overall recovery trends across targets are shown in
Figure 5, with detailed recovery data provided in
Supplementary Table S3-4.
Substantial analyte-specific adsorption was observed during filtration: the nylon membrane caused Tinidazole (TNZ) recovery to drop below 30%, while the PES membrane resulted in recoveries below 60% for Albendazole (ABZ), Fenbendazole (FBZ), Febantel (FEB), Flubendazole (FLUZ), and Mebendazole (MBZ). Critically, Triclabendazole (TCLZ) was completely lost and became undetectable after filtration through both nylon and PES membranes. The superior performance of PTFE membranes is attributed to their extremely low adsorption affinity for the target analytes, resulting from their high chemical inertness. The non-polar fluoropolymer backbone of PTFE minimizes polar and ionic interactions (e.g., hydrogen bonding, electrostatic attraction), which caused significant analyte loss on nylon (amide groups) and PES (sulfone groups). In contrast, PTFE and PVDF membranes showed minimal interference, with recoveries consistently near 100%. PTFE demonstrated optimal performance across all target analytes, attributed to its inherent chemical inertness and broad solvent compatibility. Consequently, PTFE membranes were selected for post-reconstitution filtration prior to LC-MS/MS injection.
3.4. Method Validation
The observed environment samples that showed no obvious MS signals of the target drugs at the corresponding retention times were chosen as blank matrices and used in the following method validation.
3.4.1. Linearity, IDLs, IQLs, MDLs, and MQLs
The linearity of this method was assessed by constructing calibration curves for each target imidazole at seven different concentrations in the range of 0.10~1000 μg·kg
−1. All target compounds exhibited excellent linearity, with a determination coefficient (R
2) above 0.995 for both standard solution curves and isotope-labeled surrogate calibration curves (
Appendix A).
The instrumental detection limits (IDLs) and quantification limits (IQLs), as well as the method detection limits (MDLs) and quantification limits (MQLs) for the target compounds, are presented in
Appendix A. The IDLs ranged from 0.01 μg·L
−1 (Febantel) to 0.2 μg·L
−1 (5-Chloro-1-methyl-4-nitroimidazole) and the IQLs from 0.05 μg·L
−1 to 1 μg·L
−1. The MDLs of water samples ranged from 0.01 ng·L
−1 (Oxibendazole) to 0.25 ng·L
−1 (Dimetridazole), and the MQLs from 0.05 ng·L
−1 to 1 ng·L
−1. The MDLs of soil/sediment samples ranged from 0.01 μg·kg
−1 (Mebendazole) to 0.25 μg·kg
−1 (Triclabendazole), and the MQLs from 0.05 μg·kg
−1 to 1 μg·kg
−1. Overall, the IDLs, IQLs, MDLs, and MQLs in this study were comparable to or better than those in reported studies focusing on multi-residue antibiotic analysis in sediment [
51,
52].
3.4.2. Matrix Effect Results
For all 21 imidazoles, matrix effects in freshwater and seawater samples spiked at three levels (2, 10, and 20× MQLs) and ranged from −43% to 8% based on the data in
Table S4-1. Fenbendazole (FBZ), Fenbendazole sulfone (FBZSO), Mebendazole (MBZ), Flubendazole (FLUZ), Ipronidazole (IPNZ), Hydroxy-metronidazole (MNZOH), and Ornidazole (ONZ) exhibited negligible matrix effects (|ME| ≤ 20%) across all spiking levels. Triclabendazole (TCLZ) and Thiabendazole (TBZ) demonstrated moderate matrix effects (20% < |ME| < 50%) consistently at all three levels. No compounds displayed significant matrix effects (|ME| ≥ 50%). The remaining analytes showed moderate interference in specific scenarios. Critically, negative matrix effects were predominant for nearly all targets, indicating systematic signal suppression.
Matrix effects in sediment samples spiked at three levels (2, 10, and 20× MQLs) and ranged from −56% to 7%, with data provided in
Table S4-2. As shown in
Figure 6, all nine nitroimidazoles—except Tinidazole (TNZ)—exhibited negligible matrix effects (|ME| ≤ 20%) across all spiking levels. Fenbendazole (FBZ), Oxibendazole (OBZ), and Triclabendazole (TCLZ) demonstrated moderate matrix effects (20% < |ME| < 50%) consistently at all three concentrations. Additionally, Albendazole (ABZ) and Triclabendazole (TCLZ) displayed significant matrix effects (|ME| ≥ 50%) in specific scenarios. The remaining analytes showed moderate interference under defined experimental conditions. Critically, negative matrix effects predominated for nearly all targets, mirroring the suppression pattern observed in aqueous matrices.
Matrix effects in soil samples (including black soil, brown soil, and red soil) spiked at three levels (2, 10, and 20× MQLs) and ranged from −57% to 8%. As shown in
Figure 6, Ipronidazole (IPNZ), Metronidazole (MNZ), Hydroxy-metronidazole (MNZOH), and Dimetridazole (DMZ) exhibited negligible matrix effects (|ME| ≤ 20%) across all spiking levels. Triclabendazole (TCLZ) and Fenbendazole (FBZ) demonstrated moderate matrix effects (20% < |ME| < 50%) consistently at all three concentrations. Notably, Fenbendazole (FBZ), Albendazole (ABZ), and Triclabendazole (TCLZ) displayed significant matrix effects (|ME| ≥ 50%) under specific experimental conditions, while the remaining analytes showed moderate interference within defined parameters. Critically, negative matrix effects predominated for nearly all targets in soil samples, mirroring the suppression pattern previously observed in sediment and aqueous matrices. Comparative analysis revealed a soil-type-dependent gradient in matrix effect intensity: black soil > brown soil > red soil.
3.4.3. Isotope-Labeled Surrogate Quantitation Validation
The matrix effect can distort real recovery through enhancing or suppressing MS signals, resulting in method inaccuracy. To overcome the influence of matrix effects, the isotope-labeled dilution method is considered the most effective strategy for accurate quantitation. In practice, except for expensive purchase prices, most target organic compounds do not have identified corresponding isotope-labeled compounds due to synthesis difficulty. Under these circumstances, non-isotopic “analogues” or “surrogates” are commonly used as substitutes that have similar chemical properties, chromatographic behavior, and MS signal intensity as the target substances but are not present in sample matrices. USEPA Method 1694 proves the effectiveness of the surrogate quantitation method [
53], in which 17 surrogates were used to represent 65 target antibiotics in water, soil, and sediment samples.
In this study, we validated and proposed a quantitation method combining the isotope-labeled dilution method and surrogate method. Namely, besides indicating and calculating corresponding target compounds, six isotope-labeled standards were also used as surrogates for other targets with similar chromatographic characteristics, MS behavior, matrix effect, and spiking recoveries. For example, Fenbendazole-D
3 adjusted the recoveries of Fenbendazole and also Febantel (the same Benzimidazole class). Metronidazole-D
4 adjusted the recoveries of Metronidazole and also Ronidazole, Tinidazole, Ornidazole, and Secnidazole (all belonging to the nitroimidazole class). Detailed calibration results can be found in
Tables S5-1–S5-7.
3.4.4. Recovery and Precision
The method demonstrated robust performance for the majority of target analytes across all investigated matrices (water, sediment, soil). Following quantification using the external standard method and application of the isotope-labeled surrogate quantitation method where applicable (
Section 3.4.3), 20 out of the 21 imidazole analytes consistently achieved acceptable recoveries (60–120%) at the three spiking levels (2×, 10×, and 20× MQLs) in the majority of matrix–concentration combinations tested. This high level of performance was observed in both freshwater and seawater, freshwater and seawater sediments, and across the diverse soil types (black soil, brown soil, red soil). In stark contrast, Triclabendazole (TCLZ) exhibited persistently suboptimal recovery across all matrices and spiking levels, ranging from 15.77% to 44.24%. Isolated instances of lower recovery (52.21–57.74%) were also noted for 5-Chloro-1-methyl-4-nitroimidazole (CMZ) and Ornidazole (ONZ) exclusively in black soil, and for Febantel (FEB) (53.62–55.63%) exclusively in seawater sediment. Comprehensive average recovery data for each analyte, matrix, and spiking level are provided in
Tables S5-1–S5-7.
Precision, evaluated through repeatability studies (
n = 4) at the three spiking concentrations (2×, 10×, 20× MQL), was also found to be satisfactory for the majority of targets. Applying the precision criteria defined by AOAC Standard 2016.05 (RSD ≤ 15% for ≥100 μg/kg, RSD ≤ 21% for 10–100 μg/kg, RSD ≤ 30% for <10 μg/kg) [
54], 20 out of the 21 target compounds exhibited acceptable repeatability (RSD < 21%) under the established criteria across all seven matrix conditions (freshwater, seawater, freshwater sediment, seawater sediment, black soil, brown soil, red soil). The relative standard deviations (RSDs) for these 20 analytes typically ranged from <1% to approximately 15% in all matrices. Conversely, Triclabendazole (TCLZ) exhibited persistently elevated RSDs (2.52–31.56%) across all matrices, exceeding the 30% threshold at sub-10 μg/kg levels in four systems.
Based on the comprehensive recovery and precision evaluation across multiple environmental matrices (aqueous, sediment, and soil samples), 20 out of 21 imidazole analytes demonstrated acceptable recoveries (60–120%) and compliant precision (RSD < 21%) under AOAC Standard 2016.05 criteria, confirming the robustness of the analytical method for most targets. Notably, Triclabendazole exhibited consistently low recoveries across all matrices (29.24–44.24%), which may be attributed to its high lipophilicity (log Kow > 4) and strong adsorption to matrix components that hindered efficient extraction. Despite this limitation, we intentionally included it in the analytical panel to provide a comprehensive assessment of imidazole compounds. This inclusion demonstrates the method’s applicability for screening a broad spectrum of analytes while transparently reporting compounds requiring further optimization.
3.5. Method Application
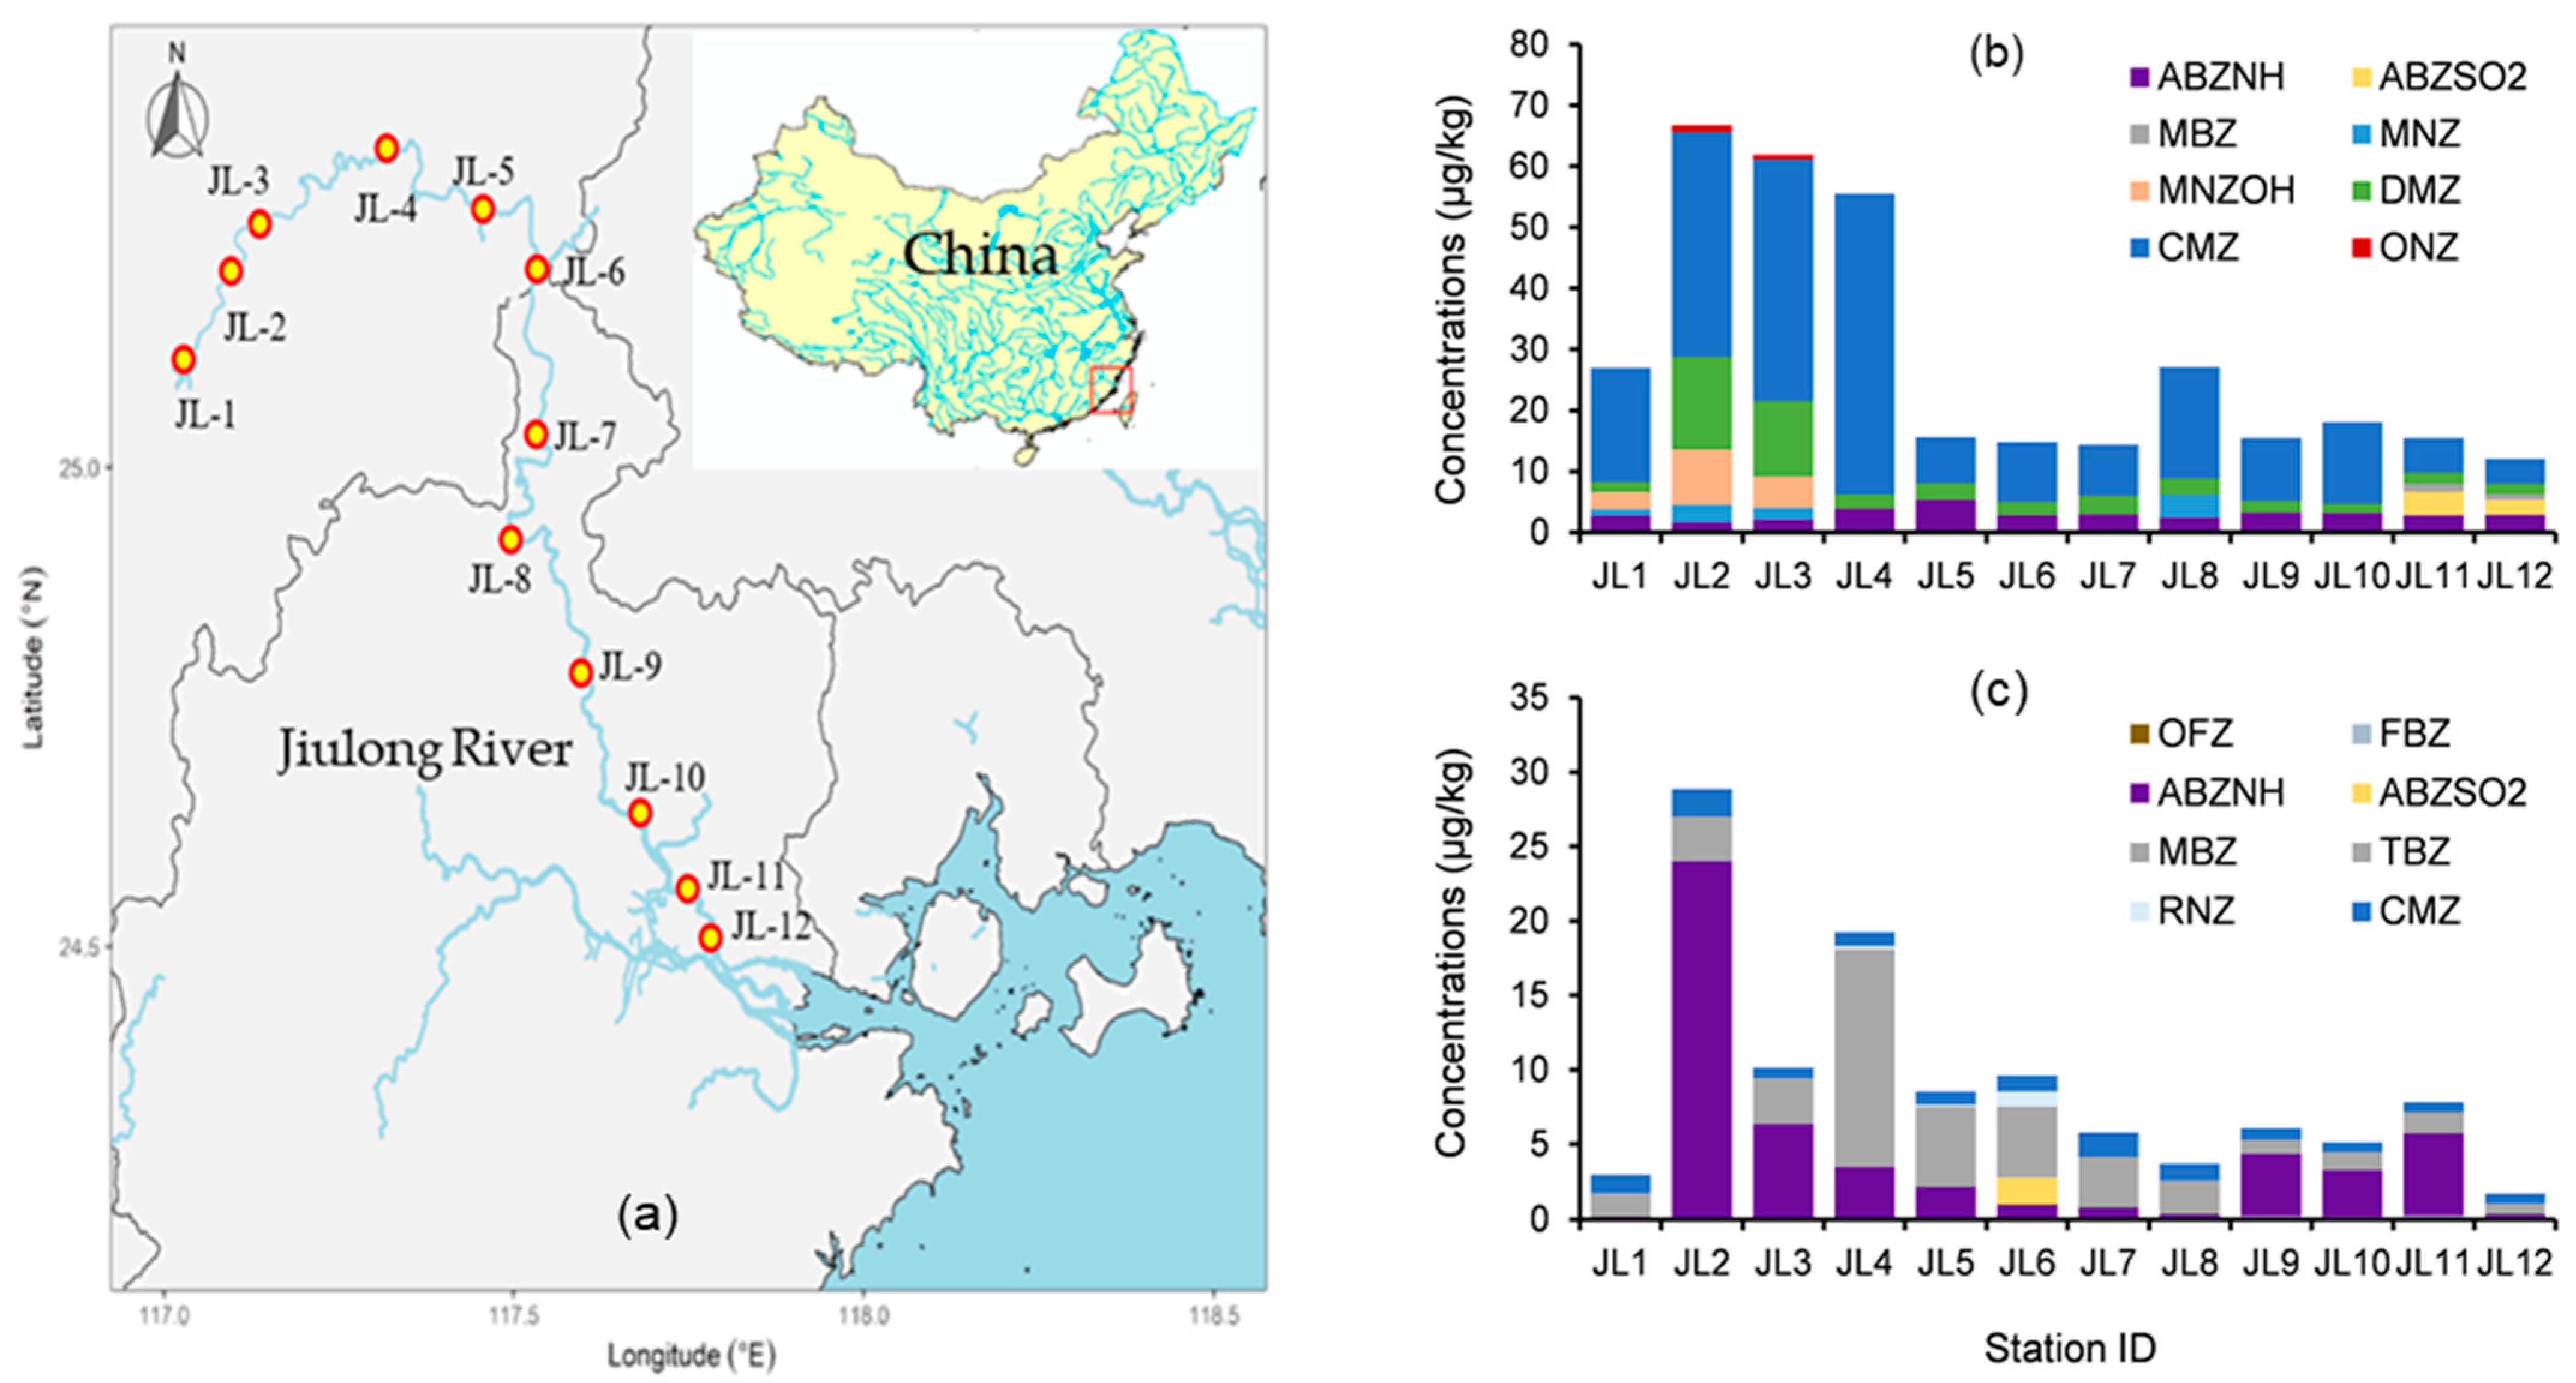
To assess the method’s applicability and reliability, surface freshwater (0.2–2 m depth) and corresponding sediment samples were collected from 12 sites along the Jiulong River, Fujian Province, China, and analyzed. Six isotope-labeled surrogates, with duplicates for each sample, one procedural blank, and three random spiking samples, were conducted as quality control, and all data met requirements. The detection and distribution of target imidazoles in surface freshwater and corresponding sediment samples from Jiulong River are shown in
Figure 7 (comprehensive data in
Tables S6-1 and S6-2).
Eight analytes were identified in surface water, comprising three benzimidazoles— 2-amino-5-propylsulphonylbenzimidazole (ABZNH), Albendazole sulfone (ABZSO2), and Mebendazole (MBZ)—and five nitroimidazoles: Metronidazole (MNZ), Hydroxy-metronidazole (MNZOH), Dimetridazole (DMZ), 5-Chloro-1-methyl-4-nitroimidazole (CMZ), and Ornidazole (ONZ). Among these, ABZNH, DMZ, and CMZ were ubiquitous across all 12 sampling stations. Peak concentrations were observed for CMZ (49.29 μg·kg−1 at station JL-04) and DMZ (15.19 μg·kg−1 at JL-03), while all other analytes remained below 10 μg·kg−1.
Sediment analysis detected eight analytes, dominated by six benzimidazoles—Oxfendazole (OFZ), Fenbendazole (FBZ), ABZNH, ABZSO2, MBZ, and Thiabendazole (TBZ)—and two nitroimidazoles (Ronidazole and CMZ). ABZNH, MBZ, TBZ, and CMZ were pervasive at all stations, with ABZNH exhibiting the highest concentration (24.01 μg·kg−1 at J02), followed by TBZ (14.40 μg·kg−1 at J04). All other sediment contaminants registered below 2 μg·kg−1. Critically, ABZNH, ABZSO2, and MBZ were co-detected in both matrices.
The detected contaminant levels suggest limited immediate ecological risks based on a preliminary assessment. This conclusion is supported by risk quotients (RQs) derived from published Predicted No-Effect Concentration (PNEC) values: the peak concentration of CMZ in water (49.29 ng·L
−1 at J04) yielded an RQ of 0.038 relative to Metronidazole PNEC
water (1300 ng·L
−1) [
17], while the highest sediment level of ABZNH (24.01 μg·kg
−1 at J02) corresponded to an RQ of 0.037 via sediment–water partitioning. Spatial patterns further revealed strong correlations with anthropogenic activities, where agricultural zones exhibited peak veterinary drug levels (e.g., J04 with CMZ at 49.29 ng·L
−1 in water and TBZ at 14.40 μg·kg
−1 in sediment), urban centers showed human pharmaceuticals (e.g., J03 with MNZ/ONZ), and downstream sites demonstrated persistent residues from basin-wide transport (e.g., J12 with CMZ at 0.67 μg·kg
−1 in sediment). These findings confirm the method’s dual utility for environmental risk screening and pollution source tracking, directly linking contaminant distribution to land use pressures.
4. Conclusions
This study successfully developed and validated a highly sensitive and robust analytical method based on solid-phase extraction (SPE) coupled with liquid chromatography–tandem mass spectrometry (HPLC-MS/MS) for the simultaneous determination of 21 imidazole compounds (12 benzimidazoles, 9 nitroimidazoles) across key environmental matrices: water, sediment, and soil. The method’s significant advantages include comprehensive multi-class coverage, exceptional sensitivity (method quantification limits: <1.0 ng·L−1 for water, <1.0 μg·kg−1 for solids), and effective mitigation of significant matrix effects (ranging from -57% to 8%) through the strategic use of six isotope-labeled surrogate standards. Validation confirmed high accuracy (recoveries: 60–120% for 20/21 analytes post-isotope correction) and precision (RSD < 15% for 20/21 analytes), meeting stringent AOAC Standard 2016.05 criteria. Its successful application to Jiulong River samples demonstrated practical utility, revealing spatially correlated contamination (e.g., CMZ: 49.29 ng·L−1 in water; ABZNH: 24.01 μg·kg−1 in sediment) linked to anthropogenic sources.
While demonstrating high performance for most analytes, a limitation was observed in the suboptimal recovery of Triclabendazole (15–44%), attributed to its high lipophilicity and strong matrix interactions. Furthermore, the SPE procedure, while effective, can be time-consuming for routine high-throughput monitoring. Future work should focus on automating the SPE workflow to enhance efficiency, conducting interlaboratory validation to confirm robustness, and extending the method to include key metabolites. This validated protocol provides a powerful standardized tool for tracking the distribution, partitioning, and ecological risks of these emerging contaminants across interconnected environmental compartments, supporting informed regulatory and remediation efforts.


