Article

Hydrochemical Characteristics and Formation Mechanisms of Groundwater in the Nanmiao Emergency Groundwater Source Area, Yichun, Western Jiangxi, China

by
Shengpin Yu
1,2,
Tianye Wang
3,
Ximin Bai
1,2,*,
Gongxin Chen
4,
Pingqiang Wan
1,2,
Shifeng Chen
1,2,
Qianqian Chen
1,2,
Haohui Wan
1,2 and
Fei Deng
1,2
1
Hydrogeological Brigade of Jiangxi Geological Bureau, Nanchang 330095, China
2
Jiangxi Institute of Survey & Design Ltd., Nanchang Key Laboratory of Hydrogeology and High Quality Groundwater Resources Exploitation and Utilization, Nanchang 330095, China
3
School of Water Conservancy and Transportation, Zhengzhou University, 100 Science Avenue, Zhengzhou 450001, China
4
School of Water Resources and Environmental Engineering, East China University of Technology, Nanchang 330013, China
*
Author to whom correspondence should be addressed.
Water 2025, 17(14), 2063; https://doi.org/10.3390/w17142063
Submission received: 10 June 2025 / Revised: 3 July 2025 / Accepted: 8 July 2025 / Published: 10 July 2025
(This article belongs to the Special Issue Advances in Surface Water and Groundwater Simulation in River Basin)

Abstract

The Nanmiao Emergency Groundwater Source Area, rich in H2SiO3, serves as a strategic freshwater reserve zone in western Jiangxi Province. However, the mechanisms underlying groundwater formation in this area remain unclear. This study applied a combination of statistical analysis, isotopic tracing, and hydrochemical modeling to reveal the hydrochemical characteristics and origins of groundwater in the region. The results indicate that Na+ and Ca2+ dominate the cations, while HCO3 and Cl dominate the anions. Groundwater from descending springs is characterized by low mineralization and weak acidity, with hydrochemical types of primarily HCO3–Na·Mg and HCO3–Mg·Na·Ca. Groundwater from boreholes is weakly mineralized and neutral, with dominant hydrochemical types of HCO3–Ca·Na and HCO3–Ca·Na·Mg, suggesting a deep circulation hydrogeochemical process. Hydrogen and oxygen isotope analysis indicates that atmospheric precipitation is the primary recharge source. The chemical composition of groundwater is mainly controlled by rock weathering, silicate mineral dissolution, and cation exchange processes. During groundwater flowing, water and rock interactions, such as leaching, cation exchange, and mixing, occur. This study identifies the recharge sources and circulation mechanisms of regional groundwater, offering valuable insights for the sustainable development and protection of the emergency water source area.

1. Introduction

Groundwater accounts for 99% of the global terrestrial liquid freshwater reserves and is one of the most important components of the hydrological cycle [1,2]. With characteristics such as abundant quantity, stable dynamics, and good quality, groundwater functions as a natural reservoir and has become one of the most critical water sources for natural ecosystems as well as human life and production [3]. Especially with the intensification of climate change and human activities, many regions have experienced increased non-stationarity in surface hydrological processes [4,5], along with more frequent hydrological extremes such as droughts and floods [6], leading to greater spatiotemporal variability in water resources [7]. As a result, the importance of groundwater resources has become even more pronounced. For example, during the summer and autumn of 2022, the Yangtze River Basin in China experienced the most severe drought since the beginning of complete meteorological records in 1961, with surface runoff decreasing by more than 50% [8]. This posed serious threats to local drinking water security, food safety, and ecological stability, constraining socioeconomic development and significantly impacting daily life and production [9]. As a relatively stable water source, groundwater serves as the most ideal supply during extreme droughts and major emergencies, playing a crucial role in sustaining drinking water and agricultural drought resistance under extreme climatic conditions [10,11]. Therefore, studying the formation mechanisms of groundwater is of great significance for the sustainable development of human society [12,13].
The chemical composition and characteristics of groundwater are the result of its interaction with surrounding rock media. They not only determine the availability of groundwater resources but also indicate the geochemical environment of groundwater recharge and migration, acting as a “natural tracer” for deciphering its formation mechanisms [13,14]. Among these, the enrichment process of H2SiO3 is particularly critical [15]. Studies have shown that in granitic regions, H2SiO3 mainly originates from the incongruent dissolution of silicate minerals (e.g., potassium feldspar, biotite), and its concentration is controlled by the degree of rock weathering, CO2 partial pressure, and hydrodynamic conditions [16,17]. For instance, in the basalt area of Chengde, Hebei, H2SiO3 enrichment is directly related to silicate mineral hydrolysis [18], while in the granite area of Zhao’an, Fujian, deep circulation along fault zones has been found to significantly increase H2SiO3 content [19]. Notably, hydrochemical differentiation often occurs between shallow phreatic water and deep confined water in granitic fracture systems: the former, rapidly recharged by atmospheric precipitation, exhibits lower pH and total dissolved solids (TDSs), whereas the latter, influenced by prolonged water–rock interactions, shows higher Ca2+ proportions and elevated TDSs. Therefore, investigating the hydrochemical characteristics and formation mechanisms of groundwater provides essential guidance for the protection and sustainable utilization of groundwater sources [20]. Therefore, current research on emergency water sources mainly focuses on hydrochemical studies, while the integrated application of isotopes and hydrochemical modeling is rarely reported [21,22].
The Nanmiao Emergency Groundwater Source Area (NEGSA) in Yichun is a strategic freshwater reserve in western Jiangxi, hosted within the fracture system of Early Silurian biotite monzogranite. Its H2SiO3 content (34.07–42.75 mg/L) meets China’s national standards for drinking mineral water. Groundwater in this area is structurally controlled by NNE-trending faults, forming linear water-rich zones with significant hydrochemical differentiation between shallow phreatic water and deep confined water. Existing research has primarily focused on porous aquifers [23,24], lacking in-depth analysis of the hydrochemical evolution pathways in granitic fracture systems. This has resulted in an unclear understanding of the groundwater chemical characteristics and formation mechanisms in the area, hindering the scientific management of the emergency water source.
This study is based on hydrogeological surveys, systematically collecting groundwater samples (springs, boreholes) and isotopic data. Combined with hydrochemical analysis (major ions, H2SiO3), stable isotopes (δ18O, δD), and PHREEQC modeling, it aims to reveal the hydrochemical characteristics and controlling factors of groundwater in the NEGSA. By constructing a conceptual model of mineral dissolution–cation exchange, the study clarifies the hydrogeochemical pathways of H2SiO3 enrichment, providing a theoretical basis for the development of emergency water sources in granitic regions.

2. Study Area

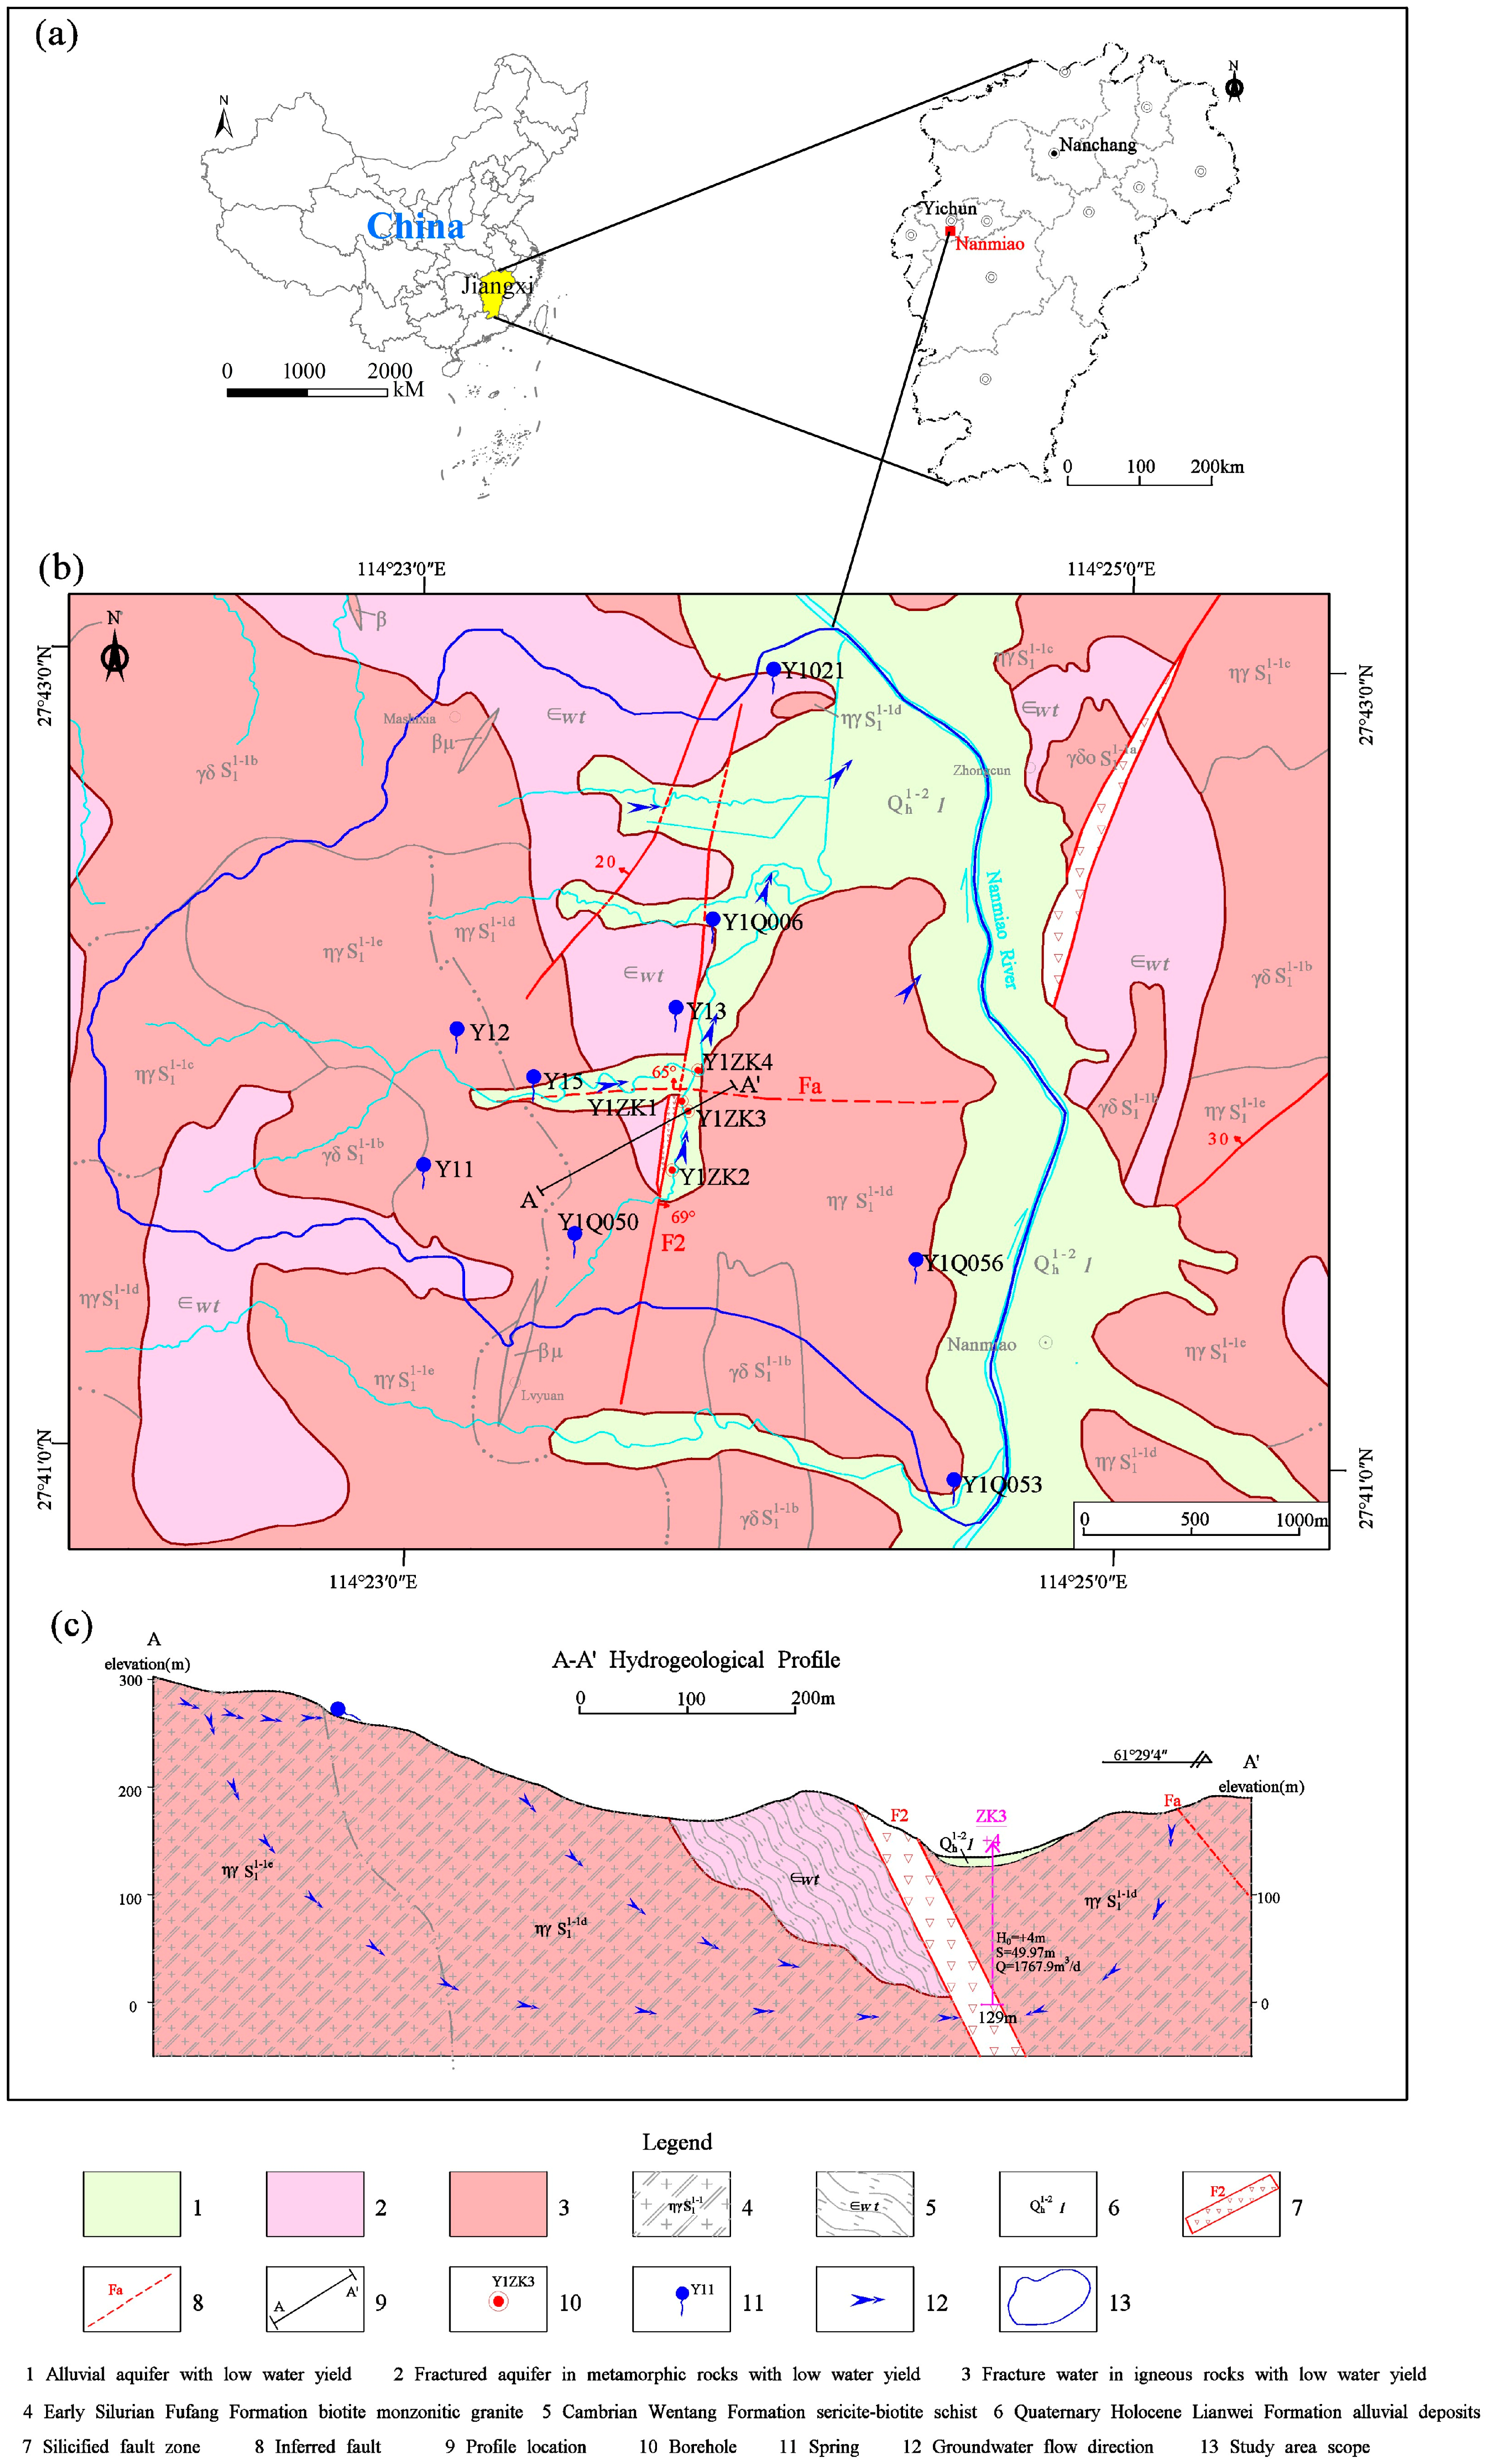
2.1. Location, Climate and Hydrologic Features

The NEGSA is located in Nanmiao Town, Yuanzhou District, Yichun City, western Jiangxi Province, situated in the eastern part of the Wugong Mountain Range (Figure 1). The study area generally features higher terrain in the west and south, with lower elevations in the east and north, predominantly characterized by tectonically denuded hilly landforms. The region experiences a central subtropical monsoon climate, with a multi-year average precipitation of 1635.5 mm [25], while annual evaporation reaches 1268.2 mm. The rainfall distribution is uneven throughout the year, with 54% of the annual precipitation concentrated between March and June. The surface water system in the study area is relatively well-developed, mainly consisting of the tributaries of the Nanmiao River, which generally flows from south to north and moves into the Yuan River.

2.2. Geological Setting and Hydrogeology

The study area is situated within the Wugongshan Uplift of the Cathaysian Plate. The exposed strata include the Lianwei Formation of the Quaternary Holocene Series and the Wentang Rock Formation of the Cambrian System [26]. Magmatic rocks are relatively well-developed in the region, primarily consisting of the Fufang Suite from the early Early Silurian. Two major faults are developed within the area (Figure 1): The NNE-trending fault F2, characterized by a silicified cataclastic zone, dips southeastward with an inclination angle of approximately 69° [27,28]. It is a tensile fault and serves as the primary water-rich structure. The nearly E–W-trending fault Fa, which is inferred, dips northward with an inclination angle of about 65°. These structures act as channels and storage spaces for groundwater migration.
The types of groundwater in the area include pore water in unconsolidated rocks, fissure water in metamorphic rocks, and fissure water in magmatic rocks (Figure 1). Pore water in the alluvial aquifer is distributed in the intermountain valleys and occurs within the alluvial strata of the Quaternary Holocene Series (Qh1–2l), exhibiting weak water-yielding properties. Fissure water in metamorphic rocks is distributed in the northern and western parts of the study area, with the aquiferous rock group being the two-mica schist of the Wentang Rock Formation (Єwt) of the Cambrian System, also showing weak water-yielding properties. Fissure water in magmatic rocks is widely distributed, with the primary aquiferous rock group being the biotite monzogranite of the Fufang Suite (ηγS1–1) from the early Early Silurian, exhibiting moderate water-yielding properties [27].
Groundwater enrichment in the study area is mainly controlled by NNE-trending and nearly E–W-trending structures. Multiple boreholes in the hanging wall of the NNE-trending structure yield single-well water inflows ranging from 1136 to 1768 tons/day. The overall groundwater flow direction in the area is from southwest to northeast, finally discharged to the direction of Nanmiao River, forming a relatively complete groundwater flow system. In the study area, weathering fractures dominate the surface, where down-sinking springs are prevalent. Conversely, structural fractures are primarily responsible for the confined water in the deeper regions. The water abundance in the region is moderate.

3. Materials and Methods

3.1. Field Sampling and Analytical Techniques

From August to October 2021, a total of 10 groundwater samples were collected from springs (unconfined water) and boreholes (confined water) within and around the study area, including 5 samples from springs and 5 from boreholes (locations are shown in Figure 1). The water quality analysis indicators encompassed 13 parameters: pH, TDS, K+, Na+, Ca2+, Mg2+, Cl, SO42−, CO32−, HCO3, F, NO3, and H2SiO3. Building on this foundation, in April 2023, water samples were collected from springs and boreholes at different elevations, with a total of 5 samples collected for stable hydrogen and oxygen isotopes (18O and D). Additionally, one representative borehole, Y1ZK4, was selected to collect a water sample for age isotope (3H) analysis. In May 2025, further supplementary samples were collected from boreholes Y1ZK2 and Y1ZK4. Both samples were analyzed for stable hydrogen and oxygen isotopes (18O and D) and age isotope (3H).
The water quality testing was conducted by the Experimental Testing Center of Jiangxi Institute of Survey and Design Ltd. (Nanchang, China) The pH was determined using the glass electrode method, K+ and Na+ were measured by flame emission spectrometry, Ca2+, Mg2+, Cl, SO42−, CO32−, and HCO3 were determined by titration, and SO42−, NO3, and H2SiO3 were measured using spectrophotometry.
The isotope sample testing was carried out by the Wuhan Center of China Geological Survey and Third Institute of Oceanography, MNR. Specifically, δ18O and δD were measured using a liquid water isotope analyzer (LGR, los gatos research, San Jose, CA, USA), employing the Vienna Standard Mean Ocean Water (V-SMOW) as the standard, with detection precisions of ±0.06‰ and ±0.3‰, respectively. 3H was measured using an ultra-low background liquid scintillation counter (Quantulus-1220), with a detection precision of less than 5%.

3.2. Data Quality Reliability Test

In this study, the reliability of water quality data was tested using the cation–anion balance formula, which is
E = Z · m c a t i o n Z · m a n i o n Z · m c a t i o n + Z · m a n i o n × 100 %
Here, E represents the charge balance error (%), m is the molar concentration of ions (both of cations and anions) (mol/L), and Z is the ionic charge number. The principle of this formula is based on the electroneutrality of the solution; that is, the total positive charge carried by cations (TZ+ = K+ + Na+ + 2Ca2+ + 2Mg2+) in the solution should be equal to the total negative charge carried by anions (TZ− = Cl + 2SO42− + 2CO32− + HCO3 + F + NO3). By calculating the magnitude of the charge balance error E, the reliability of the hydrochemical test results can be determined. When E is less than 5%, the hydrochemical test results are considered reliable.
According to the sample test results, the total cation charge ranges from 0.793 to 2.798 meq/L, with an average value of 1.796 meq/L. And the total anion charge ranges from 0.794 to 2.799 meq/L, with an average value of 1.797 meq/L. The near-equivalence of total cation/anion charges and minimal charge balance errors (0.02–1.69%) confirms the reliability of the hydrochemical test.

3.3. Research Methods

In this study, a combination of mathematical statistics and Piper diagrams was employed to identify the chemical characteristics and types of different groundwater bodies. The hydrogen and oxygen isotope tracing method was utilized to analyze the recharge characteristics of groundwater. The groundwater chemical evolution diagram method (including Gibbs diagrams, rock weathering end-member diagrams, silicate stability field diagrams, major ion ratio coefficient diagrams, etc.) was used to identify the main factors affecting the chemical characteristics of groundwater and explore the hydrochemical formation process of H2SiO3 enrichment in groundwater. The PHREEQC model was adopted to analyze the mineral dissolution equilibrium state and reveal the water–rock interaction mechanism.

4. Results

4.1. Hydrochemical Characteristics and Types

4.1.1. Characteristics of Hydrochemical Components

The statistical data of hydrochemical components in groundwater samples from the study area are shown in Table 1. The pH of the descending spring water ranges from 5.84 to 6.23, with an average value of 6.01, indicating a weakly acidic nature. The annual average pH value of precipitation in Yichun City from 2010 to 2021 ranged from 4.7 to 6.0 [29,30]. The descending spring water in the area is recharged by atmospheric precipitation infiltration, and with a short runoff path, in areas lacking carbonate rocks, the groundwater still retains part of the acidity of rain. The TDS ranges from 41.16 to 57.23 mg/L, with an average value of 49.45 mg/L, classifying it as fresh water. The overall content of major cations in the spring water shows the order of Na+ > Ca2+ > Mg2+ > K+, with Na+ being the dominant cation, followed by Ca2+. The overall content of major anions shows the order of HCO3− > Cl > NO3− > SO42− > F, with HCO3 being the dominant anion, followed by Cl. The content of H2SiO3 in the spring water ranges from 34.07 to 42.75 mg/L, with an average value of 39.51 mg/L. The concentration of NO3 ranges from 0.89 to 17.72 mg/L, and the coefficient of variation is greater than 1, indicating a strong degree of variation. This is mainly due to the abnormal NO3 concentration in spring point Y1Q056 (concentration of 17.72 mg/L). This spring point is located near farmland and residential areas and may be affected by human activities.
The pH of groundwater in the boreholes ranges from 6.40 to 7.73, with an average value of 7.18, showing a neutral nature on the whole. The TDS ranges from 74.21 to 151.07 mg/L, with an average value of 109.15 mg/L, classifying it as fresh water. The overall content of major cations in the groundwater in the boreholes shows the order of Ca2+ > Na+ > K+ > Mg2+, with Ca2+ being the dominant cation, followed by Na+. The overall content of major anions shows the order of HCO3 > Cl > SO42− > NO3 > F, with HCO3 being the dominant anion, followed by Cl. The content of H2SiO3 in the groundwater in the boreholes ranges from 31.73 to 39.13 mg/L, with an average value of 34.92 mg/L. The coefficients of variation of the hydrochemical components in the groundwater in the boreholes are all less than 1, indicating a moderate degree of variation. This shows that the hydrochemical components of deep confined water are stable.
The dominant anions in both the spring water and the groundwater in the boreholes are consistent, while there are slight differences in the dominant cations. This indicates that there are differences in the degree of water–rock interaction between shallow unconfined water and deep confined water. The water quality of deep confined water in the boreholes is generally better than that of the spring water, making it suitable as a source of domestic drinking water.

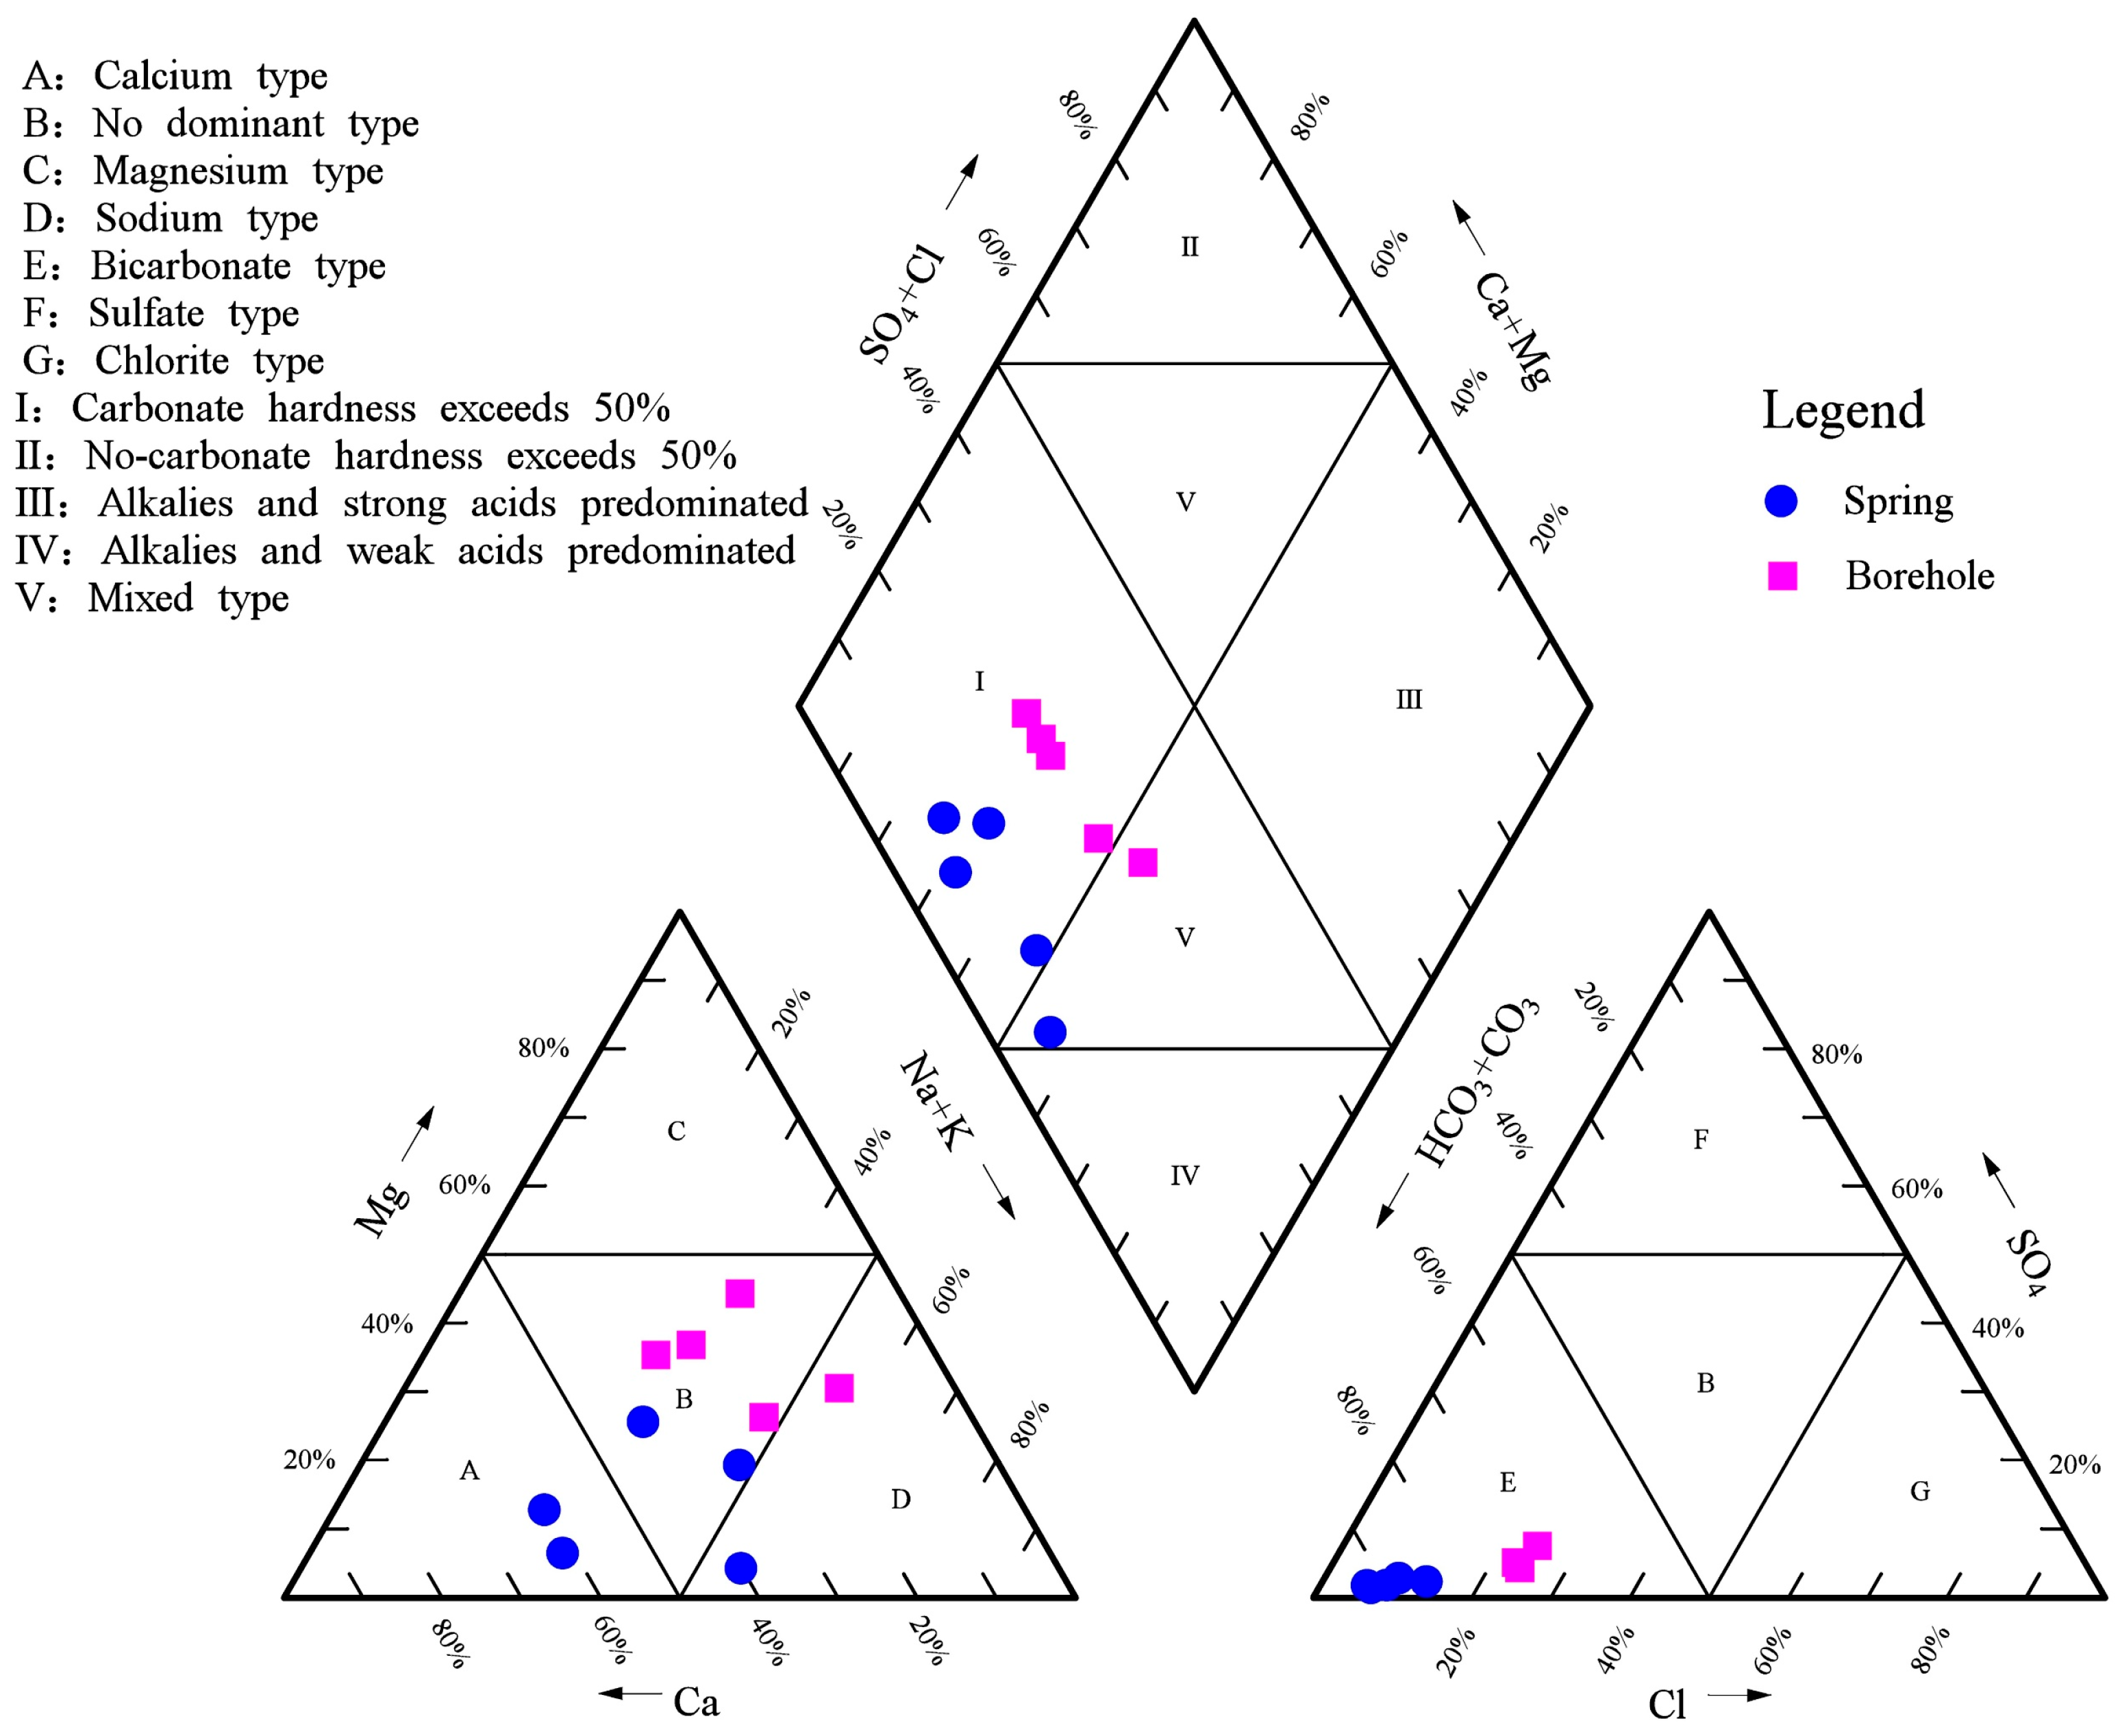
4.1.2. Characteristics of Hydrochemical Types

The Piper diagram (Figure 2) shows that in the cation trilinear diagram, the deep groundwater in the boreholes tends more towards the Ca2+ and Na+ end-members, while the spring water basically has no dominant type. The milligram-equivalent percentage of Mg2+ in the spring water is higher than that in the groundwater in the boreholes, indicating certain differences in cations between the two. In the anion trilinear diagram, both the groundwater in the boreholes and the spring water tend towards the HCO3 end-member, showing consistency. However, the milligram-equivalent percentage of HCO3 in the groundwater in the boreholes is higher than that in the spring water. In the main diamond diagram, the groundwater samples in the area are mainly located in Zone I, with carbonate hardness exceeding 50%. The hydrochemical properties of the groundwater are mainly dominated by alkaline earth metals and weak acids. According to the Shukalev hydrochemical classification of groundwater, the hydrochemical types of the spring water are mainly HCO3-Na·Mg and HCO3-Mg·Na·Ca. In contrast, the hydrochemical types of the groundwater in the boreholes are mainly HCO3-Ca·Na and HCO3-Ca·Na·Mg.

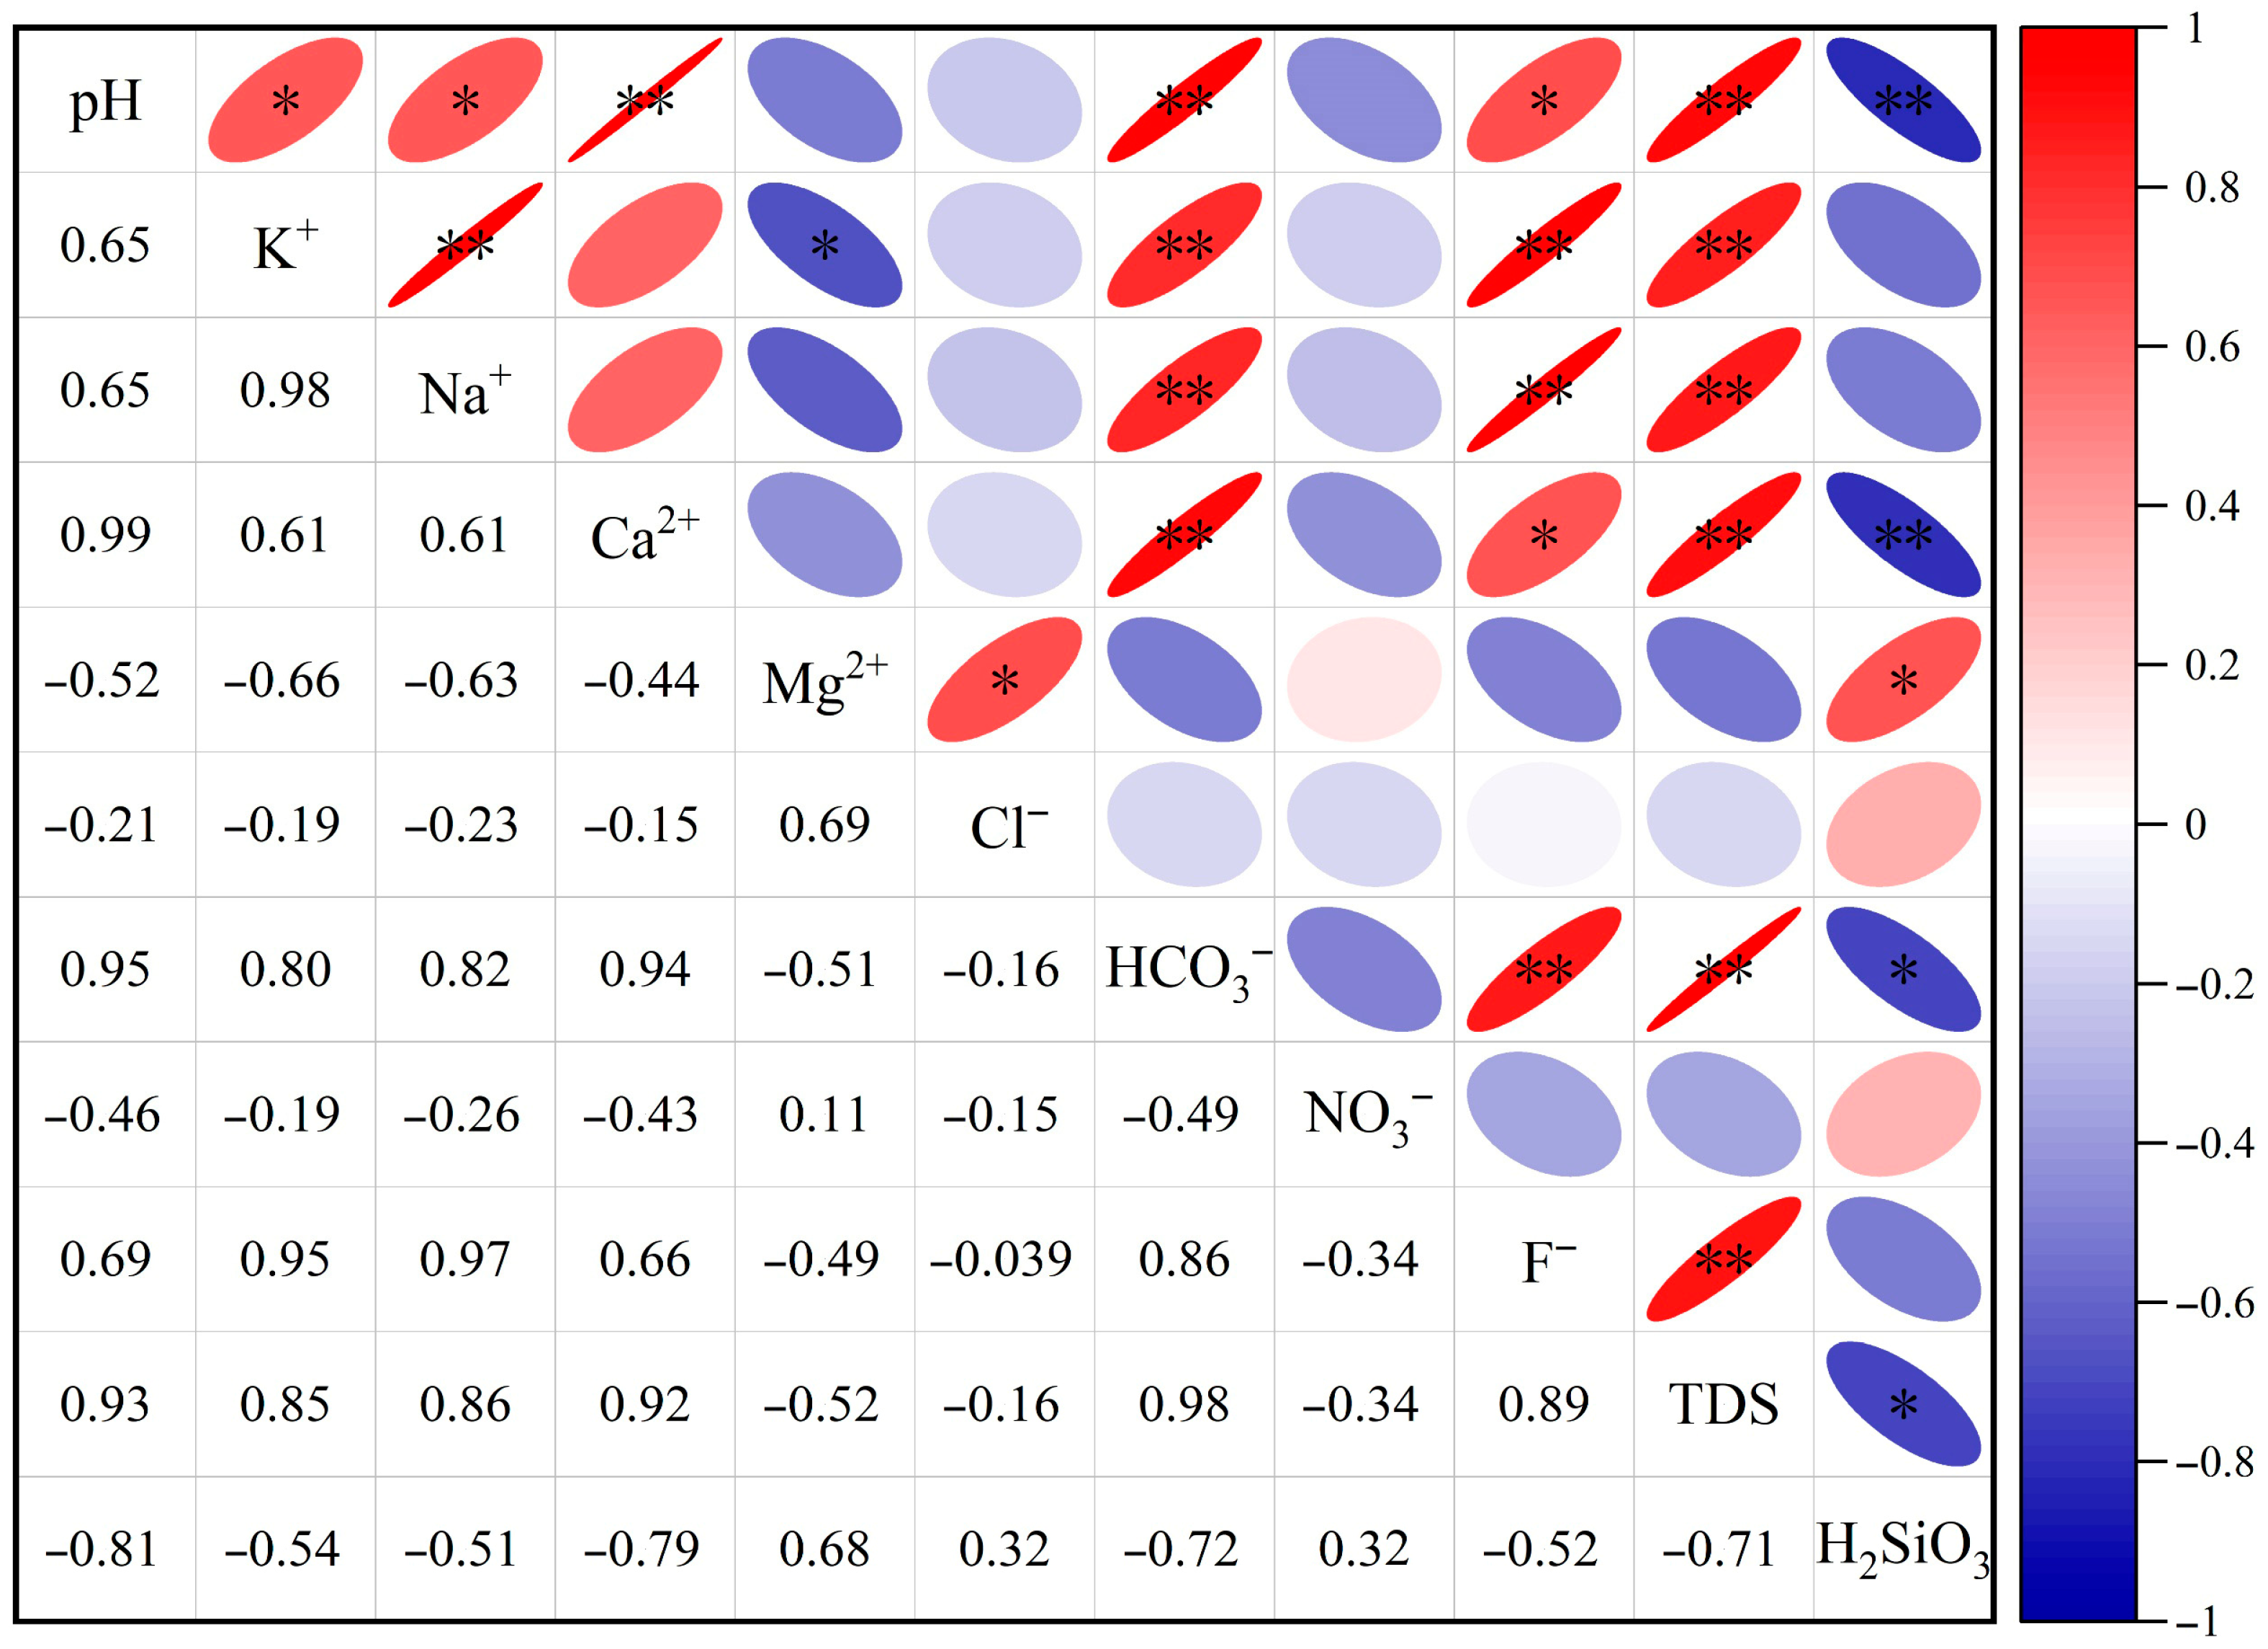
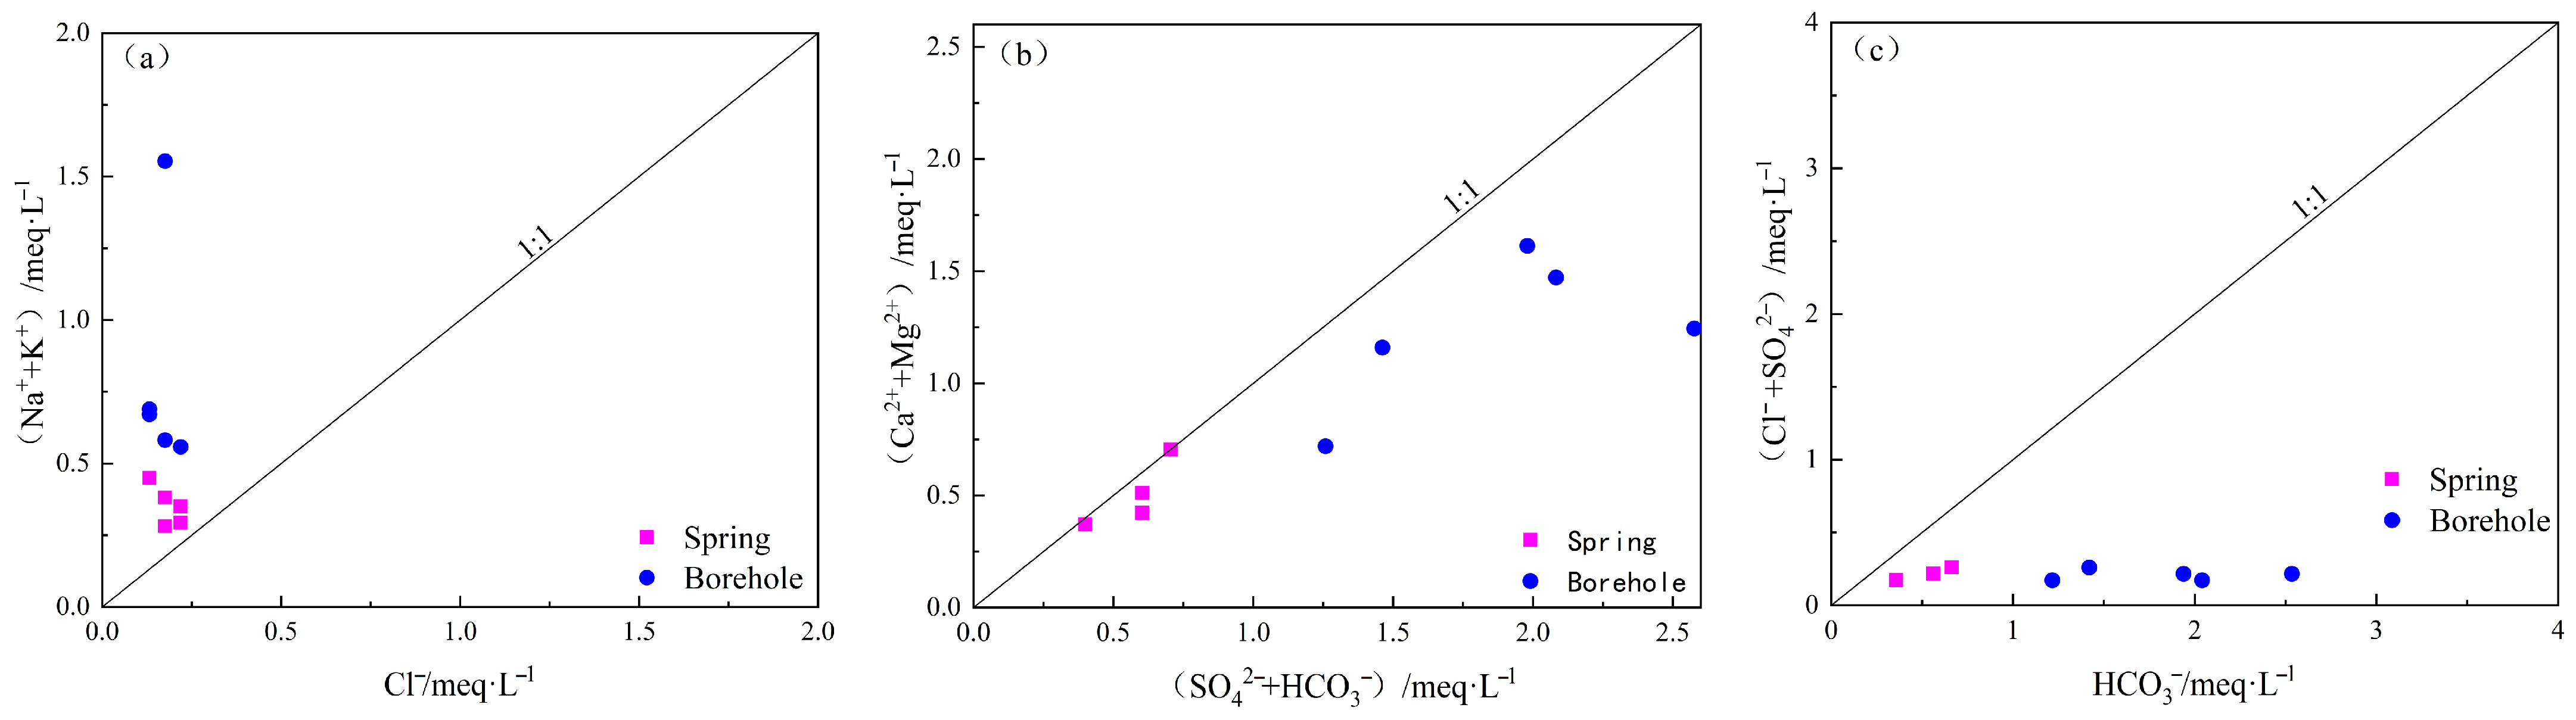
4.1.3. Ion Correlation Analysis

In hydrochemical analysis, when components exhibit significant correlations, it can be considered that these components share a certain homology and have similar migration and transformation pathways. As shown in Figure 3, in the groundwater of the study area, the TDS value has a significant positive correlation with K+, Na+, Ca2+, HCO3, and F, with correlation coefficients (r) greater than 0.85 (p < 0.01), and the maximum correlation coefficient reaching 0.98 (p < 0.01). This indicates that these ions make a significant contribution to TDSs. pH has a significant positive correlation with Ca2+ and HCO3, with correlation coefficients (r) greater than 0.95 (p < 0.01), suggesting that HCO3 in the groundwater can regulate pH, and pH has a certain control effect on the dissolution of anorthite in granite. HCO3 has a significant positive correlation with K+, Na+, and Ca2+, with correlation coefficients (r) greater than 0.65 (p < 0.01), and the maximum reaching 0.99 (p < 0.01), indicating that weathering and dissolution of silicate minerals may occur in the groundwater. H2SiO3 only has a relatively significant positive correlation with Mg, with a correlation coefficient (r) of 0.68 (p < 0.05), suggesting that magnesium-bearing silicate minerals (such as biotite) may be involved in weathering and dissolution.

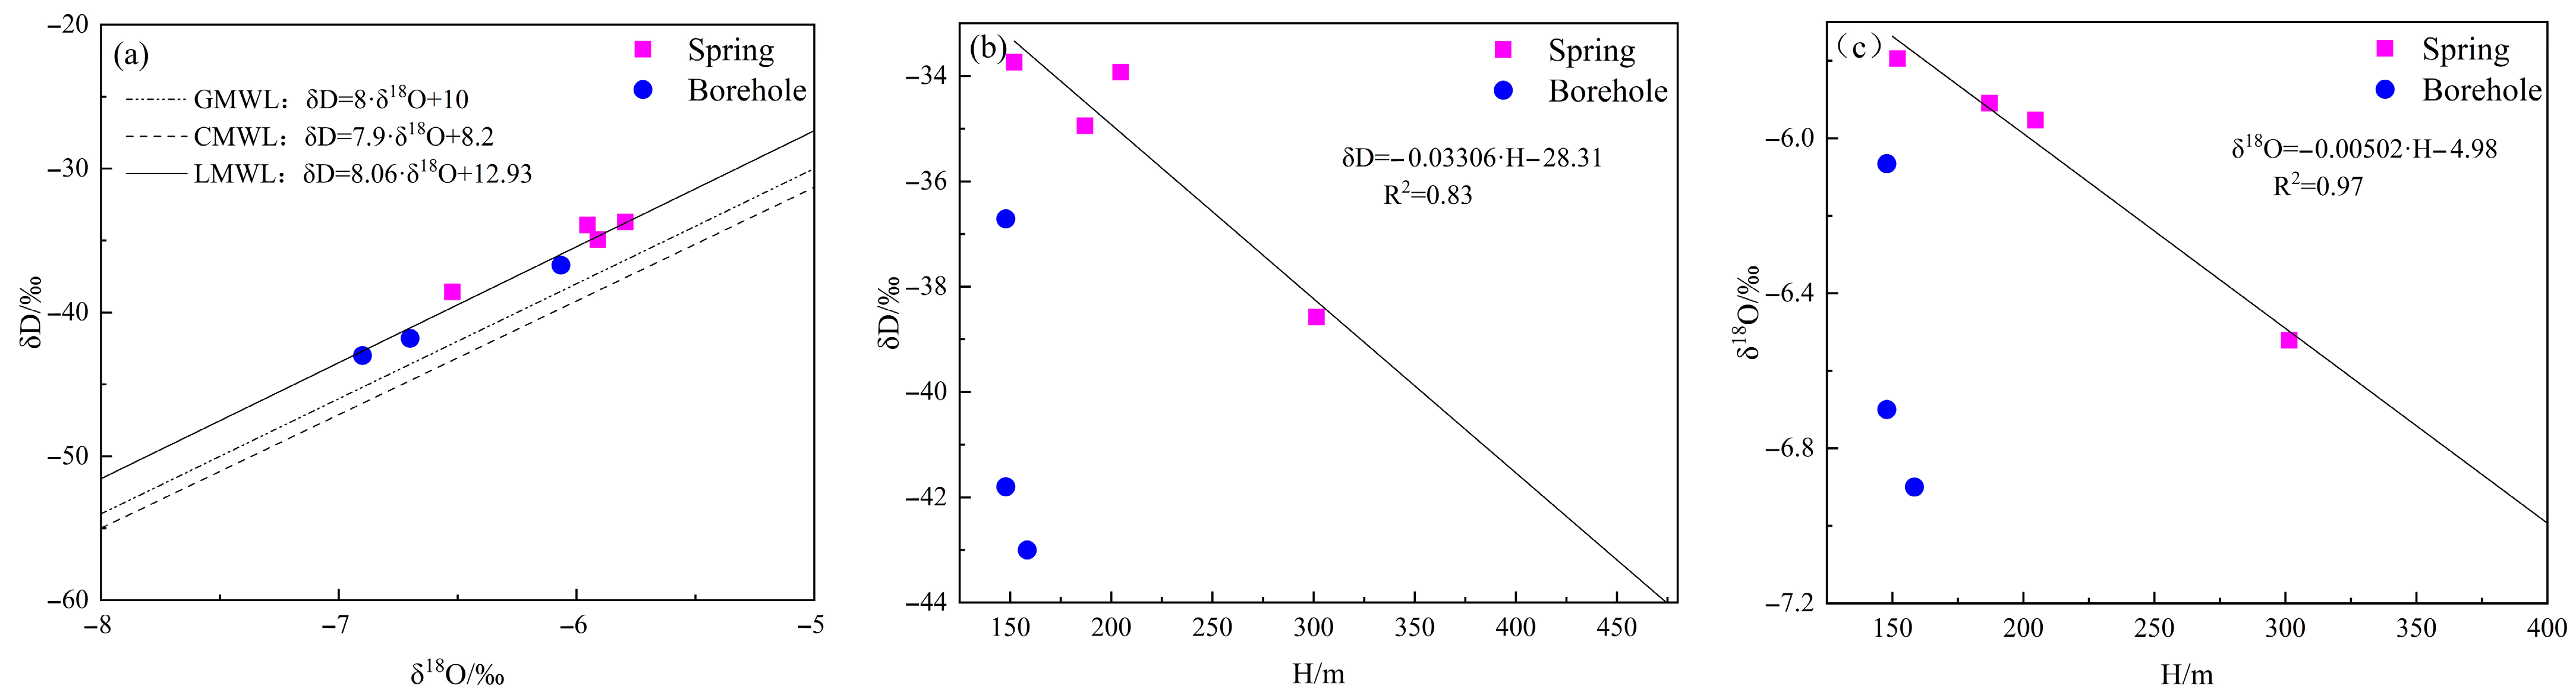
4.1.4. Characteristics of Hydrogen and Oxygen Isotopes

The δ18O values of groundwater in the study area range from −6.90‰ to −5.79‰, with an average of −6.26‰, and the δD values range from −43.00‰ to −33.74‰, with an average of −37.53‰ (Table 2). Figure 4a shows that the groundwater sample points in the study area are basically distributed near the local meteoric water line (LMWL, δD = 8.06 × δ18O + 12.93) in the Yichun area [31], indicating that the groundwater in the study area mainly originates from atmospheric precipitation.
The d-excess value (d = δD − 8 × δ18O) represents the circulation depth of groundwater underground and the intensity of water–rock interaction. The lower the d-excess of groundwater, the deeper the circulation depth and the stronger the water–rock interaction. The d-excess of the descending springs in the area ranges from 12.34‰ to 13.7‰, with an average of 13.06‰. The d-excess value of the deep groundwater in the boreholes ranges from 11.80‰ to 12.20‰, with an average of 11.94‰, which is lower than that of the descending springs. This indicates that there are certain differences in water–rock interaction between the two. The descending springs show a fast circulation, short flow path, and relatively weak water–rock interaction, while the deep groundwater in the boreholes shows a long-distance recharge source, long flow path, and stronger water–rock interaction.
The δD and δ18O values of precipitation exhibit an elevation effect; that is, the δD and δ18O values of atmospheric precipitation decrease with increasing altitude. Isotope samples of shallow groundwater (descending springs) with a short runoff path can represent the hydrogen and oxygen isotope (D and 18O) contents of local atmospheric precipitation. As shown in Figure 4b,c, the fitting of δD, δ18O, and elevation data of the descending springs in the study area shows that the δD elevation gradient of atmospheric precipitation in the area is −3.3‰/100 m, and the δ18O elevation gradient is −0.5‰/100 m. The fitting equations are δD = −0.03306 × H − 28.31 and δ18O = −0.00502 × H − 4.98. The recharge elevation of groundwater in the boreholes is estimated using the hydrogen and oxygen isotope contents of groundwater. The results show that the groundwater recharge elevation in the NEGSA is 313.78–368.83 m.
Tritium (3H) is a natural radioactive isotope of hydrogen. Tritium units (TUs) can be used to qualitatively determine the age, mixing mechanism, and renewal capacity of groundwater. Generally, when the tritium activity is <1 TU, it is old water before 1953; 1–3 TUs indicate old water mixed with new water in the past 10 years; 3–10 TUs represent new water in the past 10 years; 10–20 TUs indicate residual nuclear explosion tritium; and >20 TUs represent precipitation recharge around the 1960s [32,33]. The tritium activity of groundwater in boreholes in the study area is 1.78–2.5 TU, which is close to the threshold value of 3 TUs, indicating that the deep groundwater in the boreholes has been recharged by both old water and new water in the past 10 years, mainly showing modern water characteristics. This may be due to the mixing of older water retained in the fault zone.

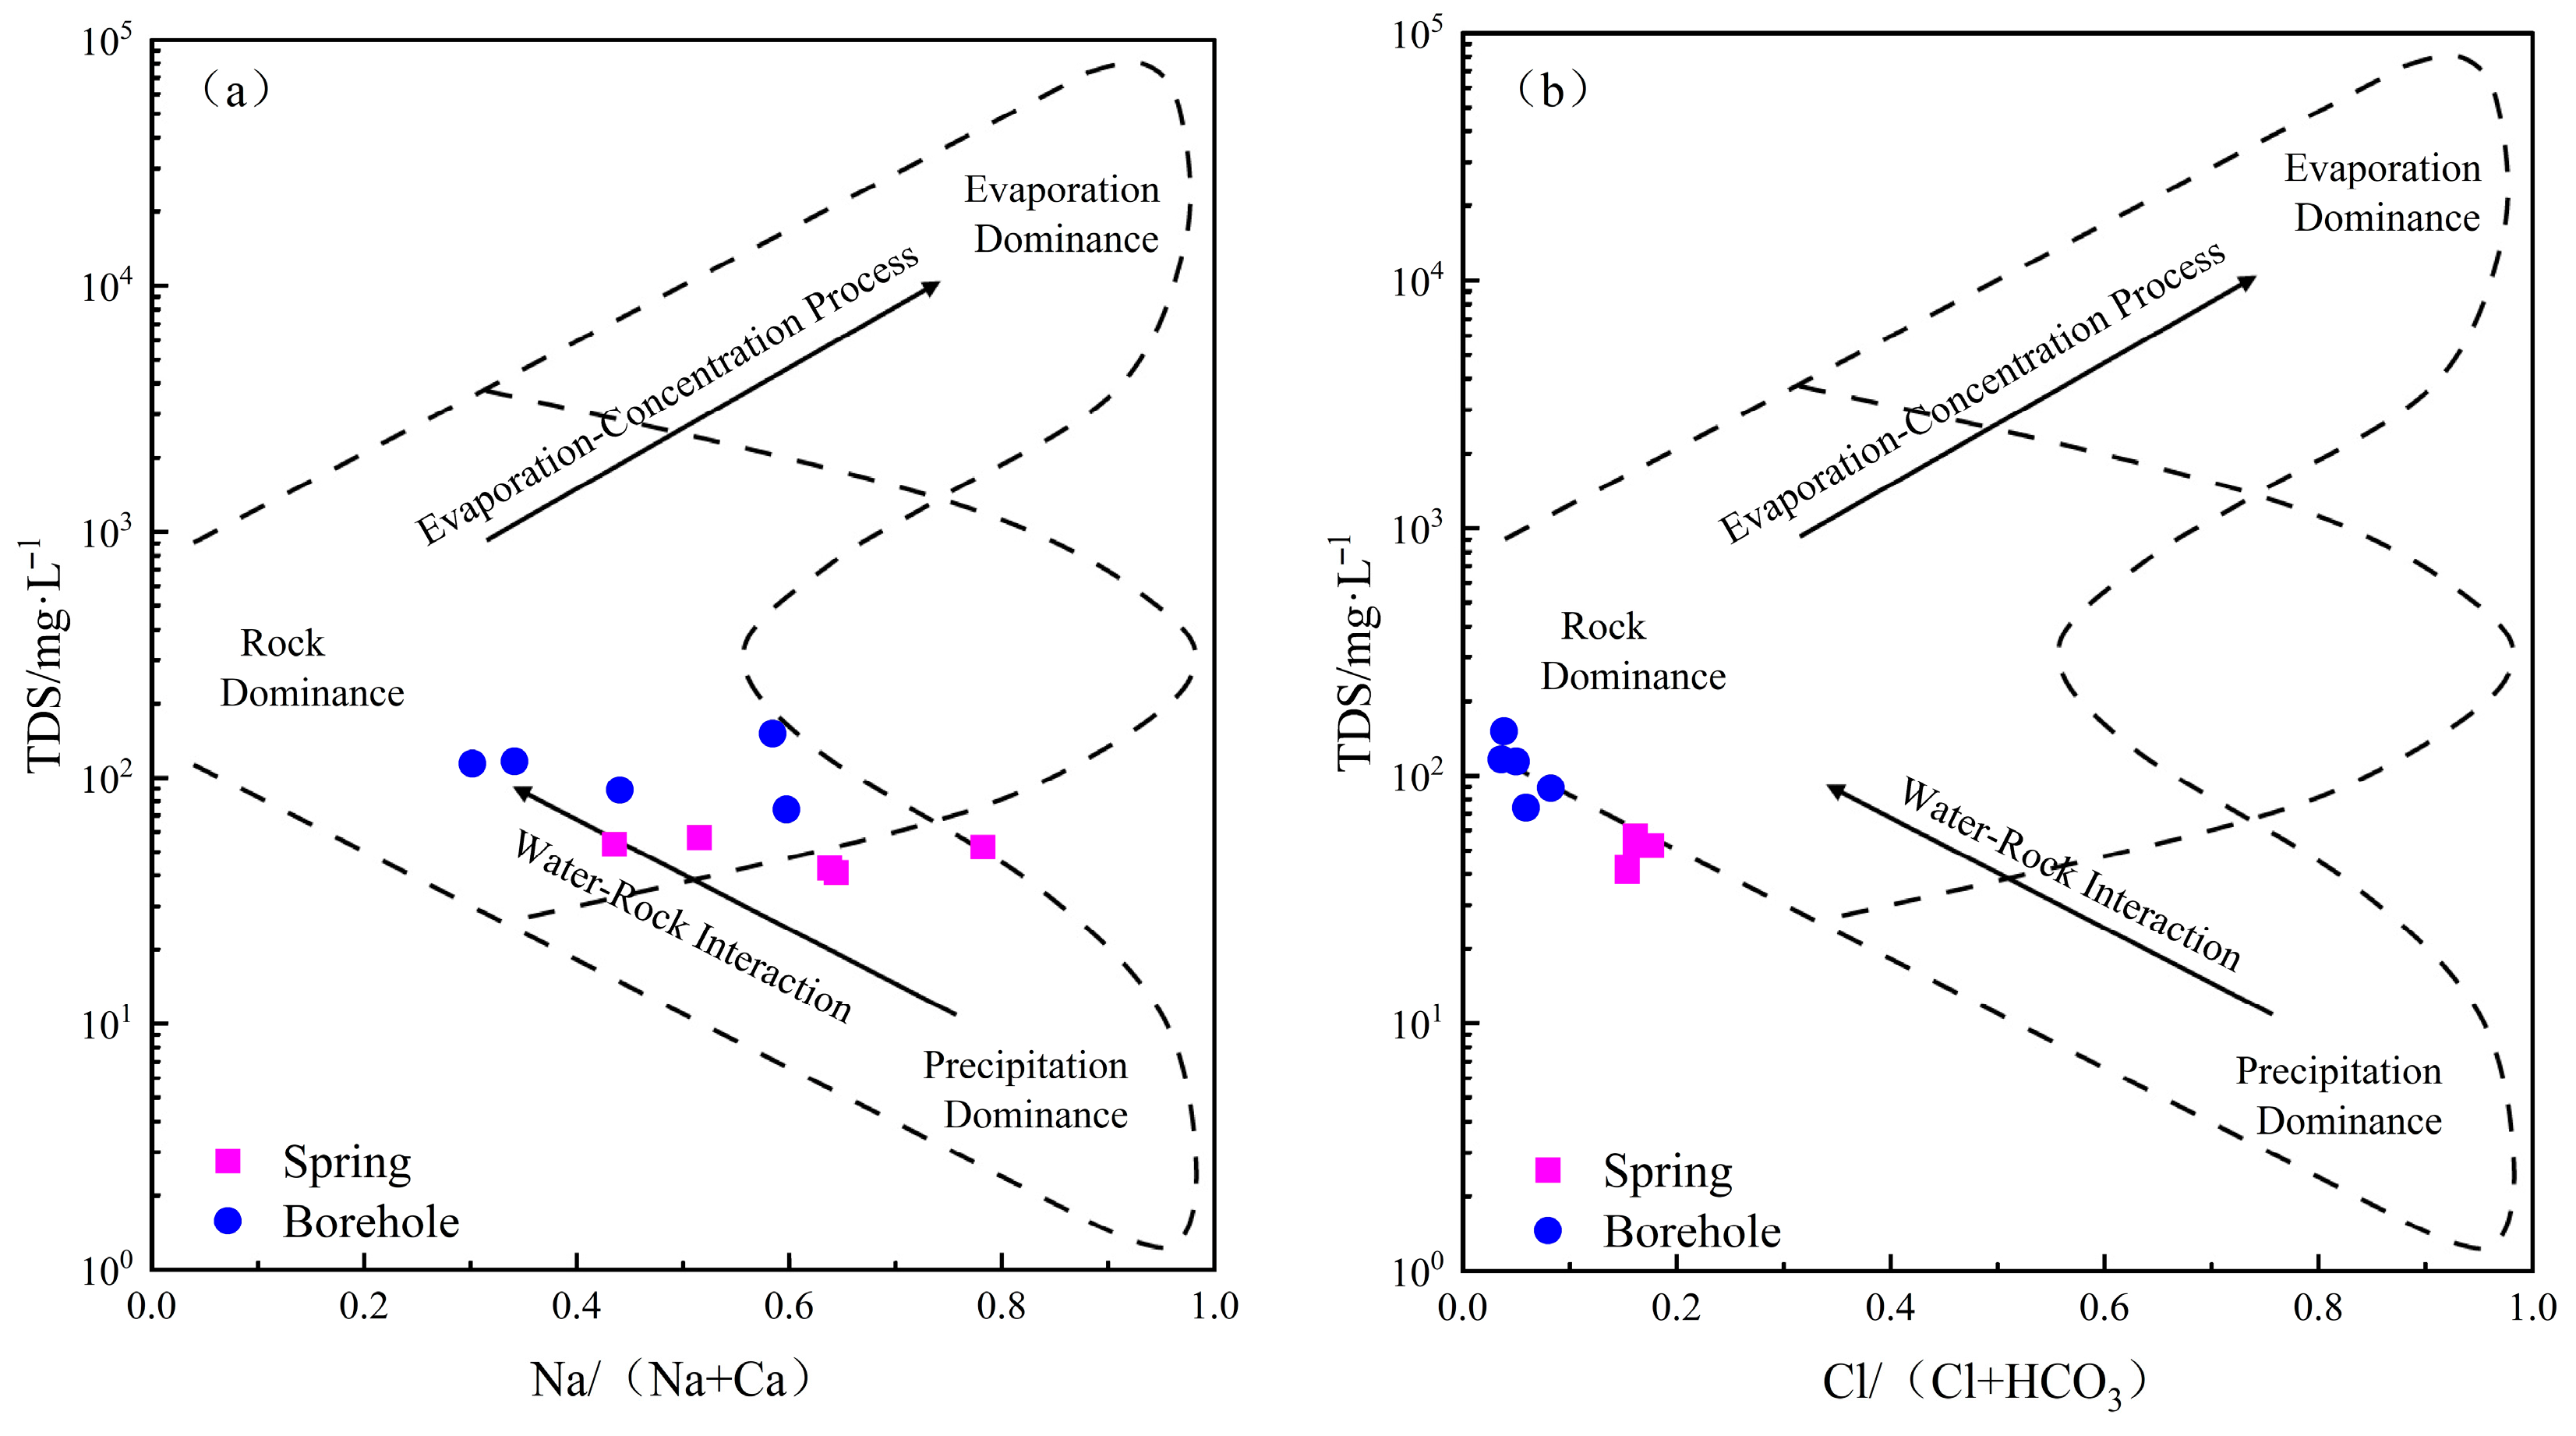
4.2. Analysis of the Causes of Hydrochemical Characteristics

The Gibbs diagram is used to analyze the dominant controlling processes of hydrochemical composition, which are primarily classified into three types: precipitation dominance, rock weathering dominance, and evaporation–crystallization dominance. As shown in Figure 5, the groundwater samples in the study area exhibit Na+/(Na+ + Ca2+) and Cl/(Cl + HCO3) mass concentration ratios ranging from 0.30 to 0.78 and 0.04 to 0.18, respectively, with TDS values between 41.16 and 151.07 mg/L. Most groundwater samples fall within the rock weathering dominance zone of the Gibbs diagram, indicating that the hydrochemical composition is primarily controlled by rock–water interactions. However, some spring samples shift toward the precipitation dominance zone, suggesting that atmospheric precipitation also influences the hydrochemistry of discharge zones (e.g., springs).
To further investigate the influence of different rock weathering processes (carbonate, silicate, and evaporite dissolution) on hydrochemical evolution, rock weathering end-member diagrams were employed. As illustrated in Figure 6, the molar ratios of Ca2+/Na+ (0.16–1.33), Mg2+/Na+ (0.05–0.75), and HCO3/Na+ (0.93–3.88) in groundwater samples predominantly cluster near the silicate end-member, with a few samples trending toward the evaporite end-member. This suggests that the hydrochemical composition is mainly governed by silicate weathering (e.g., potassium feldspar and plagioclase), with a minor contribution from evaporite dissolution.

5. Discussion

5.1. Hydrochemical Genesis Mechanisms of Groundwater

5.1.1. Leaching Effect

Water–rock interaction between groundwater and surrounding rocks leads to the formation of various ions. The sources of ions in groundwater and the hydrogeochemical evolution process can be revealed through the ratio relationships among different ions. The main sources of Na+ and K+ in groundwater are atmospheric precipitation, the weathering and dissolution of silicate rocks, and the dissolution of rock salt. The equivalent concentration ratio of (Na+ + K+) to Cl is often used to identify the major sources of Na+ and K+ in groundwater [13]. When the equivalent concentration ratio of (Na+ + K+) to Cl is close to 1, it indicates that the main source of Na+ and K+ in groundwater is the dissolution of rock salt.
As shown in Figure 7a, the groundwater sample points in the study area are almost distributed above the 1:1 line, with the (Na+ + K+)/Cl milligram-equivalent concentration ratio ranging from 1.34 to 5.24. Moreover, the ratios of the groundwater in the boreholes are all greater than those of the spring points. This indicates that the Na+ and K+ in the groundwater in the area do not come from the dissolution of rock salt. Based on the geological background conditions of the study area, which is mainly exposed to biotite monzonitic granite, the dissolution of silicate minerals (such as potassium feldspar and albite) in the rocks provides the material source conditions for Na+ and K+ in the groundwater. The reactions are as shown in Equations (2) and (3):
2KAlSi3O8 (potassium feldspar) + 2CO2 + 11H2O → Al2Si2O5(OH)4 + 2K+ + 4H4SiO4 + 2HCO3
2NaAl Si3O8 (albite) + 2CO2 + 11H2O → Al2Si2O5(OH)4 + 2Na+ + 4H4SiO4 + 2HCO3
The main source of Ca2+ and Mg2+ in groundwater is the dissolution of carbonate rocks, silicate rocks, and evaporite rocks. The equivalent concentration ratio of (Ca2+ + Mg2+) to (HCO3 + SO42−) can be used to judge the sources of Ca2+ and Mg2+ in groundwater (Figure 7b). When the equivalent concentration ratio of (Ca2+ + Mg2+) to (HCO3 + SO42−) is close to 1, it indicates that the main sources of Ca2+ and Mg2+ in groundwater are the combined effects of carbonate and silicate minerals. As shown in Figure 7b, most of the groundwater sample points in the study area are distributed below the 1:1 line, mainly because the milligram-equivalent concentration of HCO3 in the groundwater is too high, while the contents of Ca2+ and Mg2+ are relatively low. This indicates that the main sources of Ca2+ and Mg2+ in the groundwater in the area are the dissolution of silicate minerals (such as anorthite and biotite). The reactions are as shown in Equations (4) and (5). The water–rock interaction of deep confined water in the boreholes is stronger than that of the spring points.
CaAl2Si2O8 (anorthite) + 2CO2 + 3H2O → Al2Si2O5(OH)4 + 2Ca2+ + 2HCO3
Mg3AlSi3O10(OH)2 (biotite) + 14CO2 + 15H2O → Al2Si2O5(OH)4 + 2K+ + 6Mg2+ + 4H4SiO4 + 14HCO3
The main sources of HCO3 in groundwater are the weathering and dissolution of carbonate and silicate rocks, while the main sources of Cl and SO42− are the weathering and dissolution of evaporite rocks and the oxidation of sulfur-bearing minerals. As shown in Figure 7c, the groundwater sample points in the study area are basically distributed below the 1:1 line, which further indicates that the weathering and dissolution of silicate minerals play a dominant role in the groundwater in the study area, and the dissolution of silicate minerals is the main source of HCO3.

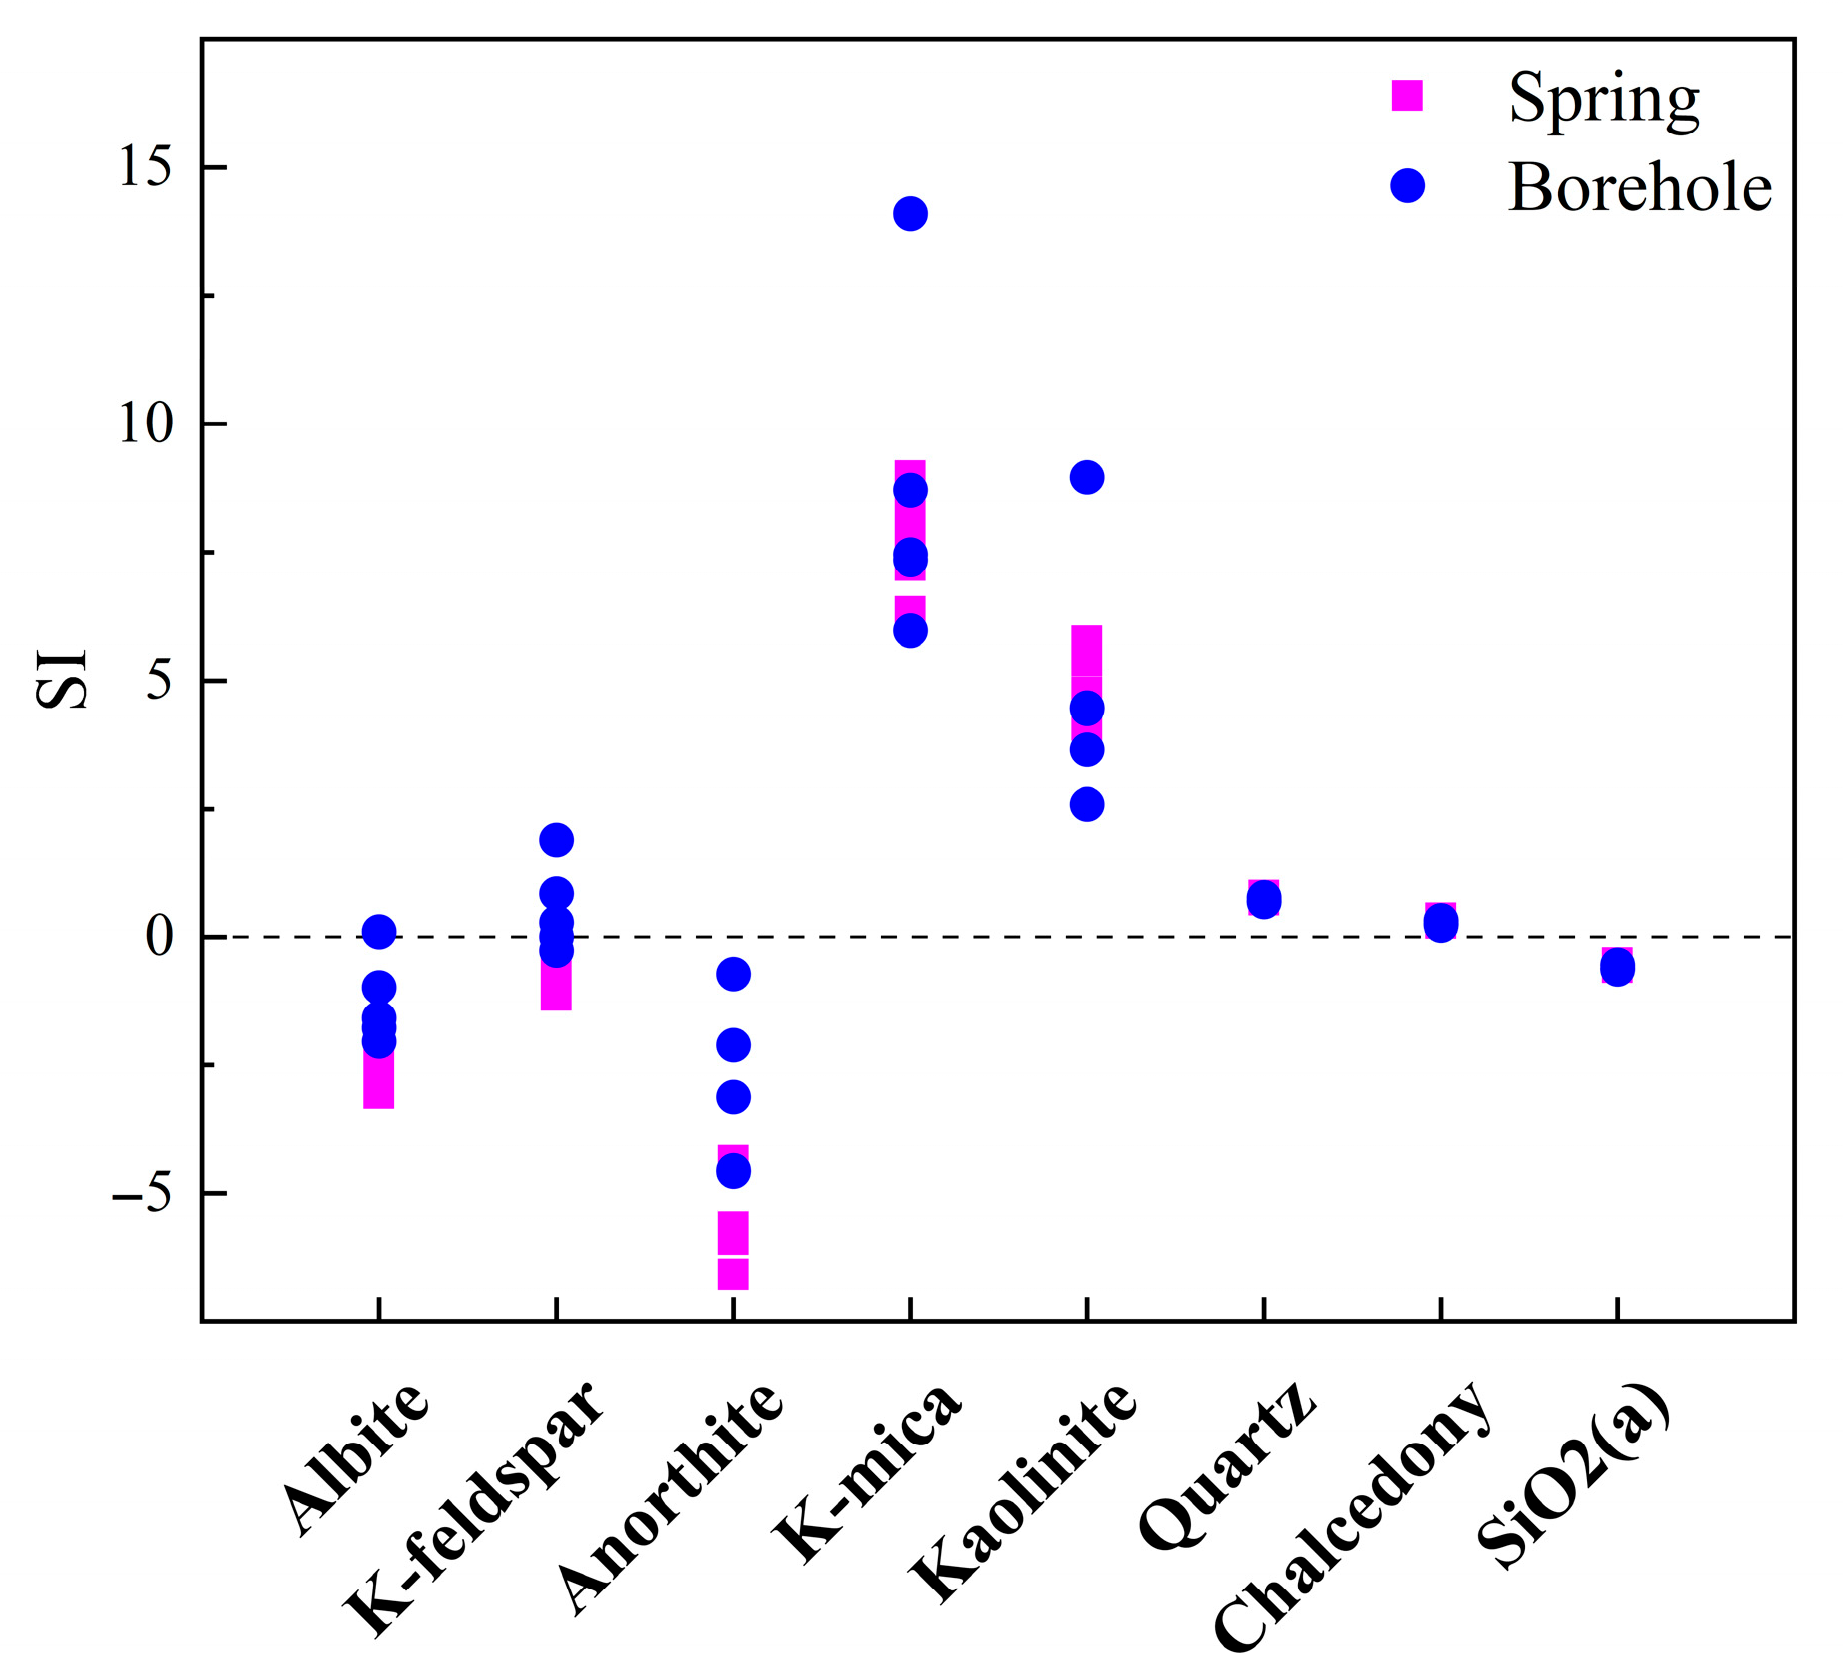
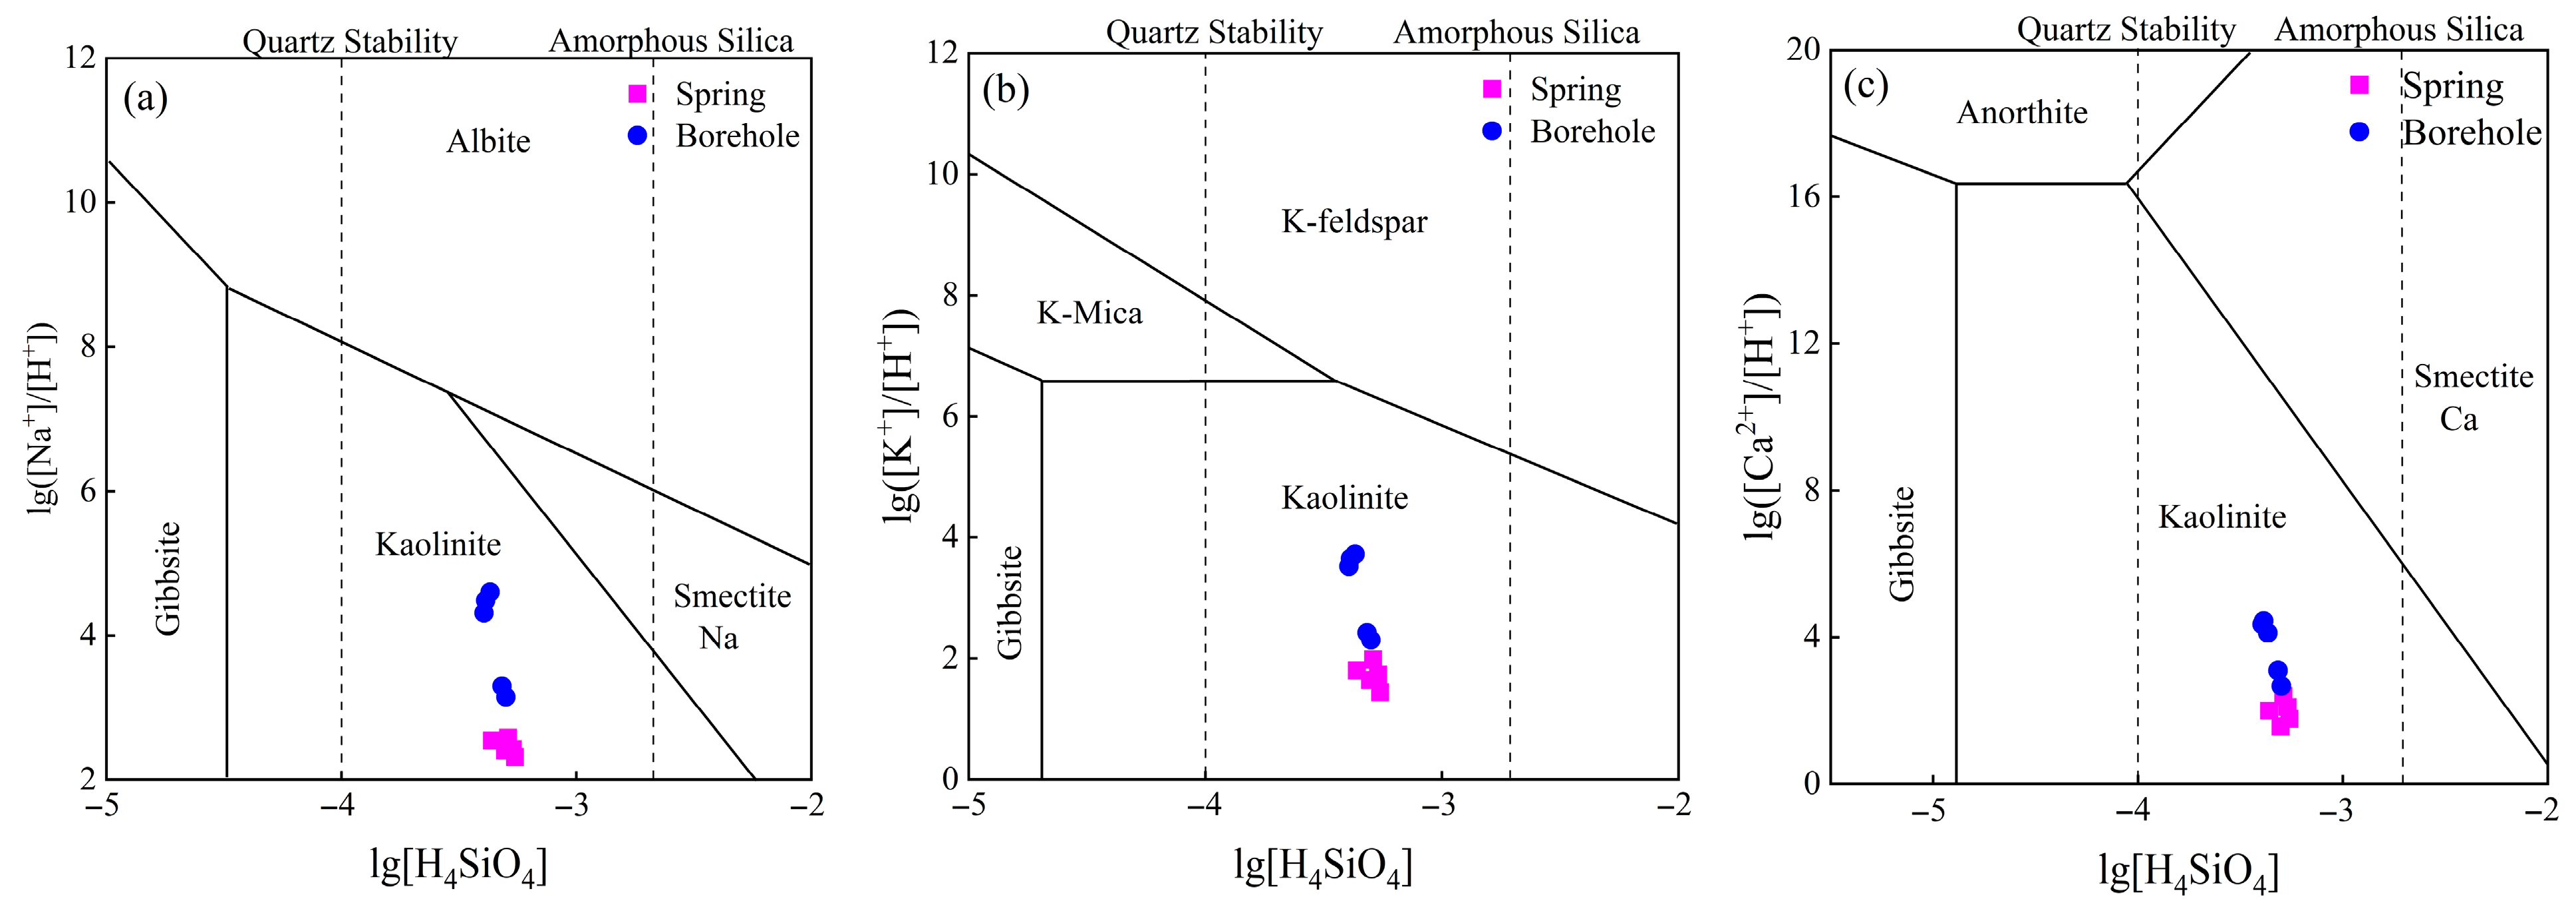
5.1.2. Mineral Dissolution Equilibrium

The dissolution and precipitation states of minerals in groundwater can be qualitatively determined by saturation indices (SIs). Potential mineral phases are primarily identified based on rock mineral composition, hydrochemical analysis, aquifer medium characteristics, and silicate equilibrium diagrams. In the study area, the main exposed rock is biotite monzonitic granite. The possible mineral phases include potassium feldspar, plagioclase (albite, anorthite), muscovite, kaolinite, quartz, chalcedony, and amorphous silica. The PHREEQC 3.7.1 software was used to calculate the saturation indices of each mineral.
As shown in Figure 8, the saturation indices of albite, anorthite, and amorphous silica in the groundwater samples of the study area range from −3.05 to 0.10, −6.57 to −0.72, and −0.63 to −0.50, respectively, indicating that these minerals are in an unsaturated state and still have a tendency to continue dissolving. The saturation indices of kaolinite, muscovite, quartz, and chalcedony range from 2.59 to 8.96, 5.97 to 14.10, 0.68 to 0.81, and 0.23 to 0.36, respectively, indicating that these minerals are in a supersaturated state and have the potential to form precipitates and crystallize. The saturation indices of potassium feldspar in the spring points range from −1.14 to 0.00, indicating an unsaturated state and a continued dissolution tendency. In contrast, the saturation indices of potassium feldspar in the groundwater of the boreholes range from −0.26 to 1.90, basically indicating a supersaturated state.
The content of H2SiO3 in groundwater is controlled by the dissolution–precipitation equilibrium of minerals. The activities of relevant ions were calculated using the PHREEQC software, and a mineral equilibrium system diagram was plotted (Figure 9). All groundwater sample points in the study area are distributed within the kaolinite stability zone. This indicates that during the groundwater runoff process in the study area, weathering and hydrolysis of aluminosilicate minerals such as potassium feldspar, plagioclase, and biotite may have occurred, resulting in the formation of clay minerals such as kaolinite and the generation of ions such as K+, Na+, Ca2+, Mg2+, and HCO3. The reaction processes are as shown in Equations (2)–(5). All groundwater sample points are distributed between the quartz saturation line and the amorphous SiO2 saturation line, indicating that all groundwater samples have the ability to continue dissolving amorphous SiO2. The analysis results of the mineral equilibrium system diagram show that the H2SiO3 in the groundwater of the study area mainly comes from the congruent dissolution of amorphous SiO2 minerals or the incongruent dissolution of aluminosilicate minerals involving CO2 reactions.

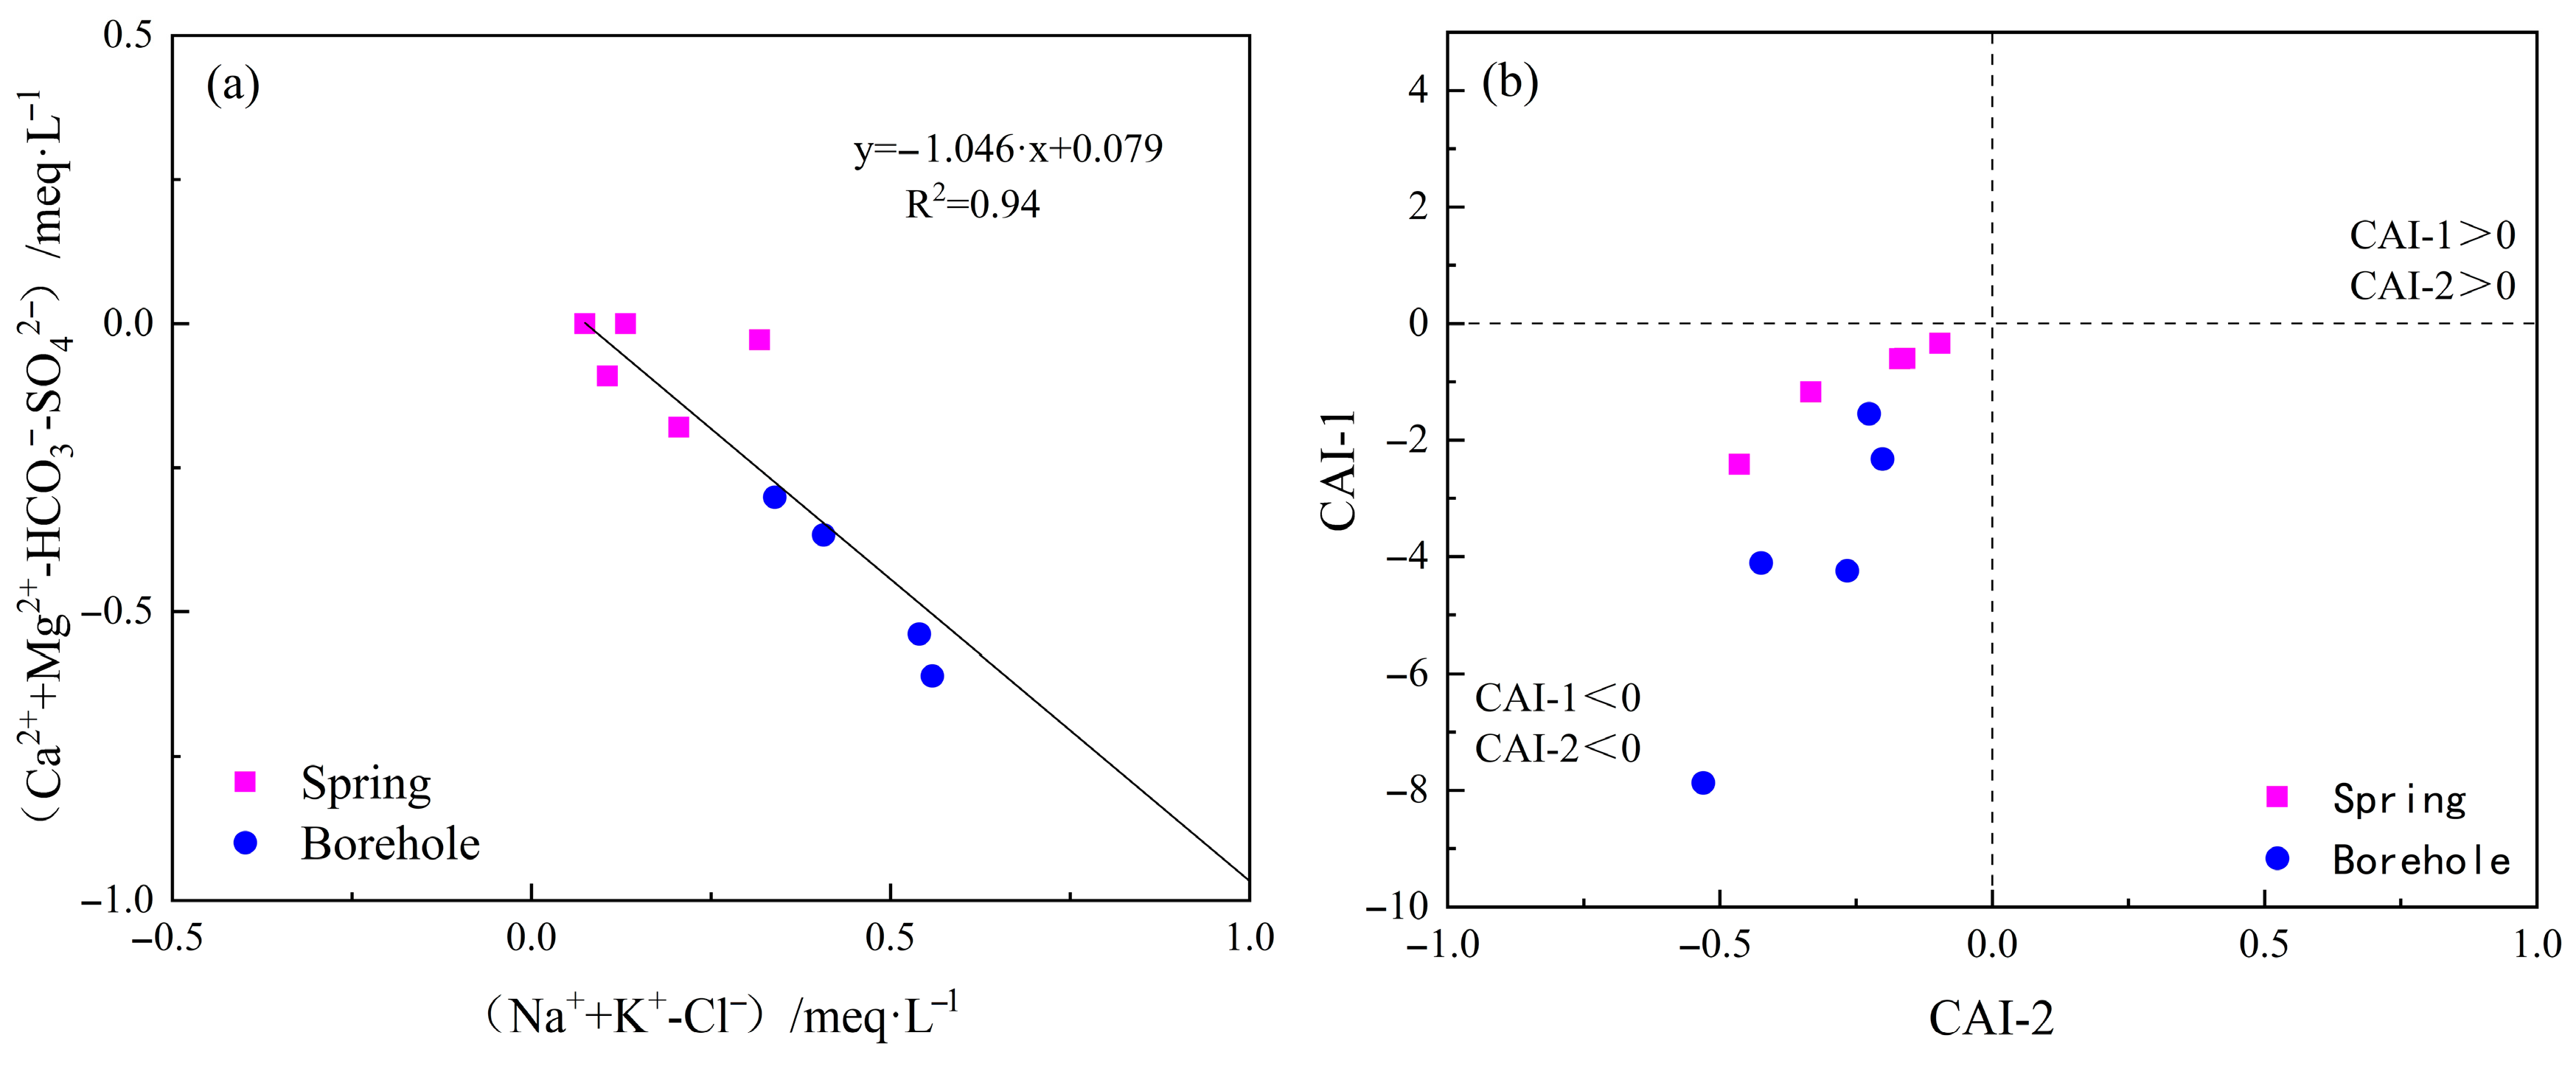
5.1.3. Cation Exchange Effect

The equivalent concentration ratio of (Ca2+ + Mg2+ − HCO3 − SO42−) to (Na+ + K+ − Cl) can be used to identify cation exchange in groundwater. When this ratio approaches −1, it indicates the occurrence of cation exchange. As shown in Figure 10a, groundwater samples in the study area are predominantly distributed along a straight line with a slope of −1.046, confirming the presence of cation exchange in the groundwater system.
To further analyze the direction and intensity of cation exchange, chloro-alkaline indices (CAI-1 and CAI-2) were calculated using Equations (6) and (7):
C A I - 1 = N C l [ N N a + + N K + ] N C l
C A I - 2 = N C l [ N N a + + N K + ] N S O 4 2 + N H C O 3 + N C O 3 2 + N N O 3
where N represents the equivalent concentration (meq/L) of ions. When both CAI-1 and CAI-2 are negative, it indicates direct cation exchange, with the absolute value reflecting the exchange intensity. Conversely, positive values suggest reverse cation exchange.
As shown in Figure 10b, both CAI-1 and CAI-2 values for groundwater from springs and boreholes in the study area are negative, demonstrating direct cation exchange. This process, represented by Reactions (8) and (9), involves Ca2+ and Mg2+ in groundwater replacing Na+ and K+ in rock minerals, leading to increased Na+ and K+ concentrations in groundwater. This further confirms that direct cation exchange contributes to the higher concentrations of Na+ and K+ relative to Cl in the groundwater. Moreover, the absolute values of chloro-alkaline indices are generally higher in borehole samples than in spring samples, indicating stronger cation exchange in deep confined water, which corresponds to the typically higher Na+ and K+ concentrations observed in borehole groundwater compared to spring water.
2NaX (rock) + Ca2+ (groundwater) ↔ 2Na+ (groundwater) + CaX2 (rock)
2NaX (rock) + Mg2+ (groundwater) ↔ 2Na+ (groundwater) + MgX2 (rock)

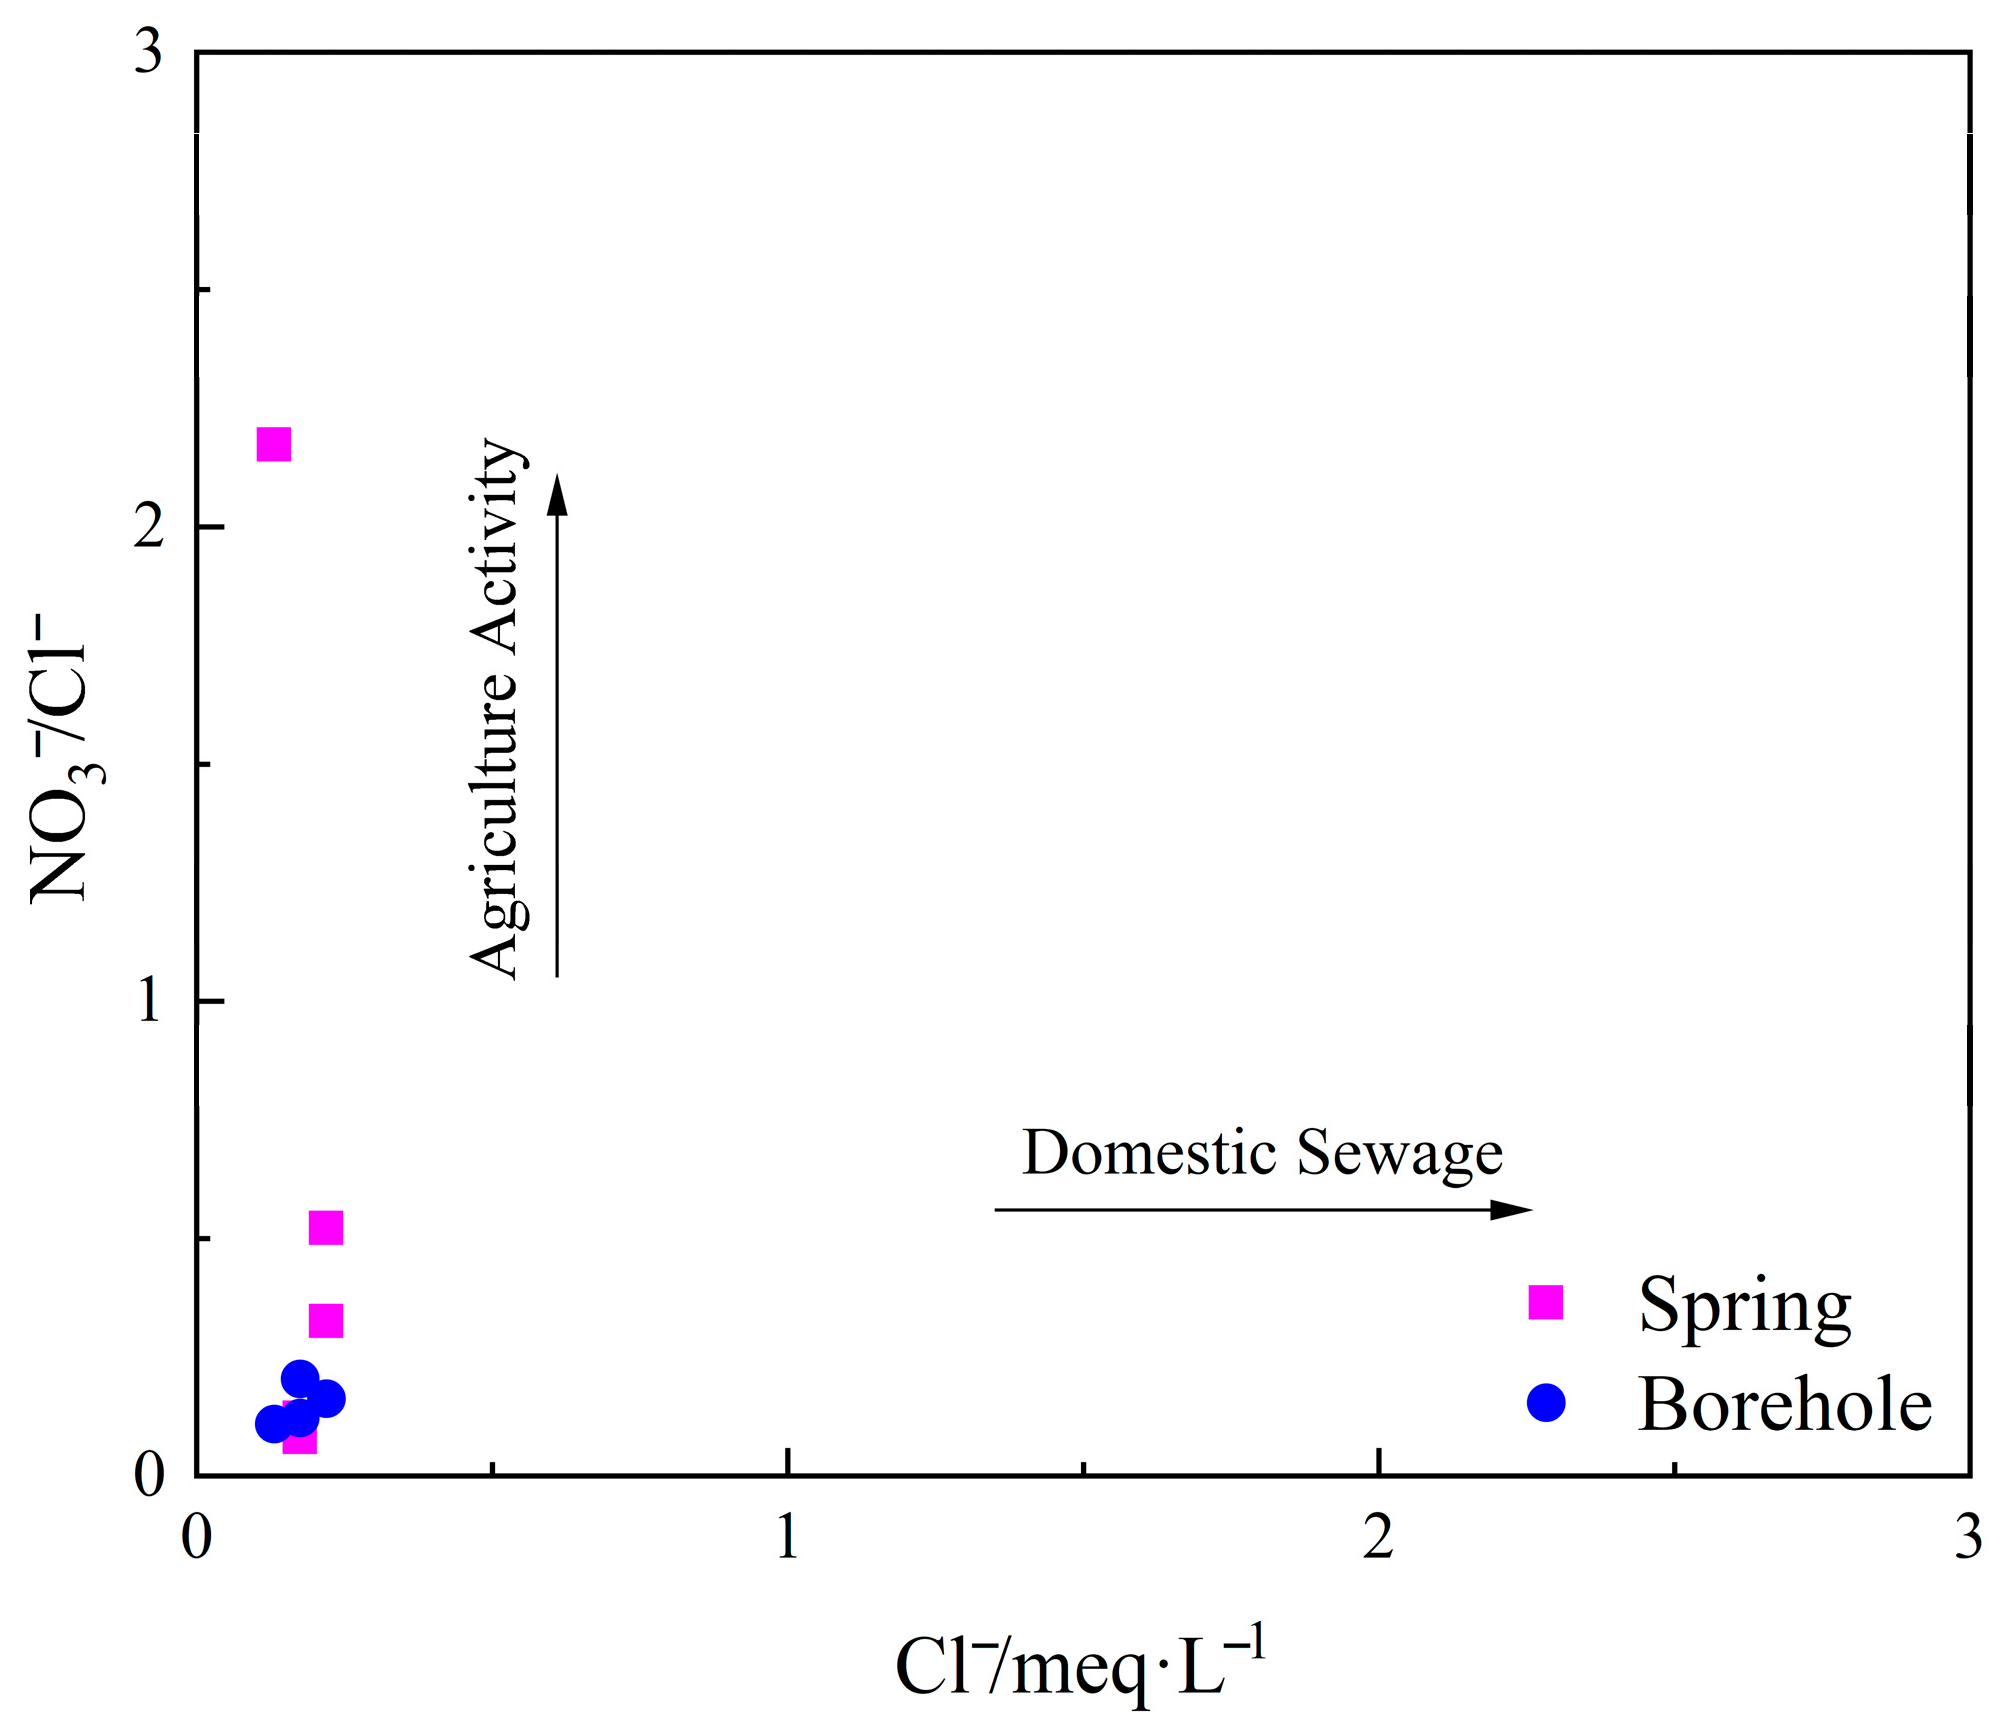
5.1.4. Impact of Human Activities

Human activities can have a significant influence on the hydrochemical evolution of groundwater. For instance, NO3 in groundwater mainly originates from the use of agricultural fertilizers and the discharge of urban domestic sewage. Given the relatively stable chemical properties of Cl, the relationship between NO3/Cl and Cl is often used to determine the sources of NO3.
As shown in Figure 11, the NO3/Cl ratios of most groundwater samples in the study area range from 0.08 to 0.52. These relatively low ratios indicate that the groundwater is less affected by agricultural activities and has good water quality. Only spring point Y1Q056 has an NO3/Cl ratio of 2.17, which is relatively high, suggesting that it is influenced by agricultural activities. The groundwater in the area is less affected by domestic sewage. The NO3/Cl ratios of spring water are generally higher than those of groundwater in the boreholes. This indicates that agricultural activities have a certain potential impact on the shallow descending spring water, while the deep groundwater in the boreholes is less affected by agricultural activities.

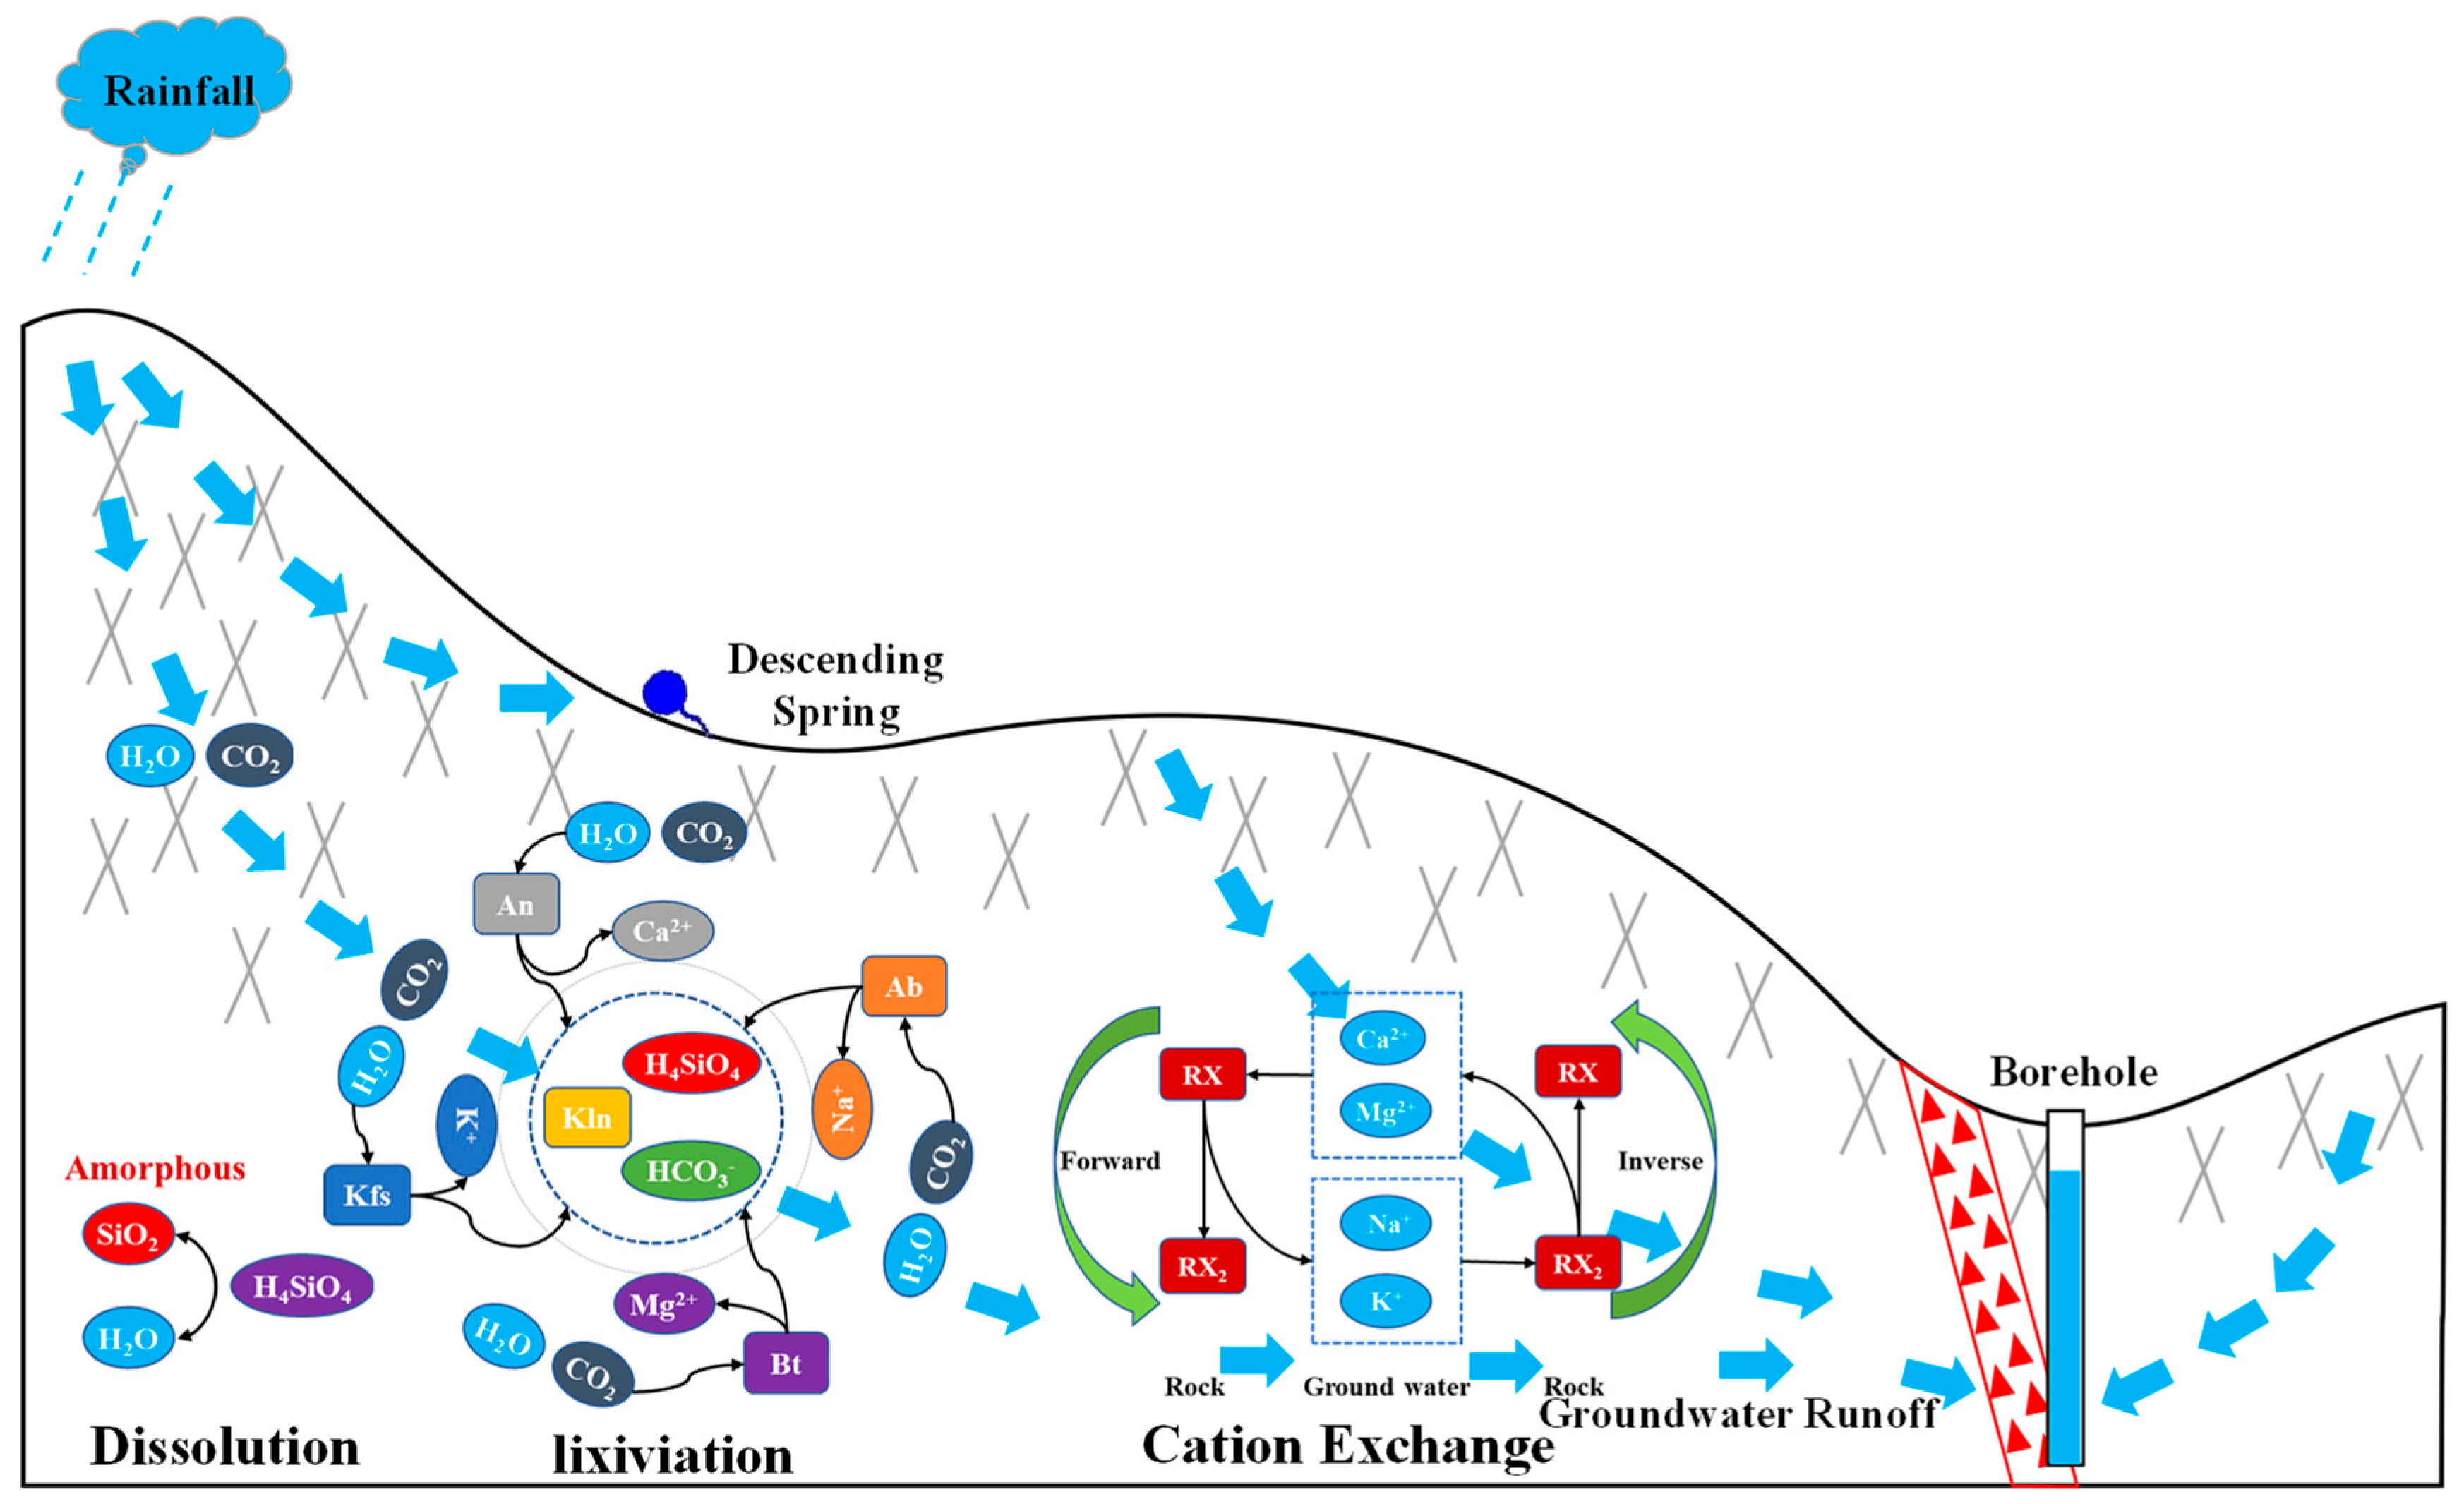
5.2. Conceptual Model for the Formation of Regional Groundwater Hydrochemical Characteristics

From the perspective of material sources, the material basis for the hydrochemical components of groundwater in the study area mainly originates from the dissolution of silicate minerals within the granite fracture system. The Early Silurian biotite monzonitic granite exposed in the area is rich in feldspar minerals (such as potassium feldspar and albite) as well as biotite. The weathering and dissolution of these minerals are the core sources of the enrichment of H2SiO3 and ions like Na+ and Ca2+. Similarly, the enrichment of strontium and H2SiO3 in the granite weathering crust in the Lianhuashan area of Changchun, Jilin Province, also relies on the mineral composition of the intrusive rocks. Studies have shown that the silica (SiO2) content in granite can be as high as 60–70%. This process shares similarities with the origin of H2SiO3 (through silicate mineral hydrolysis) in the basalt area of Chengde, Hebei Province.
The NNE-trending fault (F2) and the nearly E–W-trending fault (Fa) constitute the main migration channels for groundwater, controlling the pattern of hydrochemical differentiation and providing hydrodynamic conditions for groundwater evolution. Shallow phreatic water (spring points) is rapidly recharged by atmospheric precipitation, with a short runoff path (TDS ranges from 41.16 to 57.23 mg/L) and a relatively low pH value (5.84–6.23), reflecting the input of acid rain and the characteristics of short-term water–rock interaction. In contrast, deep confined water (boreholes) has a long runoff path and a long residence time (3H activity of 2.5 TU), resulting in an increase in TDSs to 74.21–151.07 mg/L and an increase in the proportion of Ca2+ (26.60 mg/L). This indicates the superposition effect of long-term leaching and cation exchange. Similarly, in the Lianhuashan area of Changchun, Jilin Province, groundwater forms stable water quality through planar runoff in the bedrock weathering zone [34], while in Nanmiao, Yichun, groundwater shows linear enrichment controlled by faults, reflecting the differences in tectonic control of groundwater.
From the perspective of the hydrochemical evolution process, the hydrochemical characteristics of regional groundwater are dominated by silicate weathering, with the combined effects of cation exchange and mineral dissolution equilibrium. Groundwater in boreholes is mainly of the HCO3-Ca·Na type, while spring water is mainly of the HCO3-Na·Mg type, reflecting the differences in the degree of water–rock interaction between shallow and deep groundwater. During the deep circulation process of shallow groundwater, the dissolution of plagioclase in the granite rock leads to an increase in calcium in groundwater. On the other hand, the dissolution of calcite and other calcium-containing minerals in the fault also leads to an increase in calcium ion, resulting in the transformation of shallow groundwater from the HCO3-Na·Mg type to the deep groundwater type HCO3-Ca·Na. The Gibbs model further indicates that the hydrochemical components are mainly controlled by rock weathering (Na+/(Na+ + Ca2+) = 0.30–0.78). PHREEQC simulations show that albite is in an unsaturated state and continues to dissolve, releasing H2SiO3. Kaolinite is in a supersaturated state, which inhibits further hydrolysis of silicic acid, resulting in a stable H2SiO3 concentration (31.73–42.75 mg/L). In addition, cation exchange and human activities play a regulatory role in the hydrochemical evolution of groundwater.
Based on the above analysis, the conceptual model for the formation of groundwater in the study area is shown in Figure 12. Atmospheric precipitation infiltrates through the weathering fractures and tectonic fractures in the recharge area. Driven by gravity and hydrodynamic forces, it continuously seeps downward along the fracture zones. During the runoff process of groundwater, water–rock interaction occurs with the surrounding rocks. Initially, leaching is the dominant process. Various feldspar and other silicate minerals undergo weathering and hydrolysis, releasing potassium, sodium, calcium, magnesium, bicarbonate ions, and soluble silica into the groundwater. As the groundwater moves downward, cation exchange occurs, where calcium and magnesium ions in the groundwater exchange with potassium and sodium ions in the rocks. This leads to the formation of specific hydrochemical components rich in H2SiO3 and bicarbonate, which are finally enriched in the fault zones in low-lying areas.

6. Conclusions

This study systematically unveils the hydrochemical characteristics and formation mechanisms of the NEGSA in Yichun, western Jiangxi Province. The main conclusions are as follows:
Significant hydrochemical differentiation is observed between the shallow unconfined groundwater and the deep confined groundwater in the study area. The shallow groundwater is of the HCO3-Na·Mg and HCO3-Mg·Na·Ca types, with relatively low pH values (5.84–6.23) and total dissolved solids (TDSs) (41.16–57.23 mg/L), reflecting the characteristics of rapid recharge by atmospheric precipitation. In contrast, the deep confined groundwater transitions towards the HCO3-Ca·Na and HCO3-Ca·Na·Mg types, with elevated TDSs (74.21–151.07 mg/L), indicating long-term water–rock interactions and deep circulation processes. The H2SiO3 content in the groundwater ranges from 31.73 to 42.75 mg/L. PHREEQC simulations suggest that the H2SiO3 in the groundwater primarily originates from the congruent dissolution of amorphous SiO2 minerals or the incongruent dissolution of aluminosilicate minerals involving CO2 reactions. In the groundwater, Ca2+ and Mg2+ ions displace Na+ and K+ ions in the rocks, leading to increased concentrations of Na+ and K+ in the groundwater. This indicates that cation forward exchange is one of the reasons for the higher concentrations of Na+ and K+ compared to Cl in the groundwater within the area. Hydrogen and oxygen isotopes confirm that the groundwater is recharged by atmospheric precipitation originating from an elevation range of 313.78–368.83 m. Mineral saturation indices indicate that albite, anorthite, and amorphous silica in the groundwater samples are in an unsaturated state, showing a tendency for continued dissolution. Kaolinite, muscovite, quartz, and chalcedony are in a supersaturated state, suggesting the potential for precipitation and crystal formation. The saturation indices of K-feldspar in spring points range from −1.14 to 0.00, indicating an unsaturated state and a tendency for continued dissolution. In contrast, the saturation indices of K-feldspar in groundwater from boreholes range from −0.26 to 1.90, generally indicating a supersaturated state. The hydrogeochemical characteristics and Formation Mechanisms of Groundwater can indicate the variation characteristics of groundwater chemical composition under emergency exploitation and provide scientific reference for safe water supply and sustainable development and utilization.

Author Contributions

Conceptualization, S.Y. and T.W.; methodology, X.B., G.C. and P.W.; validation, S.Y., S.C. and Q.C.; writing—original draft preparation, S.Y.; writing—review and editing, S.Y. and T.W.; visualization, H.W. and F.D. All authors have read and agreed to the published version of the manuscript.

Funding

This research was funded by the Jiangxi Provincial Technology Innovation Guidance Program (Grant No. 2023KDG01010) and the Jiangxi Bureau of Geology Young Science and Technology Leader Training Program (Grant No. 2023JXDZKJRC07).

Data Availability Statement

All sampling and testing results in this study have been presented in the article.

Conflicts of Interest

Authors Shengpin Yu, Ximin Bai, Pingqiang Wan, Shifeng Chen, Qianqian Chen, Haohui Wan, and Fei Deng were employed by the company Jiangxi Institute of Survey and Design Ltd. The remaining authors declare that the research was conducted in the absence of any commercial or financial relationships that could be construed as a potential conflict of interest.

References

  1. Xie, J.; Liu, X.; Jasechko, S.; Berghuijs, W.R.; Wang, K.; Liu, C.; Reichstein, M.; Jung, M.; Koirala, S. Majority of global river flow sustained by groundwater. Nat. Geosci. 2024, 17, 770–777. [Google Scholar] [CrossRef]
  2. Gleeson, T.; Befus, K.M.; Jasechko, S.; Luijendijk, E.; Cardenas, M.B. The global volume and distribution of modern groundwater. Nat. Geosci. 2015, 9, 161–167. [Google Scholar] [CrossRef]
  3. Wang, T.; Wu, Z.; Wang, P.; Wu, T.; Zhang, Y.; Yin, J.; Yu, J.; Wang, H.; Guan, X.; Xu, H.; et al. Plant-groundwater interactions in drylands: A review of current research and future perspectives. Agr. For. Meteorol. 2023, 341, 109636. [Google Scholar] [CrossRef]
  4. Yang, Y.; Roderick, M.L.; Yang, D.; Wang, Z.; Ruan, F.; McVicar, T.R.; Zhang, S.; Beck, H.E. Streamflow stationarity in a changing world. Environ. Res. Lett. 2021, 16, 064096. [Google Scholar] [CrossRef]
  5. Villarini, G.; Wasko, C. Humans, climate and streamflow. Upsala J. Med. Sci. 2021, 11, 725–726. [Google Scholar] [CrossRef]
  6. Rohde, M.M. Floods and droughts are intensifying globally. Nat. Water 2023, 1, 226–227. [Google Scholar] [CrossRef]
  7. Yuan, X.; Wang, Y.; Ji, P.; Wu, P.; Sheffield, J.; Otkin, J.A. A global transition to flash droughts under climate change. Science 2023, 380, 187–191. [Google Scholar] [CrossRef]
  8. Huang, Y.; Shao, J.; Qiu, H. Characteristics and countermeasures of summer and autumn drought in the Yangtze River Basin in 2022. China Flood Drought Manag. 2023, 33, 18–23. [Google Scholar]
  9. Qu, Y.; Lyu, J.; Su, Z.; Gao, H.; Dong, R. Analysis and thinking on Summer-Autumn drought in the Yangtze River Basin in 2022. China Flood Drought Manag. 2023, 33, 30–33, 66. [Google Scholar]
  10. Scanlon, B.R.; Fakhreddine, S.; Rateb, A.; de Graaf, I.; Famiglietti, J.; Gleeson, T.; Grafton, R.Q.; Jobbagy, E.; Kebede, S.; Kolusu, S.R.; et al. Global water resources and the role of groundwater in a resilient water future. Nat. Rev. Earth Environ. 2023, 4, 87–101. [Google Scholar] [CrossRef]
  11. Vrba, J.; Renaud, F.G. Overview of groundwater for emergency use and human security. Hydrogeol. J. 2016, 24, 273–276. [Google Scholar] [CrossRef]
  12. Chen, H.; Wang, J.; Zhang, F.; Zhou, Y.; Xia, C.; Zhang, W.; Meng, X.; Meng, J. Hydrochemical characteristics and formation mechanisms of groundwater in west Zoucheng City, Shandong Province, China. Environ. Monit. Assess. 2022, 194, 573. [Google Scholar] [CrossRef] [PubMed]
  13. Zhang, H.; Yu, J.; Wang, P.; Wang, T.; Li, Y. Groundwater-fed oasis in arid Northwest China: Insights into hydrological and hydrochemical processes. J. Hydrol. 2021, 597, 126154. [Google Scholar] [CrossRef]
  14. Wang, P.; Yu, J.; Zhang, Y.; Liu, C. Groundwater recharge and hydrogeochemical evolution in the Ejina Basin, northwest China. J. Hydrol. 2013, 476, 72–86. [Google Scholar] [CrossRef]
  15. Yan, B.; Xiao, C.; Liang, X.; Wu, S. Influences of pH and CO2 on the formation of Metasilicate mineral water in Changbai Mountain, Northeast China. Appl. Water Sci. 2017, 7, 1657–1667. [Google Scholar] [CrossRef]
  16. Wu, Y.; Zhou, X. Source and influencing factors of metasilicic acid in mixed geothermal waters. Geothermics 2024, 123, 103098. [Google Scholar] [CrossRef]
  17. Yang, X.; Jia, C.; Zhu, H.; Liu, Z.; Liu, Z. Characteristics and genesis of high-quality metasilicate mineral water in Liaocheng City, Shandong Province. Environ. Monit. Assess. 2024, 196, 1155. [Google Scholar] [CrossRef]
  18. Sun, H.; Sun, X.; Wei, X.; Chen, Z.; Liu, W.; Huang, X.; Li, X.; Yin, Z.; Liu, W. Formation mechanism of metasilicate mineral water in Chengde, Hebei Province: Evidence from rock weathering and water-rock interaction. Geol. China 2022, 49, 1088–1113. [Google Scholar]
  19. Zhang, B. Characteristics and genetic analysis of Meiying metasilicic acid mineral water in Zhao’an County, Fujian Province. Miner. Resour. Geol. 2025, 39, 322–334. [Google Scholar]
  20. Liu, Y.; Jin, M.; Wang, J. Insights into groundwater salinization from hydrogeochemical and isotopic evidence in an arid inland basin. Hydrol. Process. 2018, 32, 3108–3127. [Google Scholar] [CrossRef]
  21. Zhang, H.; Yu, S.; Fu, Y. Demonstration on Emergency Groundwater Field in Hongtang Bay, Sanya City of Hainan Province. S. China Geol. 2021, 37, 330–338. [Google Scholar]
  22. Li, Y. Hydrogeological Characteristics and Optimal Selection of Groundwater Emergency Water Source in PMain Urban Area of Ningde City, Fujian Province. Geol. Fujian 2020, 39, 60–67. [Google Scholar]
  23. Nan, Y.; Guo, G.; Dai, Y.; Xing Chao, Z.; Yao, Y.; Yuan, Y.; Xu, L. Characteristics of Multi-Timescale Evolution in Water Level Dynamics and Regulation for Safe Water Supply at the Zhangfang Emergency Backup Water Source in Beijing. Geol. Bull. China 2025, 1–16. [Google Scholar]
  24. Wu, M. Analysis of groundwater exploitation risk and emergency water supply capacity in acertain area of Maoming city. Yunnan Geol. 2024, 43, 567–571. [Google Scholar]
  25. Li, X.; Luo, Y.; Zeng, C.; Zhong, Q.; Xiao, Z.; Mao, X.; Cao, F. Selenium accumulation in plant foods and selenium intake of residents in a moderately selenium-enriched area of Mingyueshan, Yichun, China. J. Food Compos. Anal. 2023, 116, 105089. [Google Scholar] [CrossRef]
  26. Jia, W.; Liu, K.; Yan, J.; Zhang, Y.; Tong, J.; Yu, K.; Zhang, S.; Wang, L.; Yu, C. The difference in hydrochemical characteristics of geothermal water between the eastern and western parts of the Wugongshan area and its genetic mechanism. J. Geochem. Explor. 2024, 266, 107575. [Google Scholar] [CrossRef]
  27. Wan, P.; Yu, S.; Bai, X. Report on the Investigation and Evaluation of Emergency Groundwater Source Sites in Major Cities of Jiangxi Province; Hydrogeological Brigade, Jiangxi Provincial Geological Bureau: Nanchang, China, 2021. [Google Scholar]
  28. Wang, L.; Liu, K.; Ma, Y.; Zhang, Y.; Tong, J.; Jia, W.; Zhang, S.; Sun, J. Geochemical and Isotopic Techniques Constraints on the Origin, Evolution, and Residence Time of Low-Enthalpy Geothermal Water in Western Wugongshan, China. Acta Geol. Sin.-Engl. Ed. 2024, 98, 801–818. [Google Scholar] [CrossRef]
  29. Huang, X.; Du, C.; Feng, Y.; Wang, X.; Li, S.; Zheng, Z. Research on Characteristics of Spatial and Temporal Variations of Acid Rain in Jiangxi Province Over the Past Twelve Years and the Impact of Acid Gas Emissions. J. Gannan Norm. Univ. 2024, 45, 101–110. [Google Scholar]
  30. Liu, P. The Acid Rain in Jiangxi Province of Hydrogen, Oxygen, Sulfur Isotopecharacteristics and Origin. Master’s Thesis, East China University of Technology, Nanchang, China, 2012. [Google Scholar]
  31. Li, L. Hydrogeochemistry of Hot Springs in Yichun Area of Jiangxi Province. Master’s Thesis, East China University of Technology, Nanchang, China, 2018. [Google Scholar]
  32. Lindsey, B.D.; Jurgens, B.C.; Belitz, K. Tritium as an Indicator of Modern, Mixed, and Premodern Groundwater Age; U.S. Department of the Interior, U.S. Geological Survey: Reston, VA, USA, 2019; pp. 2019–5090.
  33. Telloli, C.; Rizzo, A.; Salvi, S.; Pozzobon, A.; Marrocchino, E.; Vaccaro, C. Characterization of groundwater recharge through tritium measurements. Adv. Geosci. 2022, 57, 21–36. [Google Scholar] [CrossRef]
  34. Sun, Q.; Sun, Z.; Jia, L.; Tian, H.; Guo, X.; Du, J.; Li, X.; Li, X.; Jia, L. Formation mechanism of strontium and metasilicic acid groundwater in the Lianhuashan area, Changchun, Jilin Province. Geol. China 2023, 50, 181–191. [Google Scholar]
Figure 1. Location and geological overview of the study area. (a) Geographical location of the study area; (b) geological and hydrogeological map of the study area; (c) hydrogeological cross-section along profile A-A’ from the figure (b).
Water 17 02063 g001
Figure 2. Piper diagram showing the hydrochemical facies of groundwater and spring water.
Water 17 02063 g002
Figure 3. Plots of Pearson correlation coefficient matrix of groundwater chemical components. * indicates significant at the 0.05 level, and ** indicates significant at the 0.01 level.
Water 17 02063 g003
Figure 4. Isotopic characteristic diagrams of groundwater. (a) Relationship between δD and δ18O. The dashed line represents the China meteoric water line (CMWL), the dotted line indicates the global meteoric water line (GMWL), and the solid line denotes the local meteoric water line (LMWL). Panels (b) and (c) are, respectively, the diagrams illustrating the relationships between δD and altitude, and between δ18O and altitude.
Water 17 02063 g004
Figure 5. Gibbs diagrams illustrating the key mechanisms controlling the chemistry of groundwater. (a) represents the relationship of mass concentration ratios Na/(Na + Ca) and TDS of groundwater. (b) represents the relationship of mass concentration ratios Cl/(Cl + HCO3) and TDS of groundwater.
Water 17 02063 g005
Figure 6. End-member diagram of rock weathering of groundwater. (a) represents the relationship between the molar concentration ratio of Ca to Na and that of HCO3 to Na. (b) represents the relationship between the molar concentration ratio of Ca to Na and that of Mg to Na.
Water 17 02063 g006
Figure 7. Plots of (a) (Na+ + K+) vs. Cl concentrations, (b) (Ca2+ + Mg2+) vs. (SO42− + HCO3) concentrations, and (c) (Cl + SO42−) vs. HCO3 for water samples.
Water 17 02063 g007
Figure 8. Diagram of mineral saturation indices (SI) in groundwater.
Water 17 02063 g008
Figure 9. Mineral equilibrium phase diagram for the groundwater in study area. (a) responts the Na+-H+-SiO2 system mineral equilibrium phase diagram. (b) responts the K+-H+-SiO2 system mineral equilibrium phase diagram. (c) responts the Ca2+-H+-SiO2 system mineral equilibrium phase diagram.
Water 17 02063 g009
Figure 10. Diagrams of (a) the relationship between the contents of (Ca2+ + Mg2+ − HCO3 − SO42−) and (Na+ + K+ − Cl) and (b) the chlor-alkali indices in groundwater.
Water 17 02063 g010
Figure 11. Relationship between Cl concentrations and NO3/Cl molar ratios in groundwater.
Water 17 02063 g011
Figure 12. Conceptual model of groundwater circulation pathways and hydrochemical evolution in the study area.
Water 17 02063 g012
Table 1. Groundwater hydrochemical test results and statistical eigenvalues.
TypesSample CodepHK+Na+Ca2+Mg2+ClSO42−CO32−HCO3NO3FTDSH2SiO3
Unconfined water (descending springs)Y10215.982.306.706.304.677.782.000.0040.457.090.0457.2341.93
Y1Q0066.232.305.407.004.257.782.000.0040.454.430.0453.7539.98
Y1Q0506.052.307.404.202.556.222.000.0034.230.890.0442.8234.07
Y1Q0535.941.305.703.154.256.222.000.0034.231.330.0341.1642.75
Y1Q0565.842.608.802.452.974.672.000.0021.7817.720.0352.3138.80
maximum6.232.608.807.004.677.782.000.0040.4517.720.0457.2342.75
minimum5.841.305.402.452.554.672.000.0021.780.890.0341.1634.07
mean6.012.166.804.623.746.532.000.0034.236.290.0449.4539.51
variation0.020.230.200.430.250.200.000.000.221.090.150.140.09
Confined water (boreholes)Y1ZK17.733.5013.8026.601.704.672.000.00124.460.890.15116.7532.31
Y1ZK26.403.3013.509.103.184.672.000.0074.220.890.1274.2139.13
Y1ZK3 a7.643.2011.5026.603.406.222.000.00118.232.220.16114.5031.73
Y1ZK3 b7.497.2031.5022.401.496.222.000.00154.621.330.50151.0733.69
Y1ZK46.632.6011.3014.355.317.782.000.0086.592.220.1889.2437.72
maximum7.737.2031.5026.605.317.782.000.00154.622.220.50151.0739.13
minimum6.402.6011.309.101.494.672.000.0074.220.890.1274.2131.73
mean7.183.9616.3219.813.025.912.000.00111.621.510.22109.1534.92
variation0.090.470.520.390.510.220.000.000.290.450.710.270.10
Notes: a indicates sampling during dry periods, b indicates sampling during normal periods. The unit of all ion is mg/L.
Table 2. Test results of hydrogen and oxygen isotopes in groundwater.
TypesSample CodeSampling Elevation (m)δ18O (‰)δD (‰)3H (TU)
Unconfined water
(descending springs)
Y11301.529−6.52−38.58/
Y12204.635−5.95−33.93/
Y13152.005−5.79−33.74/
Y15187.067−5.91−34.94/
Confined water (boreholes)Y14 (Y1ZK4)147.840 −6.07 −36.71 2.5
Y1ZK2158.390−6.90−43.002.29
Y14 (Y1ZK4)-1147.840−6.70−41.801.78
Disclaimer/Publisher’s Note: The statements, opinions and data contained in all publications are solely those of the individual author(s) and contributor(s) and not of MDPI and/or the editor(s). MDPI and/or the editor(s) disclaim responsibility for any injury to people or property resulting from any ideas, methods, instructions or products referred to in the content.

