
Research on Construction and Application of Water Processes Based on Knowledge Graph: Analysis of Dynamic Paths and Impact Factors


Abstract
1. Introduction
2. Methods
2.1. Problem Formalization
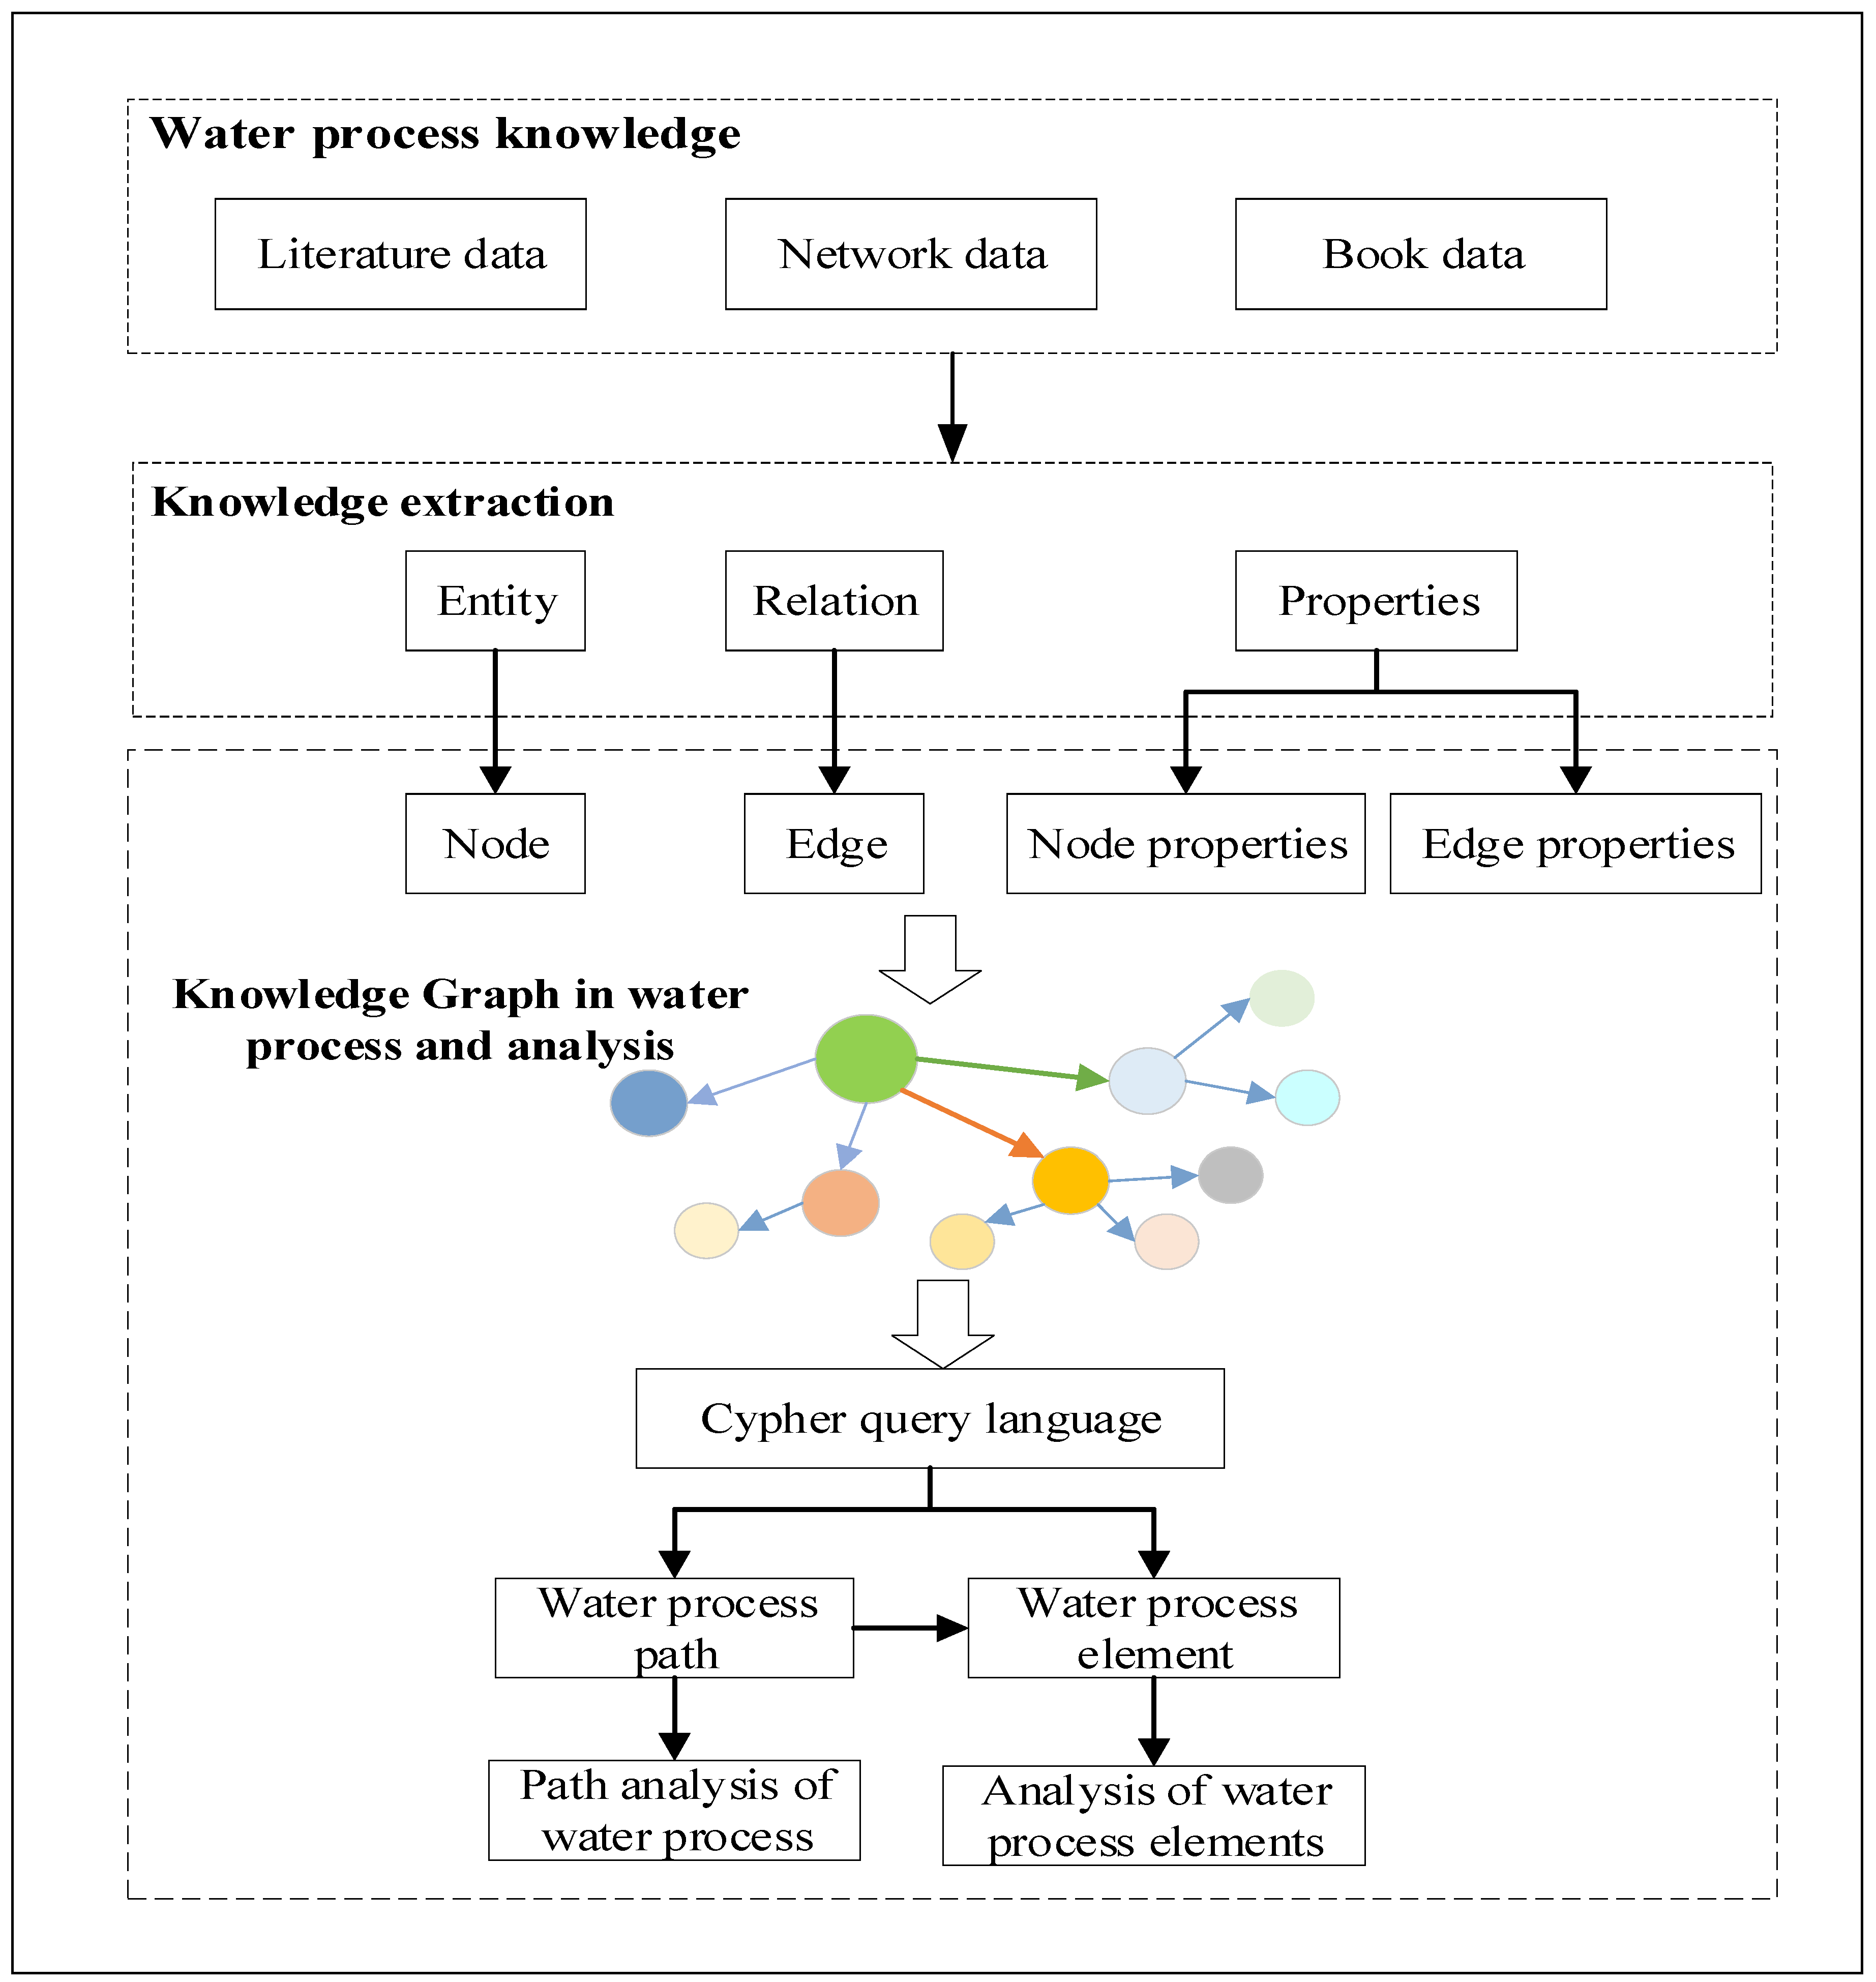
2.2. Overall Structure
2.2.1. Water Process Knowledge
2.2.2. Water Process Knowledge Extraction
2.2.3. Knowledge Graph in Water Process and Analysis
3. Results
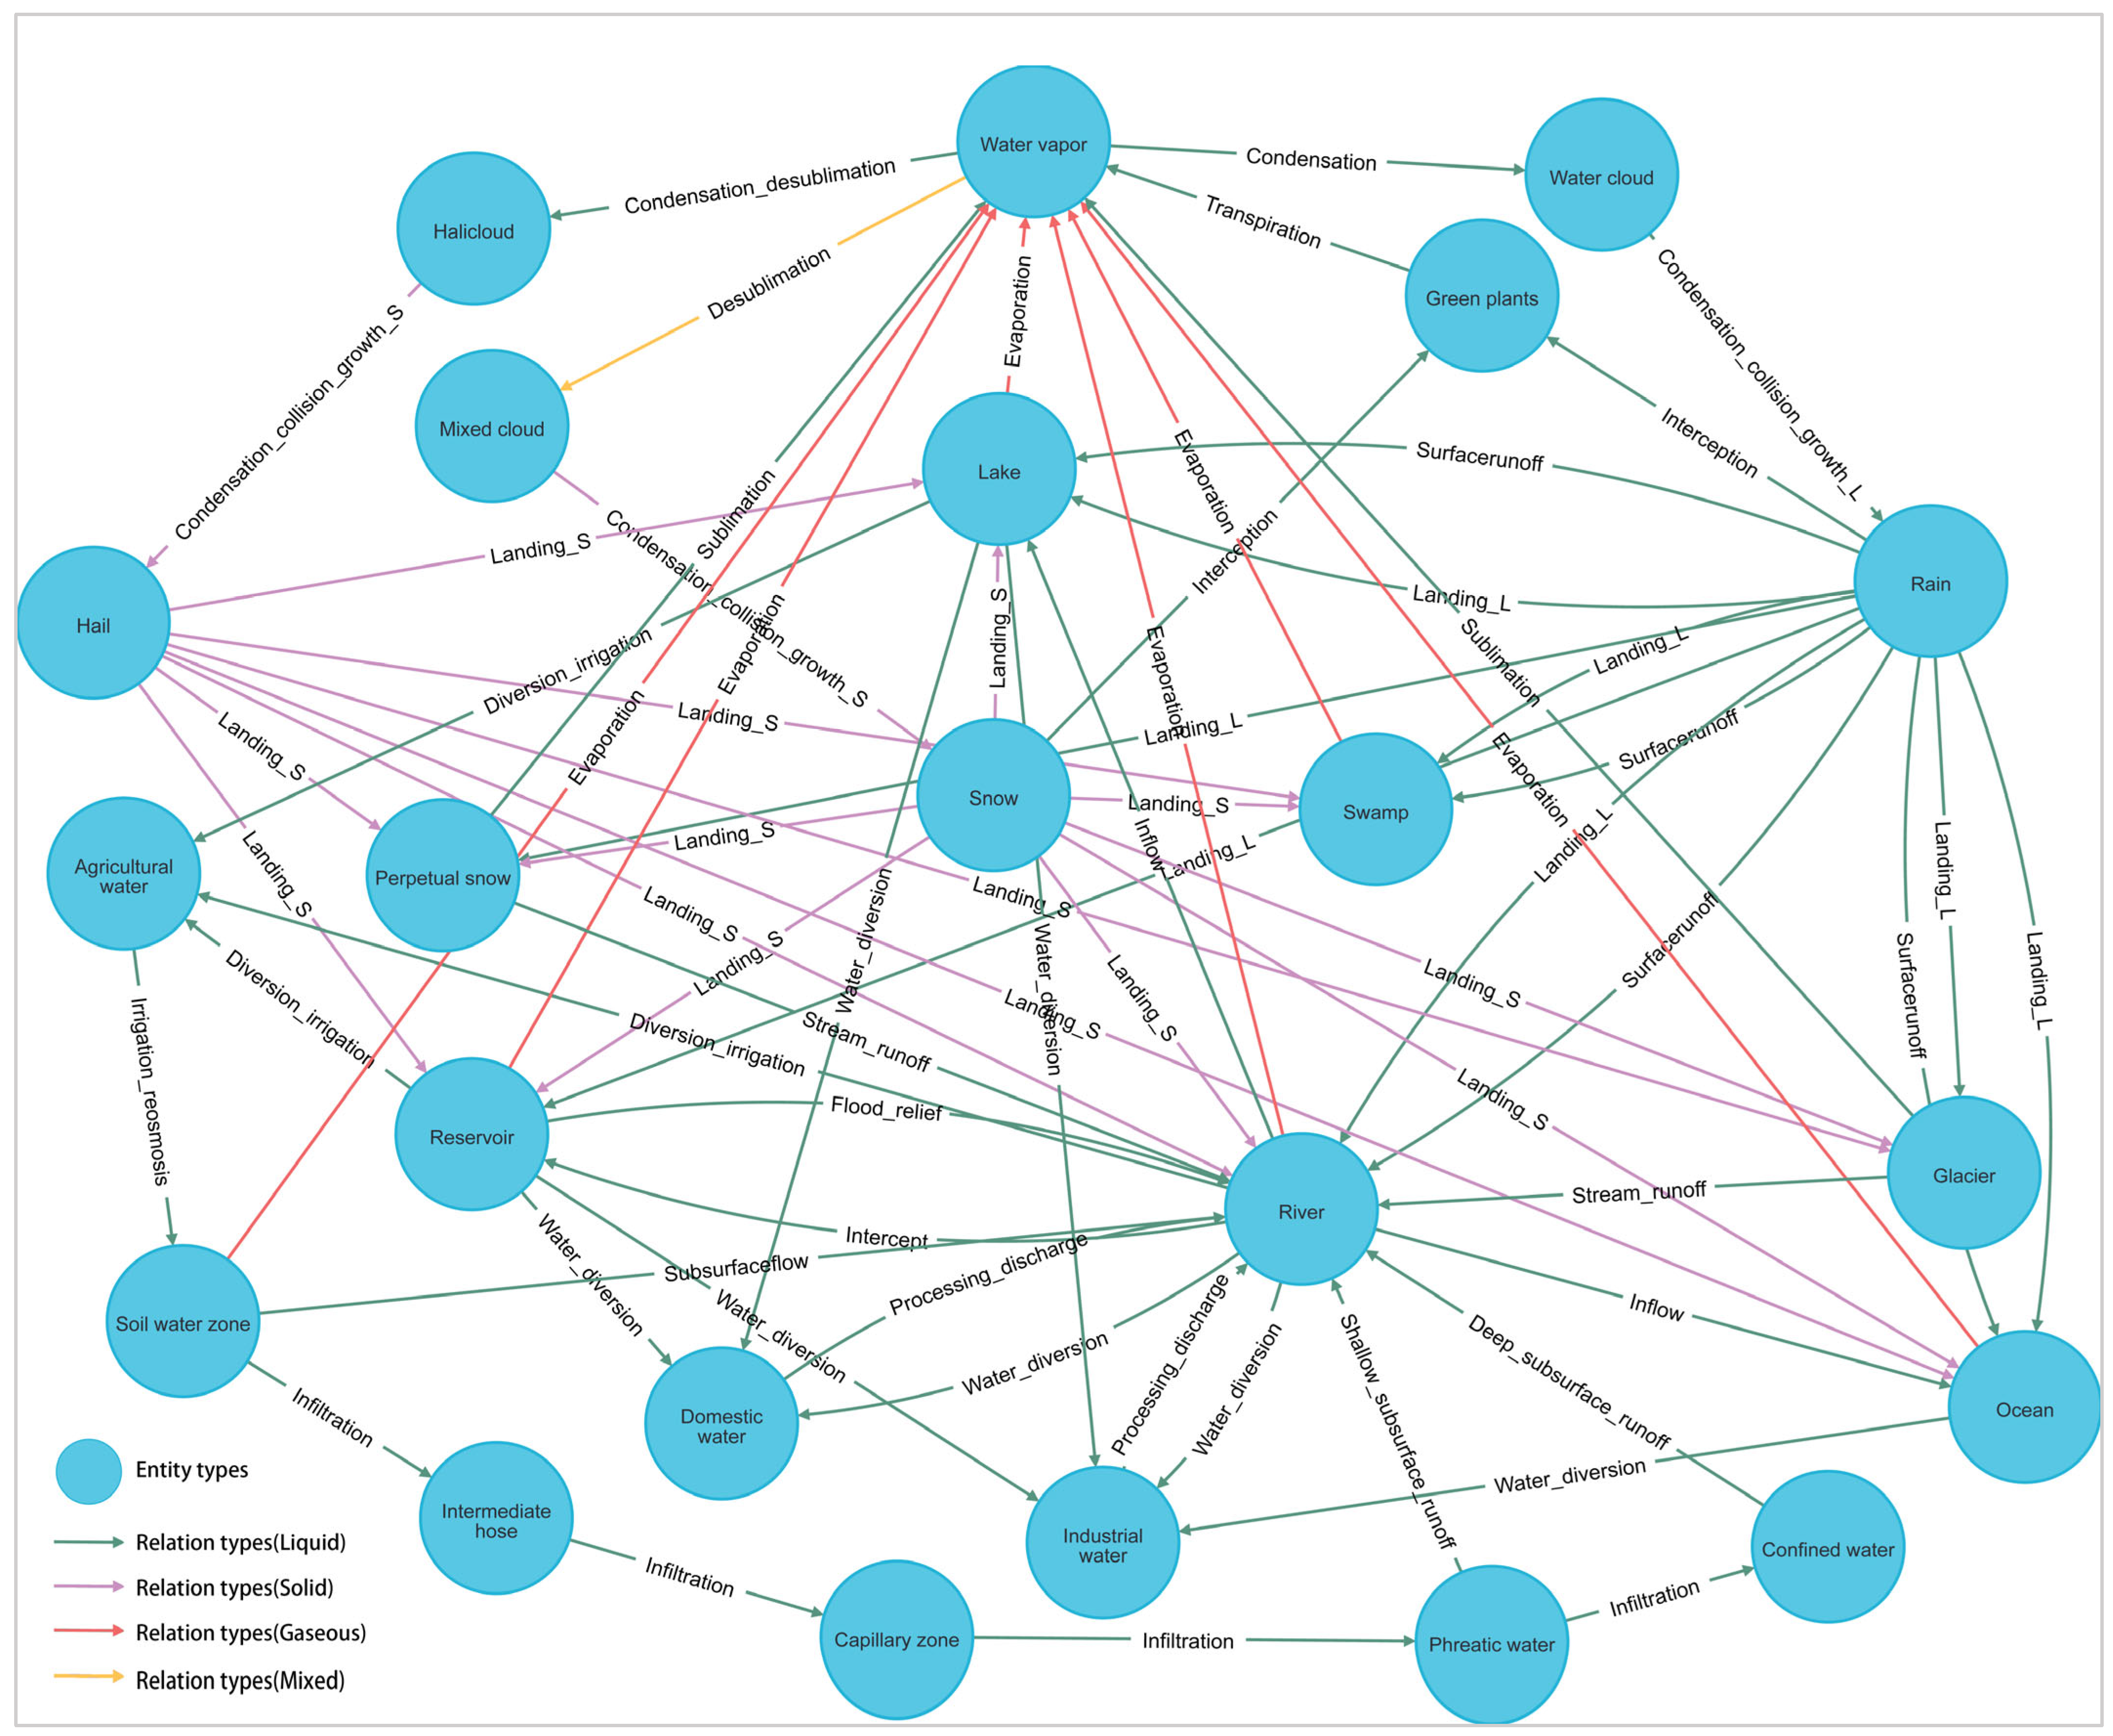
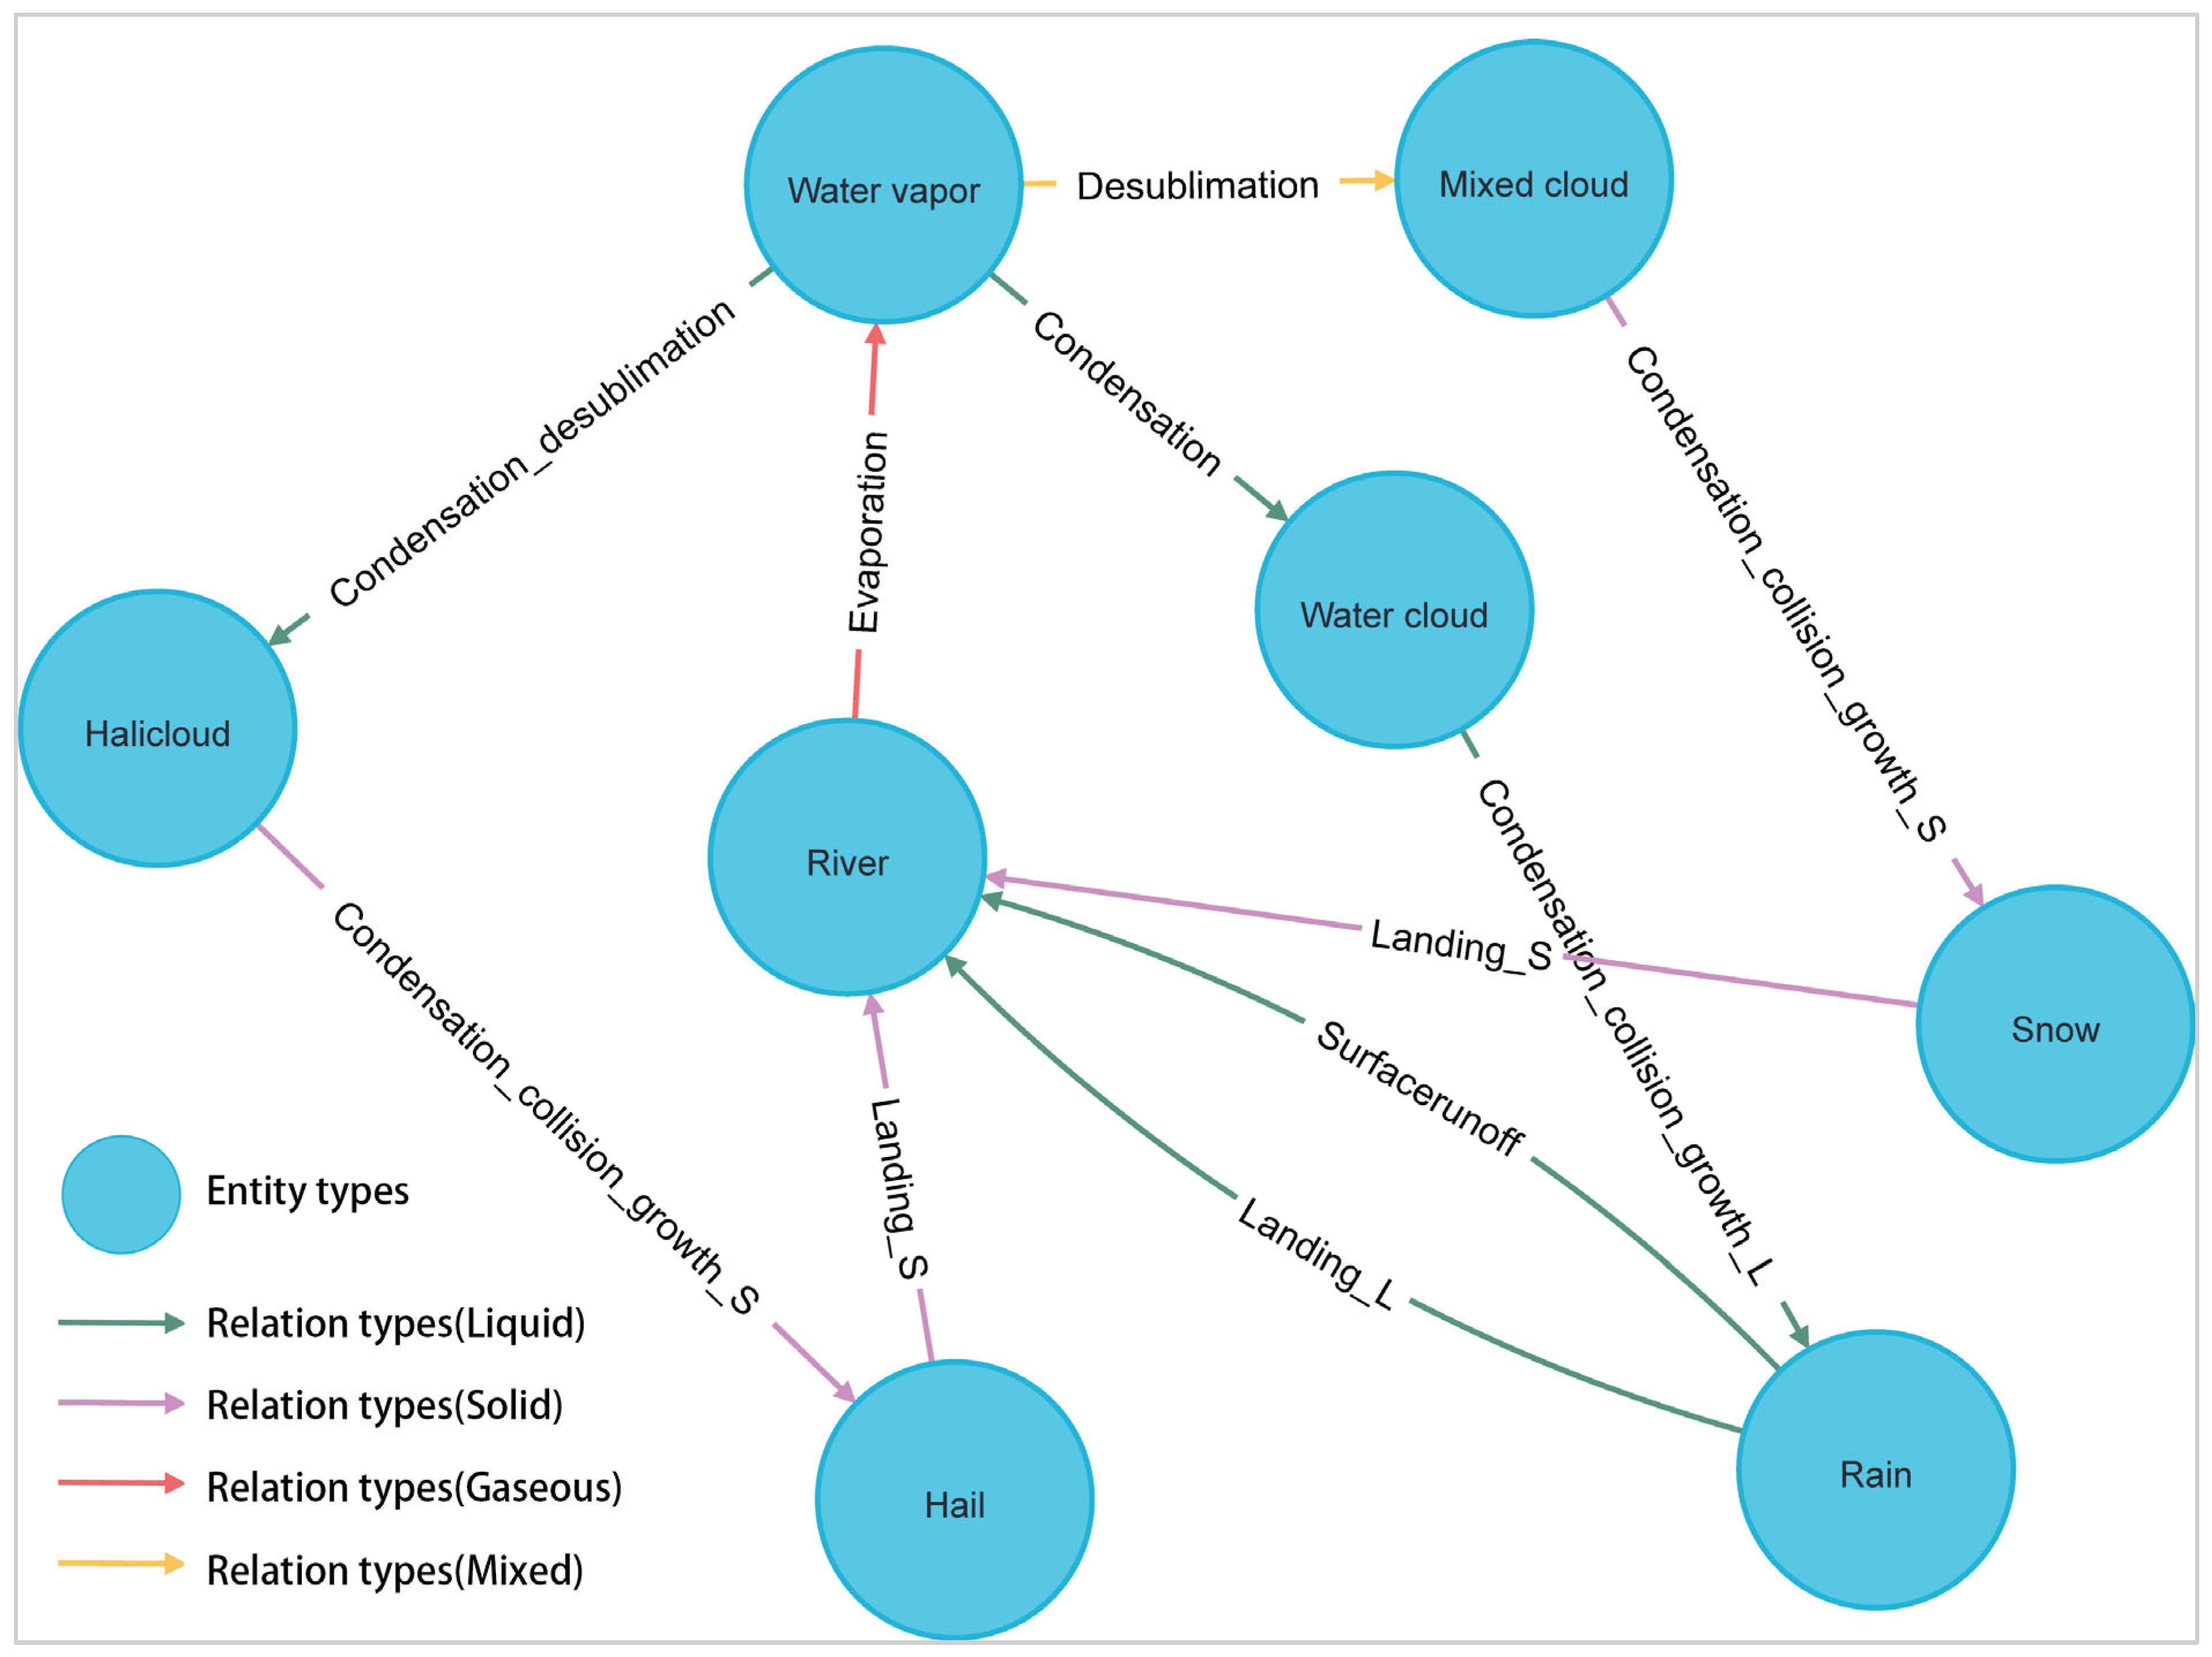
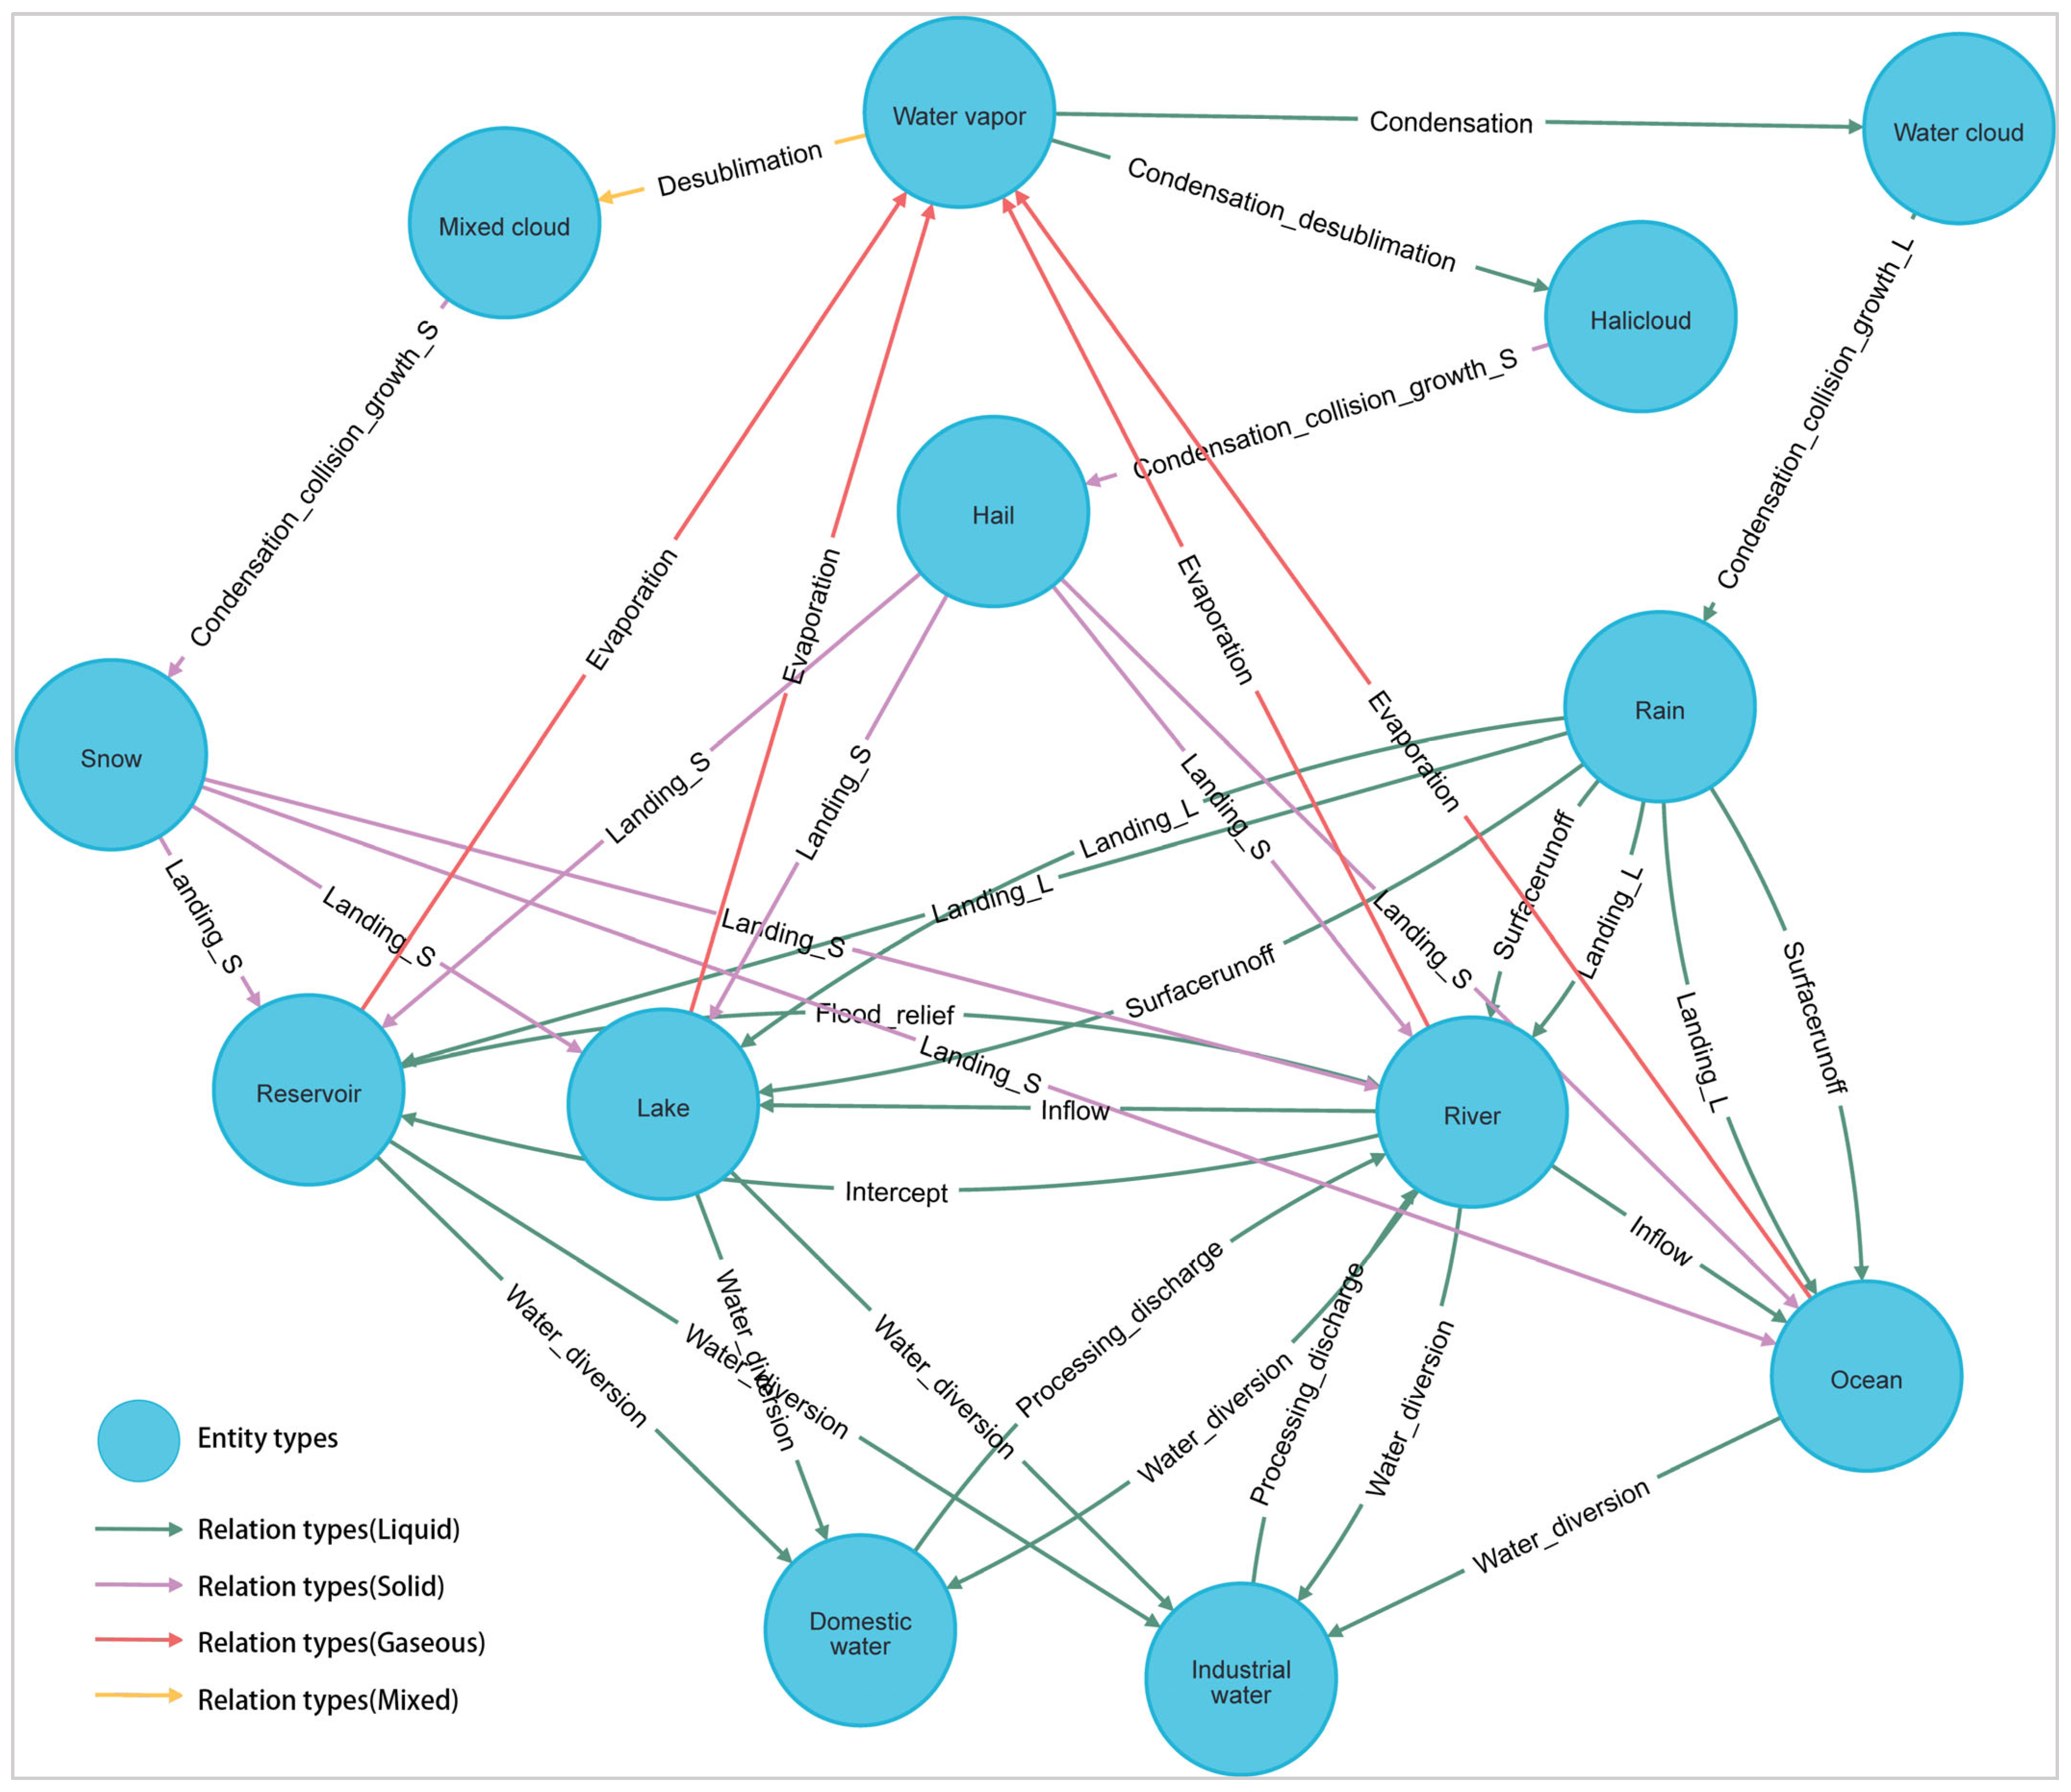
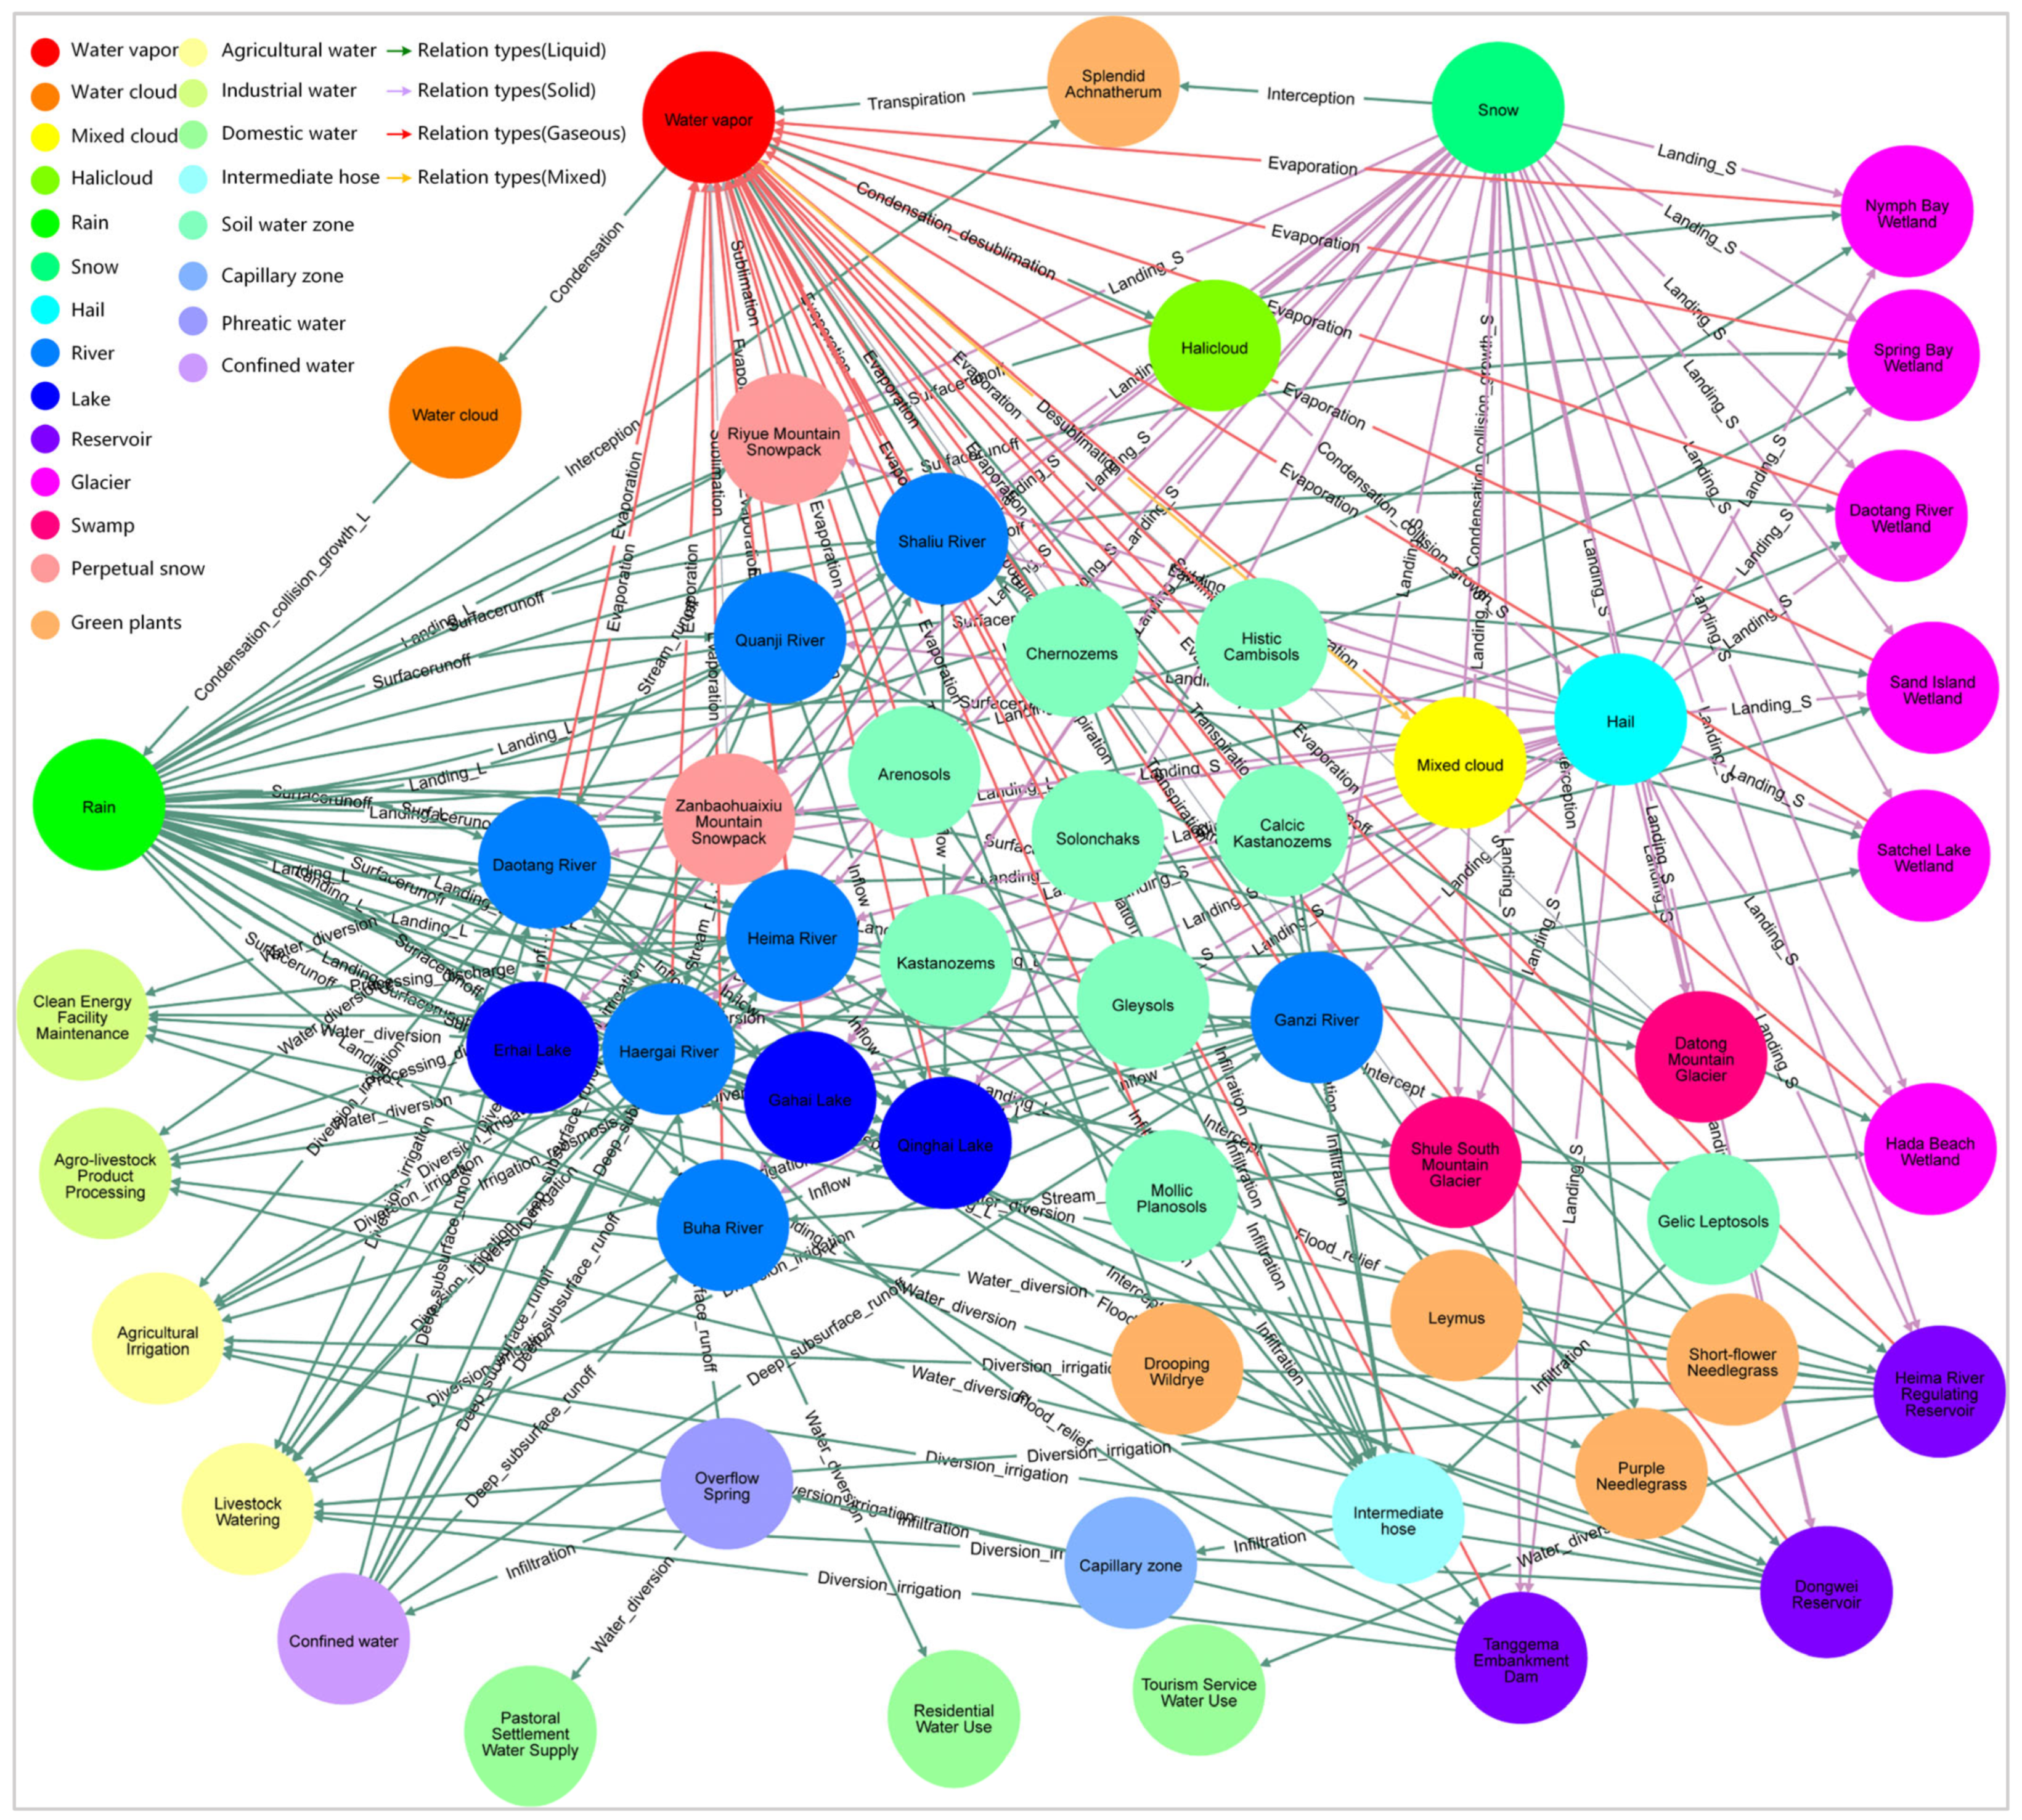
3.1. The Water Process KG
3.2. Water Process Path
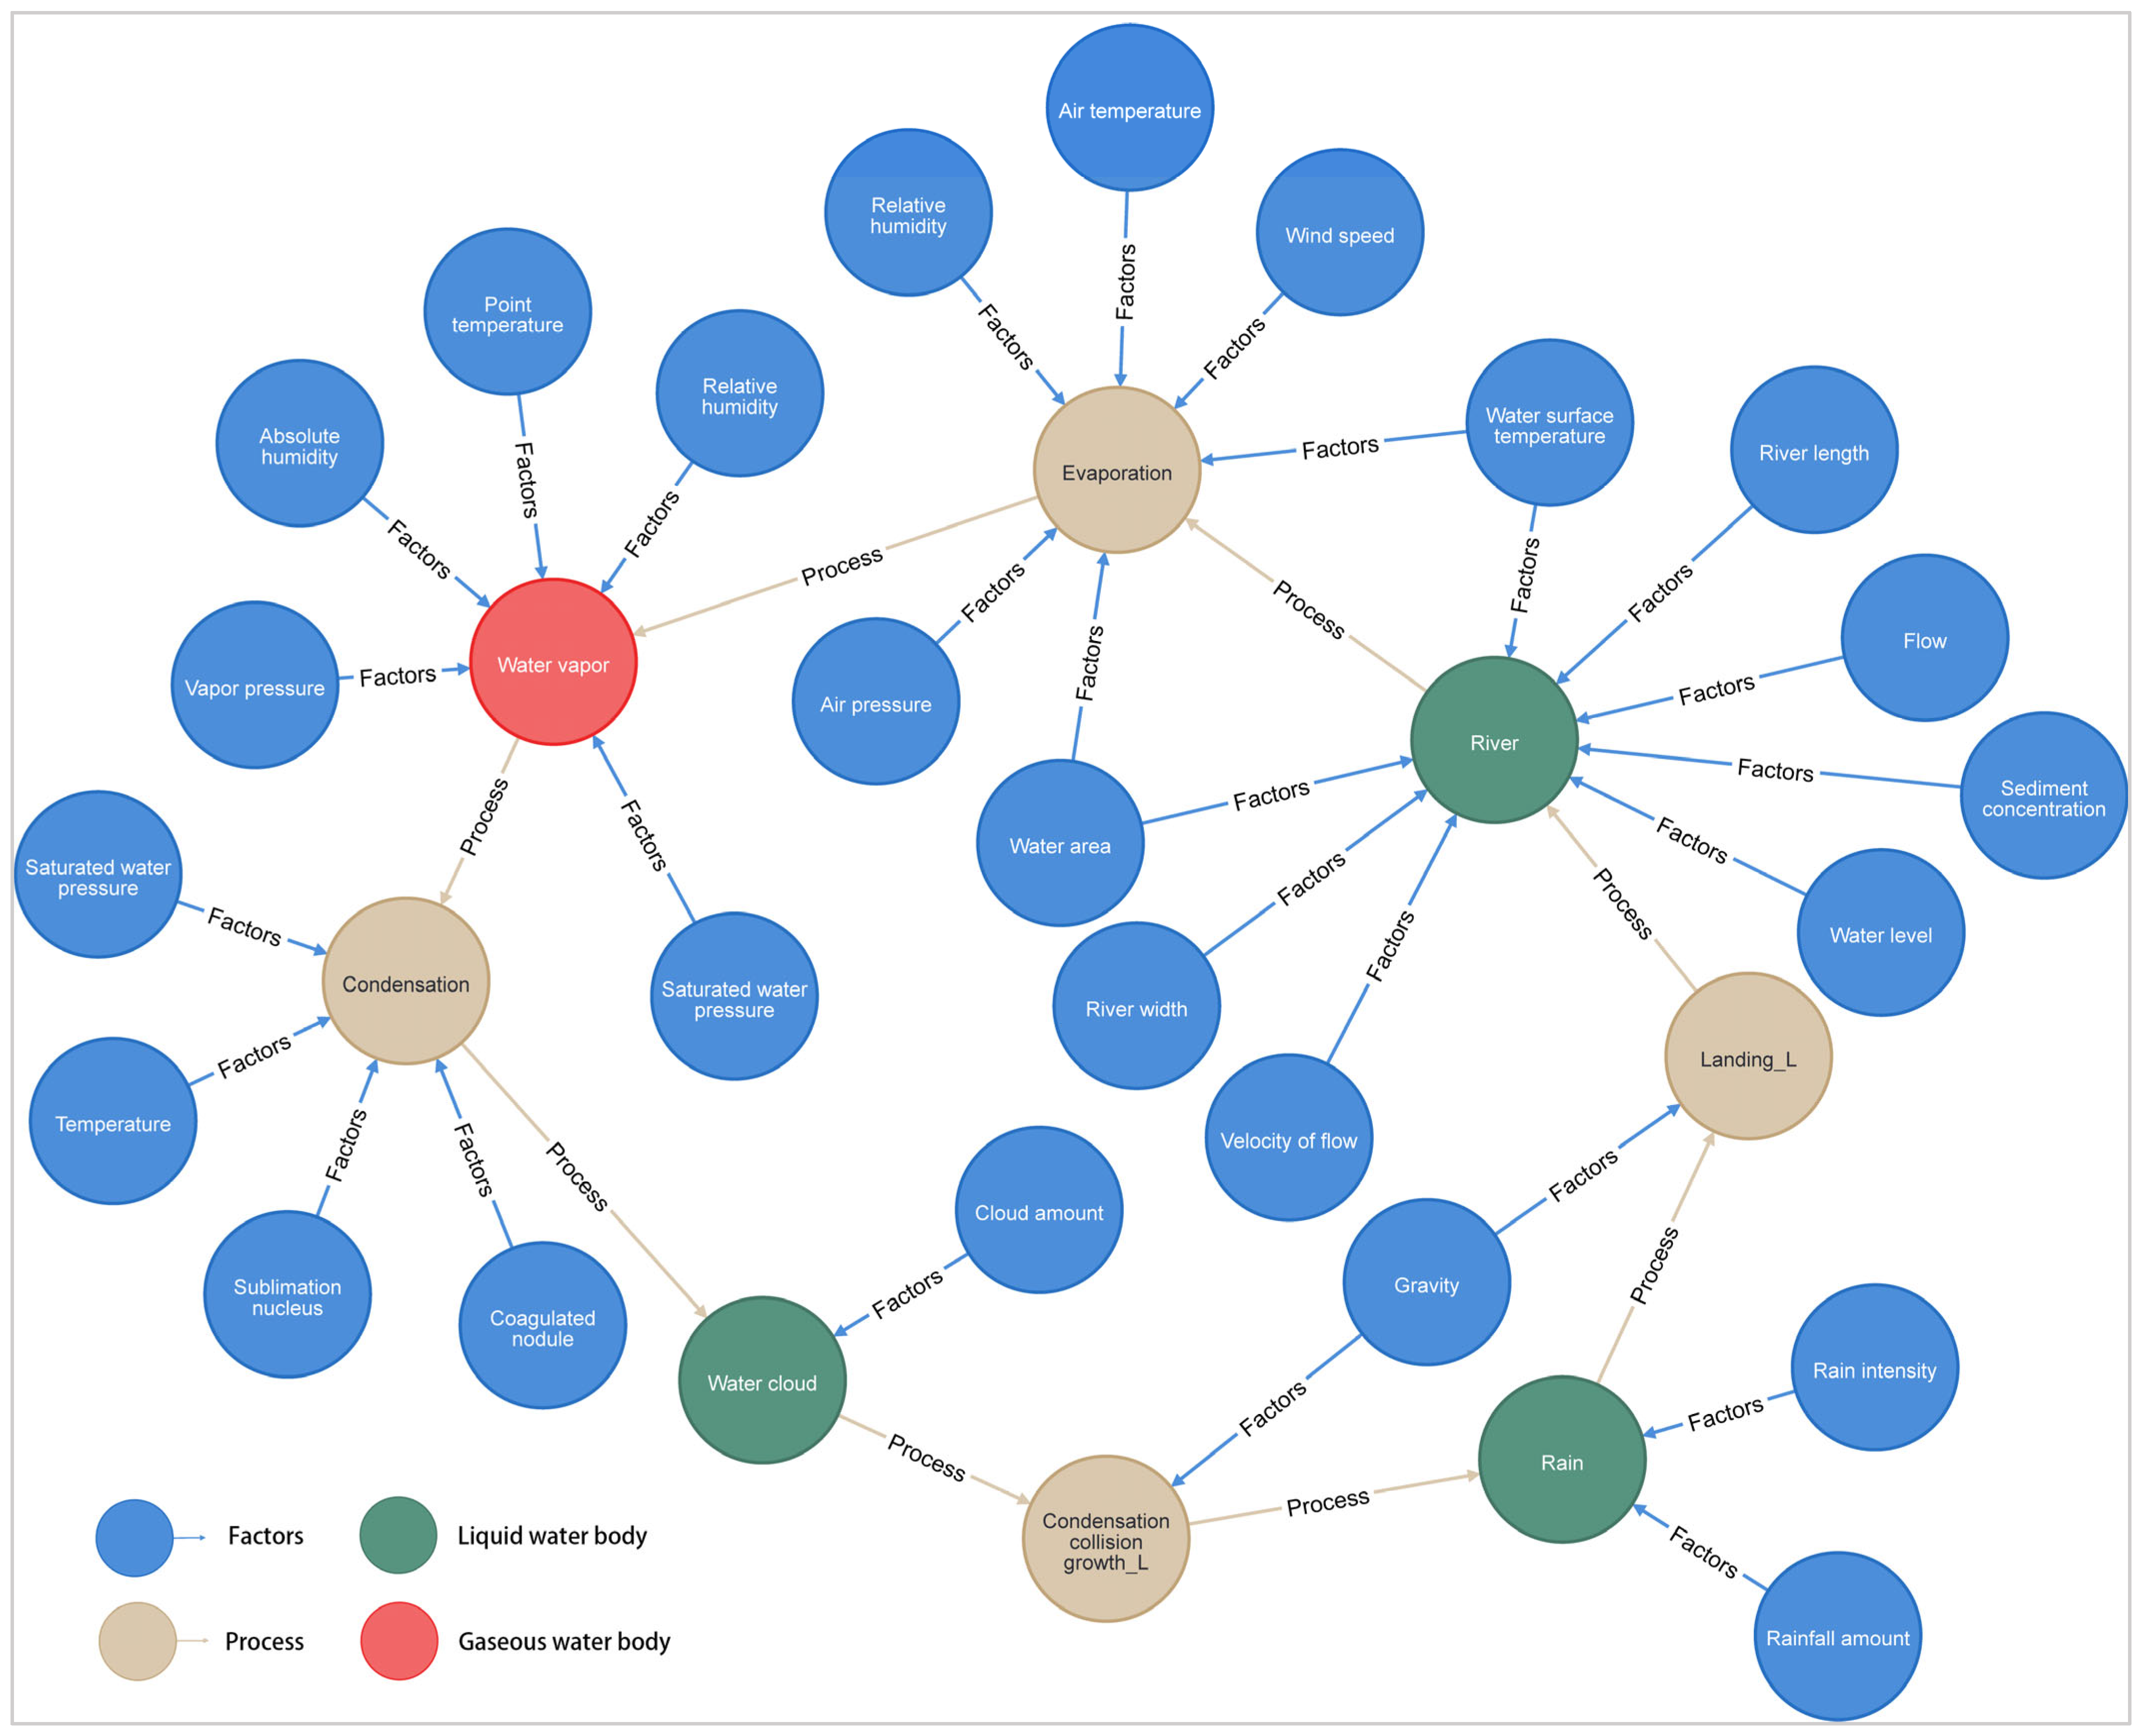
3.3. Water Process Elements
4. Discussion
5. Conclusions
Author Contributions
Funding
Data Availability Statement
Conflicts of Interest
References
- Tong, X.; You, L.; Zhang, J.; Chen, H.; Nguyen, V.T.; He, Y.; Gin, K.Y.H. A comprehensive modelling approach to understanding the fate, transport and potential risks of emerging contaminants in a tropical reservoir. Water Res. 2021, 200, 117298. [Google Scholar] [CrossRef]
- García-Alba, J.; Bárcena, J.F.; Ugarteburu, C.; García, A. Artificial neural networks as emulators of process-based models to analyse bathing water quality in estuaries. Water Res. 2019, 150, 283–295. [Google Scholar] [CrossRef]
- Bai, Y.; Chen, Z.; Xie, J.; Li, C. Daily reservoir inflow forecasting using multiscale deep feature learning with hybrid models. J. Hydrol. 2016, 532, 193–206. [Google Scholar] [CrossRef]
- Salim, I.; Sajjad, R.U.; Paule-Mercado, M.C.; Memon, S.A.; Lee, B.-Y.; Sukhbaatar, C.; Lee, C.-H. Comparison of two receptor models PCA-MLR and PMF for source identification and apportionment of pollution carried by runoff from catchment and sub-watershed areas with mixed land cover in South Korea. Sci. Total. Environ. 2019, 663, 764–775. [Google Scholar] [CrossRef] [PubMed]
- Tan, Q.-F.; Lei, X.-H.; Wang, X.; Wang, H.; Wen, X.; Ji, Y.; Kang, A.-Q. An adaptive middle and long-term runoff forecast model using EEMD-ANN hybrid approach. J. Hydrol. 2018, 567, 767–780. [Google Scholar] [CrossRef]
- Boucher, M.; Quilty, J.; Adamowski, J. Data Assimilation for Streamflow Forecasting Using Extreme Learning Machines and Multilayer Perceptrons. Water Resour. Res. 2020, 56, e2019WR026226. [Google Scholar] [CrossRef]
- Sahoo, B.B.; Jha, R.; Singh, A.; Kumar, D. Application of Support Vector Regression for Modeling Low Flow Time Series. KSCE J. Civ. Eng. 2018, 23, 923–934. [Google Scholar] [CrossRef]
- Samantaray, S.; Das, S.S.; Sahoo, A.; Satapathy, D.P. Monthly runoff prediction at Baitarani river basin by support vector machine based on Salp swarm algorithm. Ain Shams Eng. J. 2022, 13, 101732. [Google Scholar] [CrossRef]
- Yaseen, Z.M.; Sulaiman, S.O.; Deo, R.C.; Chau, K.-W. An enhanced extreme learning machine model for river flow forecasting: State-of-the-art, practical applications in water resource engineering area and future research direction. J. Hydrol. 2019, 569, 387–408. [Google Scholar] [CrossRef]
- Yue, Z.; Ai, P.; Xiong, C.; Hong, M.; Song, Y. Mid- to long-term runoff prediction by combining the deep belief network and partial least-squares regression. J. Hydroinform. 2020, 22, 1283–1305. [Google Scholar] [CrossRef]
- Gao, S.; Huang, Y.; Zhang, S.; Han, J.; Wang, G.; Zhang, M.; Lin, Q. Short-term runoff prediction with GRU and LSTM networks without requiring time step optimization during sample generation. J. Hydrol. 2020, 589, 125188. [Google Scholar] [CrossRef]
- Lv, N.; Liang, X.; Chen, C.; Zhou, Y.; Li, J.; Wei, H.; Wang, H. A long Short-Term memory cyclic model with mutual information for hydrology forecasting: A Case study in the xixian basin. Adv. Water Resour. 2020, 141, 103622. [Google Scholar] [CrossRef]
- Hu, C.; Zhou, L.; Gong, Y.; Li, Y.; Deng, S. Research on Water Level Anomaly Data Alarm Based on CNN-BiLSTM-DA Model. Water 2023, 15, 1659. [Google Scholar] [CrossRef]
- Camps-Valls, G.; Tuia, D.; Zhu, X.X.; Reichstein, M. Deep Learning for the Earth Sciences; Applications of Deep Learning in Hydrology; John Wiley & Sons: Hoboken, NJ, USA, 2021; pp. 285–297. [Google Scholar] [CrossRef]
- Kim, T.; Yang, T.; Gao, S.; Zhang, L.; Ding, Z.; Wen, X.; Gourley, J.J.; Hong, Y. Can artificial intelligence and data-driven machine learning models match or even replace process-driven hydrologic models for streamflow simulation?: A case study of four watersheds with different hydro-climatic regions across the CONUS. J. Hydrol. 2021, 598, 126423. [Google Scholar] [CrossRef]
- Nearing, G.S.; Kratzert, F.; Sampson, A.K.; Pelissier, C.S.; Klotz, D.; Frame, J.M.; Prieto, C.; Gupta, H.V. What Role Does Hydrological Science Play in the Age of Machine Learning? Water Resour. Res. 2021, 57, e2020WR028091. [Google Scholar] [CrossRef]
- Tang, X.; Chi, G.; Cui, L.; Ip, A.W.H.; Yung, K.L.; Xie, X. Exploring Research on the Construction and Application of Knowledge Graphs for Aircraft Fault Diagnosis. Sensors 2023, 23, 5295. [Google Scholar] [CrossRef]
- Tang, X.; Hu, B.; Wang, J.; Wu, C.; Noman, S.M. Intelligent Auxiliary Fault Diagnosis for Aircraft Using Knowledge Graph. In Advanced Intelligent Technologies for Industry: Proceedings of 2nd International Conference on Advanced Intelligent Technologies (ICAIT 2021); Springer: Singapore, 2021; Volume 285, pp. 283–288. [Google Scholar] [CrossRef]
- Lin, X.; Quan, Z.; Wang, Z.J.; Ma, T.F.; Zeng, X.X. KGNN: Knowledge Graph Neural Network for Drug-Drug Interaction Prediction. IJCAI 2021, 380, 2739–2745. [Google Scholar]
- Zeng, X.; Tu, X.; Liu, Y.; Fu, X.; Su, Y. Toward better drug discovery with knowledge graph. Curr. Opin. Struct. Biol. 2022, 72, 114–126. [Google Scholar] [CrossRef]
- Feng, J.; Xu, X.; Lu, J. Construction and Application of Water Conservancy Information Knowledge Graph. Comput. Mod. 2019, 9, 35–40. [Google Scholar]
- Duan, H.; Han, K.; Zhao, H.; Jiang, Y.; Li, H.; Mao, W. Research on water conservancy comprehensive knowledge graph construction. J. Hydraul. Eng. 2021, 52, 948–958. [Google Scholar] [CrossRef]
- Díaz, J.D.R.; Vilches-Blázquez, L.M. Characterizing water quality datasets through multi-dimensional knowledge graphs: A case study of the Bogota river basin. J. Hydroinform. 2022, 24, 295–314. [Google Scholar] [CrossRef]
- Guo, R.; Yang, Q.; Liu, S.; Li, W.; Yuan, X.; Huang, X. Construction and Application of Power Grid Fault Handing Knowledge Graph. Power Syst. Technol. 2021, 45, 2092–2100. [Google Scholar] [CrossRef]
- Jin, Y. Research on TCM Prescription Recommendation Based on Graph Neural Network. Ph.D. Thesis, East China Normal University, Shanghai, China, 2022. [Google Scholar] [CrossRef]
- Maidment, D. Handbook of Hydrology; McGraw-Hill Companies: New York, NY, USA, 1993. [Google Scholar]
- Ling, Z.; Li, R.; Wu, H.; Li, J.; Gui, Z. Semantic-driven construction of geographic entity association network and knowledge service. Acta Geod. Cartogr. Sin. 2023, 52, 478–489. [Google Scholar] [CrossRef]
- Hailemichael, M.T.; Muhammad, U.H.; Bekele, M.W.; Nigus, M.G.; Dechasa, K.Y.; Mekbibu, A.M. Design and Implementation of Satellite Knowledge Graph and Its Application. In Proceedings of the 3rd Asia-Pacific Conference on Communications Technology and Computer Science (ACCTCS), Shenyang, China, 25–27 February 2023; pp. 240–245. [Google Scholar] [CrossRef]
- Chen, Z. Assessment of Hydrological Processes and Ecological Effects in the Qinghai Lake River Basin. Ph.D. Thesis, Qinghai Normal University, Xining, China, 2022. [Google Scholar] [CrossRef]

| No. | Concept I | Concept A | Concept B | Concept Entity |
|---|---|---|---|---|
| 1 | Water body | Sky | Water vapor | Water vapor |
| 2 | Cloud | Water cloud | ||
| 3 | Mixed cloud | |||
| 4 | Halicloud | |||
| 5 | Falling water | Rain | ||
| 6 | Snow | |||
| 7 | Hail | |||
| 8 | Surface | Surface water | River | |
| 9 | Lake | |||
| 10 | Reservoir | |||
| 11 | Swamp | |||
| 12 | Ocean | |||
| 13 | Glacier | |||
| 14 | Perpetual snow | |||
| 15 | Biowater | Green plants | ||
| 16 | Human water use | Agricultural water | ||
| 17 | Industrial water | |||
| 18 | Domestic water | |||
| 19 | Underground | Unsaturated zone | Soil water zone | |
| 20 | Intermediate hose | |||
| 21 | Capillary zone | |||
| 22 | Saturated zone | Phreatic water | ||
| 23 | Confined water |
| Relation Type | Connotation | Head Entity | Tail Entity |
|---|---|---|---|
| Condensation_collision_growth | Indicating that water clouds form rain through condensation, collision and growth. | Water cloud | Rain |
| Condensation_collision_growth | Indicating that mixed clouds form snow through condensation, collision and growth. | Mixed cloud | Snow |
| Condensation_collision_growth | Indicating that halicloud forms hail through condensation, collision and growth. | Halicloud | Hail |
| Landing_L | Indicating that the rain falls from the sky to the river. | Rain | River |
| Landing_S | Indicating that the snow falls from the sky to the river. | Snow | River |
| Landing_S | Indicating that the hail falls from the sky to the river. | Hail | River |
| Surfacerunoff | Indicating that rain enters the river in the form of surface runoff. | Rain | River |
| Surfacerunoff | Indicating that rain enters the lake in the form of surface runoff. | Rain | Lake |
| Landing_L | Indicating that the rain falls from the sky to the lake. | Rain | Lake |
| Landing_S | Indicating that the snow falls from the sky to the lake. | Snow | Lake |
| Landing_S | Indicating that the hail falls from the sky to the lake. | Hail | Lake |
| Landing_L | Indicating that the rain falls from the sky to the reservoir. | Rain | Reservoir |
| Landing_S | Indicating that the snow falls from the sky to the reservoir. | Snow | Reservoir |
| Landing_S | Indicating that the hail falls from the sky to the reservoir. | Hail | Reservoir |
| Landing_L | Indicating that the rain falls from the sky to the swamp. | Rain | Swamp |
| Landing_S | Indicating that the snow falls from the sky to the swamp. | Snow | Swamp |
| Landing_S | Indicating that the hail falls from the sky to the swamp. | Hail | Swamp |
| Surfacerunoff | Indicating that rain enters the swamp in the form of surface runoff. | Rain | Swamp |
| Surfacerunoff | Indicating that rain enters the ocean in the form of surface runoff. | Rain | Ocean |
| Landing_L | Indicating that the rain falls from the sky to the ocean. | Rain | Ocean |
| Landing_S | Indicating that the snow falls from the sky to the ocean. | Snow | Ocean |
| Landing_S | Indicating that the hail falls from the sky to the ocean. | Hail | Ocean |
| Landing_L | Indicating that the rain falls from the sky to the glacier. | Rain | Glacier |
| Landing_S | Indicating that the snow falls from the sky to the glacier. | Snow | Glacier |
| Landing_S | Indicating that the hail falls from the sky to the glacier. | Hail | Glacier |
| Landing_L | Indicating that the rain falls from the sky to the perpetual snow. | Rain | Perpetual snow |
| Landing_S | Indicating that the snow falls from the sky to the perpetual snow. | Snow | Perpetual snow |
| Landing_S | Indicating that the hail falls from the sky to the perpetual snow. | Hail | Perpetual snow |
| Interception | Indicating that the parts of trees and plants cut off by the rain before it hits the ground. | Rain | Green plants |
| Interception | Indicating that the parts of trees and plants cut off by the snow before it hits the ground. | Snow | Green plants |
| Diversion_irrigation | Indicating that agriculture is irrigated with river water. | River | Agricultural water |
| Diversion_irrigation | Indicating that agriculture is irrigated with reservoir water. | Reservoir | Agricultural water |
| Diversion_irrigation | Indicating that agriculture is irrigated with lake water. | Lake | Agricultural water |
| Irrigation_reosmosis | Indicating that agricultural water is called soil water through irrigation. | Agricultural water | Soil water zone |
| Water_diversion | Indicating that the river water is diverted to domestic use. | River | Domestic water |
| Water_diversion | Indicating that the lake water is diverted to domestic water. | Lake | Domestic water |
| Water_diversion | Indicating that the reservoir water is diverted to domestic use. | Reservoir | Domestic water |
| Processing_discharge | Indicating that domestic water is processed and discharged into the river. | Domestic water | River |
| Water_diversion | Indicating that the river water is used for production. | River | Industrial water |
| Water_diversion | Indicating that the reservoir water is used for production. | Reservoir | Industrial water |
| Water_diversion | Indicating that the lake water is used for production. | Lake | Industrial water |
| Water_diversion | Indicating that the ocean water is used for production. | Ocean | Industrial water |
| Processing_discharge | Indicating that industrial water is processed and discharged into the river. | Industrial water | River |
| Intercept | Indicating that the river has been intercepted and entered the reservoir. | River | Reservoir |
| Flood-relief | Indicating that the reservoir water is discharged into the river through flood discharge. | Reservoir | River |
| Inflow | Indicating that the river flows into the lake. | River | Lake |
| Inflow | Indicating that river water flows into the ocean. | River | Ocean |
| Subsurfaceflow | Indicating that soil water enters the river in the form of soil flow. | Soil water zone | River |
| Stream_runoff | Indicating that glaciers melt into water and flow into rivers. | Glacier | River |
| Stream_runoff | Indicating that the snow melts into water and flows into the river. | Perpetual snow | River |
| Infiltration | Indicating that soil water can be changed into intermediate hose by infiltration. | Soil water zone | Intermediate hose |
| Infiltration | Indicating that intermediate hose water can be changed into capillary zone water by infiltration. | Intermediate hose | Capillary zone |
| Infiltration | Indicating that capillary zone can be changed into phreatic water by infiltration. | Capillary zone | Phreatic water |
| Infiltration | Indicating that phreatic water can be changed into confined water by infiltration. | Phreatic water | Confined water |
| Shallow_subsurface_runoff | Indicating that diving enters the river in the form of shallow subsurface runoff. | Phreatic water | River |
| Deep_subsurface_runoff | Indicating that the confined water enters the river in the form of deep underground runoff. | Confined water | River |
| Evaporation | Indicating that the river water changes from liquid to water vapor by evaporation. | River | Water vapor |
| Evaporation | Indicating that the lake water changes from liquid to water vapor by evaporation. | Lake | Water vapor |
| Evaporation | Indicating that the reservoir water changes from liquid to water vapor by evaporation. | Reservoir | Water vapor |
| Evaporation | Indicating that the ocean water changes from liquid to water vapor by evaporation. | Ocean | Water vapor |
| Evaporation | Indicating that the soil water changes from liquid to water vapor by evaporation. | Soil water zone | Water vapor |
| Evaporation | Indicating that the swamp water changes from liquid to water vapor by evaporation. | Swamp | Water vapor |
| Transpiration | Indicating that green plants turn water into water vapor by transpiration. | Green plants | Water vapor |
| Sublimation | Indicating that glaciers change solid water into vapor in the form of sublimation. | Glacier | Water vapor |
| Sublimation | Indicating that snow changes solid water into vapor in the form of sublimation. | Perpetual snow | Water vapor |
| Condensation | Indicating that water vapor changes into water and clouds through condensation. | Water vapor | Water cloud |
| Desublimation | Indicating that water vapor changes into mixed clouds through desublimation. | Water vapor | Mixed cloud |
| Condensation_desublimation | Indicating that water vapor turns into hail clouds by sublimation_condensation. | Water vapor | Halicloud |
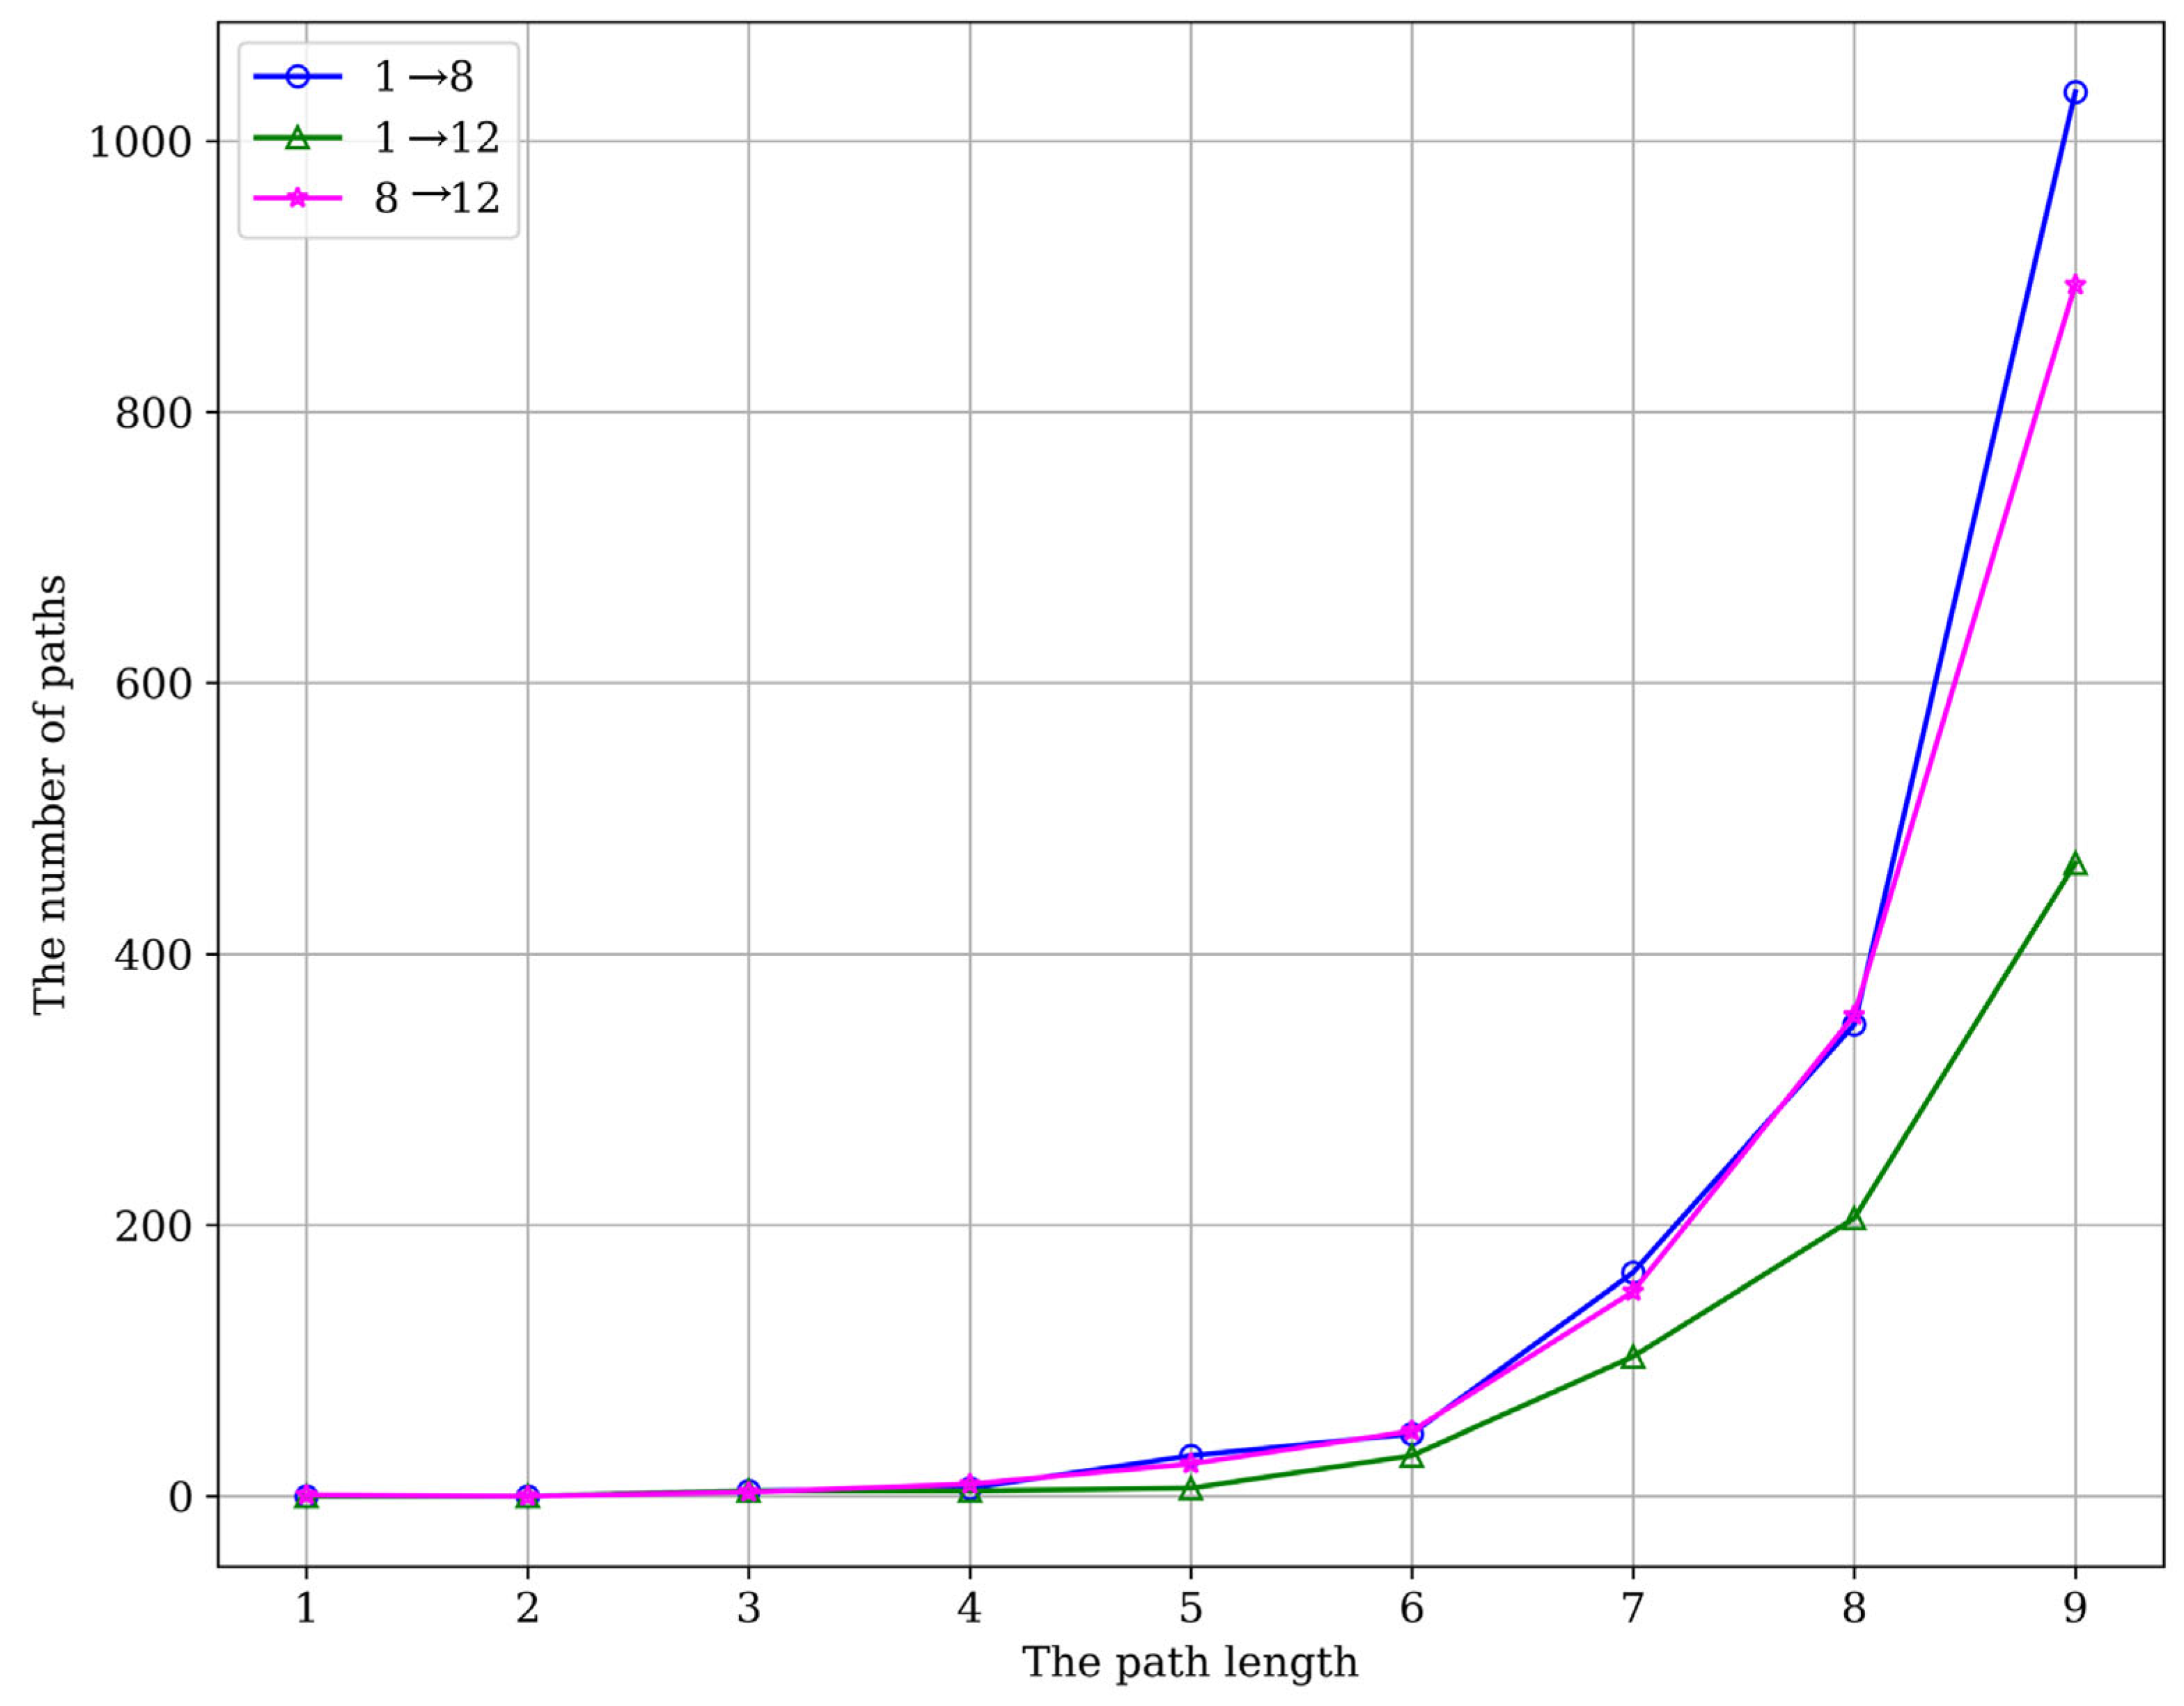
| Head Entity (id) | Water Vapor (1) | Water Vapor (1) | River (8) |
|---|---|---|---|
| Tail Entity (id) | River (8) | Ocean (12) | Ocean (12) |
| Paths by length | 1 → 8 | 1 → 12 | 8 → 12 |
| 1 | 0 | 0 | 1 |
| 2 | 0 | 0 | 0 |
| 3 | 4 | 4 | 3 |
| 4 | 6 | 4 | 9 |
| 5 | 30 | 6 | 24 |
| 6 | 46 | 30 | 48 |
| 7 | 165 | 103 | 151 |
| 8 | 348 | 205 | 355 |
| 9 | 1036 | 467 | 894 |
| No. | Concept Entity | Instance Entity | No. | Concept Entity | Instance Entity |
|---|---|---|---|---|---|
| 1 | Water vapor | Water vapor | 14 | Perpetual snow | Zanbaohuaixiu Mountain Snowpack |
| 2 | Water cloud | Water cloud | Riyue Mountain Snowpack | ||
| 3 | Mixed cloud | Mixed cloud | 15 | Green plants | Splendid Achnatherum |
| 4 | Halicloud | Halicloud | Leymus | ||
| 5 | Rain | Rain | Short-flower Needlegrass | ||
| 6 | Snow | Snow | Purple Needlegrass | ||
| 7 | Hail | Hail | Drooping Wildrye | ||
| 8 | River | Buha River | 16 | Agricultural water | Agricultural Irrigation |
| Shaliu River | Livestock Watering | ||||
| Quanji River | 17 | Industrial water | Agro-livestock Product Processing | ||
| Haergai River | Clean Energy Facility Maintenance | ||||
| Ganzi River | 18 | Domestic water | Residential Water Use | ||
| Daotang River | Tourism Service Water Use | ||||
| Heima River | Pastoral Settlement Water Supply | ||||
| 9 | Lake | Qinghai Lake | 19 | Soil water zone | Gelic Leptosols |
| Erhai Lake | Histic Cambisols | ||||
| Gahai Lake | Mollic Planosols | ||||
| 10 | Reservoir | Dongwei Reservoir | Calcic Kastanozems | ||
| Heima River Regulating Reservoir | Gleysols | ||||
| Tanggema Embankment Dam | Arenosols | ||||
| 11 | Swamp | Daotang River Wetland | Chernozems | ||
| Nymph Bay Wetland | Kastanozems | ||||
| Sand Island Wetland | Solonchaks | ||||
| Spring Bay Wetland | 20 | Intermediate hose | Intermediate hose | ||
| Satchel Lake Wetland | 21 | Capillary zone | Capillary zone | ||
| Hada Beach Wetland | 22 | Phreatic water | Overflow Spring | ||
| 13 | Glacier | Shule South Mountain Glacier | 23 | Confined water | Confined water |
| Datong Mountain Glacier |
Disclaimer/Publisher’s Note: The statements, opinions and data contained in all publications are solely those of the individual author(s) and contributor(s) and not of MDPI and/or the editor(s). MDPI and/or the editor(s) disclaim responsibility for any injury to people or property resulting from any ideas, methods, instructions or products referred to in the content. |
© 2025 by the authors. Licensee MDPI, Basel, Switzerland. This article is an open access article distributed under the terms and conditions of the Creative Commons Attribution (CC BY) license (https://creativecommons.org/licenses/by/4.0/).
Share and Cite
Song, Y.; Ai, P.; Xiong, C.; Li, J.; Gong, S. Research on Construction and Application of Water Processes Based on Knowledge Graph: Analysis of Dynamic Paths and Impact Factors. Water 2025, 17, 2020. https://doi.org/10.3390/w17132020
Song Y, Ai P, Xiong C, Li J, Gong S. Research on Construction and Application of Water Processes Based on Knowledge Graph: Analysis of Dynamic Paths and Impact Factors. Water. 2025; 17(13):2020. https://doi.org/10.3390/w17132020
Chicago/Turabian StyleSong, Yanhong, Ping Ai, Chuansheng Xiong, Jintao Li, and Shicheng Gong. 2025. "Research on Construction and Application of Water Processes Based on Knowledge Graph: Analysis of Dynamic Paths and Impact Factors" Water 17, no. 13: 2020. https://doi.org/10.3390/w17132020
APA StyleSong, Y., Ai, P., Xiong, C., Li, J., & Gong, S. (2025). Research on Construction and Application of Water Processes Based on Knowledge Graph: Analysis of Dynamic Paths and Impact Factors. Water, 17(13), 2020. https://doi.org/10.3390/w17132020