Abstract
Due to the lack of sophisticated instruments for monitoring sludge dewatering performance in certain wastewater treatment plants, there is an urgent need to develop cost-effective and rapidly deployable technologies for assessing sludge dewaterability. This study proposed an image-based approach to evaluate sludge dewaterability. Flocculation images of sludge were captured using a smartphone under controlled conditions and processed via MATLAB for grayscale adjustment, contrast enhancement, and size standardization. Fractal image analysis was employed to justify the selection of floc area (rather than floc equivalent diameter) for downstream analyses. Significant correlations were observed between the number of different sludge floc area range and key dewaterability parameters: The number of flocs in area range of 10−6–10−5 cm2 showed a negative correlation with capillary suction time (CST) (regression coefficient (R) = −0.511, probability (p) < 0.05) and a positive correlation with median particle size (R = 0.470, p < 0.05); the number of flocs in area range of 10−5–10−4 cm2 exhibited a stronger negative correlation with CST (R = −0.538, p < 0.05) and a positive correlation with median particle size (R = 0.480, p < 0.05). Further validation experiments using a laboratory-scale diaphragm filter press demonstrated that when the proportion of the number of flocs in area range of 10−5–10−4 cm2 relative to the total number of flocs for conditioned sludge fell below 70%, the dewatered sludge cake achieved a water content of less than 60%. This study highlights the feasibility of using commercially available smartphones as a practical tool for evaluating sludge dewaterability.
1. Introduction
Sludge dewatering serves as an essential wastewater treatment step, significantly reducing sludge volume while enhancing disposal effectiveness [1]. Optimized dewatering processes improve resource recovery efficiency and reduce operational costs and environmental footprint [2,3]. The optimal selection and dose of flocculants represent a critical determinant of sludge dewatering efficiency [3]. Flocculant-enhanced sludge dewatering performance was typically assessed through physicochemical parameters, including capillary suction time (CST), specific resistance to filtration, particle size distribution, and bound water content [4]. In the absence of on-site monitoring equipment, wastewater treatment plants (WWTPs) operators empirically adjusted the flocculant dose based on visual assessment of floc formation [5]. An urgent demand exists for cost-effective, field-deployable technologies capable of rapidly assessing sludge dewaterability.
Floc morphology provides additional information regarding the properties of sludge and serves as an indicator for sludge dewatering or settling [1]. Image-based analysis of sludge floc morphology is highly effective for optimizing flocculant dosing in dewatering processes [5,6]. Microscopy-image analysis integration has been effectively used for characterizing activated sludge floc morphology [7]. Researchers have successfully used low-power microscopic imaging coupled with digital analysis to predict waste-activated sludge (WAS) settling behavior [8]. A novel deep learning-enabled imaging system has recently been developed for autonomous flocculant dosing in WWTPs, demonstrating exceptional accuracy and facilitating real-time, data-informed flocculation control [5]. Automated digital microscopy analysis has demonstrated that WAS flocs exhibited large size, high density, smooth surfaces, and reduced extracellular polymeric substances (EPS) content, significantly enhancing both sludge dewaterability and settling performance in WWTPs [6]. Image capture in these applications consistently uses compound light microscopes configured for brightfield or phase-contrast observation [9]. The need for meticulous feature analysis (size, hue, and brightness) in optical imaging presented usability barriers for frontline operators [10]. Conventional microscopic analysis presented practical limitations for routine monitoring due to excessive time requirements and substantial operational costs [5], and a novel technology with less time requirement and easier operation needs to be developed.
Smartphone use has reached near-ubiquity, with the global market continuing its rapid expansion [11]. Modern smartphones possess sufficient imaging capabilities and processing power to both acquire and algorithmically analyze visual data [11]. Smartphone cameras have become ubiquitous imaging tools, leveraging continuous improvements in portability, connectivity, and image quality over the past decade [12]. Smartphone imaging provides constrained control over both capture parameters and automated post-processing routines [13]. Integrated exposure control systems in smartphones dynamically balance shutter timing and electronic amplification to avoid luminance artifacts [14]. Currently, limited studies have investigated the diagnostic potential of smartphone cameras for assessing sludge floc morphology and its correlation with dewatering performance.
Fractal theory has been extensively applied to characterize sludge flocs, which exhibit complex morphological properties including high irregularity, self-similarity, and scale invariance [15]. In this study, the fractal method was adopted to justify the choice of either floc area or floc equivalent diameter for downstream analyses. The relationships between smartphone-derived floc morphological characteristics and sludge dewaterability parameters were systematically examined. A laboratory-scale diaphragm filter press experiment was further used to validate the relationship between the number of flocs with different area ranges and the water content of the dewatered sludge cake. Collectively, the results gained from this study would provide insights into the use of smartphones in evaluating sludge dewatering for on-site operation.
2. Materials and Methods
2.1. Sludge Sampling and Characteristics
Three types of WAS were used herein. WAS1 was taken from Fengqian Beikong Enterprises Water Group Co., Ltd. (Jieyang, China). WAS2 was taken from the Mayu Community Domestic Sewage Treatment Facility Wastewater Treatment Plant (Shantou, China). WAS3 was taken from Quxi Beikong Enterprises Water Group Co., Ltd. (Jieyang, China). The characteristics of the drawn sludge samples are shown in Table 1. The samples were stored at 4 °C for less than a week and were exposed to the downstream experiments.

Table 1.
Basic characteristics of sludge samples.
2.2. Experimental Procedures
Sludge samples (500 mL) were dosed with varying concentrations of cationic polyacrylamide (PAM) (0.00, 0.05, 0.10, 0.20, and 0.50 wt%) and were homogenized for 5 min using magnetic stirring. Color images were acquired using an iPhone (Apple Inc., Cupertino, CA, USA) under controlled illumination conditions (SL60IID LED, Godox, Dongguan, China) at 80% maximum intensity (14,880 Lux), with the camera positioned at a fixed 20 cm working distance above samples. Following conditioning, aliquots of the treated sludge were collected for comprehensive characterization, including CST, specific resistance to filtration (SRF), bound water content, and particle size distribution analyses. The captured images subsequently underwent quantitative morphological characterization.
2.3. Validation Experiments
Sludge samples were dosed with varying concentrations of cationic polyacrylamide (0.00, 0.05, 0.10, 0.20, and 0.50 wt%). The sludge samples were then dewatered using a custom-designed diaphragm filter press under 5 MPa pressure for 10 min. The filtration system incorporated an electro-hydraulic jack with a separate cylinder (Joba Mechanical Manufacture Co., Ltd., Taizhou, China). The water content of the obtained sludge cake was measured accordingly [16].
2.4. Analyses
2.4.1. Image Analysis
Initial image preprocessing, including grayscale conversion, contrast enhancement, and size normalization, was performed using the Image Processing Toolbox in MATLAB R2023b (MathWorks, Inc., Natick, MA, USA). Images were grayscale-adjusted and resized to 1024 × 768 pixels to optimize particle contour detection in ImageJ 1.45G (Wayne Rasband, Bethesda, MD, USA). Processed Matlab images were analyzed in ImageJ to quantify floc diameter, area, and size distribution. Specifically, ImageJ automatically identified floc contours, quantified particle areas, and compiled size distributions, and the floc area was obtained accordingly. The floc equivalent diameter was obtained based on the assumption that the sludge floc was circular. Later, the data obtained from ImageJ were exported into Excel. The correlations between the proportion of each floc area to total floc area (10−6–10−5 cm2,10−5–10−4 cm2, 10−4–10−3 cm2, > 10−3 cm2, and > 10−6 cm2) and parameters reflecting sludge dewaterability were further explored via the software IBM SPSS Statistics 29 (IBM Corp., New York, NY, USA).
2.4.2. Fractal Image Analysis
The fractal dimension (D) was determined based on the ImageJ automatically recognized binary image. Each sludge floc was regarded as an independent island, and the corresponding D of each group was obtained by the area-perimeter method [17]. For sludge flocs, Equation (1) describes the relationship between the area and perimeter:
where D is the fractal dimension, is the area of sludge flocs, and It is the perimeter of sludge flocs.
2.4.3. Other Analytical Methods
Sludge filterability was assessed using CST measurements, performed with 5 mL sludge aliquots via a standardized CST analyzer (Model 304B, OFI Testing Equipment, Houston, TX, USA) according to established protocols [1]. The SRF was employed to assess the sludge’s resistance to water flow during dewatering. The SRF values herein were measured via a self-designed device (Daming, Shanghai, China) [1]. The bound water content was measured with a differential scanning calorimetry (DSC) analyzer (DSC6000, PerkinElmer, Hopkinton, MA, USA) under a nitrogen atmosphere [4]. A laser particle size analyzer (Mastersizer 3000, Malvern Panalytical, Malvern, UK) was used to measure the particle size [4].
2.5. Statistical Analysis
Statistical analyses were performed using various software packages. One-way analysis of variance (ANOVA) was conducted using SPSS Statistics 27 for Windows (IBM Corporation, New York, NY, USA), with the least significant difference (LSD) test applied for group comparisons. Prior to ANOVA, data normality was assessed using the Duncan method. Statistical significance was set at p < 0.05, and letter notation was used to indicate differences. Pearson’s correlation coefficients (R) were calculated using SPSS to assess the relationships between sludge floc area and sludge physicochemical properties reflecting sludge dewaterability. Spearman rank correlation analysis was conducted via R software (4.1.0) to evaluate the association between sludge floc area and dewatering performance.
3. Results and Discussion
3.1. Sludge Dewatering Performance
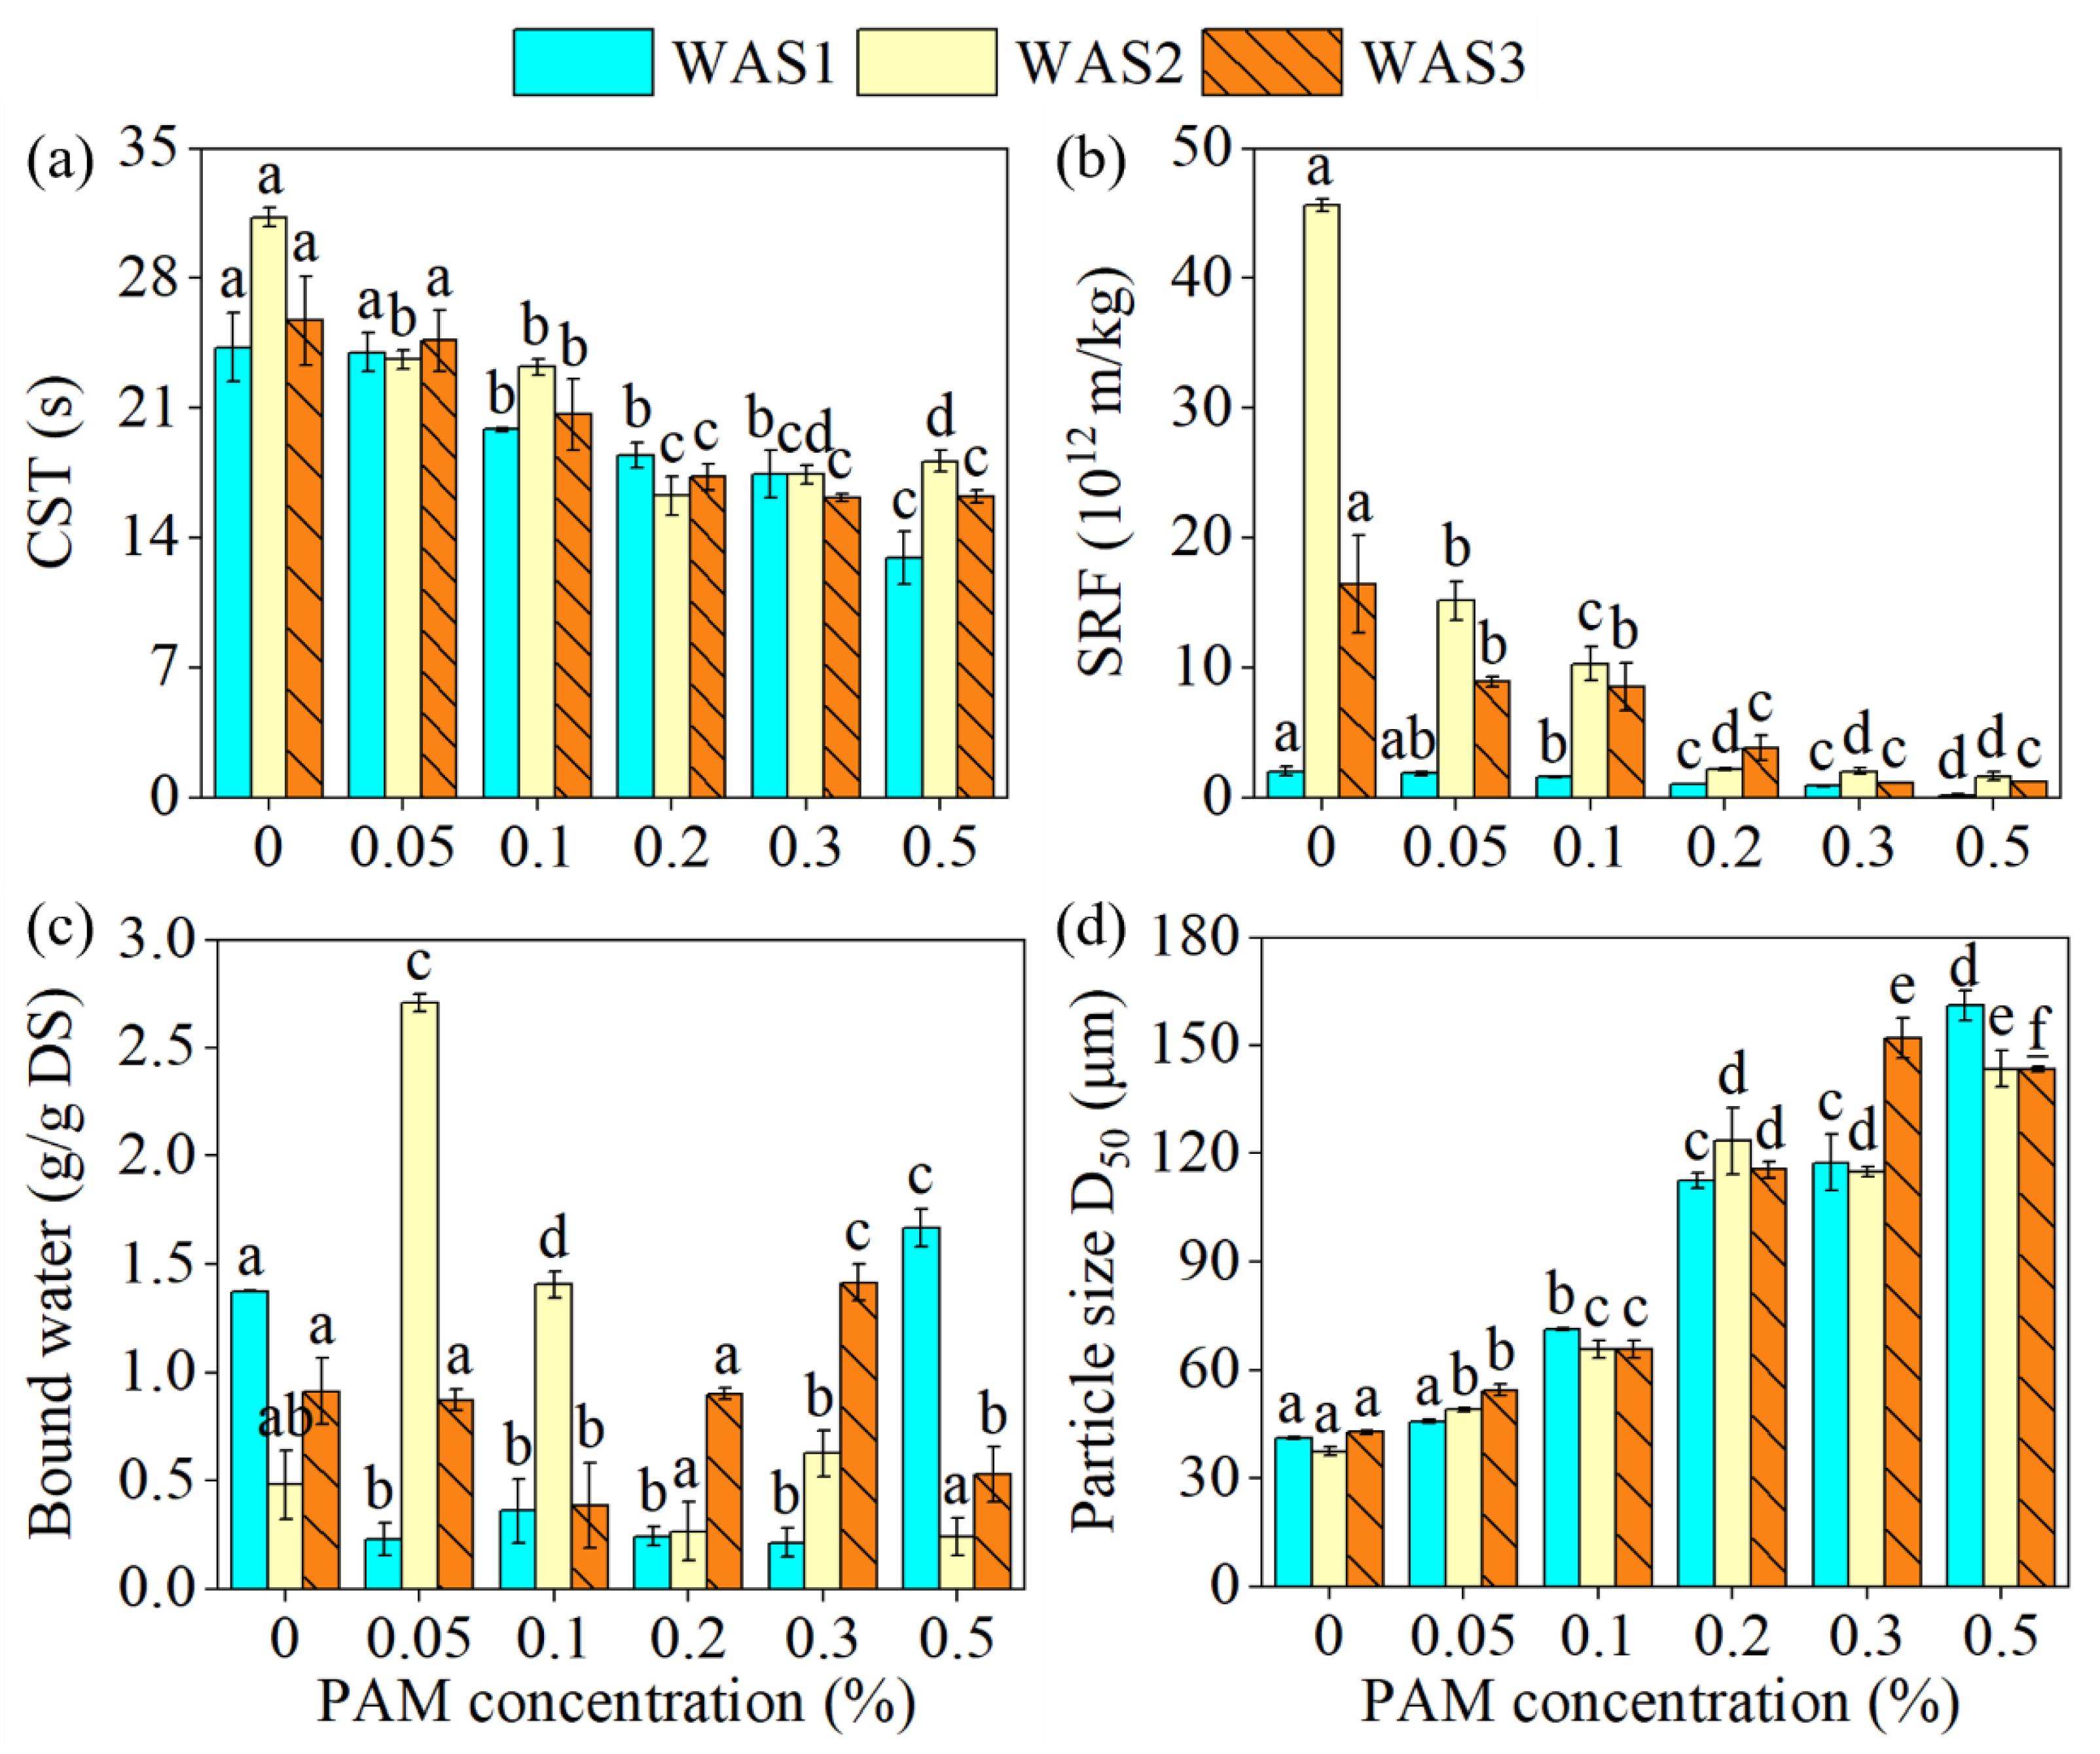
For all the sludge samples investigated, when the concentration of PAM increased, the values of CST and SRF both showed a decreasing trend (Figure 1a,b). This may be because when PAM was added, the flocculant bound tiny sludge flocs together to form larger flocs, reducing the affinity of tiny sludge flocs towards water molecules [18]. Interestingly, there were unobservable changes in the bound water of different sludge samples (Figure 1c). To be exemplified, for WAS1, the content of bound water decreased first and then increased as PAM dose increased; for WAS2, the content of bound water increased first and then decreased as PAM dose increased; for WAS3, the content of bound water decreased first, then increased, and then decreased again. It seemed that cationic PAM was ineffective in removing bound water. Jin et al. (2016) reported that free water increased up to 95.04% by the addition of cationic PAM [18]. While Kopp and Dichtl (2000) reported that polymer conditioning increased the velocity of sludge water release, the free water content was not influenced by this process [19]. As to the bound water, Katsiris and Kouzeli-Katsiri (1987) reported that decreased bound water content with increased polymer dose [20]. However, Smollen (1990) had a reverse conclusion that the bound water content increased after polymer addition due to the adsorption of water molecules onto the polymer molecules [21]. Wu et al. (1997) suggested that the bound water of alum sludge decreased first and then increased with the polymer dose [22]. Chu and Lee (1999) agreed with the findings of Wu et al. (1997), although some argued that bound water was not changed by conditioning (Tsang and Vesilind, 1990) [22,23,24]. PAM primarily acted by bridging particles to form larger flocs, but this did not always correlate directly with bound water release [25].
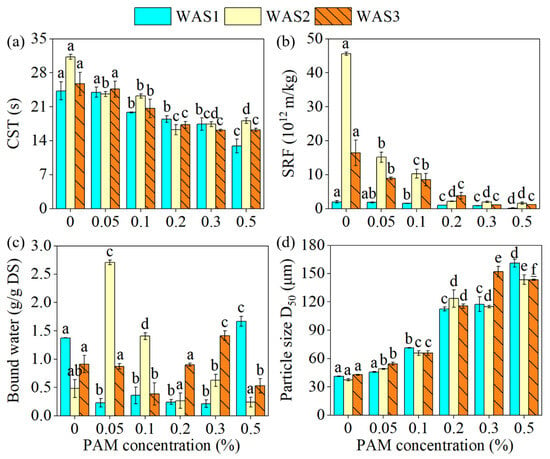
Figure 1.
Sludge dewatering parameters with different PAM concentrations: (a) CST, (b) SRF, (c) bound water, and (d) median particle size. Letter labels were used to indicate whether there were significant differences in the data. a, b, c, d, e, and f were used for WAS1, WAS2, and WAS3. The same letters represented insignificant differences (p > 0.05), while different letters represented.
The results of particle size further corroborate the results of CST and SRF. As the dose of cationic PAM increased, the median particle sizes all showed increased trends, regardless of WAS1, WAS2, and WAS3 samples applied (Figure 1d). Sludge particles were typically negatively charged due to functional groups (e.g., carboxyl, phosphate) on microbial cell surfaces and extracellular polymeric substances [26]. Cationic PAM (with positively charged groups like −NH3+ or −N+(CH3)3) neutralized these negative charges via electrostatic attraction [27]. This reduced repulsion between particles allowed them to aggregate [3].
3.2. The Morphology of Sludge Flocs
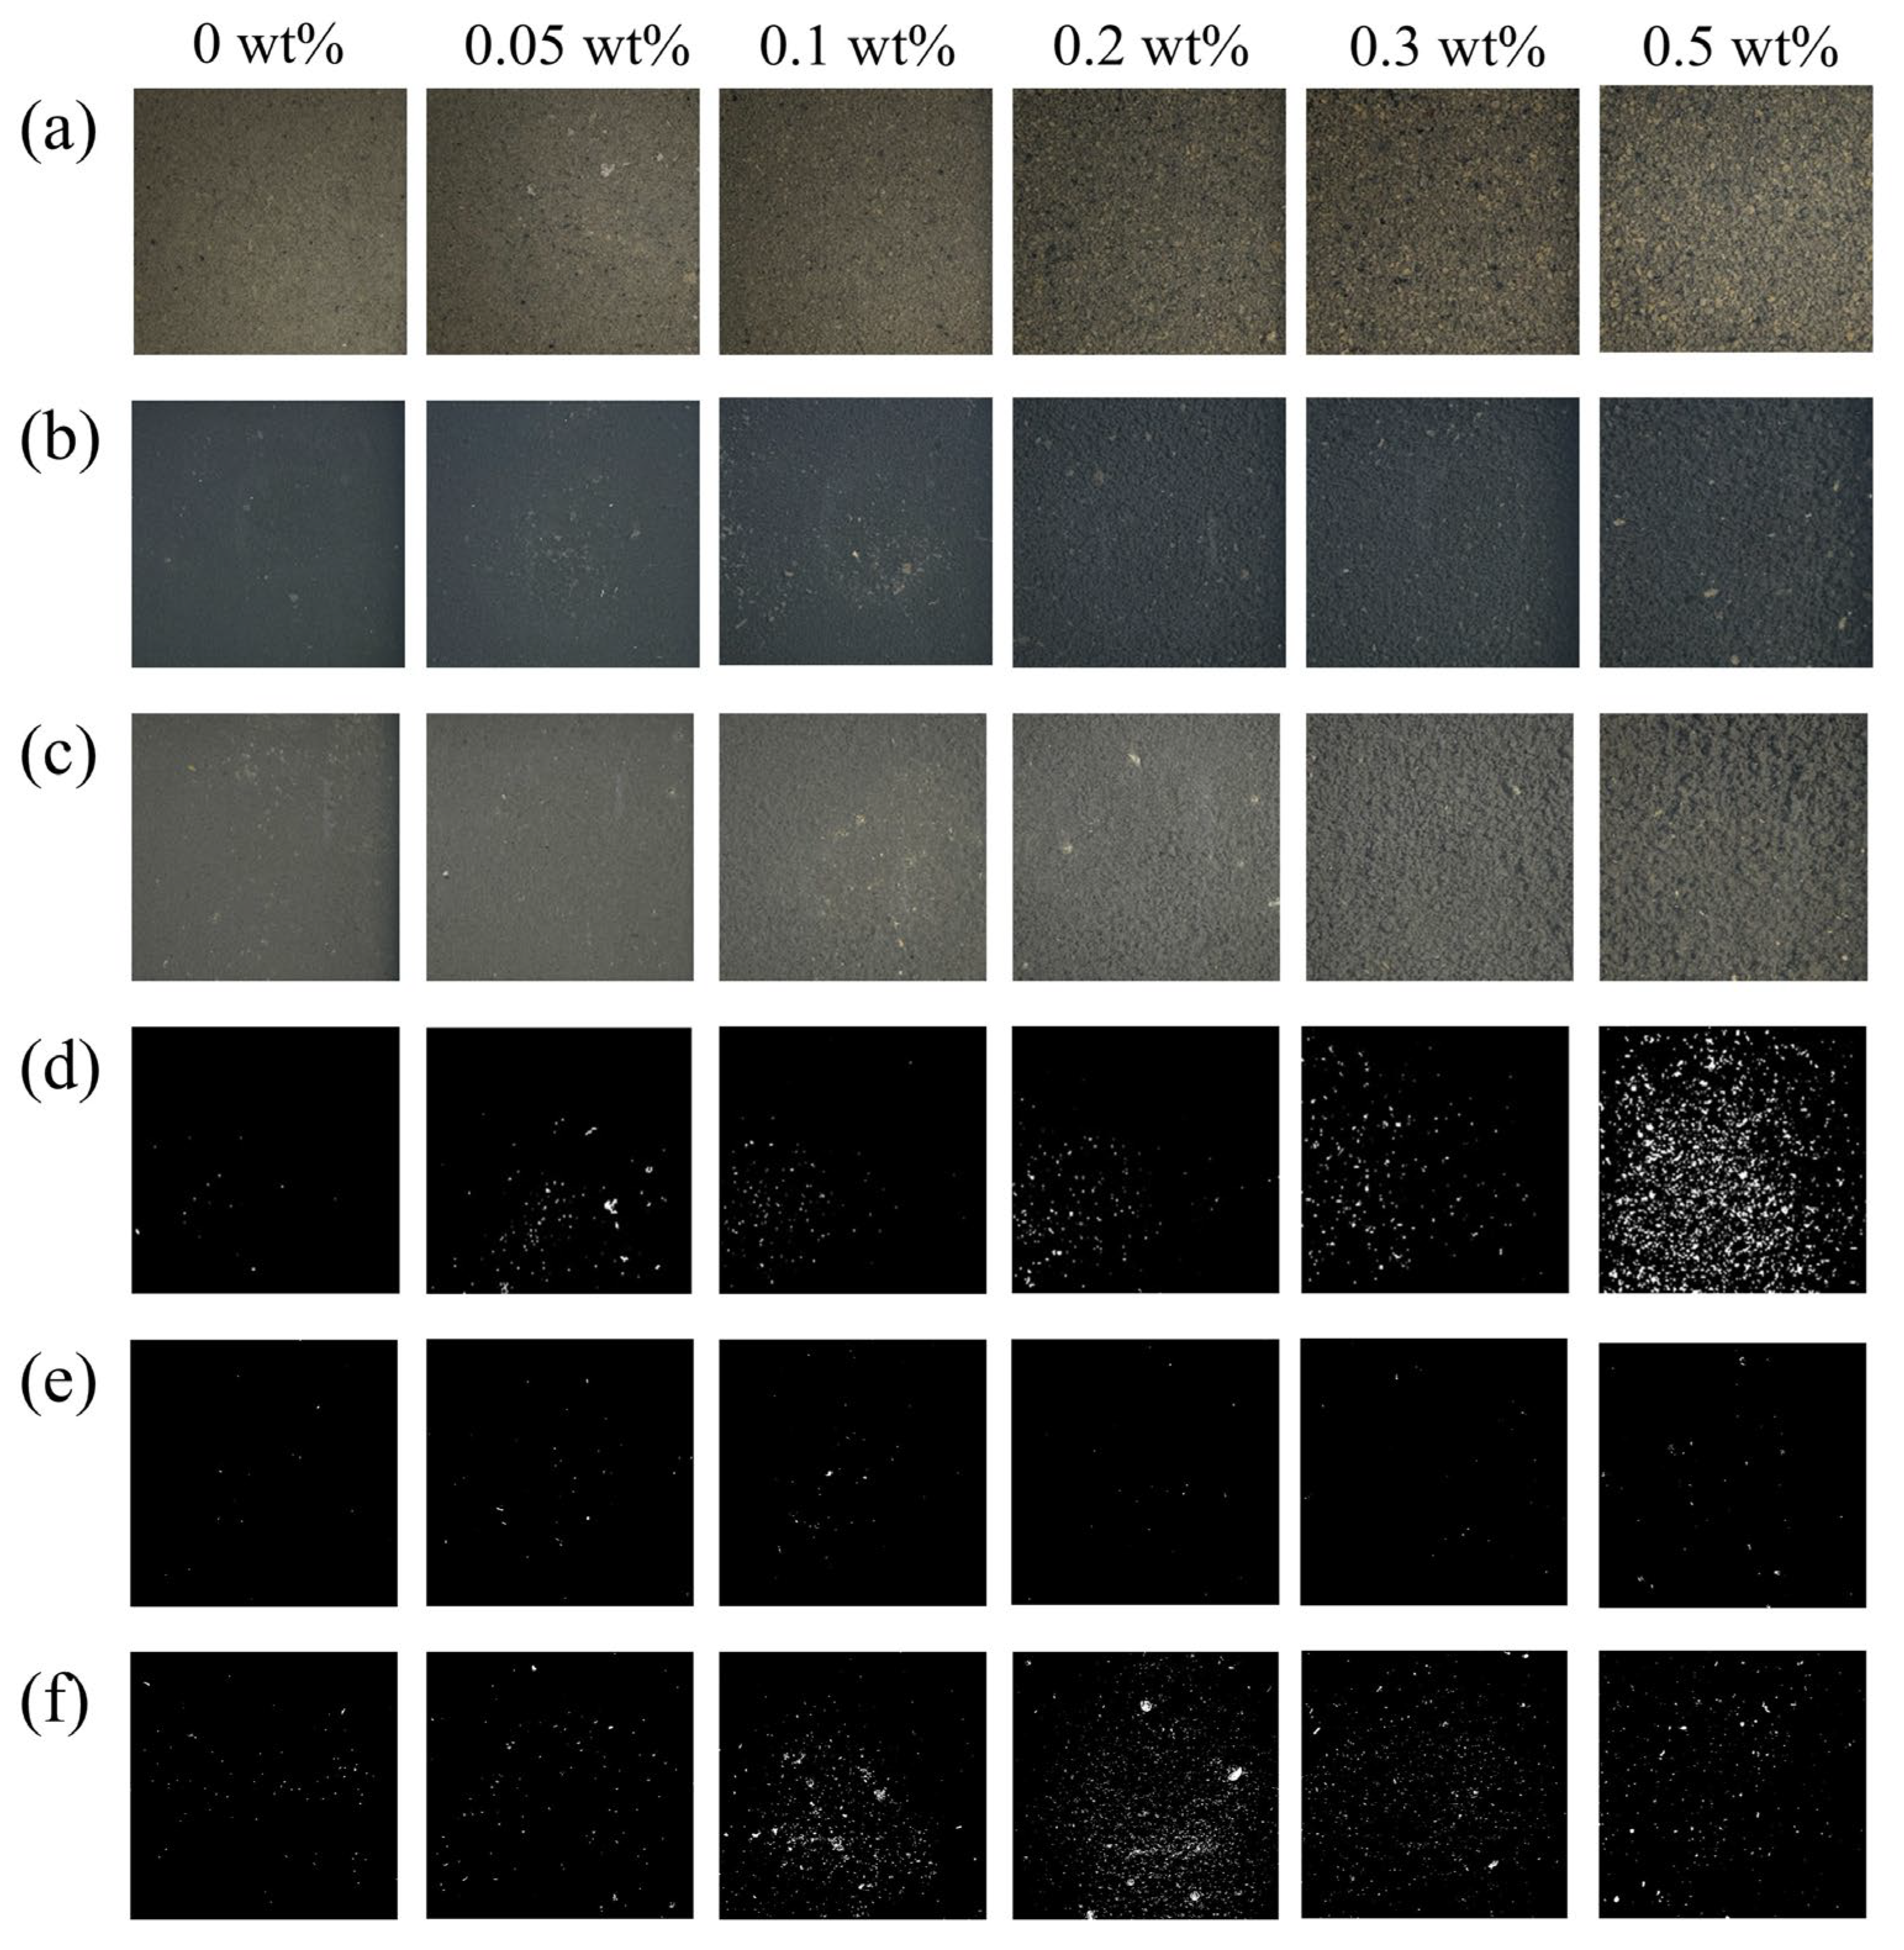
Initially, the raw sludge appeared as a fine, dispersed, and colloidal suspension with high water content and weak structural integrity. Upon cationic PAM addition, the long polymer chains bridged adjacent particles, forming large, dense flocs with a more compact and aggregated structure for all different types of sludge investigated (Figure 2a–c). The positively charged quaternary ammonium groups in cationic PAM neutralized the negative surface charges of sludge particles, thus reducing electrostatic repulsion between particles and allowing them to approach closer [28]. Image analysis via MATLAB revealed a higher density of white pixels in treated samples following cationic PAM conditioning, visually confirming this effect (Figure 2d–f).
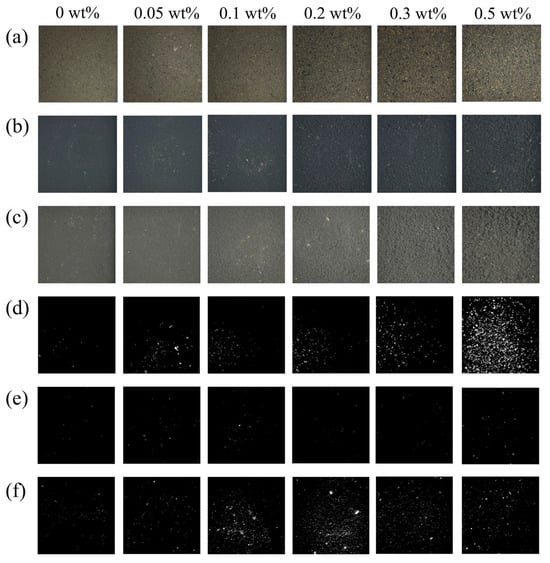
Figure 2.
The original sludge photo for different PAM concentrations (0, 0.05, 0.1, 0.2, 0.3, and 0.5 wt.%) in different samples: (a) WAS1, (b) WAS2, and (c) WAS3; processed photographic results of sludge treated at different PAM concentrations in different samples: (d) WAS1, (e) WAS2, and (f) WAS3.
3.2.1. Fractal Dimension Analysis
Based on the preliminary results, both floc area and floc equivalent diameter showed correlations with parameters reflecting sludge dewaterability. To justify the suitability of either the floc area or floc equivalent diameter to indicate sludge dewaterability, fractal dimension analysis was conducted.
Figure 3 presents the logarithmic relationship between floc perimeter and floc area. The slopes were respectively 0.57, 0.63, and 0.60 for WAS1, WAS2, and WAS3. Based on the principle, when the floc is circular, D equals 2 and the slope equals 1 [17]. The results indicated that circular representations failed to adequately characterize the detected flocs. This study revealed that representing sludge flocs via equivalent diameter was unreliable, as flocs did not conform to idealized circular geometries. The results from Chakraborti et al. (2003) supported this finding that aggregates were typically not circular [29]. Hence, the sludge floc area was used for downstream correlation analysis.

Figure 3.
Fractal dimensions were linearly fitted for three samples: (a) WAS1, (b) WAS2, and (c) WAS3. P refers to perimeter; A refers to area. The different color symbols mean the log p values for different sludge samples.
3.2.2. Floc Area
Sludge flocs were categorized into different area intervals, such as 10−6–10−5, 10−5–10−4, 10−4–10−3, and >10−3 cm2. Table 2 shows the number of sludge flocs with different areas and the related percentages. Interestingly, sludge floc with an area of 10−5–10−4 cm2 predominated in all the sludge samples. With the increase in PAM concentration, both the number and percentage of sludge floc with an area of 10−5–10−4 cm2 showed a decreasing trend. These tiny particles (e.g., colloidal solids, nanoparticles, or fine organic matter) may clog filter media pores or form a dense, impermeable cake layer [30].

Table 2.
The number of sludge flocs with different area ranges.
Interestingly, different from WAS1 and WAS3, the number and the related percentage of floc numbers detected in WAS2 were relatively lower. This may be because WAS2, taken from the Mayu Community Domestic Sewage Treatment Facility Wastewater Treatment Plant, has an indigenous black color, making the background color blacker than other samples, thus resulting in the inaccurate downstream image treatment. It is therefore deduced that while applying morphological characteristics of sludge flocs by a commercial smartphone to evaluate sludge dewaterability, the indigenous color of sludge shall avoid being dark black. In ImageJ, an image with predominantly low pixel values (e.g., excessive black areas) may exhibit reduced global contrast [31]. To ensure consistency in image processing parameters across three types of sludge samples, a unified threshold value was applied during binarization. However, this approach resulted in the failure to effectively process black sludge samples due to the lower contrast between particles and the background hindered accurate segmentation. Although preliminary adjustments indicated that increasing the threshold value could improve segmentation for these black sludge samples, threshold modification was not implemented in this work. This decision was made to avoid introducing variability in image processing, which could affect the comparability of results among the three sludge types. As a result, the black colored sludge was processed under the same threshold conditions as the other samples, even though this led to less accurate extraction of particle features in those specific cases. In future work, customized threshold adjustment in MATLAB could be employed to improve the segmentation performance for black sludge samples, thereby expanding the applicability and accuracy of the image analysis framework.
3.3. The Relationship Between the Percentage of Each Floc Area and Parameters Reflecting Sludge Dewaterability
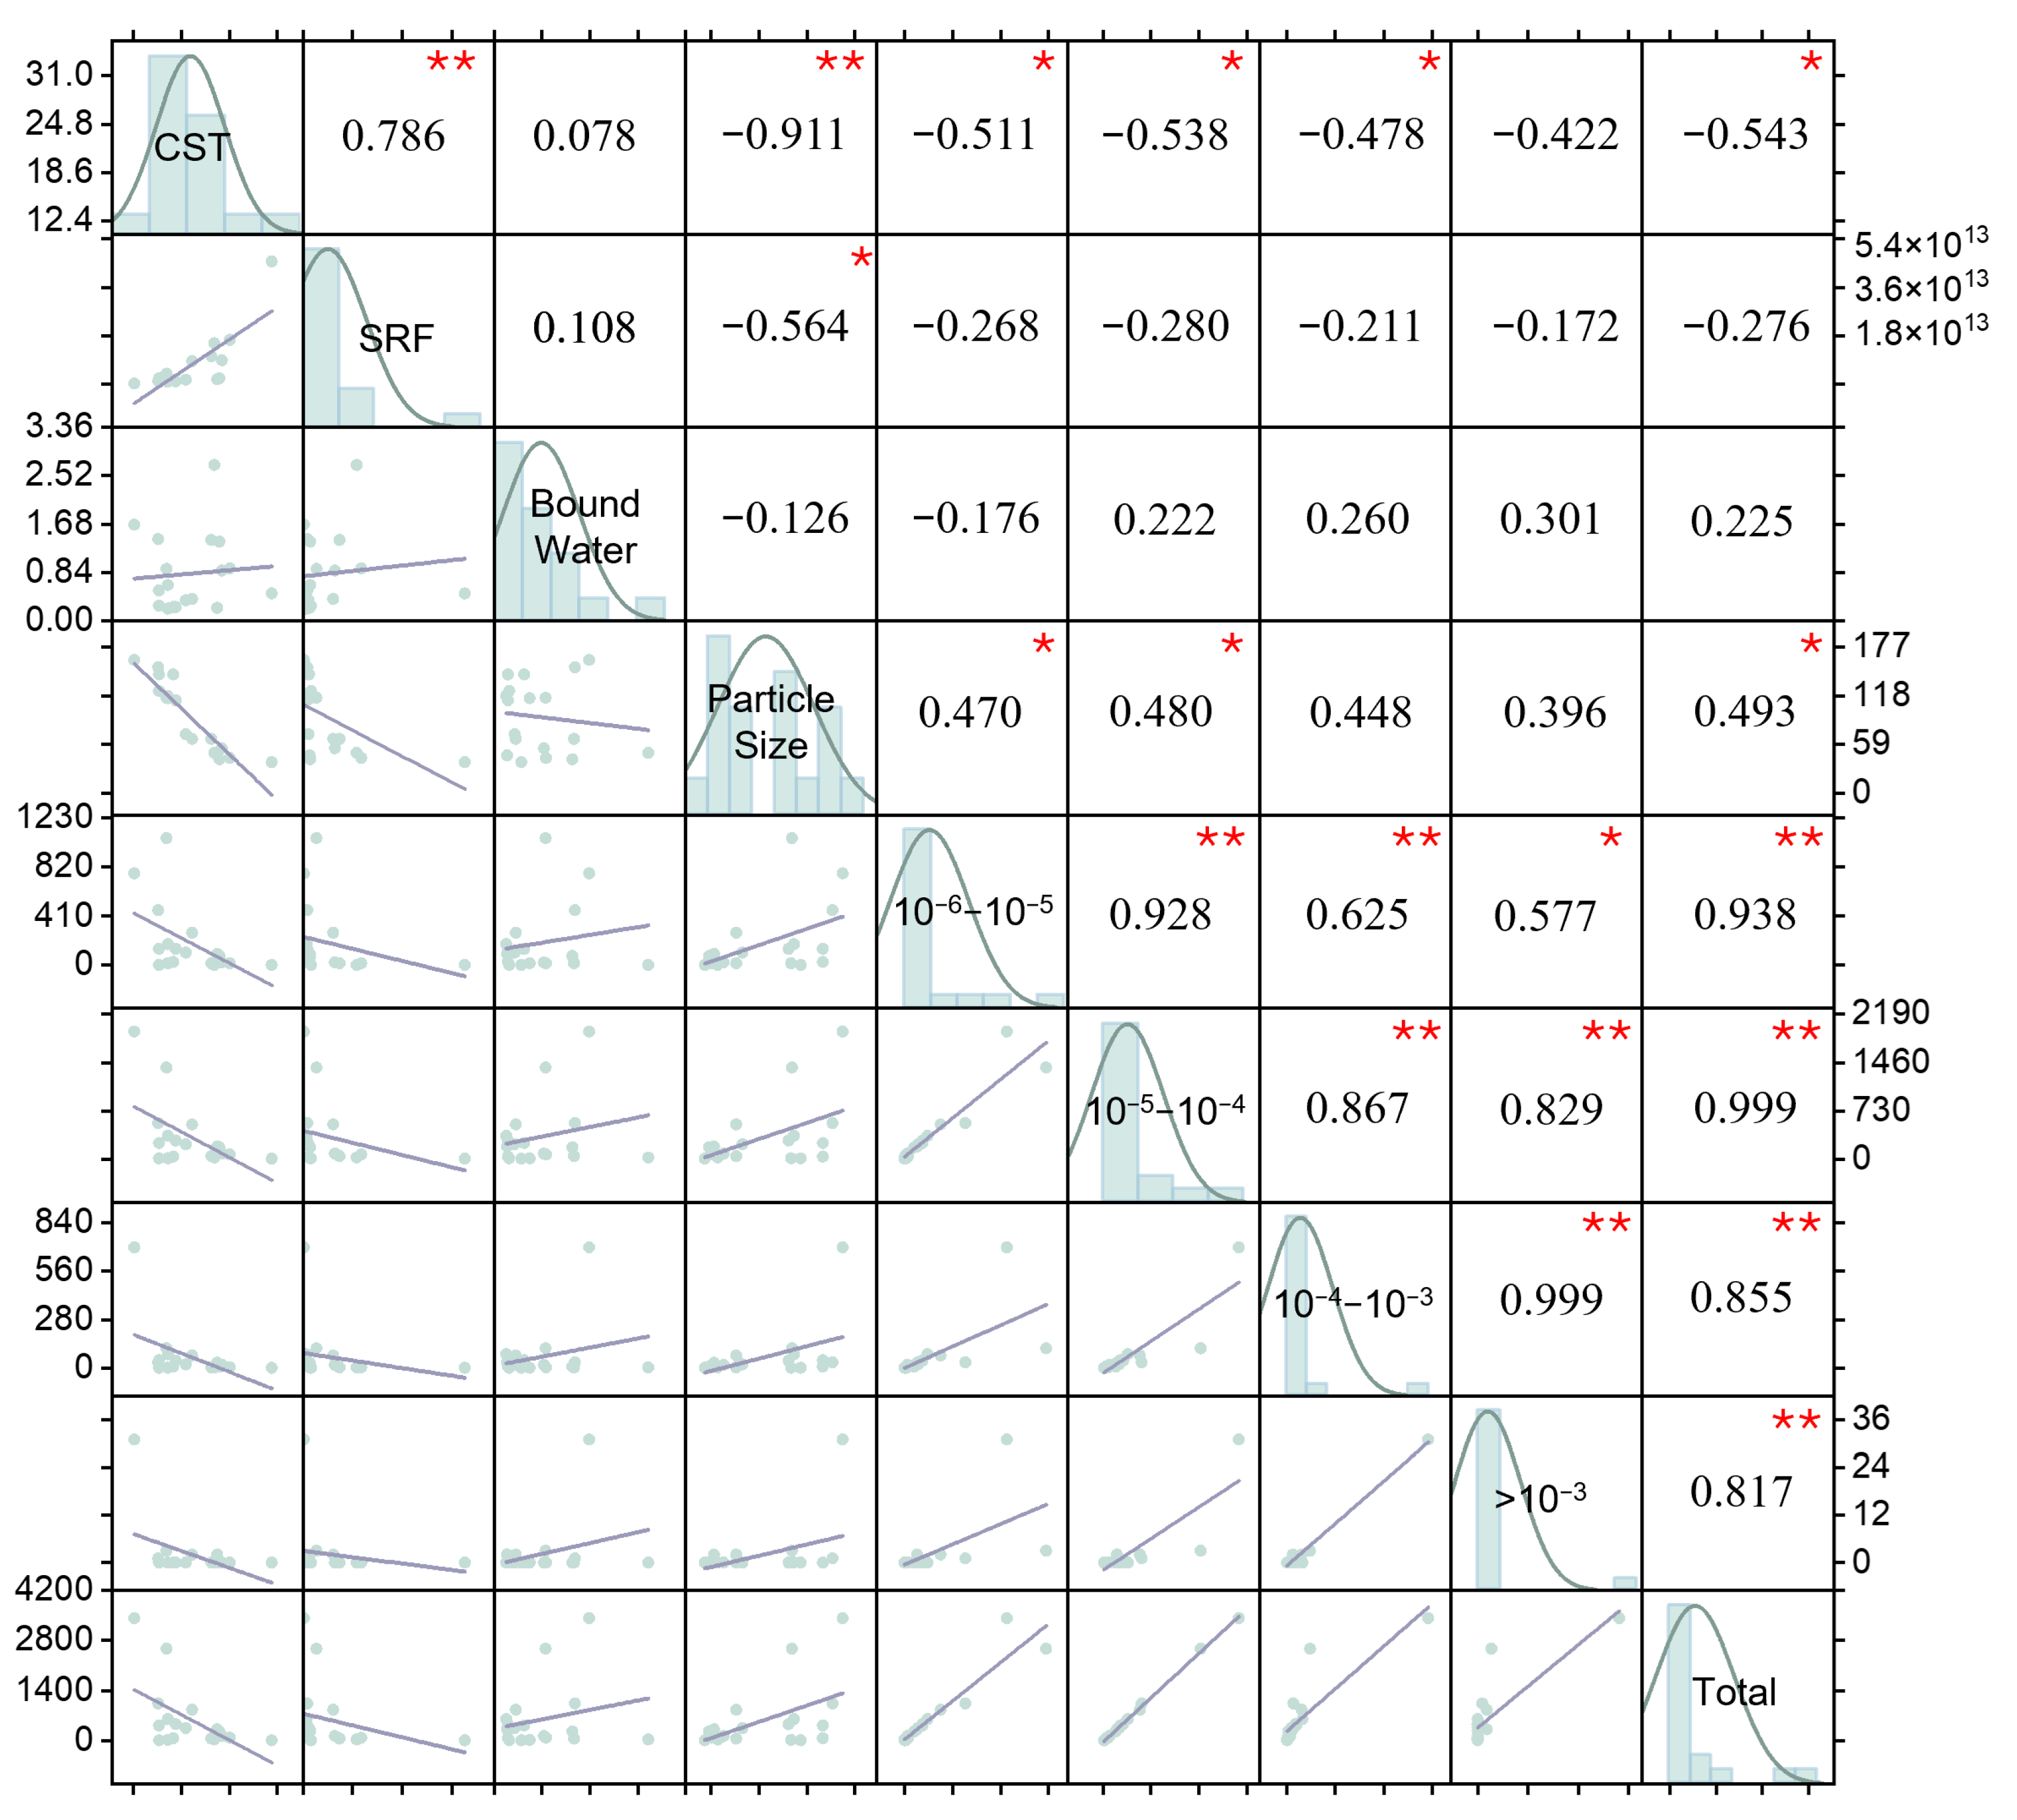
For dewatering performance indicators, CST, median particle size, and SRF were significantly correlated with each other (Figure 4). Particularly, CST was negatively correlated with particle size (regression coefficient (R) = −0.911, probability (p) < 0.01), while CST was positively correlated with SRF (R = 0.786, p < 0.01). Meanwhile, the median particle size also showed a significant correlation with SRF (R = −0.564, p < 0.05). These parameters correlated because they collectively described sludge dewaterability through floc structure (particle size) and filterability resistance (CST/SRF) [32].
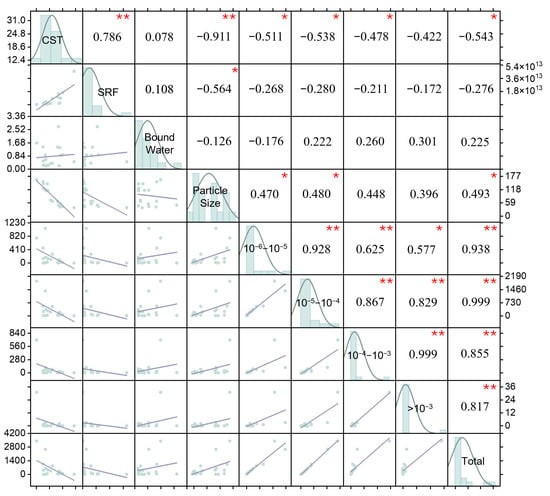
Figure 4.
Relationship between sludge dewatering parameters and the proportion of the floc numbers in each sludge floc area (10−6–10−5, 10−5–10−4, 10−4–10−3 cm2, >10−3 cm2, >10−6 cm2) to the total number of flocs. * denotes p < 0.05, and ** denotes p < 0.01. Dots represent the original data, straight line shows the fitting line, area and line in bar chart mean whether the data conform to normal distribution or not.
However, all these parameters showed insignificant correlations with bound water, further indicating the ineffectiveness of bound water to indicate sludge dewaterability when sludge was conditioned with cationic PAM. These results agreed with the findings shown in Section 3.1. This can be related to the mechanism of cationic PAM in sludge dewatering relies on the charge neutralization and polymer bridging of sludge flocs, rather than EPS disruption and the release of bound water [26].
For all samples, CST showed significant and negative correlations with the number of flocs in area ranges 10−6–10−5 (R = −0.511, p < 0.05), 10−5 –10−4 (R = −0.538, p < 0.05), and 10−4–10−3 (R = −0.478, p < 0.05), and > 10−6 cm2 (R = −0.543, p < 0.05), respectively. These tiny particles may clog the microscopic pores in the sludge cake and filter medium because they create a dense, low-porosity structure, forcing water to take longer, tortuous paths to escape [33]. In contrast, the median particle size showed significant and positive correlations with the number of flocs in area ranges 10−6–10−5 (R = 0.470, p < 0.05), 10−5–10−4 (R = 0.480, p < 0.05), and > 10−6 cm2 (R = 0.493, p < 0.05), respectively. Particles, regardless of which range contributed to the cumulative median particle size measurement [34].
3.4. Validation Experiment
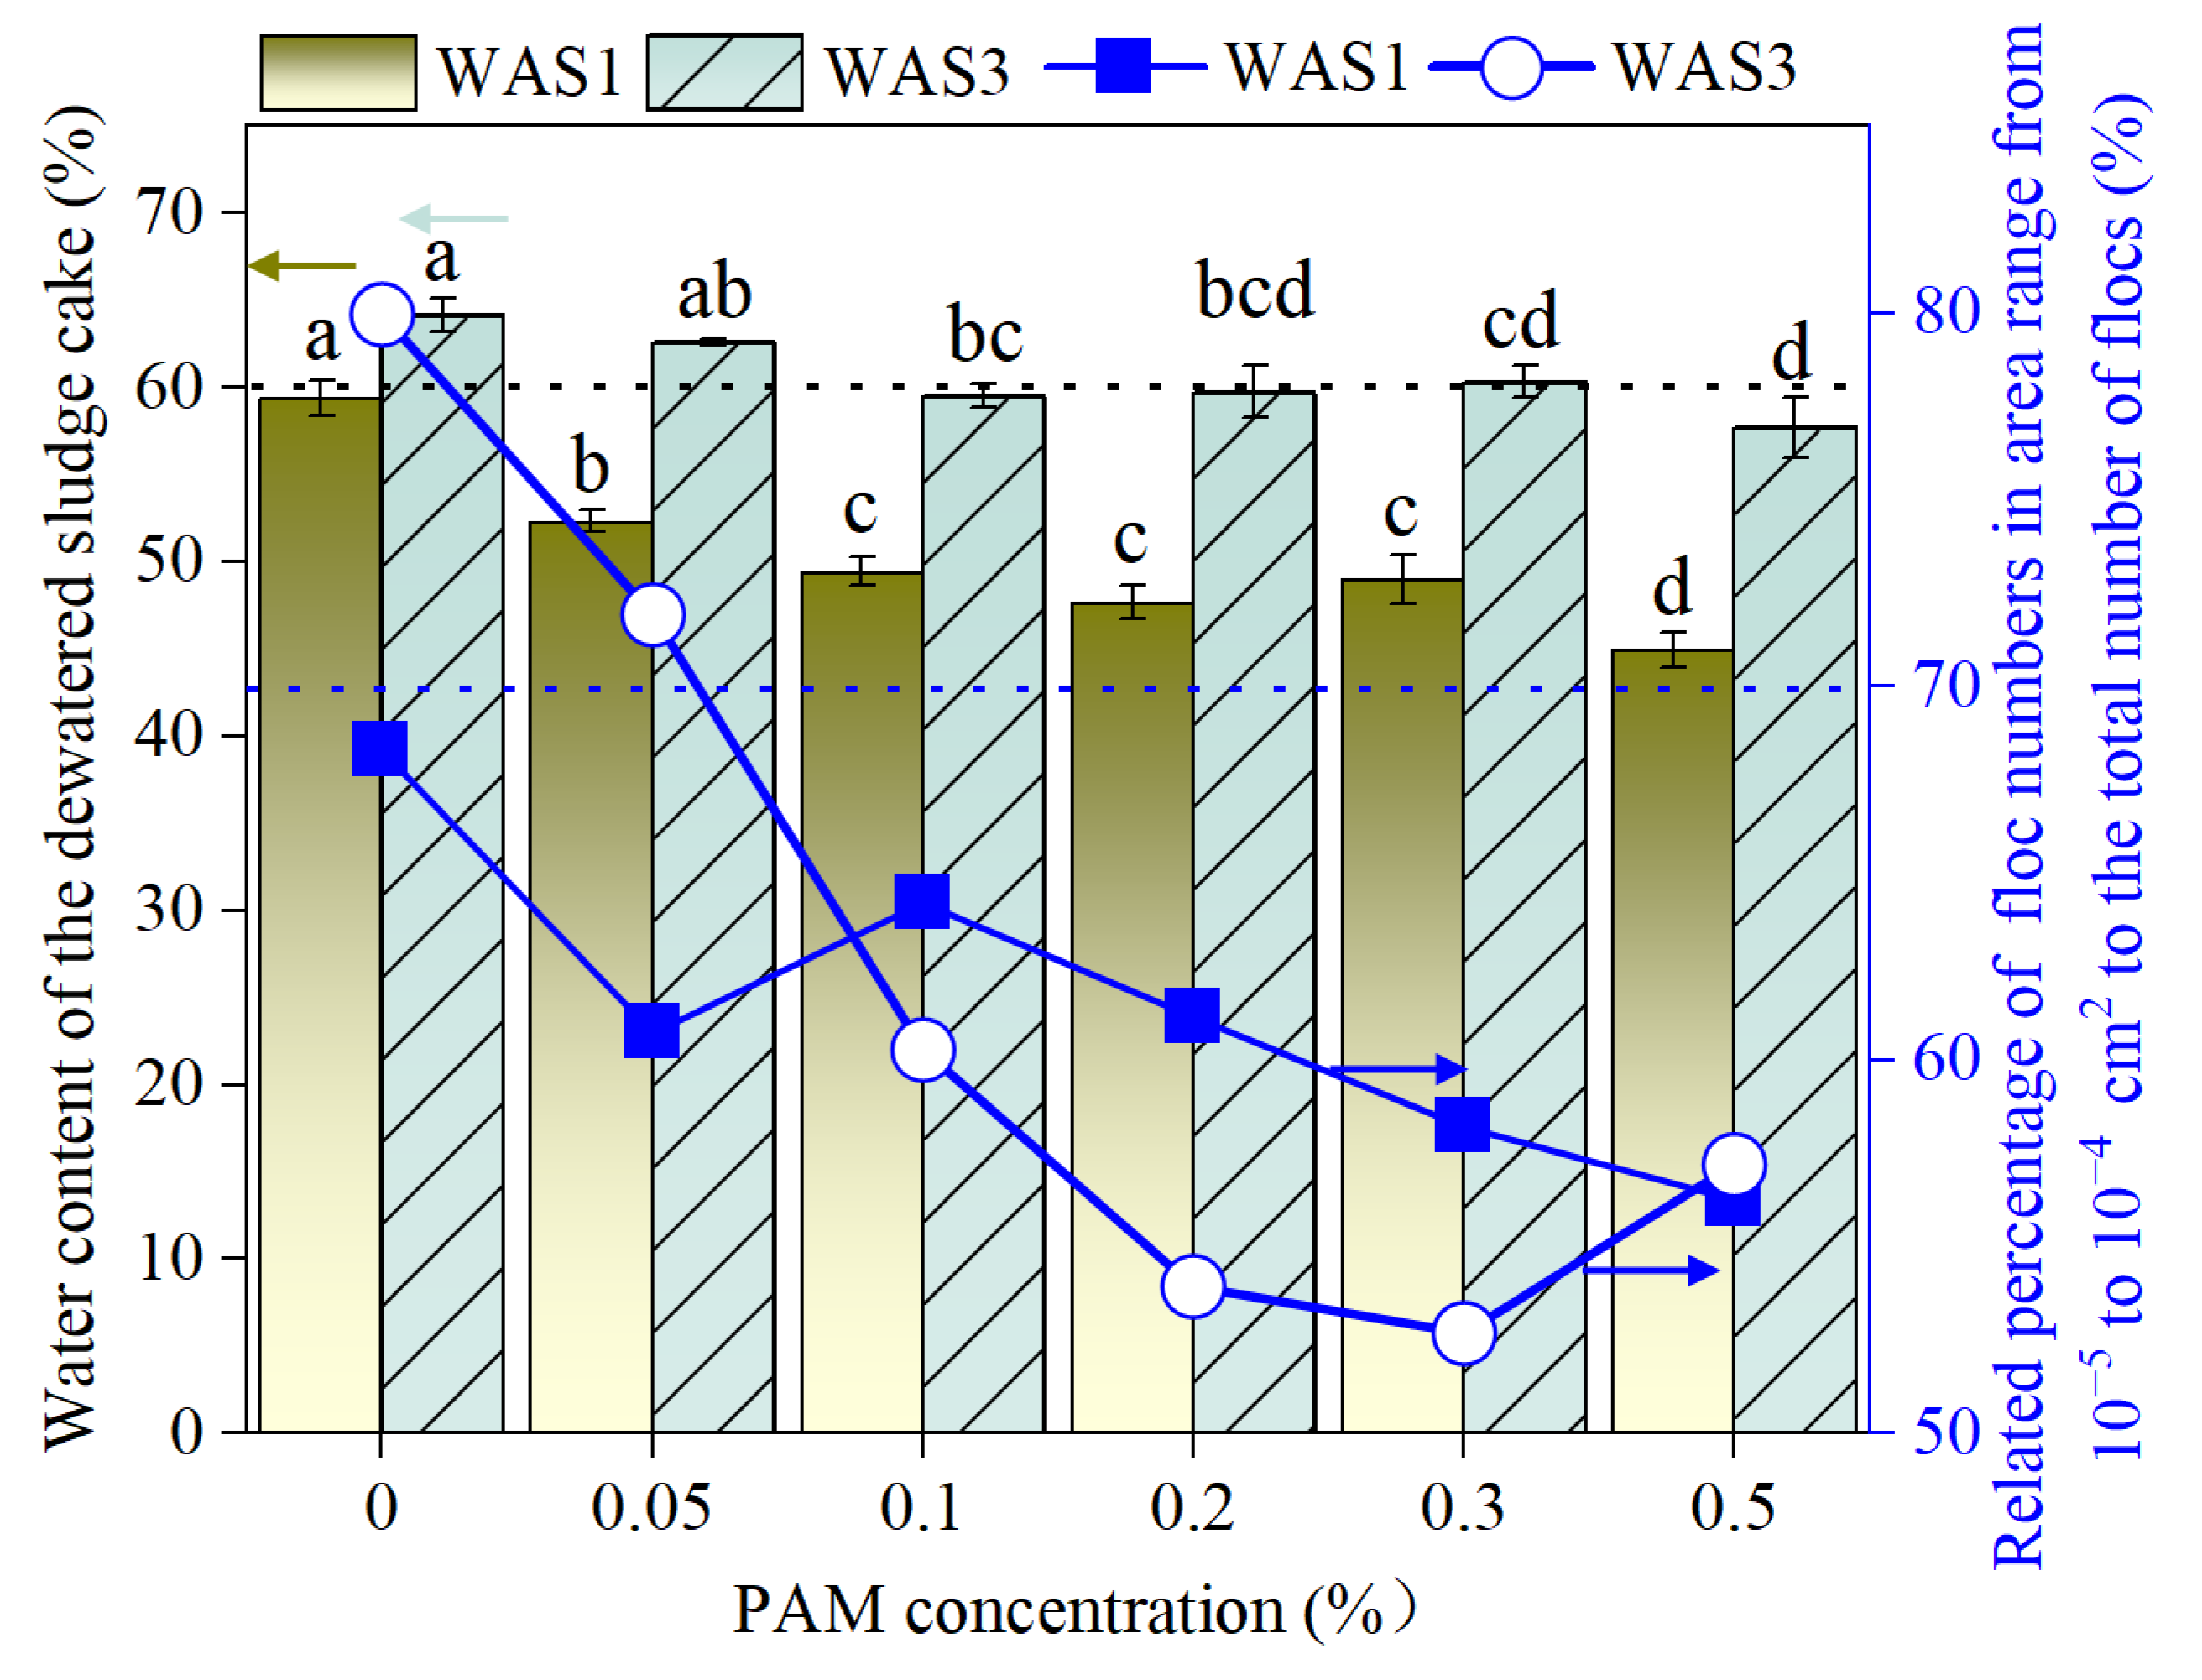
Due to the inaccuracy of the images of WAS2 to indicate sludge dewaterability (Section 3.2.2), only WAS1 and WAS3 were tested herein. For WAS1 and WAS3, when the percentage of the number of flocs in the floc area range 10−5 to 10−4 cm2 to the total number of flocs is less than 70%, the water content of the dewatered sludge cake is less than 60% (Figure 5). The formation of flocs sized 10−5–10−4 cm2 emerged as a key determinant for achieving the target water content (<60%) in dewatered sludge cakes, which was also the limit of water content of dewatered sludge cake prior to landfill (GB 16889-2008) in China [35]. The results gained from this study indicated that sludge floc morphology was a powerful diagnostic and predictive tool that explained sludge filterability, guided targeted sludge conditioning with cationic PAM, as well as optimized mechanical dewatering processes. Meanwhile, it should be noted that since WAS2 was excluded from the data process due to image quality limitations, the generalizability of the <70% floc area for other types of sludge and treatment conditions and its link with sludge dewaterability in real applications should be further studied in future work.
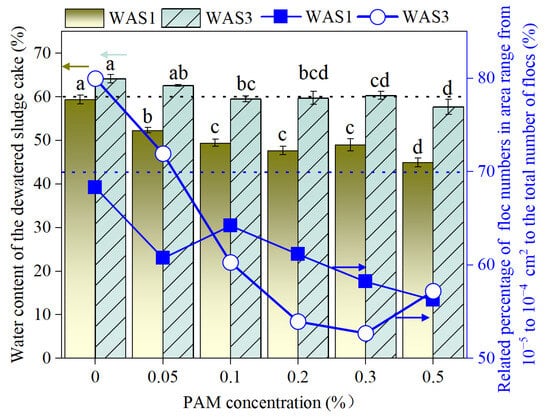
Figure 5.
Water content of the dewatered sludge cake of WAS1 and WAS3, and the related percentage of floc numbers in the area range of 10−5 to 10−4 cm2 to the total number of flocs. The arrows in the figure denote the related data in y-axis that the line refers to. The same letters represented insignificant differences (p > 0.05), while different letters represented.
4. Conclusions
This study highlighted the feasibility of using commercially available smartphones as a practical tool for evaluating sludge dewaterability. The following conclusions can be put forward:
- Significant correlations were observed between sludge floc area and key dewaterability parameters: The number of flocs in area range of 10−6–10−5 cm2 showed a negative correlation with capillary suction time (CST) (regression coefficient (R) = −0.511, probability (p) < 0.05) and a positive correlation with median particle size (R = 0.470, p < 0.05); the number of flocs in area range of 10−5–10−4 cm2 exhibited a stronger negative correlation with CST (R = −0.538, p < 0.05) and a positive correlation with median particle size (R = 0.480, p < 0.05);
- When the proportion of the number of flocs in the area range of 10−5–10−4 cm2 relative to the total floc of conditioned sludge fell below 70%, the dewatered sludge cake achieved a water content of less than 60%.
Author Contributions
Y.L.: Writing—original draft, data curation, methodology; Z.X.: Data curation; Y.J. (Yizhang Jiang): Methodology, formal analysis; Y.J. (Yue Jiang): Data curation; K.X.: Conceptualization, writing—review & editing, supervision, resources. All authors have read and agreed to the published version of the manuscript.
Funding
This research was funded by National Natural Science Foundation of China (52170133), Characteristic Innovation Projects of Ordinary Colleges and Universities in Guangdong Province (2024KTSCX160), GTIIT Changzhou Innovation Institute Seed Project (GCII-Seed-202510), GTIIT Education Foundation and Startup Funding of Guangdong Technion Israel Institute of Technology (ST2300014). This work is supported by the Guangdong Provincial Key Laboratory of Materials and Technologies for Energy Conversion (MATEC2022KF011).
Data Availability Statement
The original contributions presented in this study are included in the article. Further inquiries can be directed to the corresponding authors.
Acknowledgments
Chen Liu was acknowledged for his consistent support. Associate Houfeng Wang and Xuanxin Chen were thanked for their support in the laboratory-scale diaphragm filter press experiment. Associate Xi Gao’s group was acknowledged for providing a light source for shooting pictures.
Conflicts of Interest
The authors declare no conflicts of interest. The funders had no role in the design of the study; in the collection, analyses, or interpretation of data; in the writing of the manuscript; or in the decision to publish the results.
Abbreviations
| A | Area |
| ANOVA | One-way analysis of variance |
| COD | Chemical oxygen demand |
| CST | Capillary suction time |
| D | Fractal dimension |
| DSC | Differential scanning calorimetry |
| EPS | Extracellular polymeric substances |
| LSD | Least significant difference |
| p | Probability |
| P | Perimeter |
| PAM | Polyacrylamide |
| R | Regression coefficient |
| SCOD | Soluble chemical oxygen demand |
| SRF | Specific resistance to filtration |
| TCOD | Total chemical oxygen demand |
| TS | Total solids |
| VS | Volatile solids |
| WWTPs | Wastewater treatment plants |
References
- Nabi, M.; Jiang, Y.; Ding, W.; Wang, R.; Jiang, Y.; Lin, Y.; Xu, Z.; Xiao, K. Characterization of glycoprotein and its interaction with sludge dewatering: The neglected role of glycoprotein. Chem. Eng. J. 2025, 506, 160187. [Google Scholar] [CrossRef]
- Wang, H.F.; Gao, Y.Y.; Zeng, Y.P.; Chen, X.X.; He, Z.Y.; Zeng, R.J. Overcoming deep-dewatering challenges in food waste digestate with polyethylene oxide as an innovative conditioning agent. Water Res. 2025, 269, 122831. [Google Scholar] [CrossRef]
- Wang, Y.; Li, H.; Fang, W.; Wang, R.; Wang, X.; Wang, X.; Zheng, G.; Zhou, L. Persistence evaluation of fecal pollution indicators in dewatered sludge and dewatering filtrate of municipal sewage sludge: The impacts of ambient temperature and conditioning treatments. Water Res. 2025, 268, 122641. [Google Scholar] [CrossRef]
- Liu, W.H.; Gao, Y.Y.; Zeng, Y.P.; Zhang, H.; Sun, P.; Wang, H.F.; Zeng, R.J. Comprehensive analysis of the relationship between yield stress and dewatering performance in sludge conditioning: Insights from various treatment methods. Chemosphere 2024, 365, 143377. [Google Scholar] [CrossRef]
- Yokoyama, H.; Yamashita, T.; Kojima, Y.; Nakamura, K. Deep learning-based flocculation sensor for automatic control of flocculant dose in sludge dewatering processes during wastewater treatment. Water Res. 2024, 260, 121890. [Google Scholar] [CrossRef]
- Nakaya, Y.; Jia, J.; Satoh, H. Tracing morphological characteristics of activated sludge flocs by using a digital microscope and their effects on sludge dewatering and settling. Environ. Technol. 2024, 45, 4042–4052. [Google Scholar] [CrossRef]
- Dias, P.A.; Dunkel, T.; Fajado, D.A.; Gallegos, E.D.L.; Denecke, M.; Wiedemann, P.; Schneider, F.K.; Suhr, H. Image processing for identification and quantification of filamentous bacteria in in situ acquired images. Biomed. Eng. Online 2016, 15, 64. [Google Scholar] [CrossRef]
- Grijspeerdt, K.; Verstraete, W. Image analysis to estimate the settleability and concentration of activated sludge. Water Res. 1997, 31, 1126–1134. [Google Scholar] [CrossRef]
- Campbell, K.; Wang, J.; Daniels, M. Assessing activated sludge morphology and oxygen transfer performance using image analysis. Chemosphere 2019, 223, 694–703. [Google Scholar] [CrossRef]
- Li, Z.H.; Han, D.; Yang, C.J.; Zhang, T.Y.; Yu, H.Q. Probing operational conditions of mixing and oxygen deficiency using HSV color space. J. Environ. Manag. 2019, 232, 985–992. [Google Scholar] [CrossRef]
- Maier, T.; Kulichova, D.; Schotten, K.; Astrid, R.; Ruzicka, T.; Berking, C.; Udrea, A. Accuracy of a smartphone application using fractal image analysis of pigmented moles compared to clinical diagnosis and histological result. J. Eur. Acad. Dermatol. Venereol. 2015, 29, 663–667. [Google Scholar] [CrossRef]
- Blahnik, V.; Schindelbeck, O. Smartphone imaging technology and its applications. Adv. Opt. Technol. 2021, 10, 145–232. [Google Scholar] [CrossRef]
- Kelishami, A.S.; Kelishami, S.S. Cell phone image-based Persian rice detection and classification using deep learning techniques. Comput. Sci. 2024, 1, 1–9. [Google Scholar]
- Skandarajah, A.; Reber, C.D.; Switz, N.A.; Fletcher, D.A. Quantitative imaging with a mobile phone microscope. PLoS ONE 2014, 9, e96906. [Google Scholar] [CrossRef]
- Zhao, P.; Ge, S.; Chen, Z.; Li, X. Study on pore characteristics of flocs and sludge dewaterability based on fractal methods (pore characteristics of flocs and sludge dewatering). Appl. Therm. Eng. 2013, 58, 217–223. [Google Scholar] [CrossRef]
- APHA. Standard Methods for the Examination for Water and Wastewater, 21st ed.; American Public Health Association: Washington, DC, USA, 2005. [Google Scholar]
- Lee, D. Structural analysis of sludge floc. WIT Trans. Ecol. Environ. 2004, 73, 10. [Google Scholar]
- Jin, L.Y.; Zhang, P.Y.; Zhang, G.M.; Li, J. Study of sludge moisture distribution and dewatering characteristic after cationic polyacrylamide (C-PAM) conditioning. Desalin. Water Treat. 2016, 57, 29377–29383. [Google Scholar] [CrossRef]
- Kopp, J.; Dichtl, N. Prediction of full-scale dewatering results by determining the water distribution of sewage sludges. Water Sci. Technol. 2000, 42, 141–149. [Google Scholar] [CrossRef]
- Katsiris, N.; Kouzeli-Katsiri, A. Bound water content of biological sludges in relation to filtration and dewatering. Water Res. 1987, 21, 1319–1327. [Google Scholar] [CrossRef]
- Smollen, M. Evaluation of municipal sludge drying and dewatering with respect to sludge volume reduction. Water Sci. Technol. 1990, 22, 153–161. [Google Scholar] [CrossRef]
- Wu, C.C.; Huang, C.; Lee, D. Effects of polymer dosage on alum sludge dewatering characteristics and physical properties. Colloids Surf. A Physicochem. Eng. Asp. 1997, 122, 89–96. [Google Scholar] [CrossRef]
- Chu, C.; Lee, D. Moisture distribution in sludge: Effects of polymer conditioning. J. Environ. Eng. 1999, 125, 340–345. [Google Scholar] [CrossRef]
- Tsang, K.; Vesilind, P. Moisture distribution in sludges. Water Sci. Technol. 1990, 22, 135–142. [Google Scholar] [CrossRef]
- Wei, Q.; Ran, F.; Wu, S.; Zheng, X.; Zhao, M.; Liu, S.; Wang, L.; Fan, C. Effect of flocculant addition and organic matter content on flocculation-electroosmotic coupled dewatering of river sludge. J. Environ. Chem. Eng. 2025, 13, 116725. [Google Scholar] [CrossRef]
- Zeng, Y.; Shen, Y.; Lin, H.; Tan, Q.; Sun, J.; Shen, L.; Li, R.; Xu, Y.; Teng, J. A synergistic approach integrating potassium ferrate oxidation with polyacrylamide flocculation to enhance sludge dewatering and its mechanisms. J. Environ. Manag. 2025, 382, 125323. [Google Scholar] [CrossRef]
- He, D.; Zhu, T.; Sun, M.; Chen, J.; Luo, H.; Li, J. Unraveling synergistic mechanisms of polyacrylamide coagulation and Fe2+/CaO2 Fenton-like oxidation to enhance sludge dewatering. Chem. Eng. J. 2024, 479, 147576. [Google Scholar] [CrossRef]
- Zhang, P. Enhancing dewatering efficiency of wall protection slurry using a novel AlCl3-APAM-Ca(OH)2 compound flocculant: Synergistic mechanisms and performance. Int. J. Environ. Res. 2025, 19, 117. [Google Scholar] [CrossRef]
- Chakraborti, R.K.; Gardner, K.H.; Atkinson, J.F.; Benschoten, J.E.V. Changes in fractal dimension during aggregation. Water Res. 2003, 37, 873–883. [Google Scholar] [CrossRef]
- Liu, J.; Liu, H.; He, C.; Xiao, H.; Jin, M.; Yao, H. Correlation between sewage sludge pore structure evolution and water filtration performance: Effect of thermal hydrolysis with or without carbonaceous skeleton-assisted. Water Res. 2025, 268, 122578. [Google Scholar] [CrossRef]
- Broeke, J.; Pérez, J.M.M.; Pascau, J. Image Processing with ImageJ; Packt Publishing Ltd.: Birmingham, UK, 2015. [Google Scholar]
- Amasa, W.; Leta, S.; Gnaro, M.A. The application of Scoria-based horizontal subsurface flow constructed wetland for efficient textile wastewater treatment. Results Eng. 2025, 26, 105495. [Google Scholar] [CrossRef]
- Wu, Y.; Li, R.; Zhang, X.; Gao, M.; Zang, X.; Quang, C.N.X. Coupled effects of initial water content with refrigeration temperature and freeze-thaw cycles on dewatering of sludge. Environ. Res. 2025, 270, 120970. [Google Scholar] [CrossRef] [PubMed]
- Sebteoui, K.; Csabai, Z.; Stanković, J.; Baranov, V.; Jovanović, B.; Milošević, D. Downsizing plastics, upsizing impact: How microplastic particle size affects Chironomus riparius bioturbation activity. Environ. Res. 2025, 270, 121055. [Google Scholar] [CrossRef] [PubMed]
- Ministry of Environmental Protection of China. Standard for Pollution Control on the Landfill Site of Municipal Solid Waste; Standards Press of China: Beijing, China, 2008.
Disclaimer/Publisher’s Note: The statements, opinions and data contained in all publications are solely those of the individual author(s) and contributor(s) and not of MDPI and/or the editor(s). MDPI and/or the editor(s) disclaim responsibility for any injury to people or property resulting from any ideas, methods, instructions or products referred to in the content. |
© 2025 by the authors. Licensee MDPI, Basel, Switzerland. This article is an open access article distributed under the terms and conditions of the Creative Commons Attribution (CC BY) license (https://creativecommons.org/licenses/by/4.0/).

