Article

Analysis of the Energy Loss Characteristics of a Francis Turbine Under Off-Design Conditions with Sand-Laden Flow Based on Entropy Generation Theory

1
Sichuan Yingxiuwan Hydropower Plant, Dujiangyan 611830, China
2
Key Laboratory of Fluid and Power Machinery, Ministry of Education, Xihua University, Chengdu 610039, China
3
College of Water Resources and Civil Engineering, China Agricultural University, Beijing 100083, China
*
Author to whom correspondence should be addressed.
Water 2025, 17(13), 2002; https://doi.org/10.3390/w17132002
Submission received: 29 May 2025 / Revised: 26 June 2025 / Accepted: 2 July 2025 / Published: 3 July 2025
(This article belongs to the Section Hydraulics and Hydrodynamics)

Abstract

To investigate the impact of sand-laden flow on energy loss in Francis turbines, this study integrates entropy generation theory with numerical simulations conducted using ANSYS CFX. The mixture multiphase flow model and the SST k-ω turbulence model are employed to simulate the solid–liquid two-phase flow throughout the entire flow passage of the turbine at the Gengda Hydropower Station (Minjiang River Basin section, 103°17′ E and 31°06′ N). The energy loss characteristics under different off-design conditions are analyzed on the basis of the average sediment concentration during the flood season (2.9 kg/m3) and a median particle diameter of 0.058 mm. The results indicate that indirect entropy generation and wall entropy generation are the primary contributors to total energy loss, while direct entropy generation accounts for less than 1%. As the guide vane opening increases, the proportion of wall entropy generation initially rises and then decreases, while the total indirect entropy generation exhibits a non-monotonic trend dominated by the flow pattern in the draft tube. Entropy generation on the runner walls increases steadily with larger openings, whereas entropy generation on the draft tube walls first decreases and then increases. The variation in entropy generation on the guide vanes remains relatively small. These findings provide technical support for the optimal design and operation of turbines in sediment-rich rivers.

1. Introduction

As the core equipment in hydropower generation, the performance and operational stability of Francis turbines play a critical role in determining the economic efficiency and service life of hydropower stations. When operating in sediment-laden rivers, turbine components are exposed to intensified wear and cavitation due to suspended particles, accompanied by the formation of complex flow separations and vortices that significantly increase hydraulic losses and reduce overall efficiency. Under off-design conditions (such as low opening or no-load operations), flow separations and vortex formations within the runner further modify particle trajectories, leading to localized regions of high-concentration particle impacts. This, in turn, amplifies the coupling effects between hydraulic losses and abrasion. Consequently, a comprehensive understanding of the hydraulic loss characteristics and mechanisms of Francis turbines under sediment-laden and varied operating conditions is essential for optimizing turbine design and refining operational strategies.
At present, considerable research has been carried out on solid–liquid two-phase flow and sediment-induced wear in turbines. Liu Xiaobing [1,2] proposed a k-ε two-equation turbulence model, along with a volume fraction turbulence model, to simulate both flow characteristics and wall abrasion within turbine flow passages. Wei Xinyu et al. [3] investigated the effect of sediment gradation on turbine performance via numerical simulations, analyzing erosion mechanisms from the perspective of flow structures. The results revealed a strong correlation between erosion distribution and interblade vortices, depending on the operating conditions. Shrestha et al. [4] constructed a high-precision full model of a Francis turbine at an Indian hydropower station, which was validated by experimental data and an uncertainty analysis, to study secondary flows and sediment erosion effects. Pang Jiayang et al. [5] utilized the k-ε multiphase turbulence model to simulate sediment-laden flow in Francis turbines equipped with long and short blades under high-head conditions, subsequently proposing an erosion rate formula for components made of 0Cr13Ni5Mo material based on experimental findings. Thapa et al. [6] presented a comprehensive review of sediment erosion in hydraulic machinery, with a particular focus on Francis turbines. Yang Jing et al. [7] explored anti-erosion design strategies and performance optimization techniques for Francis turbines in sediment-laden hydropower stations, highlighting the interplay between erosion prevention and hydraulic performance, control conditions for rotational speed, and innovative improvements in flow structures through guide vanes. Wang et al. [8,9] applied the Tabakoff–Grant erosion model and the ZGB cavitation model to investigate the erosion mechanisms of guide vanes in high-head turbines and proposed anti-wear strategies. Zhou Ziyao et al. [10] developed a single-channel erosion test device based on similarity principles and numerical simulations to study sediment-laden two-phase flow characteristics and erosion mechanisms in a Francis-99 turbine, validating flow similarity through experimental results. Cristian et al. [11] applied a combined numerical method integrating two-phase flow and erosion models to investigate the corrosion rates and wear patterns of key components in the Pucayacu hydropower plant in Ecuador under different operating conditions. Saroj et al. [12] introduced a multi-objective design strategy that utilized parametric design, CFD simulations, and experimental verification to achieve both maximum turbine efficiency and minimum erosion. Zhou Ziyao et al. [13] employed the mixture multiphase model to simulate the complete flow domain of a Francis-99 turbine and explored the impact of varying sediment particle sizes on internal flow behavior.
Traditional hydraulic loss analyses are primarily based on pressure difference methods or empirical formulas, which lack the capacity to quantify the spatial distribution and dynamic evolution of energy loss. In recent years, entropy generation theory, grounded in the second law of thermodynamics, has emerged as a novel approach to directly link energy dissipation with physical mechanisms such as turbulence and wall friction. Gong et al. [14] applied entropy generation theory to steady-state three-dimensional flow simulations to quantify the energy dissipation characteristics in turbine passages. Zhou Ling et al. [15] conducted a comprehensive review on the application of entropy generation theory in pumps and turbines, addressing topics such as energy loss evaluation, the optimization of design, cavitation effects, and fault detection. Liu Kunting et al. [16] investigated the internal flow complexity and mechanisms of hydraulic losses under no-load conditions in Francis turbines by employing Reynolds-averaged methods combined with an entropy generation analysis. Yu An et al. [17] assessed energy losses quantitatively using entropy theory and full-domain integration, effectively addressing the shortcomings of conventional pressure drop approaches. Yu Zhifeng et al. [18] utilized entropy theory to identify and quantify localized energy losses in Francis turbines, highlighting its superior accuracy and ability to explain complex flow loss patterns. Ahn et al. [19] examined the coupled flow effects in low-head bulb turbines under multi-unit operation using entropy theory and full-domain two-phase flow simulation, demonstrating the method’s applicability in complex coupled systems. Wang Xiu et al. [20] investigated flow loss and energy conversion efficiency in horizontal-axis river turbines, considering the impact of yaw angle and tip clearance. Wang Zhiqi et al. [21] identified regions of energy loss and quantified dissipation intensity using entropy generation theory, subsequently optimizing the geometric parameters of splitter blades to improve performance.
Currently, there are limited applications of entropy generation theory to Francis turbines. This study pioneers its implementation for analyzing energy loss mechanisms in the Francis turbine at Gengda Hydropower Station under sand-laden flow conditions. Given the advantages of entropy generation theory in both quantitative and localized energy loss analyses, this study investigates the hydraulic loss characteristics of the Francis turbine at the Gengda hydropower station under sediment-laden conditions. Simulations are conducted via the SST k-ω turbulence model and the mixture multiphase model with a median sediment diameter of 0.058 mm and a sediment concentration of 2.915 kg/m3 across three guide vane openings.

2. Numerical Methodology

2.1. Solid–Liquid Two-Phase Flow Equations

The sediment-laden water is modeled as an incompressible Newtonian fluid without heat exchange during flow. The sand particles are assumed to be spherical and monodisperse (uniform in size), with no phase changes occurring in either the solid or liquid phase. Both phases are treated as mutually interpenetrating continua that macroscopically occupy the same physical space while maintaining distinct microscopic volumes. Consequently, the governing equations for solid–liquid two-phase flow under the Eulerian framework are given as follows [1]:
Liquid-phase continuity equation:
t ϕ f + x i ϕ f u f i = 0
Solid-phase continuity equation:
t ϕ p + x i ϕ p u p i = 0
Liquid-phase momentum equation:
t ϕ f u f i + x k ϕ f u f i u f k = 1 ρ f ϕ f P x i + ν f x k ϕ f u f i x k + u f k x i B ρ f ϕ f ϕ p u f i u p i + ϕ f g i
t ϕ f u f j + x k ϕ f u f j u f k = 1 ρ f ϕ f P x j + ν f x k ϕ f u f j x k + u f k x j B ρ f ϕ f ϕ p u f j u p j + g j
Solid-phase momentum equation:
t ϕ p u p i + x k ϕ p u p i u p k = 1 ρ p ϕ p P x i + ν p x k ϕ p u p i x k + u p k x i B ρ p ϕ p ϕ f u p i u f i + ϕ p g i
where t is the time; x is the spatial coordinate; u is the velocity; ν is the kinematic viscosity; ϕ represents the volume fraction, ϕp + ϕf = 1; P is the pressure; g is the gravitational acceleration; and x is the coordinate. B represents the interphase coefficient of action, B = 18(1 + B0)ρfνf/ d p 2 , and dp denotes the particle diameter. The subscripts f and p refer to the liquid and solid phases, respectively, while i, j, and k represent the tensor coordinates.

2.2. Turbulence Model

The SST (Shear Stress Transport) k-ω turbulence model combines the accuracy of the standard k-ω model near the wall with the robustness of the k-ε model in free-stream flows and is widely used for simulating complex flows such as separation and boundary layer interactions. To better predict the flow behavior near wall boundaries, the following SST k-ω model [22] is selected:
Turbulent kinetic energy (k) equation:
k t + k u j x j = x j ν + ν t σ k k x j + G k β k ε
Turbulent specific dissipation rate (ω) equation:
ω t + ω u j x j = x j ν + ν t σ ω ω x j + α ω k P k β ω 2 + 2 1 F 1 1 ω σ ω k x j ω x j
ν t = α k max α ω , Ω F 2
F 1 = tanh min max k β ω y , 500 ν y 2 ω , 4 σ ω 2 k C D k ω y 2 4
F 2 = tanh max 2 k β ω y , 500 ν y 2 ω
C D k ω = max 2 ρ σ ω 2 ω k x i ω x i , 10 10
where Gk represents the generation term of turbulent kinetic energy k; u denotes the instantaneous velocity; ν is the kinematic viscosity; νt is the eddy viscosity coefficient; σk and σω are the turbulent Prandtl numbers for k and ω, respectively; Ω stands for the absolute vorticity; F1 is the mixture function; and F2 is a blending function. CD is the limiting factor of the cross-diffusion term.

2.3. Entropy Generation Theory

Due to the high specific heat capacity of water, the flow process in a Francis turbine can be considered isothermal. When heat transfer effects are neglected, the second law of thermodynamics dictates that mechanical processes inevitably involve a certain amount of mechanical energy loss caused by dissipation and friction. This energy is irreversibly converted into internal energy and can no longer be utilized, resulting in an increase in entropy. The total entropy generation rate S ˙ D in Reynolds-averaged turbulent flow consists of two components: the direct entropy production rate S ˙ D ¯ caused by the mean velocity gradients and the indirect entropy production rate S ˙ D induced by velocity fluctuations.
S ˙ D ¯ = 2 μ e f f T u ¯ 1 x 1 2 + u ¯ 2 x 2 2 + u ¯ 3 x 3 2 + μ e f f T u ¯ 2 x 1 + u ¯ 1 x 2 2 + u ¯ 3 x 1 + u ¯ 1 x 3 2 + u ¯ 2 x 3 + u ¯ 3 x 2 2
S ˙ D = 2 μ e f f T u 1 x 1 2 + u 2 x 2 2 + u 3 x 3 2 + μ e f f T u 2 x 1 + u 1 x 2 2 + u 3 x 1 + u 1 x 3 2 + u 2 x 3 + u 3 x 2 2
where u ¯ 1 , u ¯ 2 , u ¯ 3 are the time-averaged velocity components; u 1 , u 2 , u 3 are the pulsation velocity components; μeff is the effective viscosity coefficient; and T is the temperature.
Since the Reynolds-averaged approach cannot directly obtain the fluctuating velocity components, Kock et al. [23] and Mathieu et al. [24] proposed empirical formulas for estimating the indirect entropy production rate based on turbulence models using either ε or ω. For the SST k-ω model, the indirect entropy production rate S ˙ D can be calculated using the following expression:
S ˙ D = λ ρ ω k T
where λ is an empirical constant, set to 0.09 [25].
Several researchers [26,27,28] have also validated the applicability and accuracy of this formula for entropy generation calculation. In addition, the near-wall region typically exhibits high velocity gradients, which induce strong wall effects and result in significant entropy generation. To address this, Duan et al. [29] proposed a wall function with broad adaptability and high computational accuracy to estimate the entropy generation rate near wall boundaries S ˙ W :
S ˙ W = τ w × v w T
where τ w is the wall shear, and v w is the velocity at the center of the first grid node near the wall.
The total entropy production S p r o can be obtained by integrating over the computational domain and summing over S ˙ D ¯ , S ˙ D , and S ˙ W :
S p r o = S p r o . D ¯ + S p r o . D + S p r o . W = V S ˙ D ¯ d V + V S ˙ D d V + A S ˙ W d A
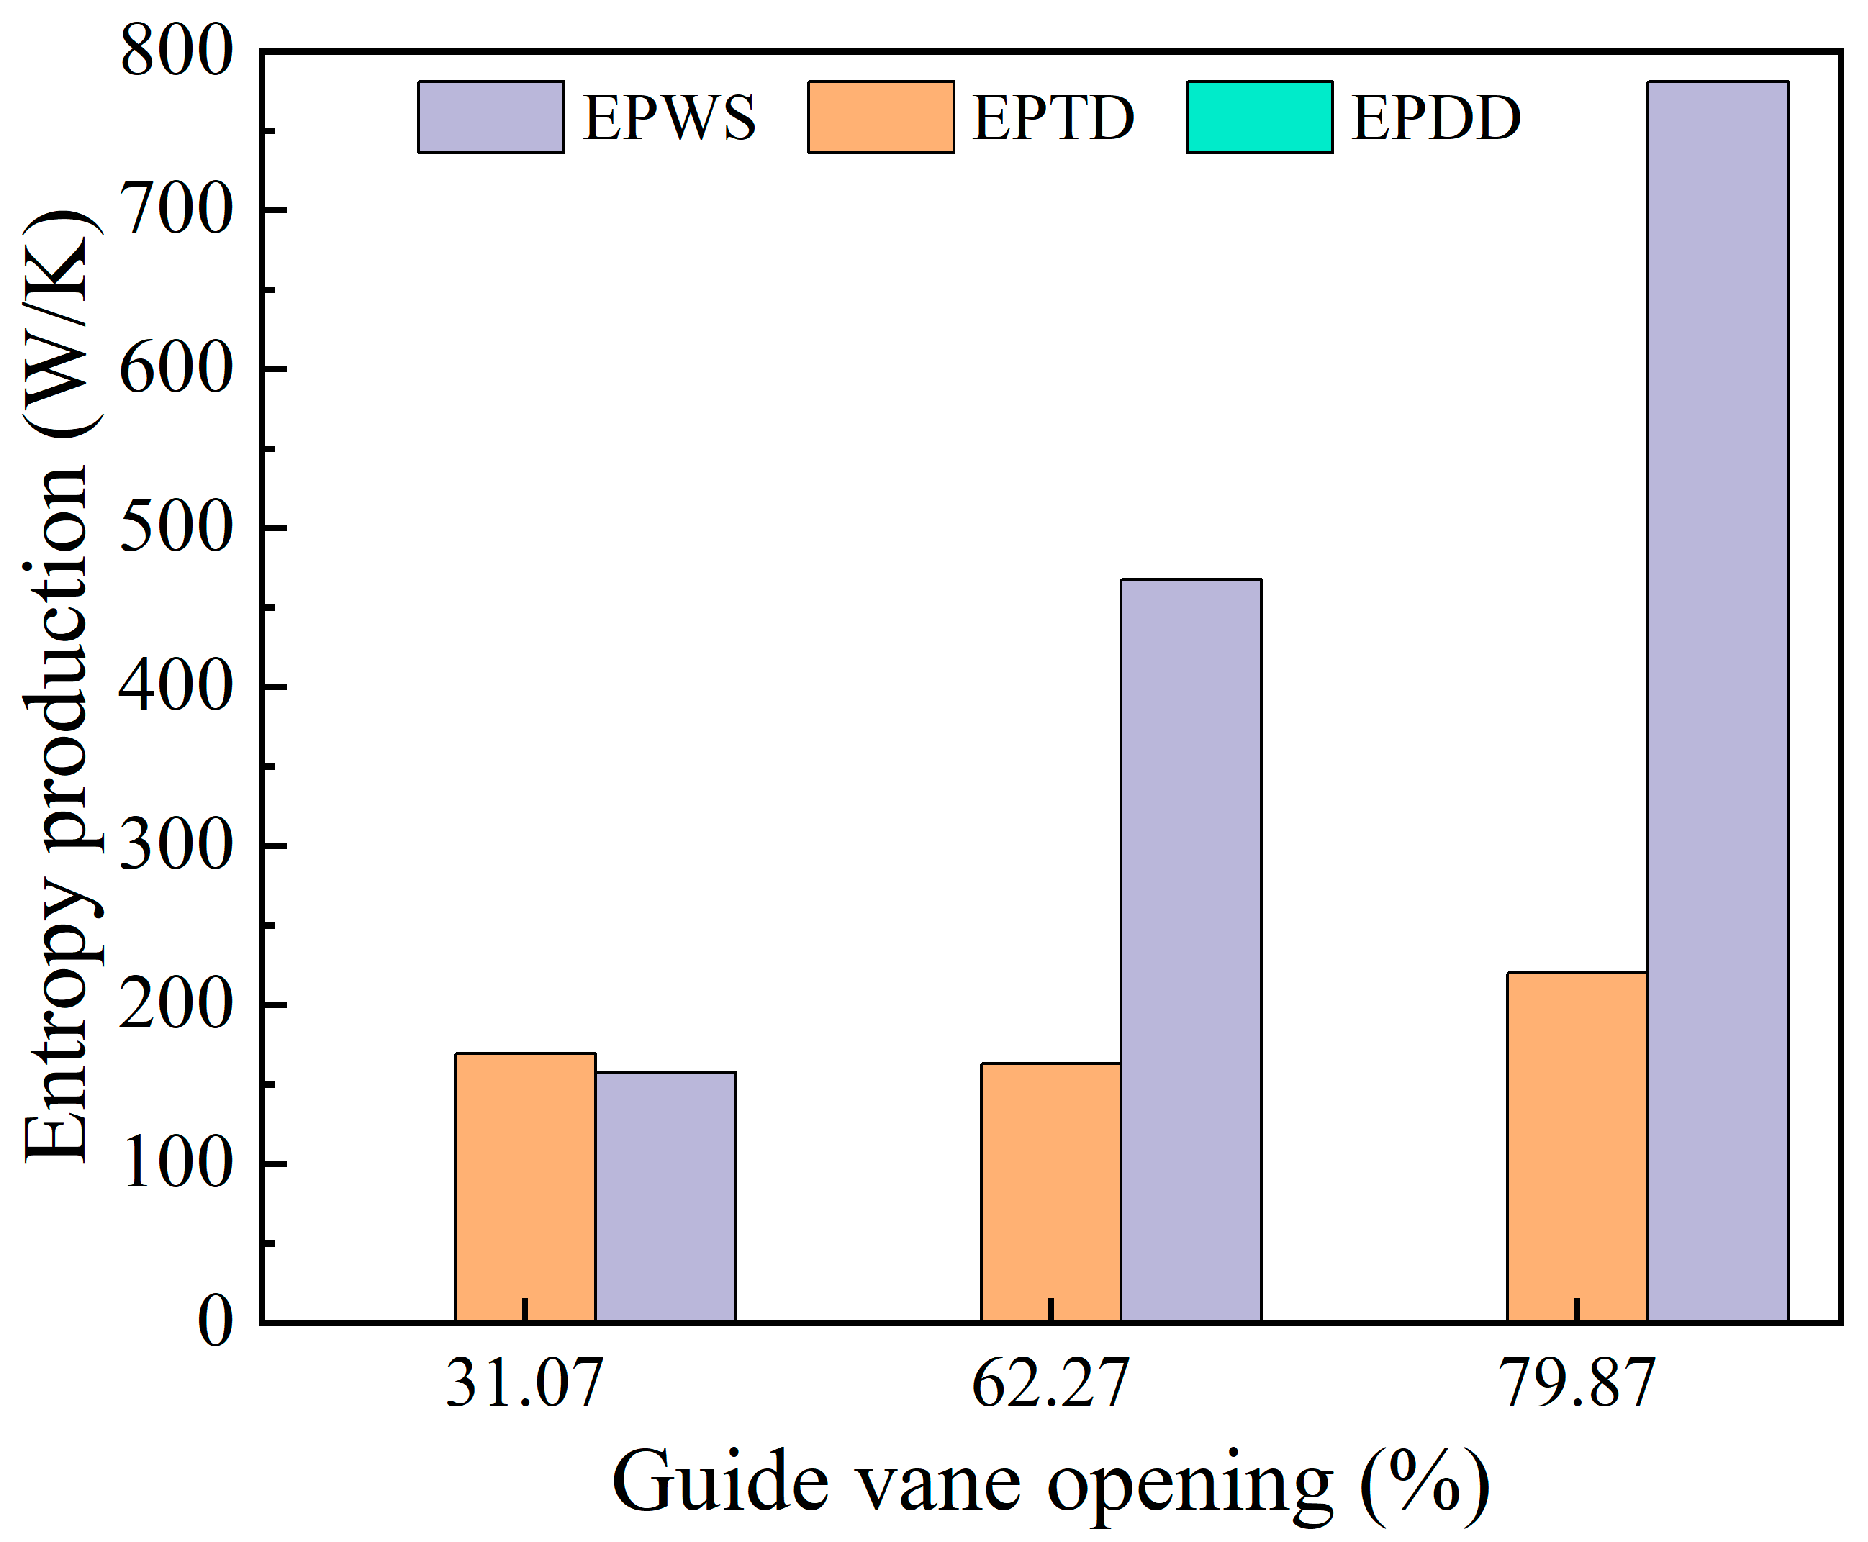
where S p r o . D ¯ , S p r o . D , and S p r o . W are the entropy production rate caused by direct dissipation (EPDD), the entropy production rate caused by turbulence dissipation (EPTD), and the entropy production rate caused by wall shear stress (EPWS); V is the volume of the computational domain; and A is the area of the computational domain.

3. Geometric and Physical Models and Boundary Conditions

3.1. Three-Dimensional Water Model

This study focuses on the Francis turbine at the Gengda hydropower station, specifically the HLA542b-LJ-215 model. The basic parameters of the turbine are listed in Table 1.
To accurately analyze the flow dynamics of the sediment-laden water within the hydraulic turbine, a full flow passage model of the turbine—comprising the spiral casing, guide vane mechanism (including stay vanes and guide vanes), runner, and draft tube—was developed on the basis of the design specifications of the Gengda hydropower station. Three models corresponding to distinct operating conditions were established, with the three-dimensional hydraulic model under Opening I illustrated in Figure 1.

3.2. Mesh Generation and Grid Independence Verification

Considering the importance of operational efficiency in turbine performance, an unstructured tetrahedral mesh was employed for the full flow passage of the Francis turbine. A portion of the mesh for the Gengda hydropower station turbine is shown in Figure 2.
A grid independence study was conducted using the Grid Convergence Index (GCI) method based on Richardson extrapolation [30,31] to quantitatively assess the convergence of the numerical solution with respect to the mesh resolution. Using the efficiency under clear-water conditions as the target parameter, three distinct mesh resolutions were tested for each of the three operating conditions.
G C I 21 = F S e a 21 r 21 P r 1
where Fs is the safety factor; e a 21 is the relative error of two sets of grids, e a 21 = φ 1 φ 2 φ ; r is the mesh refinement factor, r 21 = G 1 / G 2 3 ; G is the number of corresponding grids; pr is the convergence accuracy, p r = l n ε 32 / ε 21 + q p r / l n r 21 , q p r = l n r 21 p r s / r 32 p r s , s = 1 · s g n ε 32 / ε 21 ; and ε32 and ε21 are the differences between the numerical solutions of the two sets of grids.
The parameters used for the grid independence verification across the three meshes for each operating point are detailed in Table 2. The calculated GCI values for the medium-resolution mesh (G2) are summarized in Table 3: 2.37% for Opening I, 2.28% for Opening II, and 2.31% for Opening III. These values satisfy the convergence criterion (GCI < 3%) [32]. Consequently, the G2 mesh resolution was selected for all simulations. The corresponding total cell counts for the G2 mesh are 9.20 × 10⁶ grid numbers for Opening I, 9.25 × 10⁶ grid numbers for Opening II, and 9.26 × 10⁶ grid numbers for Opening III.
The distribution of cells within different flow components of the G2 mesh for the three openings is provided in Table 4.

3.3. Boundary Conditions

In this study, ANSYS CFX 2022 software was employed to conduct numerical simulations of sediment-laden flow through the full flow passage of the Francis turbine at the Gengda Hydropower Station under different operating conditions, using the SST k-ω turbulence model. Two rotating interfaces were defined: one between the runner and the guide vanes and the other between the runner and the draft tube. The inlet boundary was defined as a total pressure inlet, perpendicular to the cross-section of the spiral casing inlet, with parameters derived from on-site monitoring data. The outlet boundary was specified as a pressure outlet, perpendicular to the outlet plane, with values determined according to the draft tube suction height. All wall boundaries were treated with no-slip conditions. The detailed calculation parameters for the three operating conditions are provided in Table 5.
The simulations were conducted under sediment-laden conditions representative of the flood season of the station, with an average sediment concentration of 2.9 kg/m3 and a median particle diameter of 0.058 mm, with a focus on analyzing the effects of sediment on internal turbine flow and energy loss.

3.4. Comparison Validation

Based on the actual operating efficiency of the Gengda Station under three different openings, a comparison was made with the results from numerical simulations, as detailed in Table 6. The differences between the numerically calculated and experimentally measured efficiencies were 2.01% for Opening I, 2.92% for Opening II, and 2.73% for Opening III. Under all three openings, the efficiency obtained through the numerical simulation was higher than the actual value. This discrepancy occurred because the turbulence model struggles to accurately capture flow characteristics (such as flow separation phenomena), leading to an underestimation of energy losses and thus predicting higher efficiency.

4. Results of Sediment-Laden Flow Simulations

4.1. Entropy Generation Characteristics

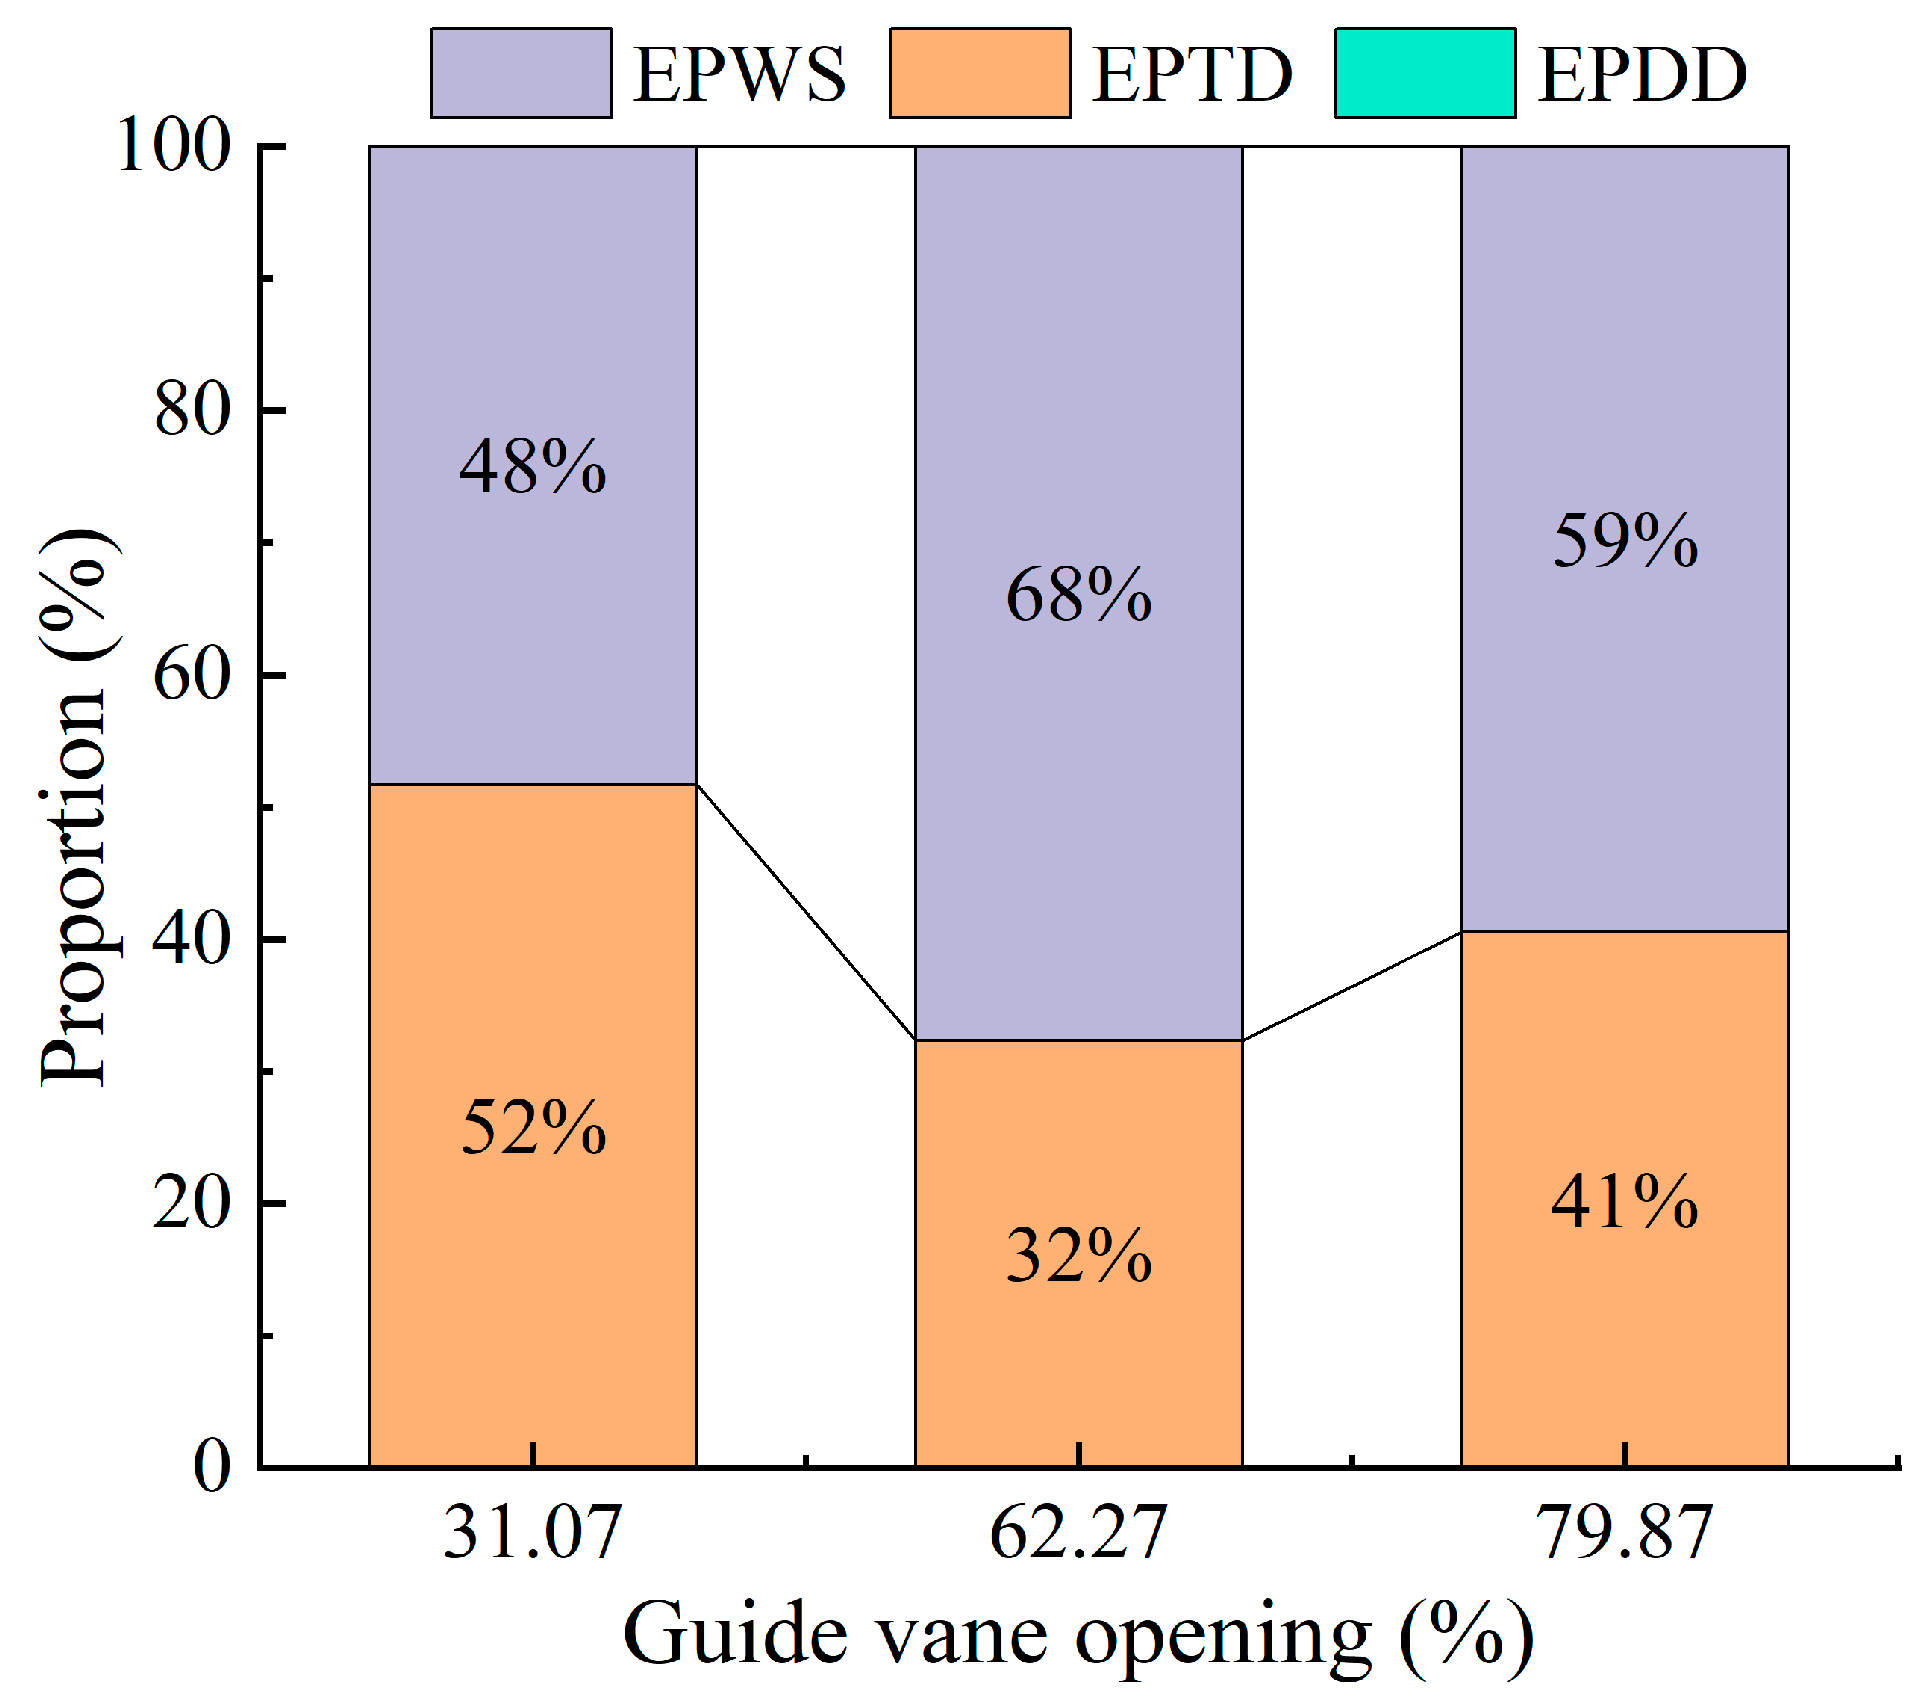
Figure 3 presents the proportions of different entropy generation components under various guide vane openings. It is clear that indirect entropy generation and wall-related entropy generation are the dominant contributors to energy losses, while direct entropy generation accounts for less than 1%, indicating that entropy losses due to mean velocity gradients are significantly lower than those caused by turbulent fluctuations and wall shear effects. As the guide vane opening increases, the proportion of wall entropy generation first rises and then declines. Moreover, wall entropy gradually surpasses indirect entropy, suggesting that the increased flow rate associated with larger openings intensifies velocity gradients near the wall, resulting in higher shear stress. In contrast, energy loss in the main flow region is primarily governed by the turbulence intensity.
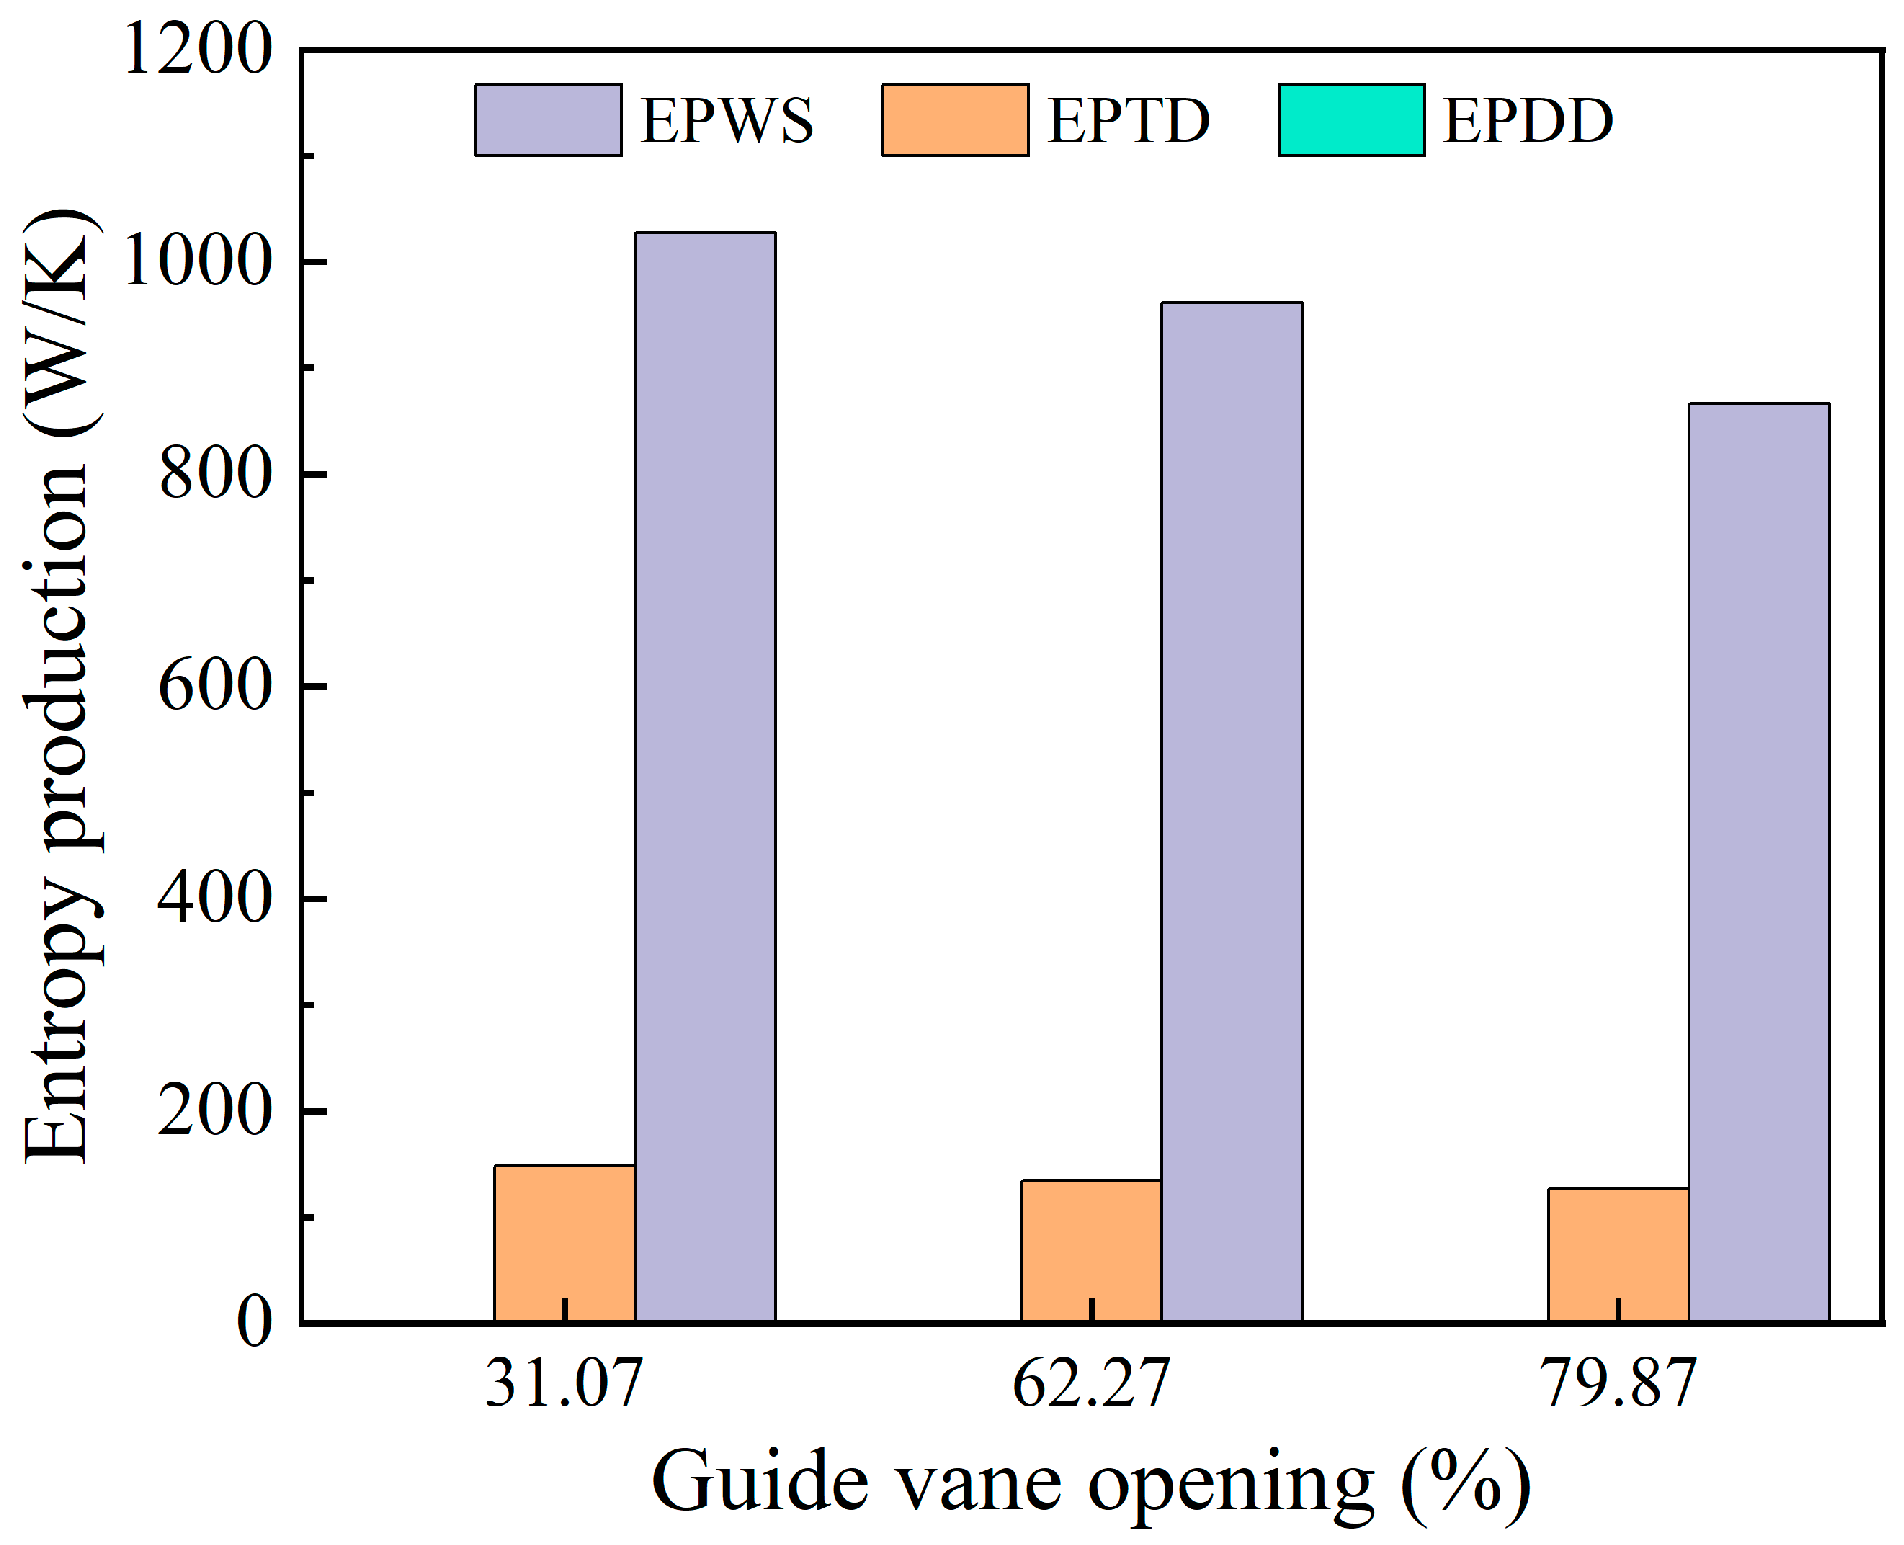
Figure 4 illustrates the variation in the different energy loss components in each flow-passing part with the changing guide vane opening. Overall, the guide vanes, runner, and draft tube are the dominant contributors to the total energy loss of the turbine. Direct and wall-related entropy generation mainly occur in guide vanes, runners, and draft tubes, whereas indirect entropy generation is primarily concentrated in the draft tube. The total indirect entropy generation exhibits a non-monotonic trend with an increasing guide vane opening, first decreasing and then increasing, primarily due to variations in the draft tube, where the indirect entropy generation initially declines before rising. In contrast, the indirect entropy generation within the guide vanes and runner remains relatively stable. As the guide vane opening increases, the wall entropy generation in the runner increases steadily, while that in the draft tube first decreases and then increases, and that in the guide vanes decreases slightly. This explains the overall trend in the total wall entropy generation, which initially increases and then decreases with the guide vane opening. These patterns suggest that larger openings induce high shear stress near the runner walls and a decrease-then-increase pattern of shear stress in the draft tube, with a relatively limited influence on the guide vanes.

4.2. Energy Loss Analysis of the Key Flow-Passing Components

4.2.1. Energy Loss in the Spiral Casing and Stay Vanes

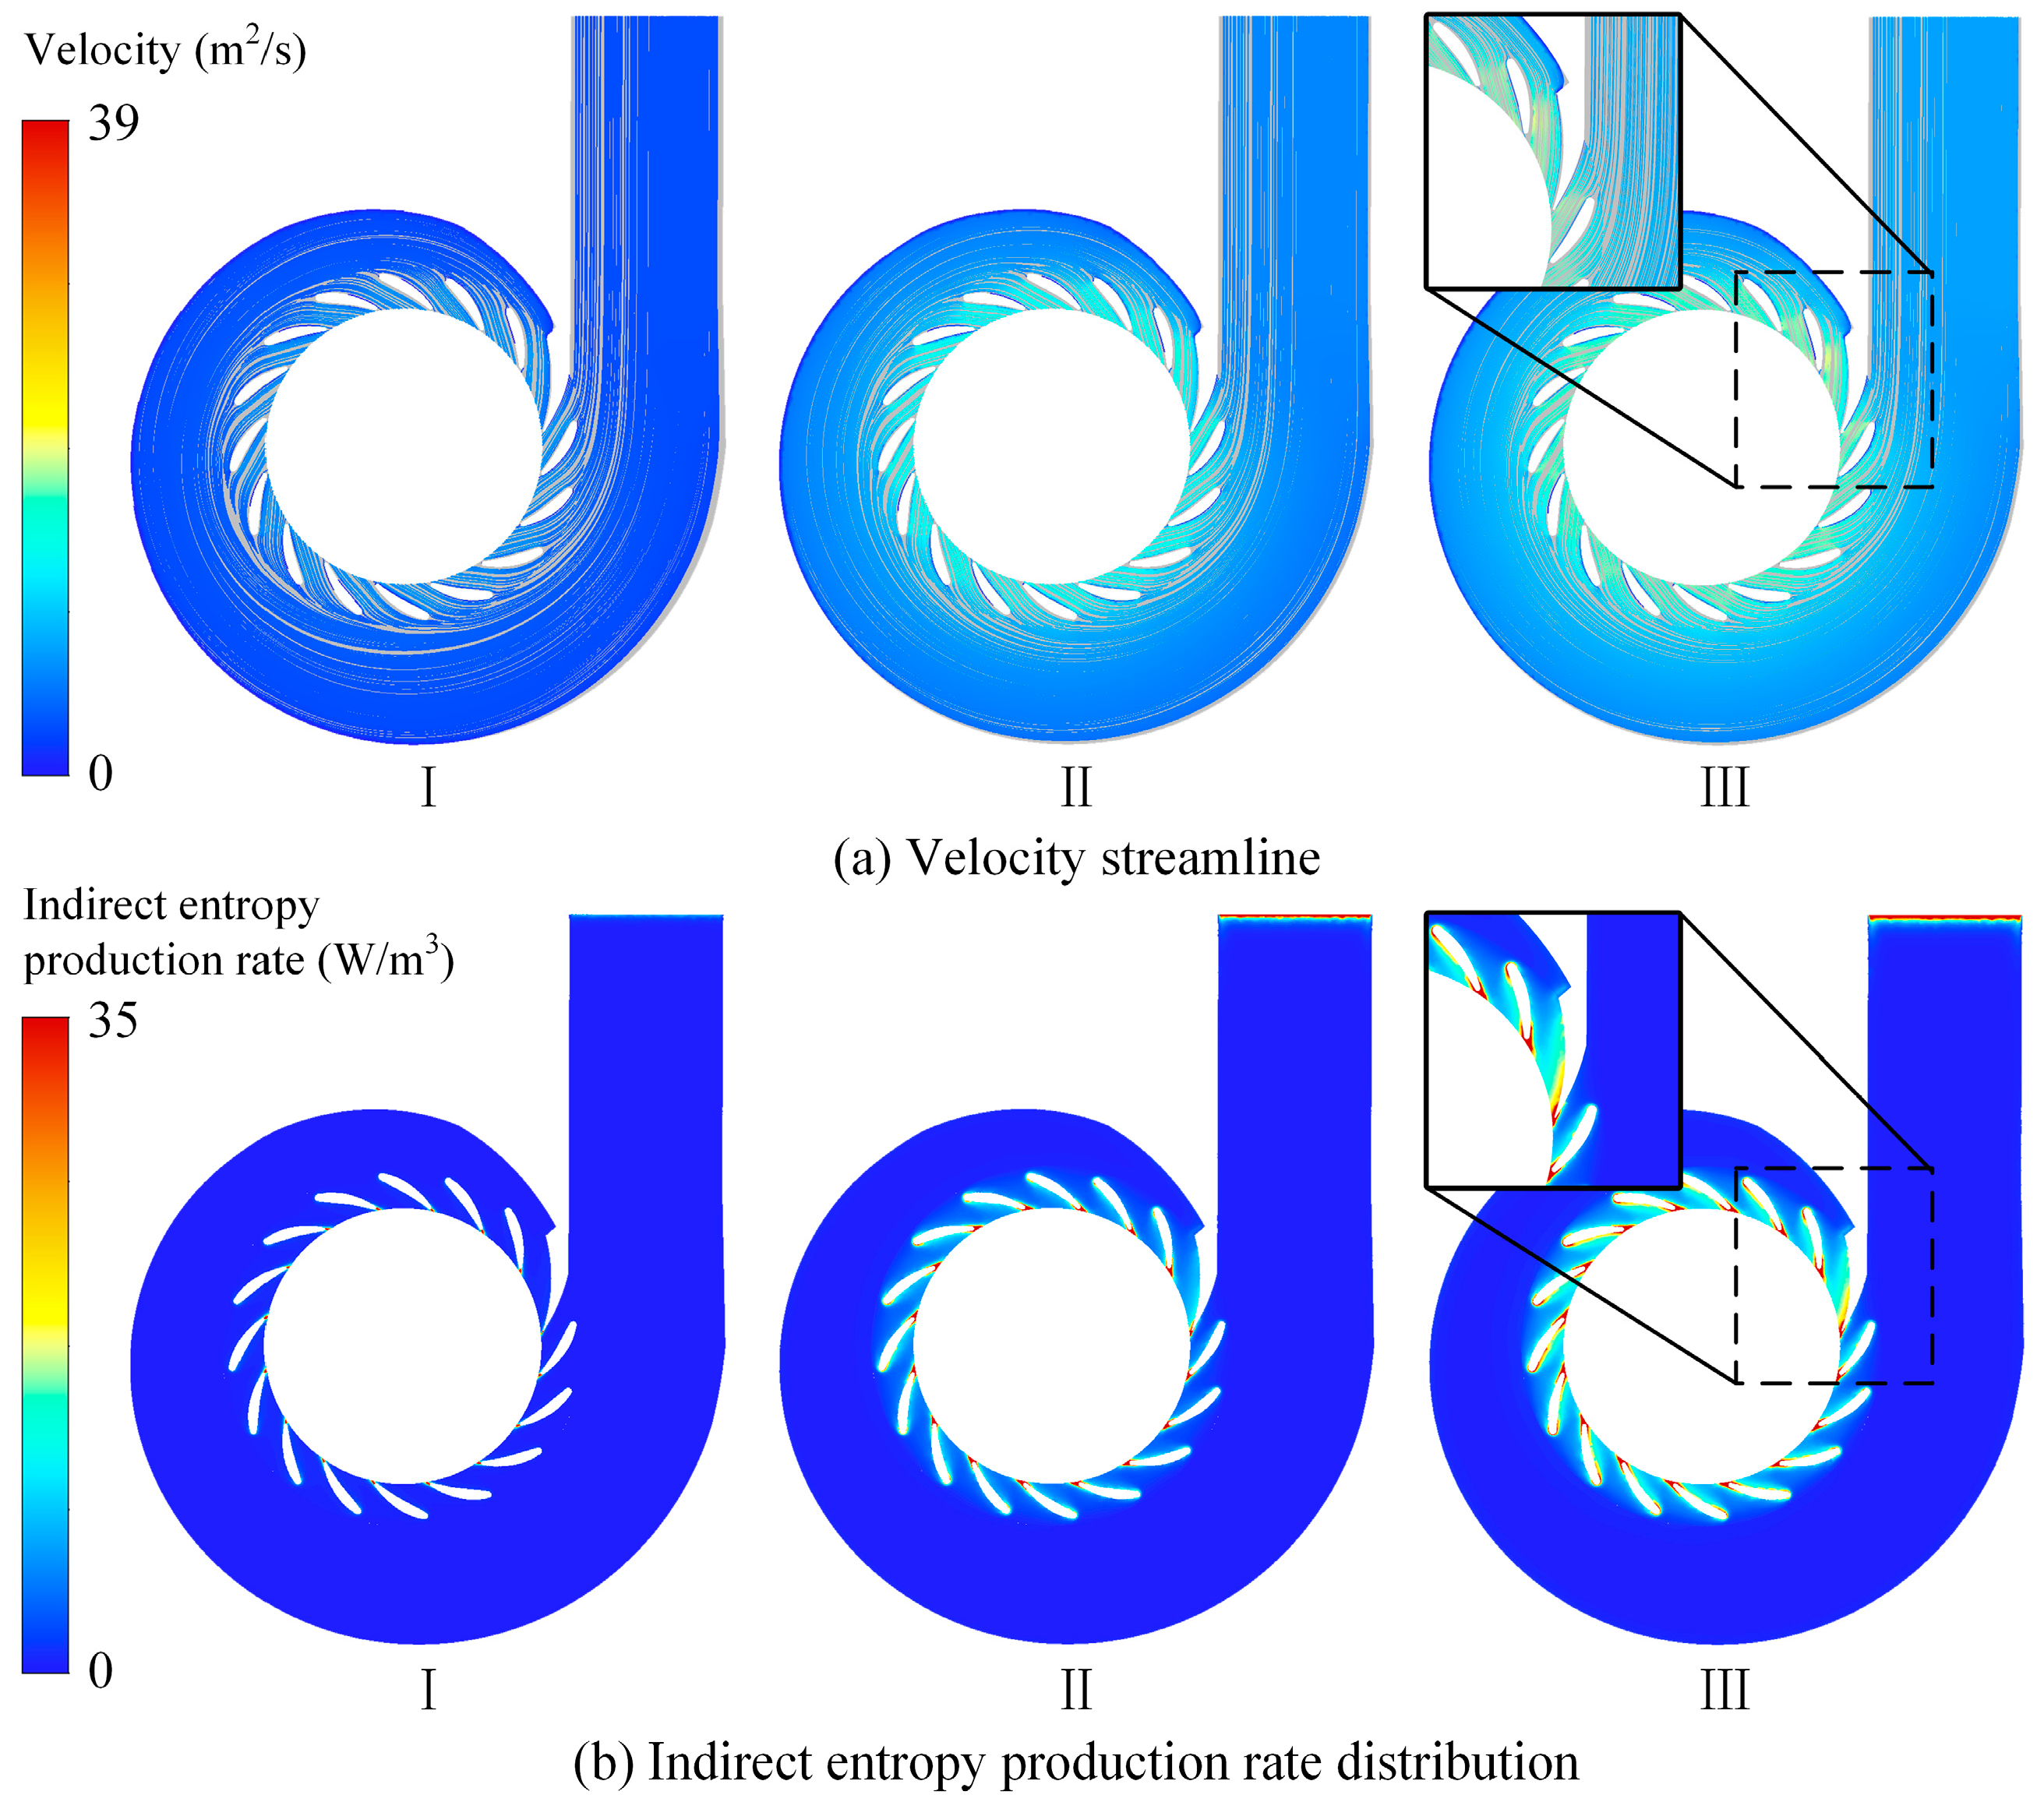
Figure 5 presents the velocity streamlines and indirect entropy generation distribution at the 50% blade height cross-section within the spiral casing and stay vanes under varying guide vane openings. Under the small-opening conditions, the flow within the spiral casing and stay vanes remains relatively well-organized, with the primary energy loss concentrated in the wake region at the trailing edge of the stay vanes. As the guide vane opening increases, particularly at an opening of 79.87%, the flow streamlines at the inlet of the stay vanes become increasingly uneven, and flow separation develops near the tongue of the spiral casing, leading to significant energy loss at the tongue outlet.
Figure 6 presents the variation in the three types of entropy generation in the spiral casing and stay vane region under various guide vane openings. According to Figure 7, wall-related entropy generation and indirect entropy generation account for the majority of the total entropy generation in this area, with indirect entropy generation being slightly less than wall entropy generation, while direct entropy generation contributes only a small portion. As the guide vane opening increases, both indirect entropy generation and wall entropy generation exhibit an increasing trend.

4.2.2. Energy Loss in Guide Vanes

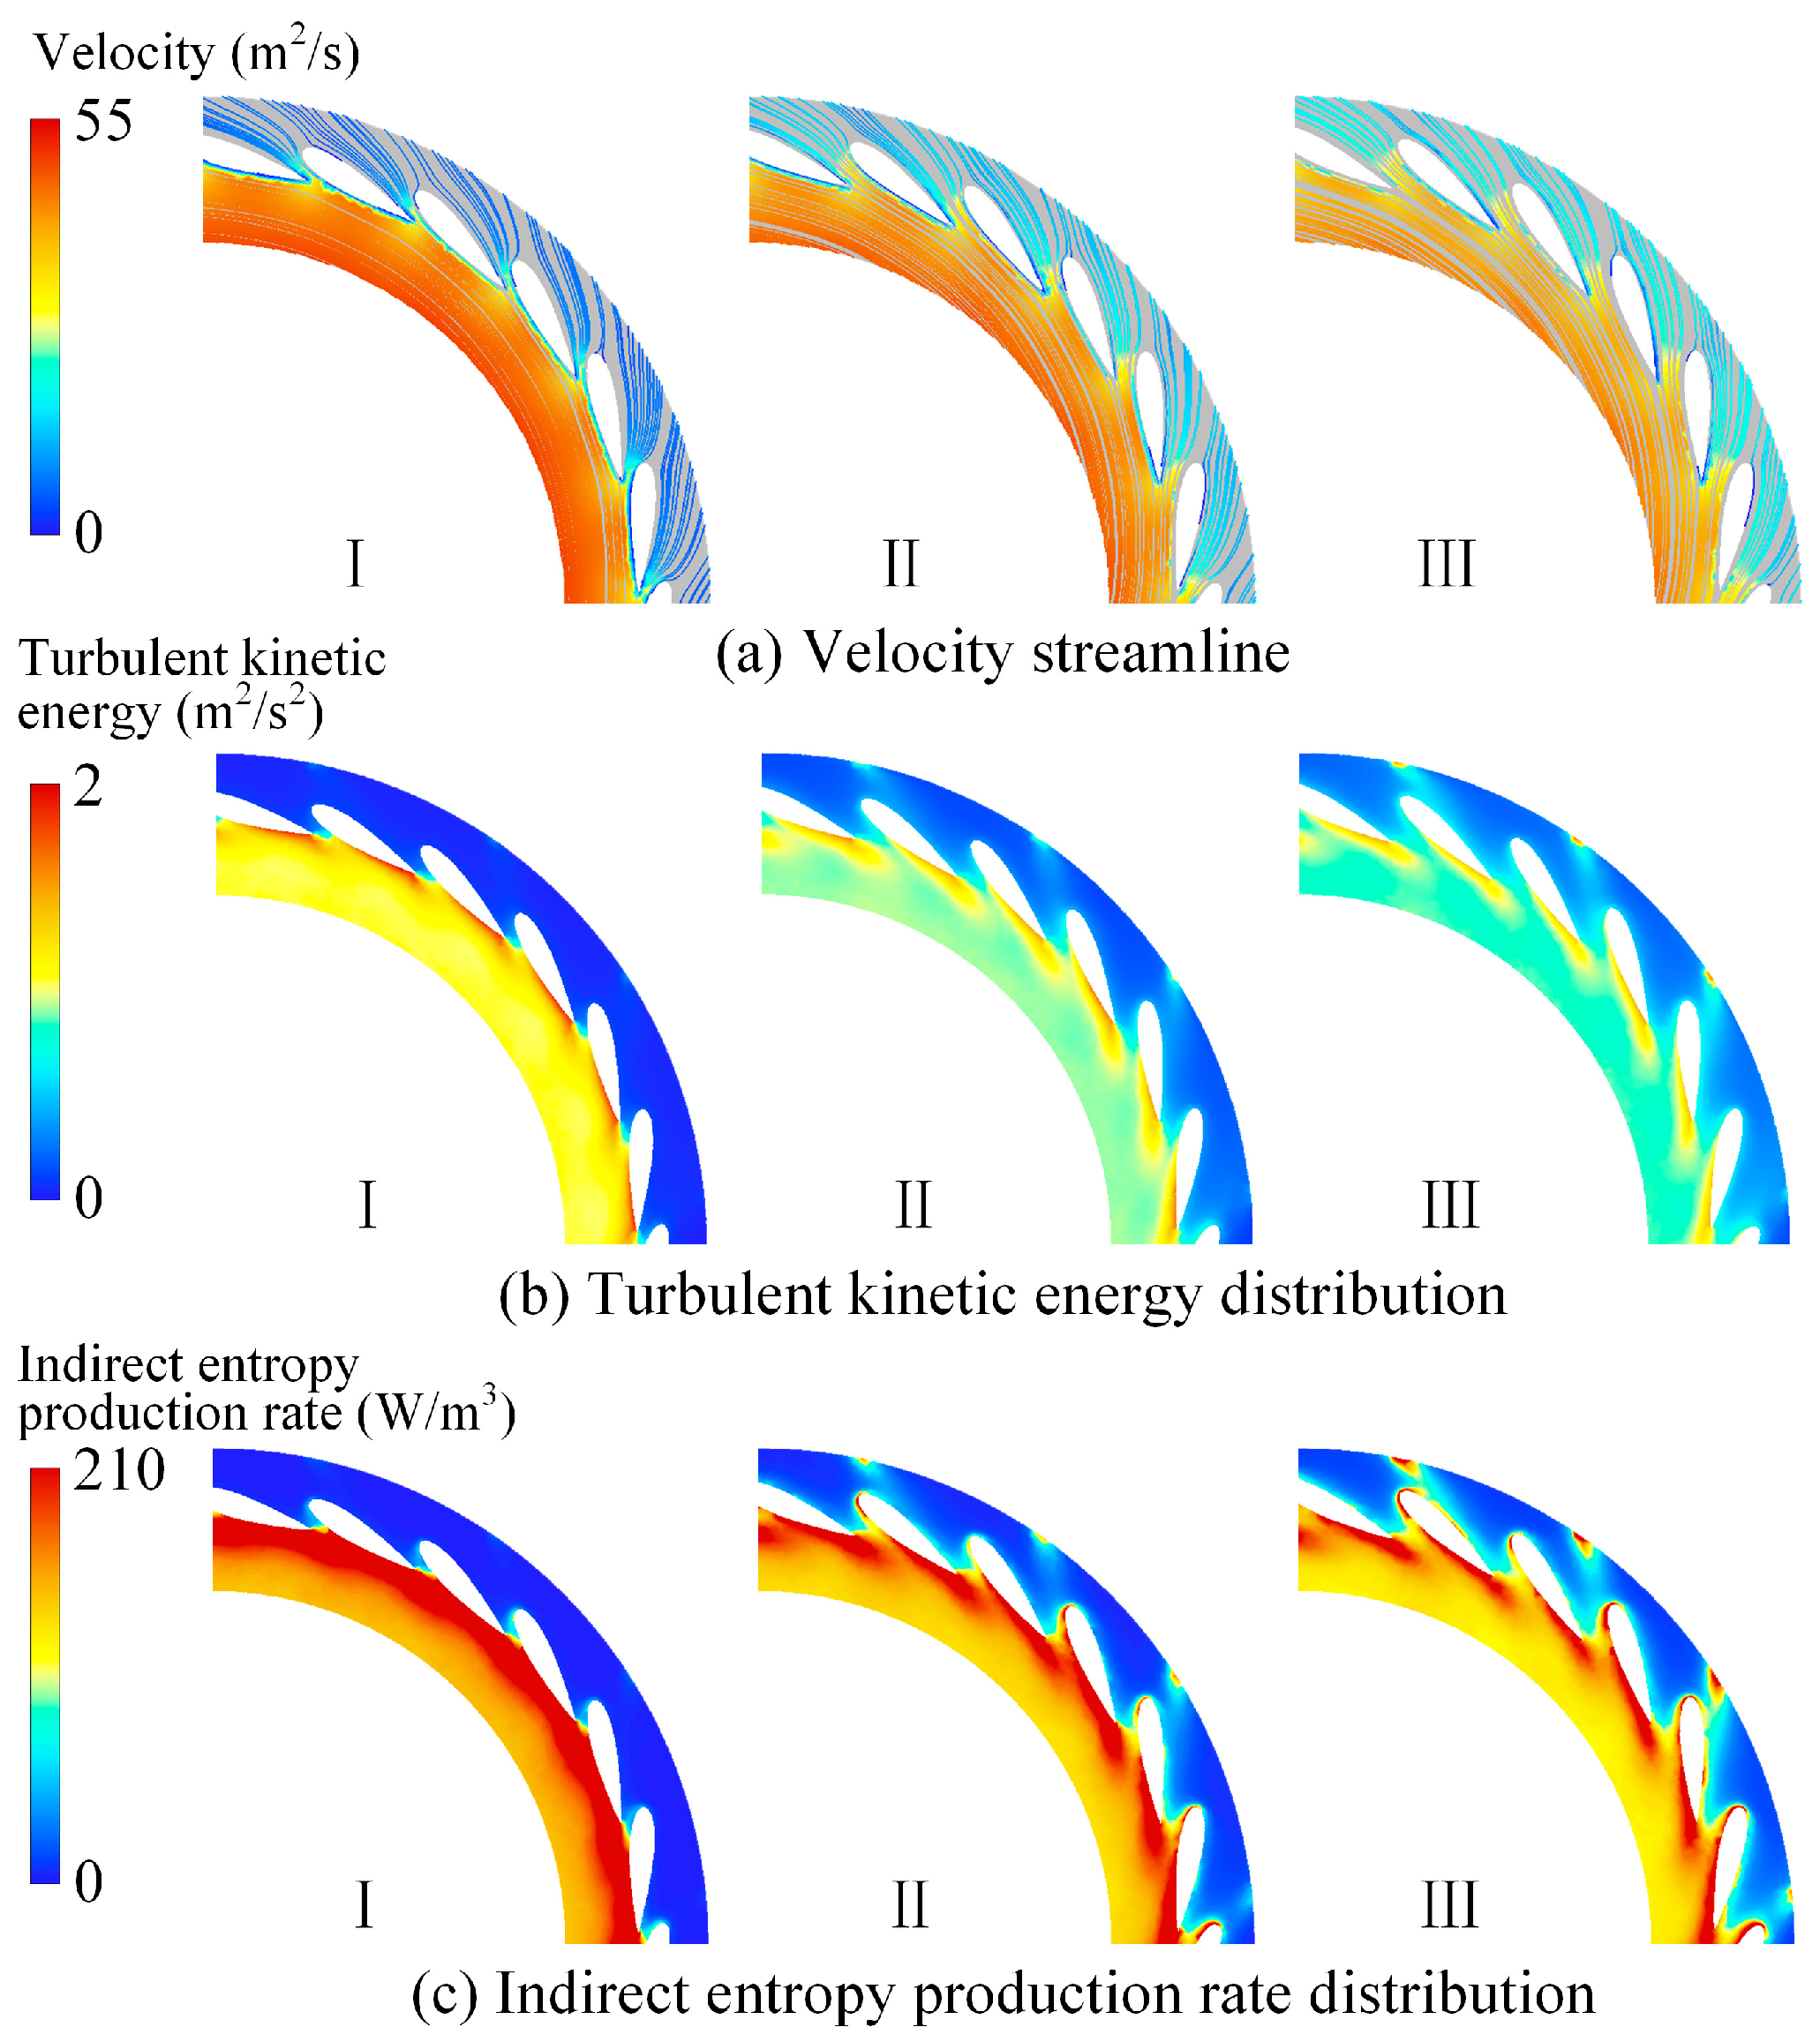
Figure 7 illustrates the velocity streamlines, turbulent kinetic energy, and indirect entropy generation distribution at the 50% blade height cross-section of the adjustable guide vane region under different guide vane openings. At small openings, the reduced flow through the adjustable guide vane region into the runner results in an increased flow velocity within the bladeless region. This velocity disparity creates a gradient between the low-speed boundary layer on the pressure side of the guide vane and the high-speed flow in the bladeless area, intensifying shear stress and subsequently elevating turbulent kinetic energy in the bladeless zone. This explains why the energy loss in the guide vanes is mainly concentrated in the bladeless region. As the guide vane opening becomes larger, the flow through the adjustable guide vane region increases, and the velocity in the bladeless area gradually declines. As a result, the turbulent kinetic energy in this region decreases, causing a corresponding reduction in indirect entropy generation. Under large-opening conditions, the energy loss in the guide vanes is mainly distributed near the pressure side and in the wake region at the trailing edge of the vanes.
Figure 8 shows the variation in the three entropy generation components in the adjustable guide vane region under different guide vane openings. As depicted, indirect entropy generation and wall-related entropy generation are the dominant contributors to the total entropy generation in this region, with indirect entropy being slightly lower than wall entropy, while direct entropy generation accounts for only a minimal share. As the guide vane opening increases, both indirect and wall entropy generation display a decreasing trend.

4.2.3. Energy Loss in the Runner

Figure 9 presents the velocity streamlines and the distribution of indirect entropy generation at the X = 0 cross-section of the runner, along with the entropy distribution at the Z = 0 cross-section under different guide vane openings. Under small-opening conditions, indirect entropy generation in the runner is mainly concentrated in the inlet and outlet regions. This is attributed to strong water impacts at the runner inlet and to flow recirculation at the outlet, both of which lead to highly non-uniform streamlines, thereby increasing entropy generation. As the guide vane opening increases, indirect entropy generation at the runner outlet decreases, while it gradually rises within the runner passage. This behavior results from the enhanced flow velocity inside the runner due to the larger opening, causing the internal flow patterns to become more uneven, while the outlet flow transitions from being chaotic to more organized.
Figure 10 shows the three types of entropy generation in the runner region under various guide vane openings. Indirect and wall entropy generation together account for the majority of the total entropy generation in the runner, with wall entropy representing a larger share. Direct entropy generation remains negligible. As the guide vane opening increases, indirect entropy generation shows a gradual upward trend, while wall entropy generation rises sharply. This indicates that larger openings amplify near-wall shear stress in the runner region.

4.2.4. Energy Loss in the Draft Tube

Figure 11 shows the velocity streamlines and indirect entropy generation distributions at the X = 0 m cross-section of the draft tube under different guide vane openings. In the figure, it is evident that, with an increasing guide vane opening, the energy loss in the conical diffuser section of the draft tube decreases, while the losses in the elbow section increase. Under small-opening conditions, strong vortices form near the walls of the conical diffuser and elbow sections, along with a large vortex at the center of the diffuser outlet, causing indirect entropy generation to concentrate in these areas. Under the 62.27% guide vane opening conditions, secondary vortex structures develop in the draft tube inlet and elbow sections, becoming the primary sources of energy loss. Under large-opening conditions, these secondary vortices intensify along the inner wall of the elbow, and high-speed vortices emerge at the bottom of the inlet and outlet sections, leading to increased indirect entropy generation.
Figure 12 presents the changes in the three components of entropy generation within the adjustable guide vane region under varying guide vane openings. As depicted in the figure, indirect entropy generation and wall-related entropy generation make up the largest share of the total entropy in this area, with indirect entropy being higher than wall entropy, while direct entropy generation contributes only a small fraction. With an increase in the guide vane opening, both indirect and wall entropy generation exhibit a pattern of first decreasing and then rising.

5. Conclusions

On the basis of entropy generation theory, numerical simulations of solid–liquid two-phase flow inside the Francis turbine of the Gengda hydropower station were conducted to analyze the energy loss characteristics under sediment-laden conditions at different guide vane openings. The following conclusions were drawn:
(1)
Under varying guide vane openings, indirect entropy generation and wall-related entropy generation are the dominant contributors to the total energy loss, whereas direct entropy generation accounts for less than 1% of the total energy loss. Indirect entropy generation is primarily concentrated in the draft tube, whereas wall-related entropy generation is mainly distributed in the near-wall regions of the guide vanes, runner, and draft tube.
(2)
The total indirect entropy generation exhibits a non-monotonic trend, initially decreasing and then increasing with an increasing guide vane opening. This variation is mainly governed by the flow regime in the draft tube: at small openings, reduced vortices near the walls of the conical diffuser result in lower entropy generation, while at large openings, intensified secondary vortices in the elbow section cause entropy to rise again. The total wall entropy generation also exhibits a non-monotonic trend, first increasing and then decreasing, which is attributed to the rising shear stress from the velocity gradients on the runner blade surfaces and the nonlinear variation in the shear stress along the draft tube walls. In contrast, wall entropy generation in the guide vanes is relatively less affected by the change in the opening.
(3)
With an increasing guide vane opening, the entropy generation in the spiral casing and stay vane region tends to increase, that in the adjustable guide vane region tends to decrease, that in the runner region tends to increase, and that in the draft tube region tends to first decrease and then increase.

Author Contributions

Methodology, X.L. (Xiaobing Liu); Software, Y.X. (Yu Xiao); Investigation, Y.X. (Yaogang Xu); Resources, X.L. (Xudong Lu); Data curation, Z.W.; Writing—original draft, K.X.; Writing—review & editing, J.P.; Funding acquisition, C.H. All authors have read and agreed to the published version of the manuscript.

Funding

This research is supported by the State Grid Sichuan Electric Power Company Science & Technology Project “Research on Sediment Abrasion of Turbine Top Covers and Optimization of Repair Solutions” (No. 52190123002).

Data Availability Statement

Data is contained within the article.

Conflicts of Interest

This study was conducted in collaboration with Xihua University, China Agricultural University and Sichuan Yingxiuwan Hydropower Plant. The authors declare that the research was conducted in the absence of any commercial or financial relationships.

References

  1. Liu, X. Studies of Solid-liquid Two-phase Turbulent Flows and Wear in Hydraulic Turbomachinery. J. Hydrodyn. 1996, 6, 606–609. [Google Scholar]
  2. Liu, X.; Zeng, Y.; Hua, H.; Yu, Z.; Pang, J.; Tian, C.A. Study on sediment abrasion of turbine runner blades in Yuzixi hydropower station. J. Xihua Univ. (Nat. Sci. Ed.) 2020, 39, 67–73. [Google Scholar]
  3. Wei, X.-Y.; Pei, J.; Wang, W.-Q.; Yu, Z.-F. Numerical study on sediment erosion characteristics of Francis turbine runner. Eng. Fail. Anal. 2024, 161, 108270. [Google Scholar] [CrossRef]
  4. Shrestha, R.; Gurung, P.; Chitrakar, S.; Thapa, B.; Neopane, H.P.; Guo, Z.; Qian, Z. Review on experimental investigation of sediment erosion in hydraulic turbines. Front. Mech. Eng. 2024, 10, 1526120. [Google Scholar] [CrossRef]
  5. Pang, J.; Liu, H.; Liu, X.; Yang, H.; Peng, Y.; Zeng, Y.; Yu, Z. Study on sediment erosion of high head Francis turbine runner in Minjiang River basin. Renew. Energy 2022, 192, 849–858. [Google Scholar] [CrossRef]
  6. Thapa, B.S.; Dahlhaug, O.G.; Thapa, B. Sediment erosion in hydro turbines and its effect on the flow around guide vanes of Francis turbine. Renew. Sustain. Energy Rev. 2015, 49, 1100–1113. [Google Scholar] [CrossRef]
  7. Yang, J.; Peng, C.; Li, C.; Liu, X.; Liu, J.; Wang, Z. Design and verification of Francis turbine working in sand laden hydro-power plant. Renew. Energy 2023, 207, 40–46. [Google Scholar] [CrossRef]
  8. Wang, H.; Pang, J.; Liu, X.; Zhou, Z.; Gang, Y.; Lai, Z.; Wang, J.; Qin, B. Analysis on cause of erosion of guide vane of high-head Francis turbine in sandy river. Energy Sci. Eng. 2024, 12, 3704–3717. [Google Scholar] [CrossRef]
  9. Wang, H.; Pang, J.; Lai, Z.; Li, S.; Jiang, D.; Wang, X.; Xiang, P.; Yao, B.; Zeng, Y.; Liu, X. Influence of guide vane skirt structure on sediment erosion of high-head turbine in high hardness and sandy river. Phys. Fluids 2024, 36, 103317. [Google Scholar] [CrossRef]
  10. Zhou, Z.; Xu, K.; Gang, Y.; Xiang, W.; Zhang, Z.; Li, Y.; Pang, J.; Liu, X. Design of a single-channel wear test device for the Francis-99 turbine guide mechanism and sediment wear testing. Phys. Fluids 2025, 37, 033346. [Google Scholar] [CrossRef]
  11. Cruzatty, C.; Jimenez, D.; Valencia, E.; Zambrano, I.; Mora, C.; Luo, X.; Cando, E. A Case Study: Sediment Erosion in Francis Turbines Operated at the San Francisco Hydropower Plant in Ecuador. Energies 2021, 15, 8. [Google Scholar] [CrossRef]
  12. Gautam, S.; Acharya, N.; Lama, R.; Chitrakar, S.; Neopane, H.P.; Zhu, B.; Dahlhaug, O.G. Numerical and experimental investigation of erosive wear in Francis runner blade optimized for sediment laden hydropower projects in Nepal. Sustain. Energy Technol. Assess. 2022, 51, 101954. [Google Scholar] [CrossRef]
  13. Zhou, Z.; Xiang, P.; Xu, K.; Liu, J.; Gang, Y.; Wang, H.; Pang, J.; Liu, X. Effect of Sand Particle Size on Sand-Water Flow in a Francis-99 Distributor. Energy Sci. Eng. 2025. [Google Scholar] [CrossRef]
  14. Gong, R.; Wang, H.; Chen, L.; Li, D.; Zhang, H.; Wei, X. Application of entropy production theory to hydro-turbine hydraulic analysis. Sci. China Technol. Sci. 2013, 56, 1636–1643. [Google Scholar] [CrossRef]
  15. Zhou, L.; Hang, J.; Bai, L.; Krzemianowski, Z.; El-Emam, M.A.; Yasser, E.; Agarwal, R. Application of entropy production theory for energy losses and other investigation in pumps and turbines: A review. Appl. Energy 2022, 318, 119211. [Google Scholar] [CrossRef]
  16. Liu, K.; Liu, H.; Qu, L.; Liu, D.; Chi, F.; Kan, K.; Zhou, D. Analysis of Hydraulic Loss Characteristics of Francis Turbine Based on Entropy Production Theory. Water Resour. Power 2024, 42, 157–161. [Google Scholar]
  17. Yu, A.; Tang, Y.; Tang, Q.; Cai, J.; Zhao, L.; Ge, X. Energy analysis of Francis turbine for various mass flow rate conditions based on entropy production theory. Renew. Energy 2022, 183, 447–458. [Google Scholar] [CrossRef]
  18. Yu, Z.F.; Wang, W.Q.; Yan, Y.; Liu, X.S. Energy loss evaluation in a Francis turbine under overall operating conditions using entropy production method. Renew. Energy 2021, 169, 982–999. [Google Scholar] [CrossRef]
  19. Ahn, S.H.; Tian, H.; Cao, J.; Duo, W.; Wang, Z.; Cui, J.; Li, Y.; Huang, G.; Yu, Y. Hydraulic performances of a bulb turbine with full field reservoir model based on entropy production analysis. Renew. Energy 2023, 211, 347–360. [Google Scholar] [CrossRef]
  20. Wang, X.; Yan, Y.; Wang, W.Q.; Hu, Z.P. Evaluating energy loss with the entropy production theory: A case study of a micro horizontal axis river ducted turbine. Energy Convers. Manag. 2023, 276, 116553. [Google Scholar] [CrossRef]
  21. Wang, Z.; Yang, H.; Xia, X.; Li, X.; Zuo, Q.; Xie, B.; Chen, W. Optimization of a radial inflow turbine rotor with splitter blades based on entropy production theory and artificial neural network. Appl. Therm. Eng. 2024, 252, 123759. [Google Scholar] [CrossRef]
  22. Liang, A.; Li, H.; Zhang, W.; Yao, Z.; Zhu, B.; Wang, F. Study on pressure fluctuation and rotating stall characteristics in the vaneless space of a pump-turbine in pump mode. J. Energy Storage 2024, 94, 112385. [Google Scholar] [CrossRef]
  23. Kock, F.; Herwig, H. Local entropy production in turbulent shear flows: A high-Reynolds number model with wall functions. Int. J. Heat Mass Transf. 2003, 47, 2205–2215. [Google Scholar] [CrossRef]
  24. Mathieu, J.; Scott, J. An Introduction to Turbulent Flow; Cambridge University Press: Cambridge, UK, 2000. [Google Scholar]
  25. Menter, F.R. Two-equation eddy-viscosity turbulence models for engineering applications. AIAA J. 2012, 32, 1598–1605. [Google Scholar] [CrossRef]
  26. Zhang, Y.X.; Hou, H.C.; Xu, C.; He, W.; Li, Z. Application of entropy production method to centrifugal pump energy loss evaluation. J. Drain. Irrig. Mach. Eng. 2017, 35, 277–282, 288. [Google Scholar]
  27. Lu, J.L.; Wang, L.K.; Liao, W.L.; Zhao, Y.P.; Ji, Q.F. Entropy production analysis for vortex rope of a turbine model. J. Hydraul. Eng. 2019, 50, 233–241. [Google Scholar]
  28. Kan, K.; Zhang, Q.; Xu, Z.; Chen, H.; Zheng, Y.; Zhou, D.; Binama, M. Runaway characteristics of bidirectional horizontal axial flow pump withsuper low head based on entropy production theory. Trans. Chin. Soc. Agric. Eng. 2021, 37, 49–57. [Google Scholar]
  29. Duan, L.; Wu, X.; Ji, Z.; Xiong, Z.; Zhuang, J. The flow pattern and entropy generation in an axial inlet cyclone with reflux cone and gaps in the vortex finder. Powder Technol. 2016, 303, 192–202. [Google Scholar] [CrossRef]
  30. Stern, F.; Wilson, R.V.; Coleman, H.W.; Paterson, E.G. Comprehensive Approach to Verification and Validation of CFD Simulations—Part 1: Methodology and Procedures. J. Fluids Eng. 2001, 123, 793–802. [Google Scholar] [CrossRef]
  31. Roy, C.J. Grid Convergence Error Analysis for Mixed-Order Numerical Schemes. AIAA J. 2012, 41, 595–604. [Google Scholar] [CrossRef]
  32. Daniels, S.; Rahat, A.; Tabor, G.; Fieldsend, J.; Everson, R. Shape optimisation of the sharp-heeled Kaplan draft tube: Performance evaluation using Computational Fluid Dynamics. Renew. Energy 2020, 160, 112–126. [Google Scholar] [CrossRef]
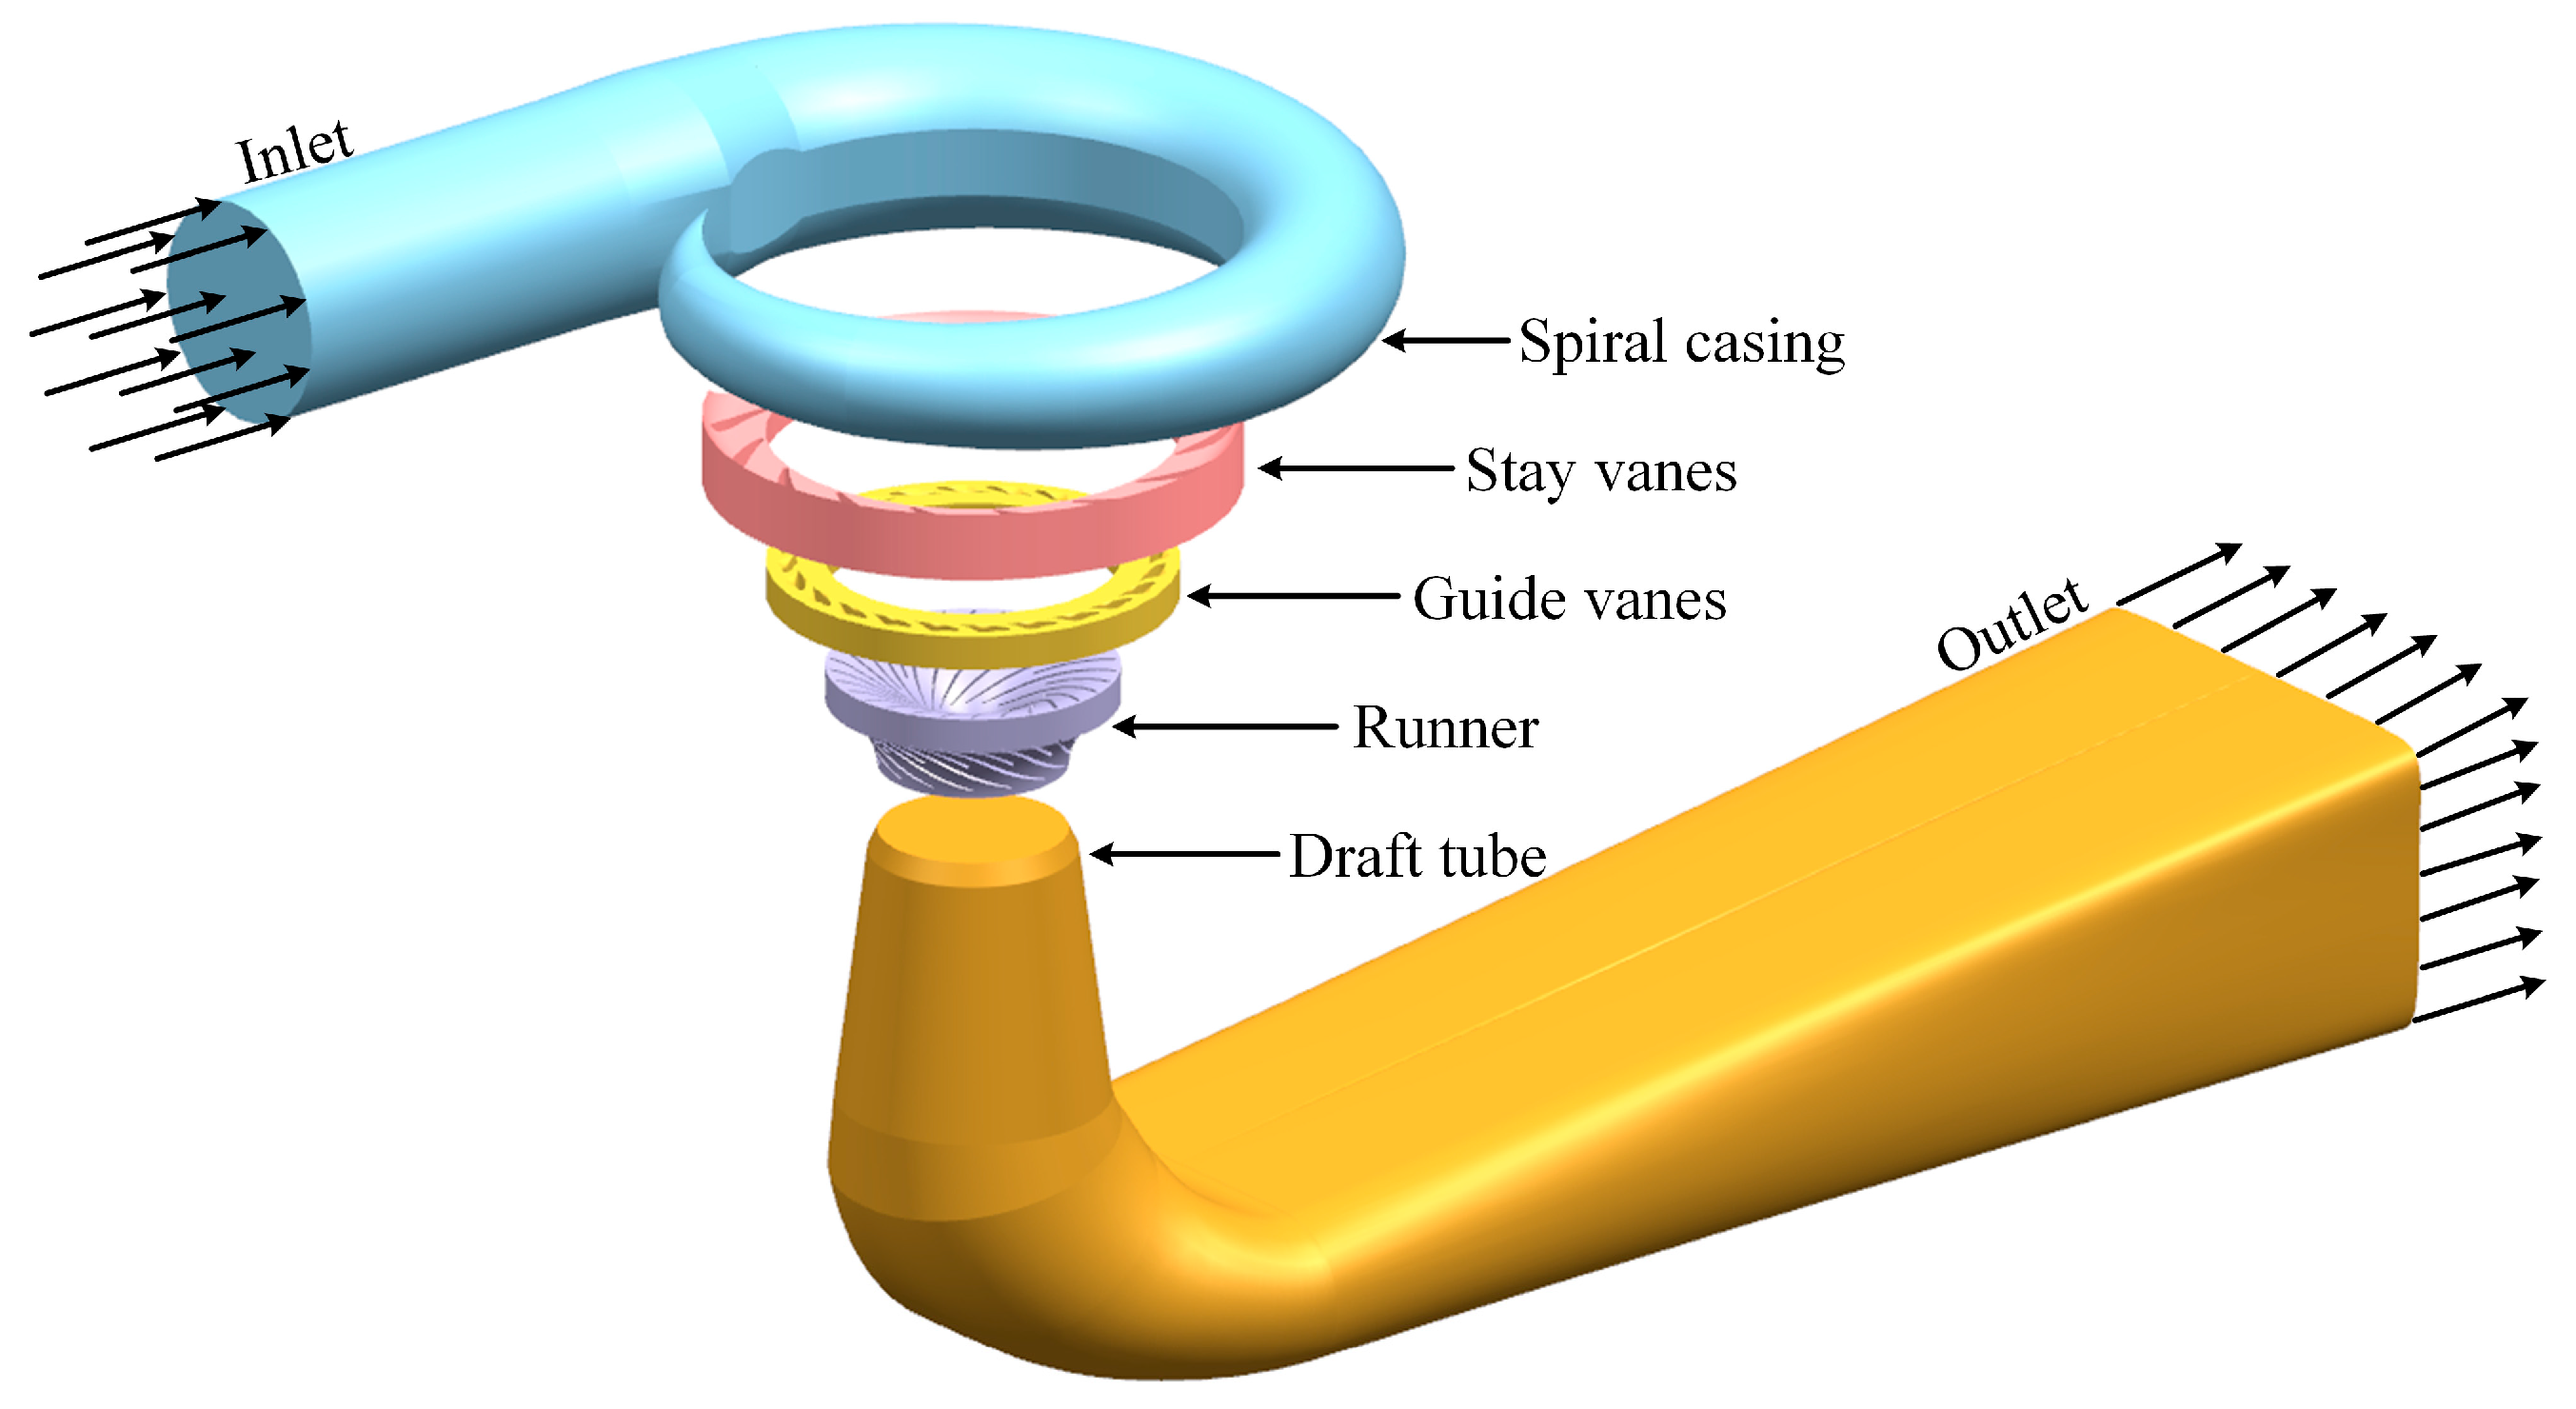
Figure 1. Francis turbine three-dimensional water model.
Water 17 02002 g001
Figure 2. Francis turbine grid model.
Water 17 02002 g002
Figure 3. Proportion of hydraulic loss components under different openings.
Water 17 02002 g003
Figure 4. Comparison of different hydraulic loss components in each flow component at different openings.
Water 17 02002 g004
Figure 5. Flow field analysis and hydraulic loss distribution of the spiral casing and stay vane.
Water 17 02002 g005
Figure 6. Three kinds of entropy production changes in the spiral casing and stay vane area.
Water 17 02002 g006
Figure 7. Flow field analysis and hydraulic loss distribution of the guide vane.
Water 17 02002 g007
Figure 8. Three kinds of entropy production changes in the guide vane area.
Water 17 02002 g008
Figure 9. Flow field analysis and hydraulic loss distribution of the runner.
Water 17 02002 g009
Figure 10. Three kinds of entropy production changes in the runner area.
Water 17 02002 g010
Figure 11. Flow field analysis and hydraulic loss distribution of the draft tube.
Water 17 02002 g011
Figure 12. Three kinds of entropy production changes in the draft tube area.
Water 17 02002 g012
Table 1. Turbine basic parameters.
ParameterValueParameterValue
Design head (m)283Design flow (m3/s)16
Runner diameter (m)0.630Rated speed (rpm)500
Stay vane16Guide vane24
Runner’s long blade15Runner’s short blade15
Table 2. Essential parameters.
Opening IOpening IIOpening III
Grid Number (×104)Efficiency
(%)
Grid Number (×104)Efficiency
(%)
Grid Number (×104)Efficiency
(%)
G1173986.6204995.6194194.3
G292086.292595.392694.0
G359082.157292.756390.9
Table 3. GCI computational process of G2.
Opening e a 21 r21prFsGCI
I0.4711.23715.3101.250.0237
II0.5491.30412.9611.250.0228
III0.5231.28013.6911.250.0231
Table 4. The grid number of G2 under three working conditions.
Spiral CasingStay VaneGuide VaneRunnerDraft Tube
IIIIII
Grid number (×104)8158252257258206323
Table 5. Calculation parameters of each working condition.
OpeningGuide Vane Opening (%)Power (MW)Total Pressure Inlet (kPa)Pressure Outlet (kPa)
I31.0710259667.477
II62.2730258267.477
III79.8740257167.477
Table 6. Comparison of the actual and numerical hydraulic efficiency of the turbine.
OpeningIIIIII
Actual84.5%92.6%91.5%
Numerical86.2%95.3%94.0%
Difference2.01%2.92%2.73%
Disclaimer/Publisher’s Note: The statements, opinions and data contained in all publications are solely those of the individual author(s) and contributor(s) and not of MDPI and/or the editor(s). MDPI and/or the editor(s) disclaim responsibility for any injury to people or property resulting from any ideas, methods, instructions or products referred to in the content.