Abstract
This study examines hydrological alterations across thirteen sections of the Tagus River’s central axis, focusing on deviations from natural hydrological regimes. The goal is to assess the conservation status of aquatic ecosystems by analyzing how human activities have affected the river’s flow. The study investigates changes in flow regime as the river moves downstream, noting that alterations in monthly and extreme flows decrease downstream and have less impact in the lower basin. The inversion of seasonal high and low flows, a significant alteration in the upper reaches, becomes less pronounced further downstream, while the rate of flow change emerges as a key factor in the lower sections. By identifying which variables most influence these alterations, the study allows for more targeted hydrological corrections. As an application of a better definition of the alterations found, hydrological restoration measures are proposed that include a maximum flow limit in the upper part of the basin and a monthly ecological flow regime in the lower section to reduce the most relevant impacts found.
1. Introduction
The functioning of river ecosystems is profoundly influenced by the flow regime, which is considered the primary factor structuring these ecosystems. The flow regime also affects the riparian environment, shaping both environmental conditions and the diversity of habitats and biological interactions within river systems [1,2,3,4,5]. While the role of hydrological conditions in supporting biodiversity is well established, the application of this knowledge to assess the health of river environments and inform restoration efforts remains limited, particularly in Spain.
The European Water Framework Directive underscores [6] the importance of hydromorphological parameters in evaluating ecological status. However, hydrological variables are not yet included in such evaluations in Spain, despite recent proposals by the Ministry to incorporate them into future protocols [7]. The role of restoring natural flow regimes is well documented, with numerous studies [1] showing that restoring key components of a river’s natural flow regime can significantly enhance both physical and biological processes.
Therefore, conservation and restoration programs aimed at rehabilitating degraded ecosystems should prioritize maintaining or restoring key aspects of the flow regime, focusing on regimes that exhibit minimal alterations or slight deviations from their natural state [1,8,9]. This approach is essential for conserving biodiversity and restoring ecosystem functions.
To successfully restore and protect river ecosystems affected by flow regulation, it is crucial to understand the hydrological and hydraulic variables that drive the biological processes in these environments. Restoration programs must consider the relationship between these hydrological variables and the diversity and richness of river habitats. A critical first step in these programs is to characterize the natural flow regime, identify relevant hydrological variables, and assess the extent of alterations from the natural state. Significant advancements have been made in hydrological data analysis, with various methods developed to evaluate both the current state of rivers and their changes over time. These methods generally involve selecting key hydrological variables, quantifying them, defining their value ranges, measuring their values under altered conditions, and establishing criteria to evaluate these alterations and disturbances [10,11].
In practice, these methods require long-term, representative flow data to characterize the natural flow regime, as well as data on alterations, typically gathered from gauging stations. The effort to characterize the natural flow regime using variables such as flow magnitude, duration, and frequency gained momentum in the late 1990s with the work of Richter et al. [9] and Olden and Poff [12]. This framework for characterizing flow regimes was eventually adopted in Spain, with efforts made to describe the hydrological behavior of rivers in various basins, including the Tagus, Ebro, and Segura rivers [13,14,15,16]. A standardized method was developed, incorporating computer applications to first characterize the natural flow regime and then assess the extent of its alteration [17]. Addressing hydrological alteration is essential for good ecological status; the flow regime controls the composition, structure, and dynamics of the river ecosystem, and changes in the composition and distribution of riparian vegetation, but may not be sufficient for comprehensive river restoration, as other components such as morphological changes caused by construction works or pollution are not solved by improving hydrological alteration alone.
Understanding the natural flow regime and the degree of its alteration is crucial not only for restoring river ecosystems but also for classifying rivers based on their hydrological behavior. By assessing the degree of alteration, restoration efforts can be more effectively targeted to address specific impacts. Moreover, this process helps identify which aspects of the flow regime are most affected by human activity and which should be prioritized in restoration efforts. For example, this approach can be used to evaluate the environmental impacts of different water management and resource use scenarios, interpret how alterations to the flow regime affect the river’s environmental integrity, and identify the flow regime components that most significantly influence the rehabilitation of a regulated river section.
The Tagus River serves as an illustrative example of a river system undergoing significant hydrological alteration. As a major waterway in the Iberian Peninsula, the river has been extensively modified for various human activities, including urban and industrial water supply, irrigation, hydroelectric power generation, water transfers, and cooling processes [18]. These activities have led to numerous environmental, social, and economic consequences, particularly in the central section of the river, which faces heavy water usage. Water is transferred from the headwaters to other basins, withdrawn for use in Madrid, and large amounts of sewage are introduced from urban areas. The ecological status of the Tagus River has been severely impacted by reduced flow and poor water quality [19], especially in the stretch from the Bolarque reservoir to the Portuguese border, where the river passes through a series of large reservoirs.
The ecological health of the Tagus River is a particular concern. Despite the time elapsed since the implementation of the Water Framework Directive [6] and the drafting of the Tagus Basin Plan in 2019 [20], improvements in the river’s condition have not materialized. The river’s status continues to fall short of the “good” ecological status required by the WFD. This failure largely stems from the inability to adequately measure and address the hydrological alterations that have occurred [21]. The work presented in this paper focuses on the Tagus basin, which continues to experience significant pressures from hydrological alterations. The goal is to lay the foundation for effective restoration efforts by first identifying the hydrological alterations in the river and then specifying corrective measures.
To improve restoration outcomes, it is essential to classify river sections based on similar alteration characteristics and relate these alterations to the typologies of water use or exploitation systems in the basin. This approach will help tailor restoration efforts to the specific conditions of each section of the river. Additionally, specific restoration measures have been developed within the context of improving hydrological restoration approaches, with a particular focus on components of the Environmental Flow Regime. These measures aim to address the unique hydrological challenges in each river section.
The River Basin administration has proposed a uniform environmental flow regime across all sections of the river [20]. However, this generalized approach does not contribute to improving the river’s status, as it fails to address the primary hydrological issues. A more effective environmental flow regime would need to consider the specific alterations and challenges faced by different sections of the river, ensuring that restoration efforts are better designed to meet the unique needs of each area.
The broader goal of restoration efforts for the Tagus River, and other rivers facing similar challenges, is to improve the environmental integrity of these river systems by properly characterizing the natural flow regime, understanding its alterations, and designing targeted restoration measures based on these findings [22]. This comprehensive approach will ultimately help ensure the sustainability and health of river ecosystems, supporting biodiversity, ecosystem functions, and the various services that rivers provide to humans.
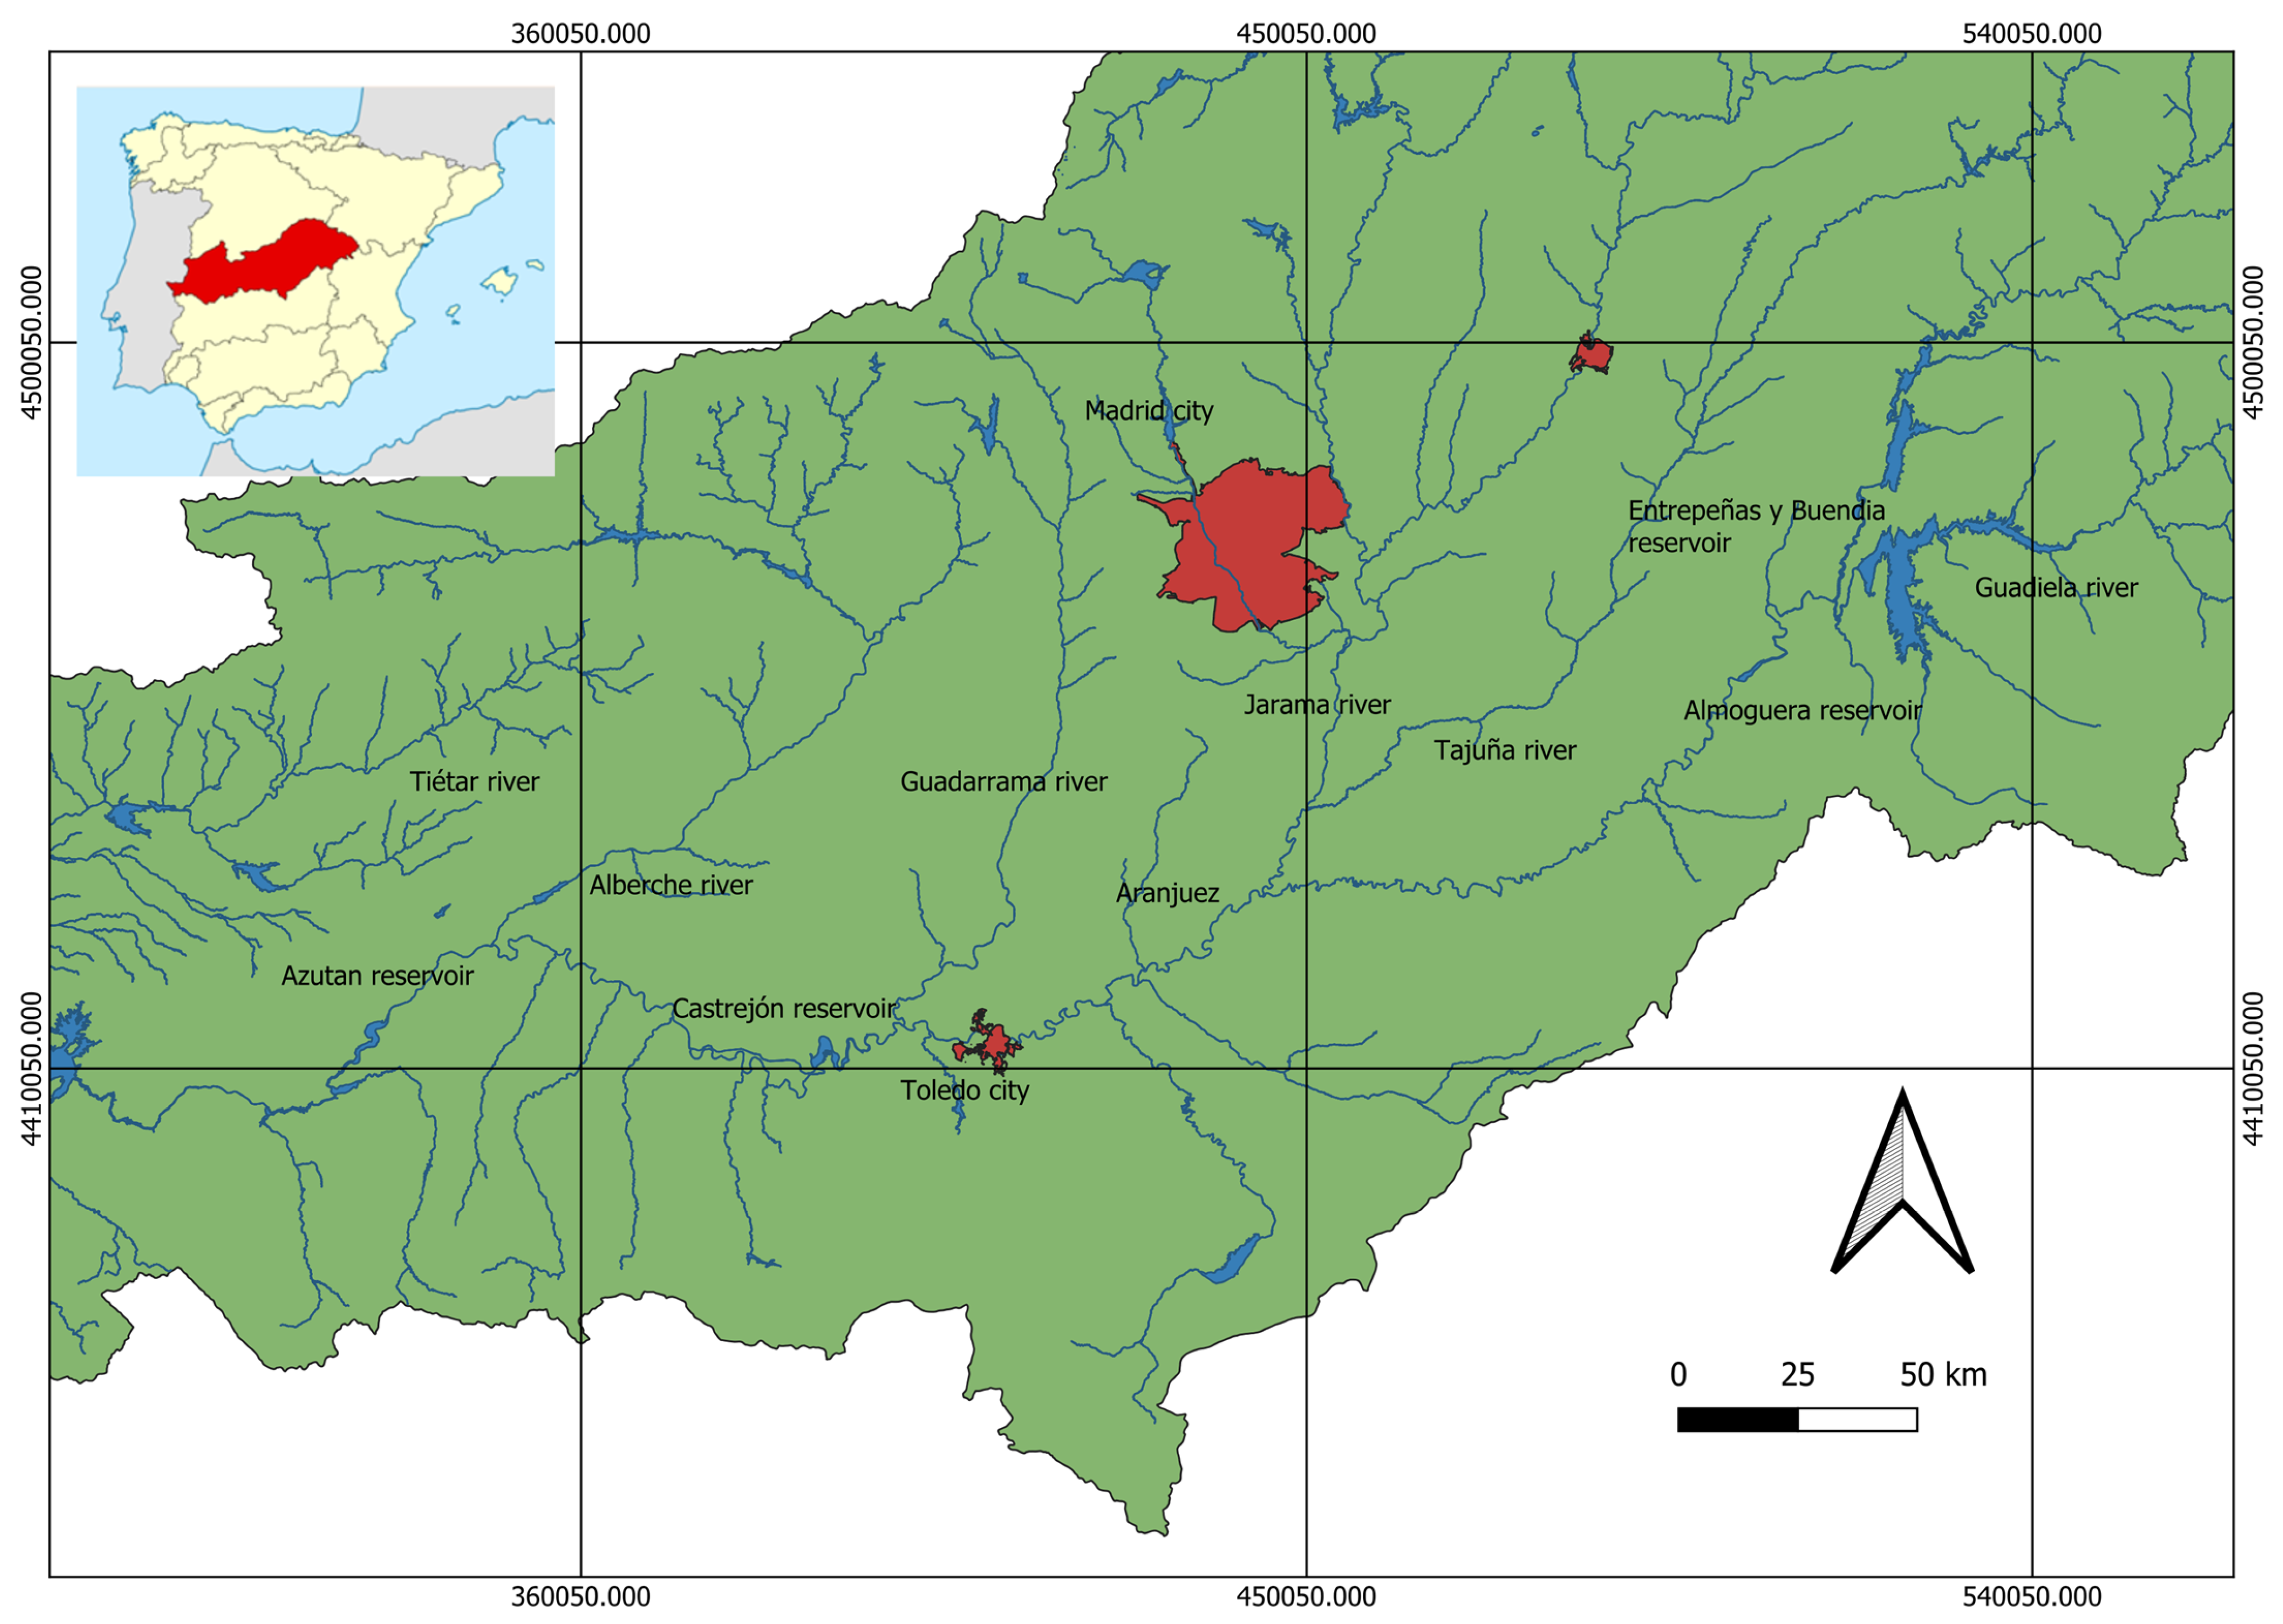
The work conducted on the Tagus River (Figure 1) highlights the importance of understanding and addressing hydrological alterations to achieve successful restoration outcomes. By adopting a more targeted, evidence-based approach, we can improve the ecological status of the river and better support biodiversity and ecosystem services in the future.
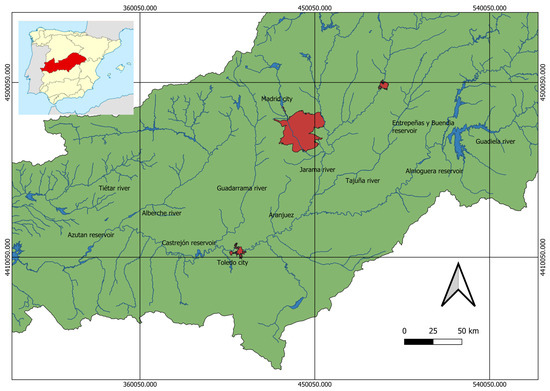
Figure 1.
Location of the study area in the Tagus basin (Red are cities, blues are reservoirs and rivers).
2. Materials and Methods
This study was conducted in the central region of the Tagus River basin. The principal characteristics and most critical challenges of the basin are outlined in the following section. Hydrological alteration is assessed across thirteen River-Type Water Bodies.
2.1. Study Area
The Tagus River is the longest river on the Iberian Peninsula, flowing through both Spain and Portugal. Its basin is home to more than ten million inhabitants. This study focuses on the middle section of the river, specifically between the Zorita and Azután reservoirs (Figure 1). Spain generally experiences lower rainfall compared to other European countries. Precipitation in the Tagus basin is slightly below the national average (590 mm), and runoff is similarly modest (150 mm). A notable feature of the basin is that approximately eight million people reside within the Spanish portion, the majority (over six million) of whom live in the Madrid region (MITECO, 2018; MITECO, 2019), making it the most densely populated river basin in Spain. Water extraction is dominated by agricultural use (70%), followed by urban supply (27%). Several stressors compromise the sustainability of the Tagus River, including the Tagus-Segura Water Transfer, wastewater discharges from Madrid, a series of dams along the middle course, and a lack of fluvial dynamics. The upper course is primarily impacted by the water transfer, while the middle course experiences compounded pressures from both the transfer and urban effluents.
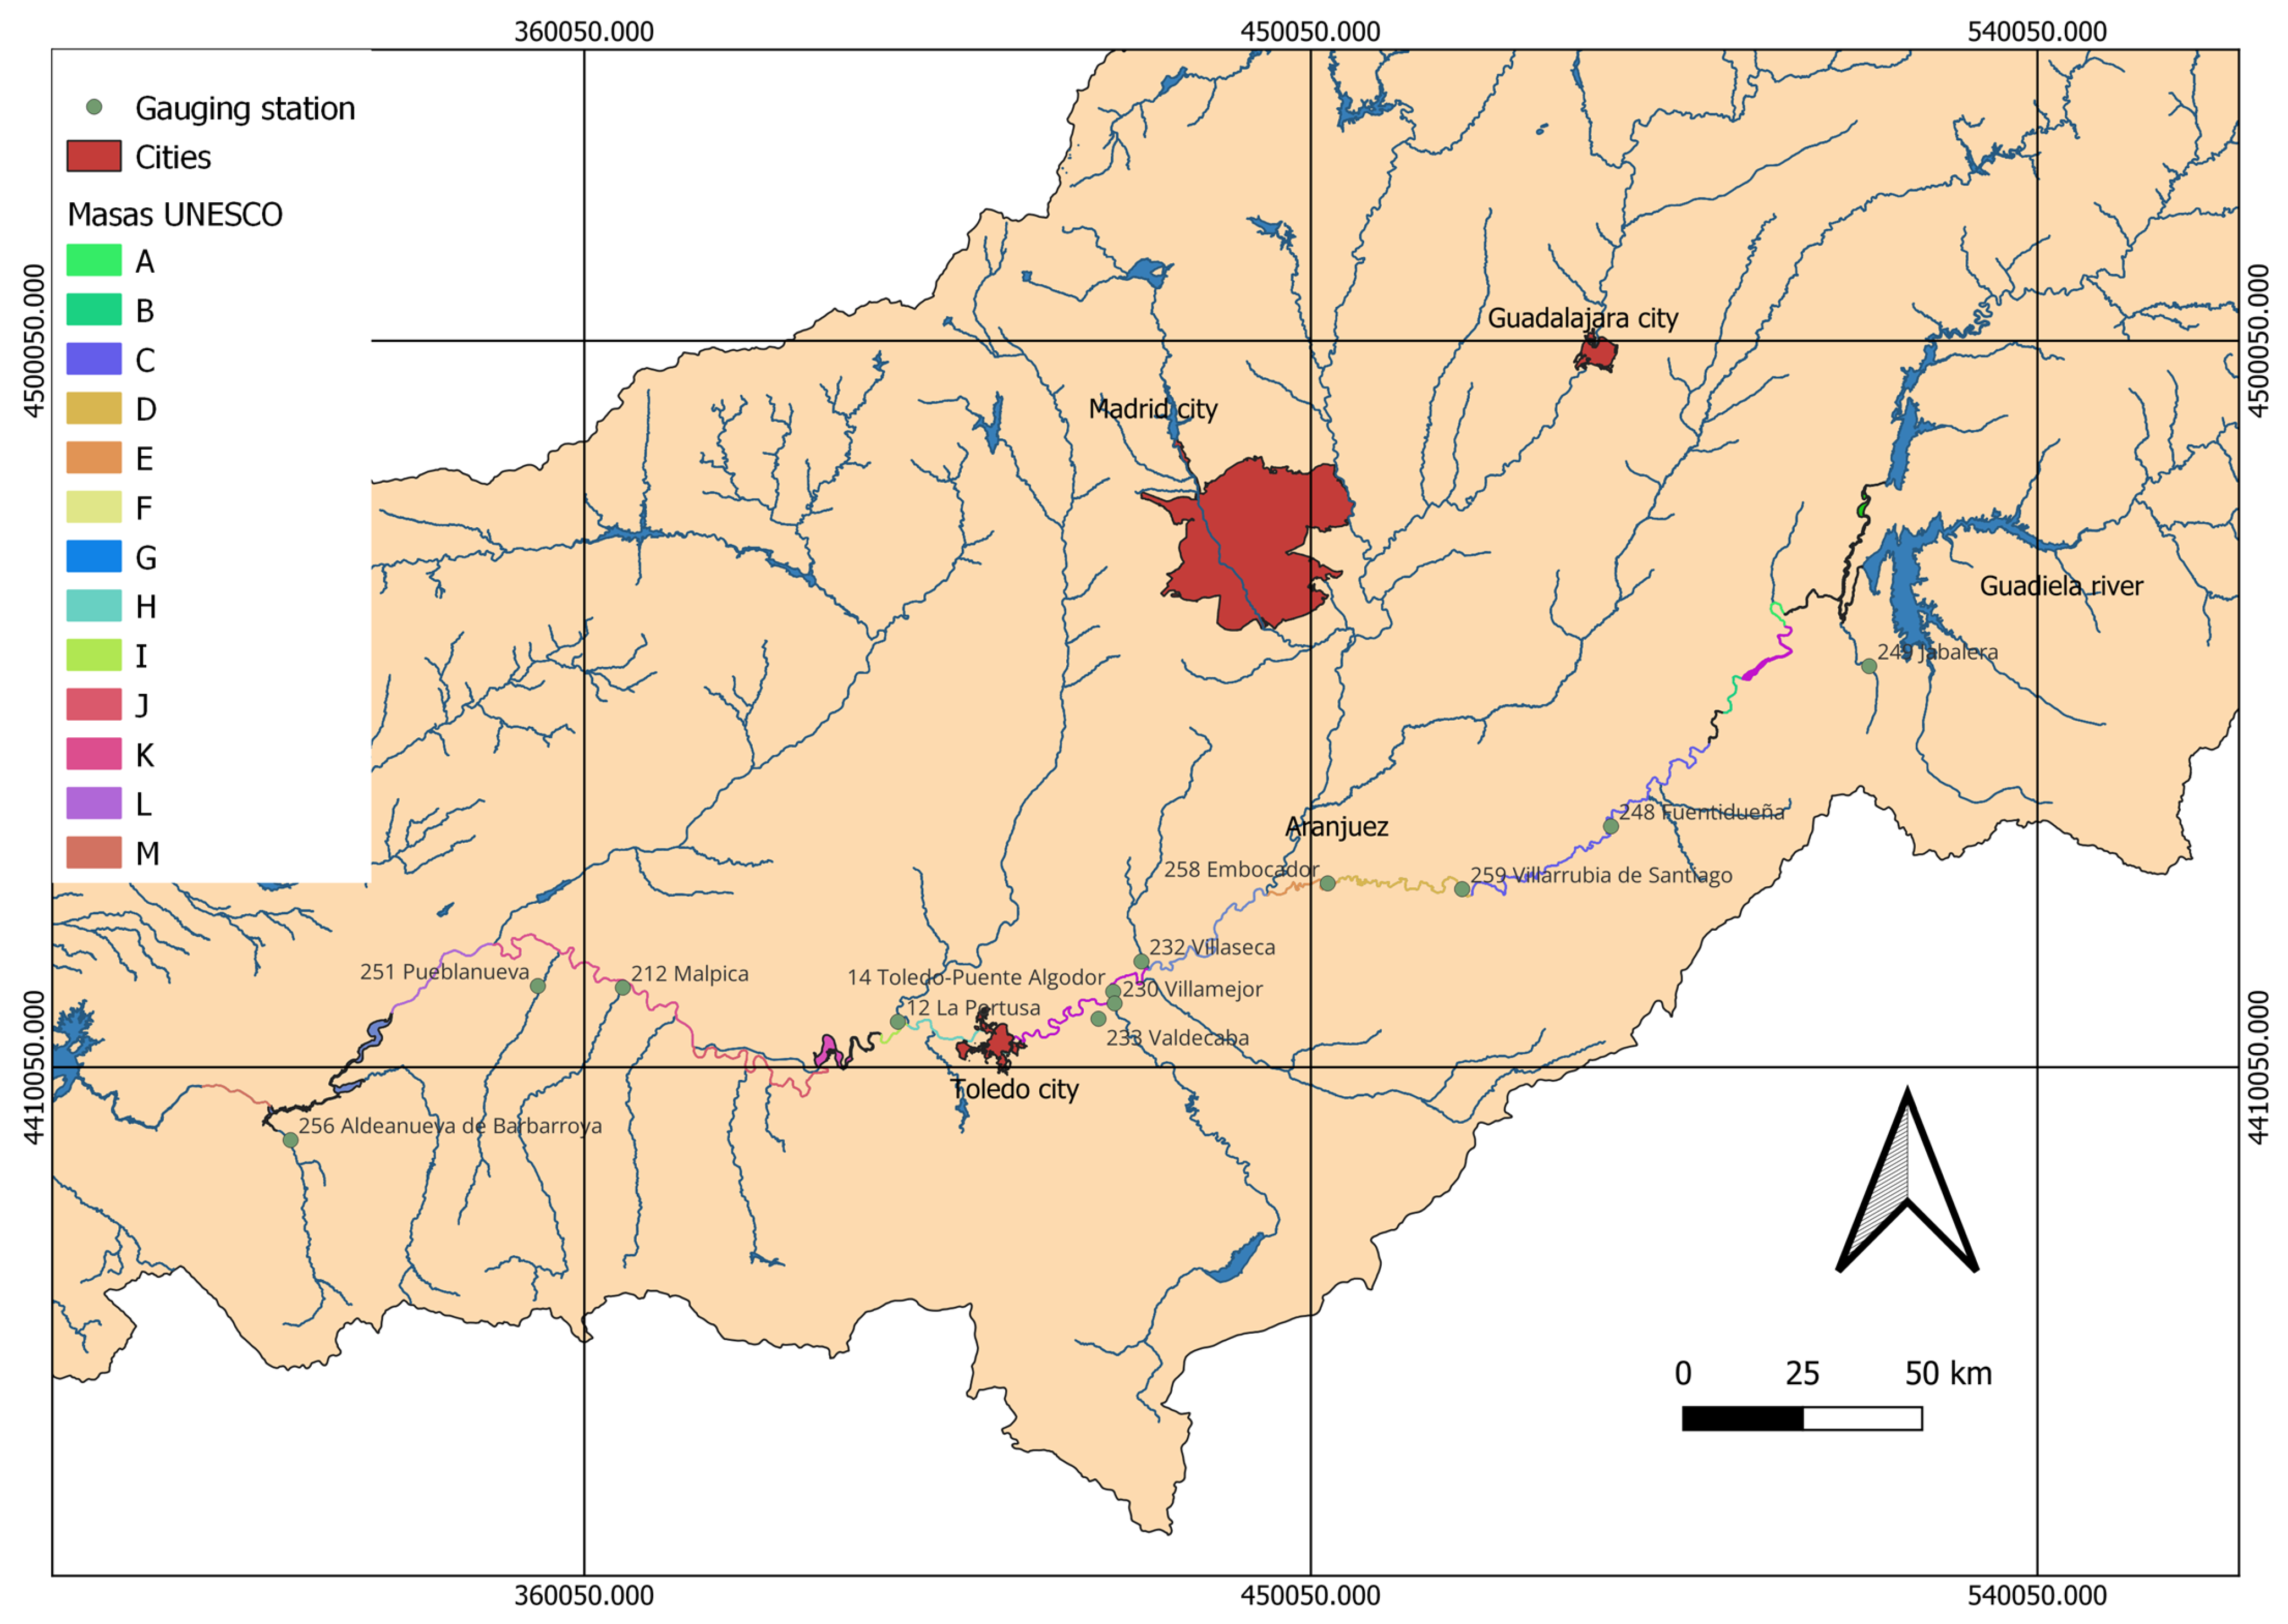
This study targets thirteen sections within the river’s middle course (Figure 2).
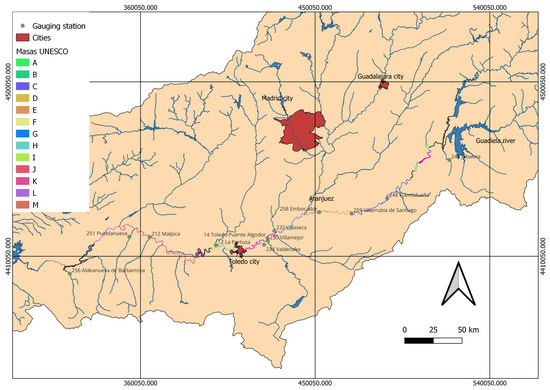
Figure 2.
Map Tagus basin area where the work is being carried out with the water bodies localization. A, Tagus River from Zorita Reservoir to Almoguera Reservoir; B, Tagus River from Almoguera Reservoir to Estremera Reservoir; C, Tagus River from Estremera Reservoir hasta Arroyo del Álamo river; D, Tagus River from Arroyo del Álamo river to Embocador; E, Tagus River from in Aranjuez; F, Tagus River from the Jarama River to the confluence with Arroyo de Guatén; G, Tagus River from the confluence with Arroyo de Guatén to Toledo; H, River Tagus in Toledo to the confluence of the River Guadarrama; I, Tagus River from Guadarrama River to Castrejón Reservoir; J, River Tagus downstream of the Castrejón Reservoir; K, Tagus River at the confluence with the Alberche River; L, Tagus River from Alberche River to the tail of Azután reservoir; M, River Tagus from Azután reservoir to Valdecañas reservoir.
2.2. Procedure for Studying Hydrological Alteration and Its Correction
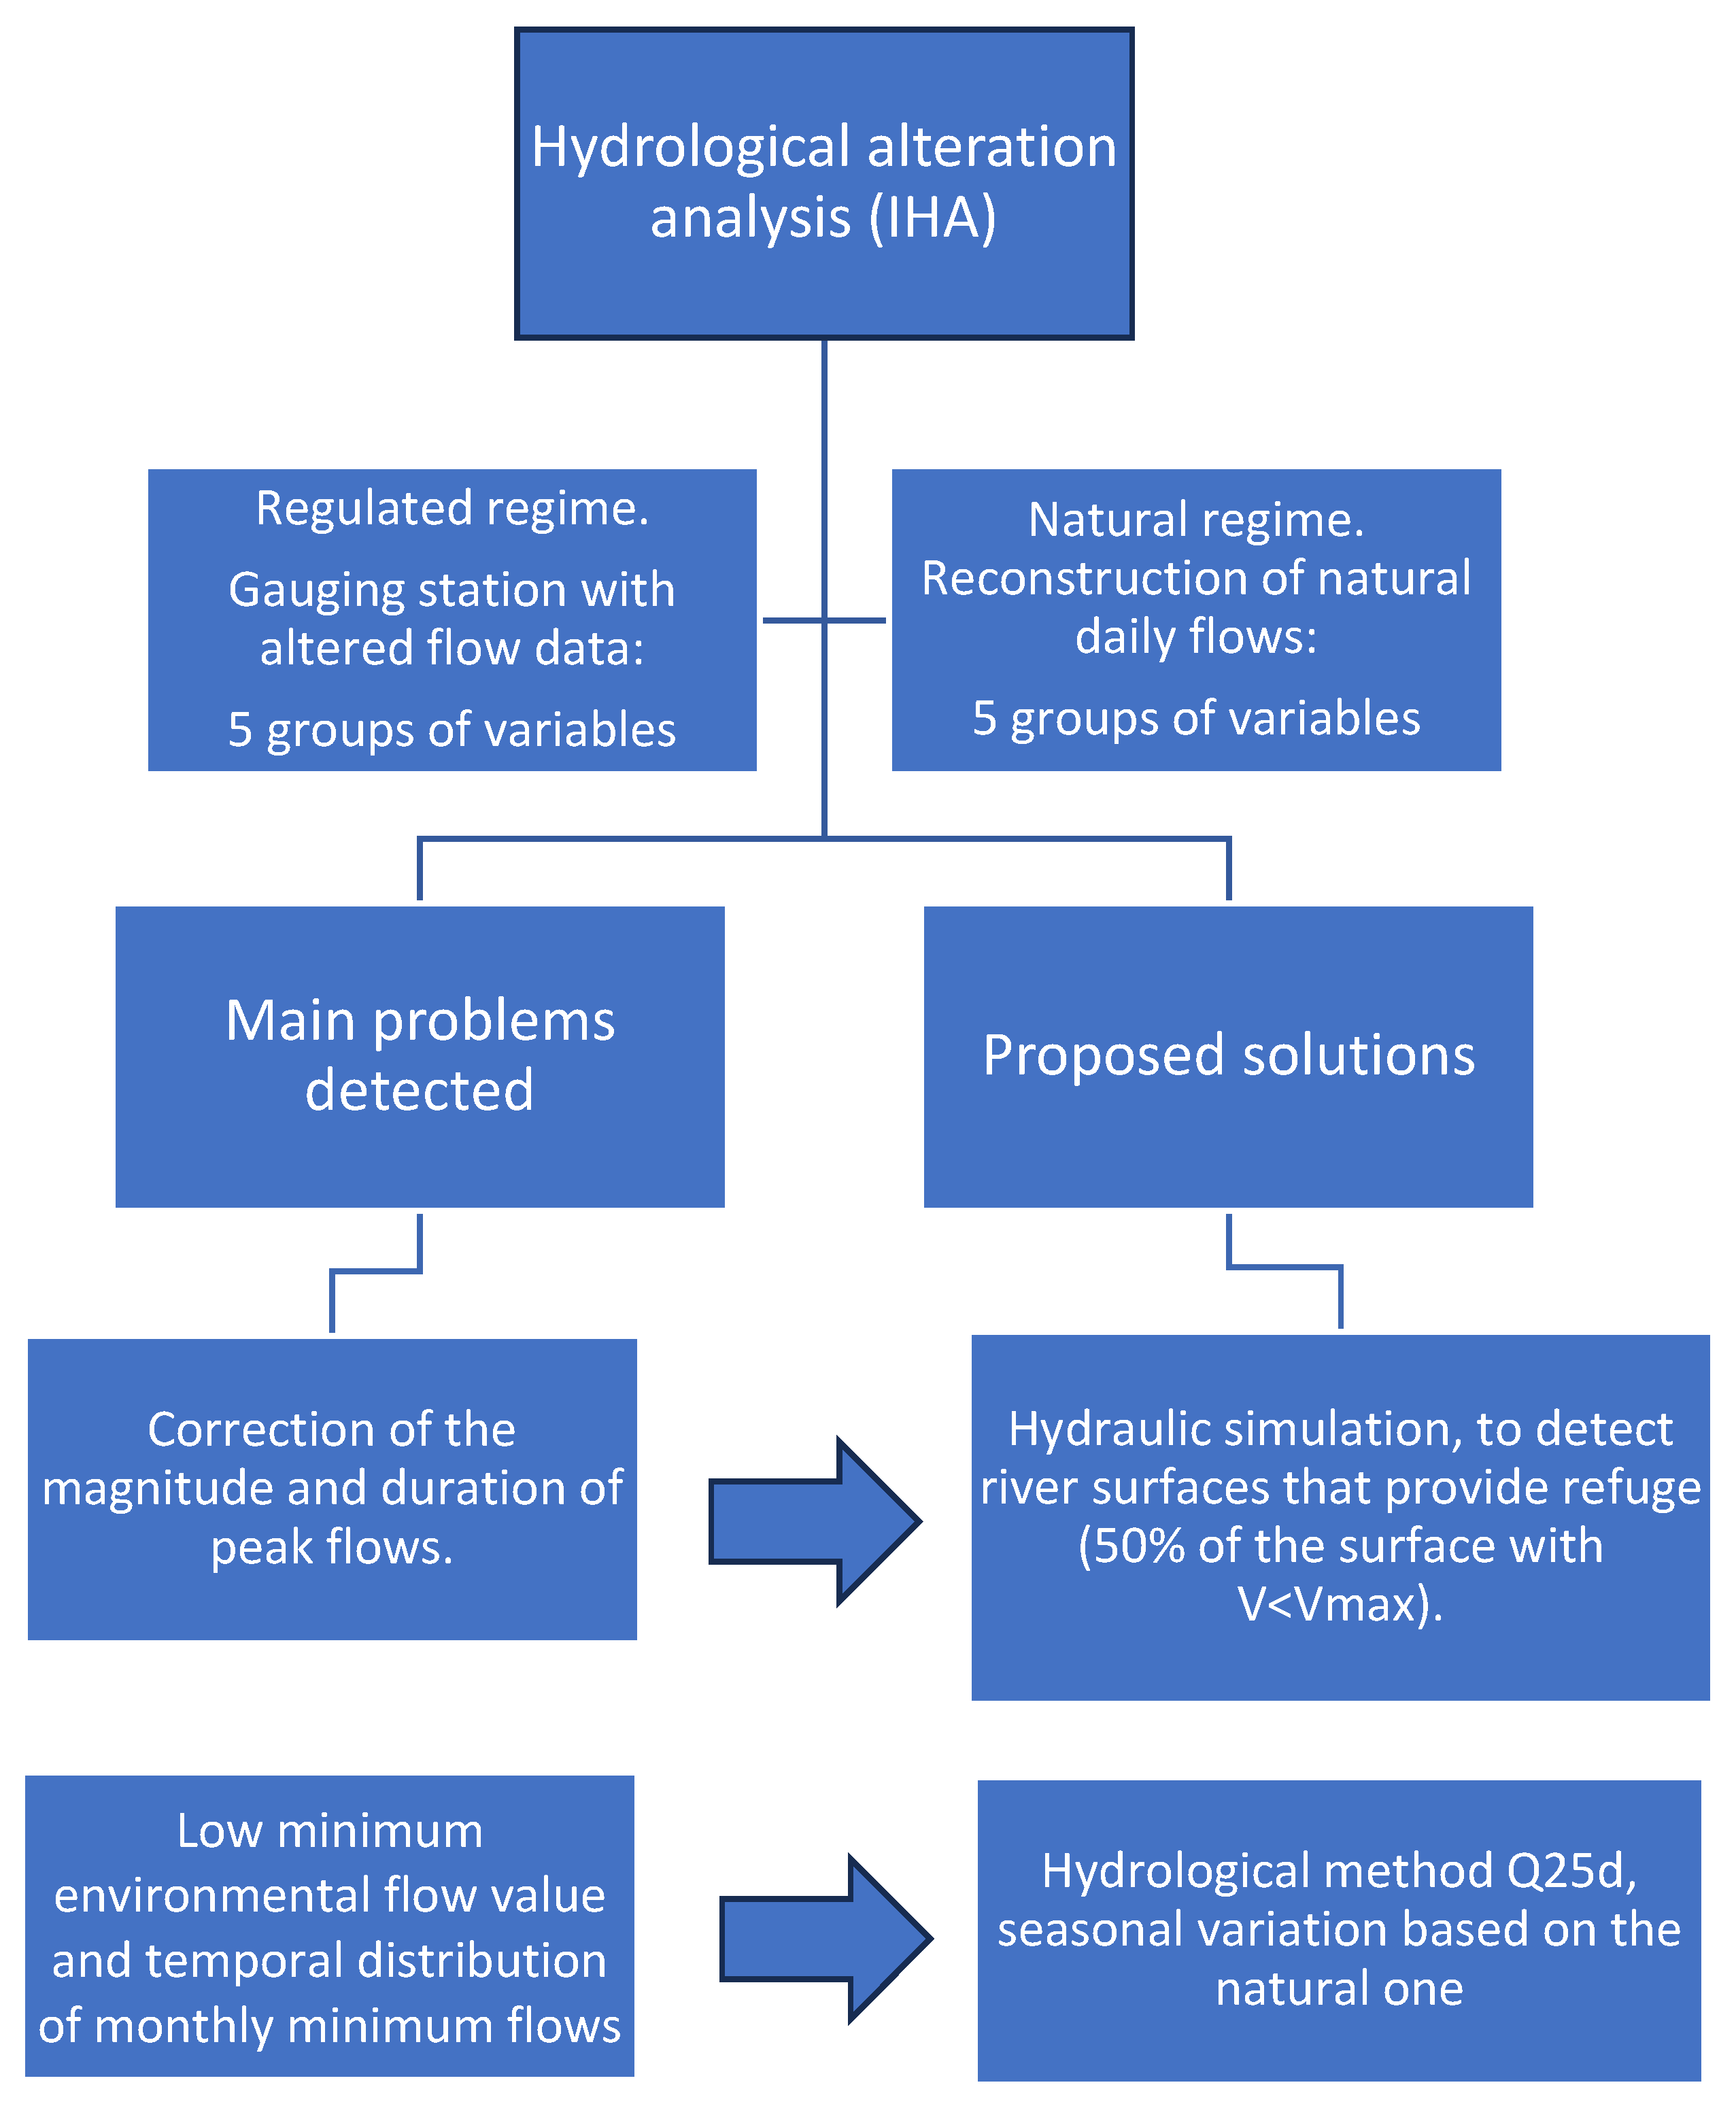
The methodology is divided into two main components: quantifying hydrological alteration and identifying solutions to mitigate it. Accordingly, this section is structured into three parts. The first describes the method used to quantify hydrological alteration, while the second and third present two mitigation strategies (Figure 3).
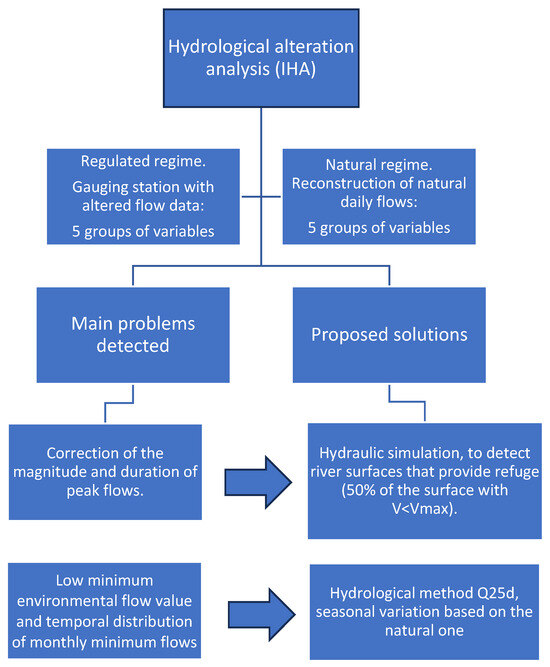
Figure 3.
The procedure followed for the work is outlined in the flowchart: initially, the hydrological alteration was studied (IHA), comparing data on natural and regulated flows. Following the identification of the two principal alterations, a procedure was established to determine an environmental flow regime and to limit maximum summer flows.
The methodology consists of three stages:
- Hydrological characterization of the river sections using relevant hydrological variables.
- Assessment of hydrological alteration across these sections and classification of similar patterns to facilitate grouping.
- Proposal of hydrological restoration measures tailored to the predominant alterations observed in each group of water bodies.
2.2.1. Determination of the Characteristics of the Flow Regimes to Be Compared
Hydrological alteration was assessed in thirteen River-Type Water Bodies (Figure 2). The method employed, the Indicators of Hydrologic Alteration (IHA) [11], systematically evaluates changes in flow regimes by comparing time series of unimpacted (reference) and impacted conditions at the same site. The IHA includes 32 indicators reflecting the magnitude, duration, and frequency of both normal and extreme flow events [1]. For each indicator, both the mean and the coefficient of variation are calculated, producing 64 annual statistical values. The method follows the approach of Black et al. [10].
The application of this method requires the following:
- Daily series of a long period [typically 20 years] of natural flows.
- Equivalent long-term flow series under altered regimes.
To derive natural flow data, two approaches are used, depending on data availability:
- (a)
- If a gauging station within the water body has historical data that closely resembles natural conditions, then its daily data are used—provided upstream abstraction is minimal.
- (b)
- Where such stations are lacking, natural flow data are reconstructed by combining
- (1)
- outputs from a hydrological model and (2) daily data from a reference station within the same hydrological region of the Tagus River. This station provides daily data that is close to the natural.
In this study, only two gauging stations provided data considered representative of natural conditions: the Aranjuez station (code 3011), with historical data from periods of low usage, and the Trillo station (code 3005), located slightly upstream of the study area. For water bodies without natural flow records, the SIMPA (Integrated Precipitation-Input Modeling System) hydrological model [23] was used to estimate monthly natural flows.
The SIMPA model, developed by CEDEX [24,25], is a conceptual, quasi-distributed model simulating the transformation of precipitation into runoff under natural conditions. It operates on a monthly scale across a grid of the basin territory. The monthly flow outputs used in this study were sourced from official planning documents issued by the River Basin Authority.
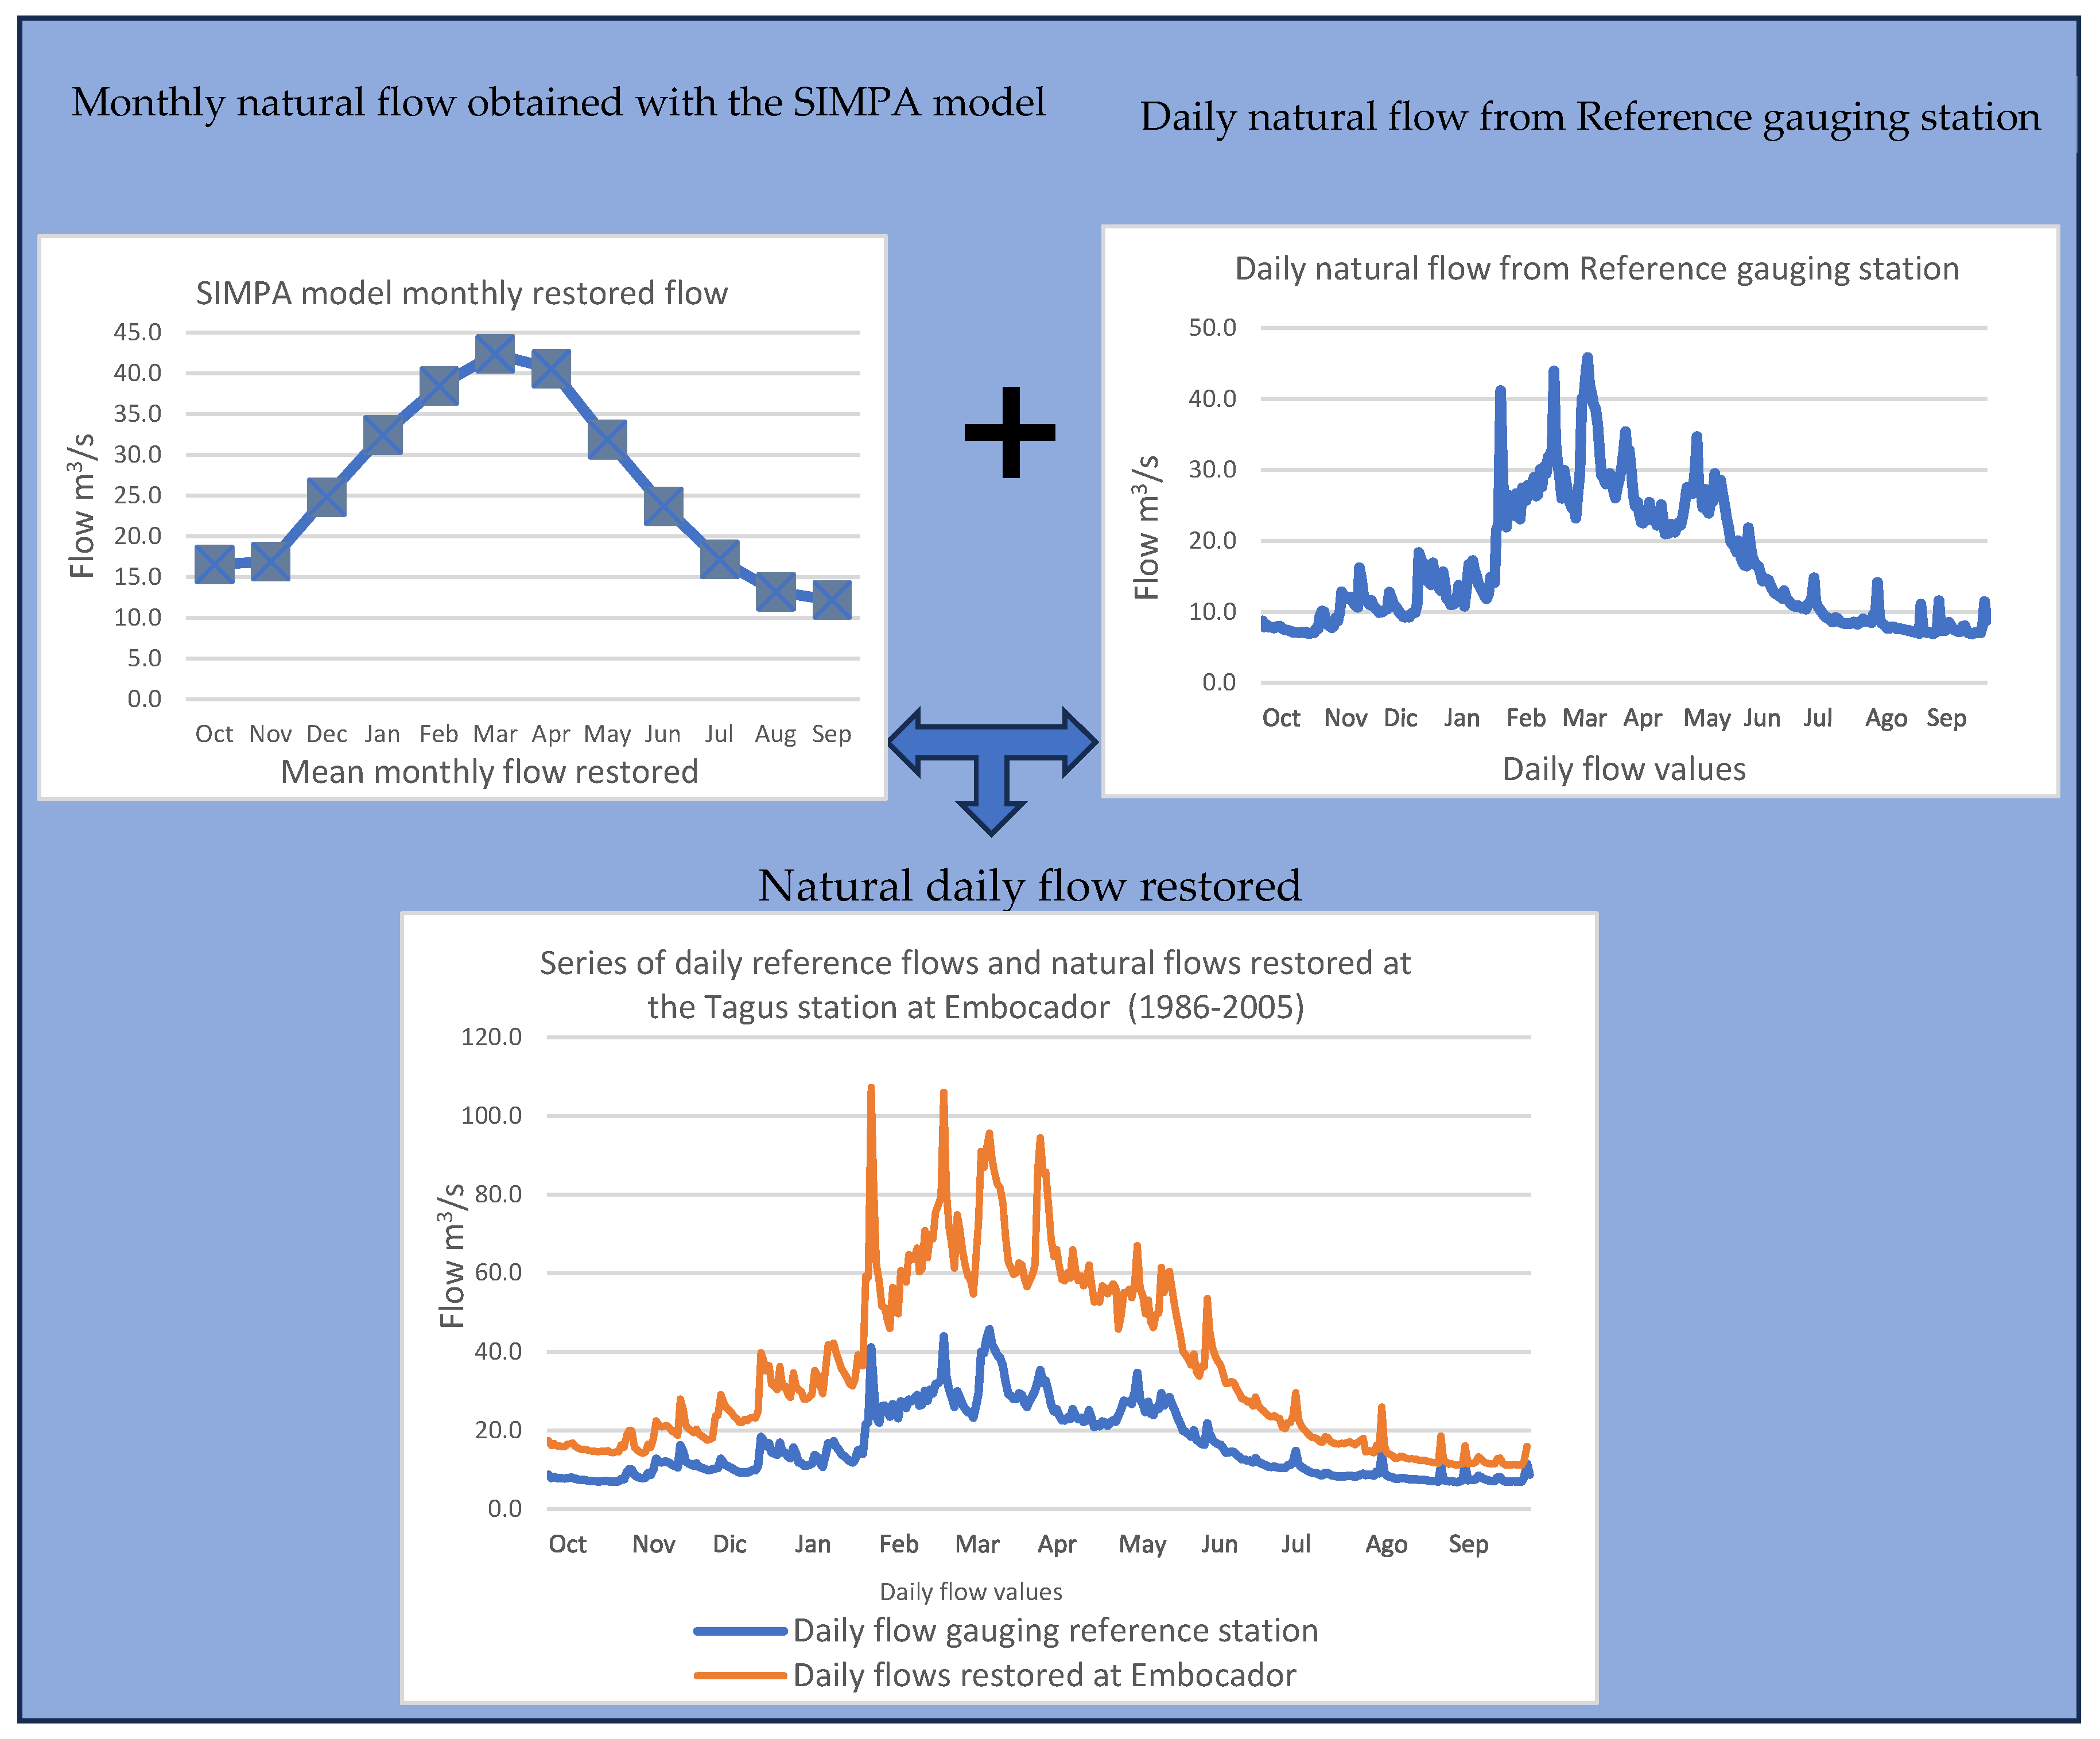
Monthly data were converted to daily flow series following procedures outlined in the Hydrological Planning Instruction (HPI) [26] and the Ministry’s Guide to Environmental Flows [27]. This involved two steps (Figure 4):
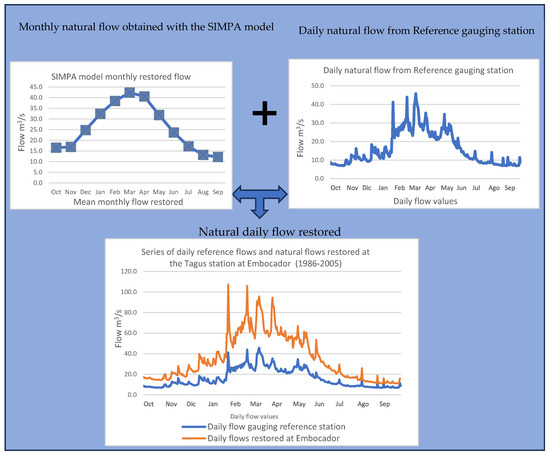
Figure 4.
Example of the construction of the daily natural flow restored from the SIMPA (Integrated Precipitation-Input Modeling System) monthly natural flow and the daily flow from the selected reference gauging.
- (a)
- Calculation of natural daily variation indices for each month by dividing each day’s flow by the average monthly flow, producing 28–31 indices per month.
- (b)
- Multiplication of the modeled average monthly flow by these indices to reconstruct daily flows approximating the natural regime.
2.2.2. Hydrological Alteration Study
To evaluate hydrological alteration in each water body, representative long-term flow series under altered regimes were obtained—preferably covering the period from 1998–1999 to 2017–2018. These data were sourced from dam outlets or gauging stations.
The CEDEX Hydrographic Studies Centre has delineated hydro-regions, facilitating the grouping of river reaches and selection of reference gauging stations within the same hydro-region as the study water bodies [28]. The 32 IHA indicators were computed for both natural and altered regimes. These metrics, categorized into five groups, enable comprehensive assessment of hydrological alteration (Table 1).

Table 1.
Groups of disturbance types into which the hydrological disturbance metrics are classified.
Hydrological alteration was assessed using the DHRAM application [10], which calculates the 32 metrics under both natural and altered conditions. Differences in mean values and coefficients of variation are quantified. Depending on the magnitude of these differences, a penalty score between 1 and 3 is assigned. The cumulative penalty determines the classification of disturbance into five severity levels (Table 2).

Table 2.
Ranges of hydrologic alteration and classification.
2.3. Assessment of Alterations and Proposed Solutions
After determining the total and categorized alteration levels across the thirteen water bodies, spatial trends along the river were analyzed. This enabled the identification of recurring alteration patterns. For the two predominant alteration types, specific restoration responses were formulated. The proposed measures include one or more of the following environmental flow regime components:
- A minimum environmental flow value
- A temporally distributed series of monthly minimum flows.
- Maximum flow magnitude and duration
2.3.1. Calculation of Minimum Flows
One of the tools usually used to correct the flow deviations in the low water months with respect to the natural ones is the establishment of a minimum environmental flow [29,30]; in this work, we have considered proposing minimum environmental flows when one of the main causes of the hydrological alteration has been the reduction of flows magnitude. When low flow magnitude was identified as one of the main alterations, environmental minimum flows were proposed. The Q25 method—based on the 25-day minimum average flow—was used to define these thresholds. This method, widely applied and validated in the Tagus basin [31,32], correlates with local habitat availability, geological characteristics, and natural flow patterns at different river points [33].
2.3.2. Temporal Distribution of Monthly Minimum Flows
The second tool is to provide a temporal distribution of monthly environmental flows. It should be noted that the natural variability of monthly flows is important for the phenology of some aquatic species, as indicators of different life stages, migration, reproduction, etc., for which it is common to harmonize the monthly changes in a similar way as the flow would change naturally. In this project, we have used the average monthly regime of the monthly flow series, obtained from the SIMPA model, as a pattern, and we have constructed the pattern of monthly variation of all the months with respect to the minimum monthly value.
In the strategy we have applied, we need
- -
- A minimum environmental flow value, usually applied to the driest month of the year;
- -
- Twelve monthly indices that allow us to vary the monthly flows in the same way as the natural regime.
The monthly indices have been calculated using the method defined by Alcazar y Palau. [34], where the index is the square root of the value of each month divided by the minimum annual monthly flow [Equation (1)].
where
is the distribution index for ‘x’ month;
is the average monthly flow of ‘x’ month;
is the average monthly flow of the month with the natural lowest flow.
The minimum environmental flow is applied to the month with the lowest flow; the values for the remaining months are the result of multiplying each of the monthly indexes by the minimum flow.
2.3.3. Magnitude and Duration of Maximum Flow
A final measure addresses maximum flows—defined as flow levels that should not be exceeded for extended periods due to ecological risks [35,36,37]. The proposed values follow guidance from the Ministry’s Environmental Flows Guide [27]. These flows must maintain refuges for aquatic fauna, determined by hydraulic velocity thresholds. It is generally accepted that 50% of a stream’s surface must have velocities below the species’ critical threshold to qualify as refuge [38]. To establish this threshold for the barbel (Luciobarbus bocagei), the relevant literature on species-specific velocities and habitat preferences was reviewed [39,40,41].
Luciobarbus bocagei undertakes annual migrations during specific seasons, particularly from April to July, peaking in mid-May. Movements are predominantly upstream at night, reaching their peak in mid-May, towards higher areas of faster current and stony ground, tending to move downstream during the winter, aggregating in refuges during the summer where there is more tree cover and denser riparian vegetation. The spawning of this fish takes place between May and June. The flows during the summer months are of particular importance, as the spawning period means that the emergence of fry is at its peak at this time.
The maximum flow regime must be quantified using hydraulic models linked to the habitat models to ensure both adequate refuge for the most-sensitive stages or species and the maintenance of the connectivity of the reach.
Once the optimum and critical velocities of the target species had been established, the following steps were taken:
- -
- Carry out a hydraulic simulation in a representative section of the water body.
- -
- Plot the velocities obtained for each stream, defining the areas of the reach where the velocity is below the critical velocity.
- -
- Establish a relationship between the simulated flows and the area where the conditioning species finds refuge.
- -
- Select the maximum flow rate.
Simulations were performed using the River-2D software (0.95a (January 15, 2010 versión) [42]. Flow values simulated ranged from average to maximum monthly flows under natural conditions. Spatial analysis of velocity distributions justified the proposed maximum flow values.
3. Results
For each of the water bodies, a 20-year series of unmodified hydrological conditions was reconstructed from a reference gauge and the values of the monthly hydrological model used as a reference. A series of modified flows was also generated from the gauging or reservoir discharge data, using the most recent data available. Not all stations have 20 years of data; the analysis was carried out with the longest series of modified flows possible.
3.1. Analysis and Mitigation of Hydrologic Alteration
The mean values of the 32 variables and the CV of these variables have been calculated for each water body; these calculations have been made for the data of the natural regime and for the data series of the altered flow.
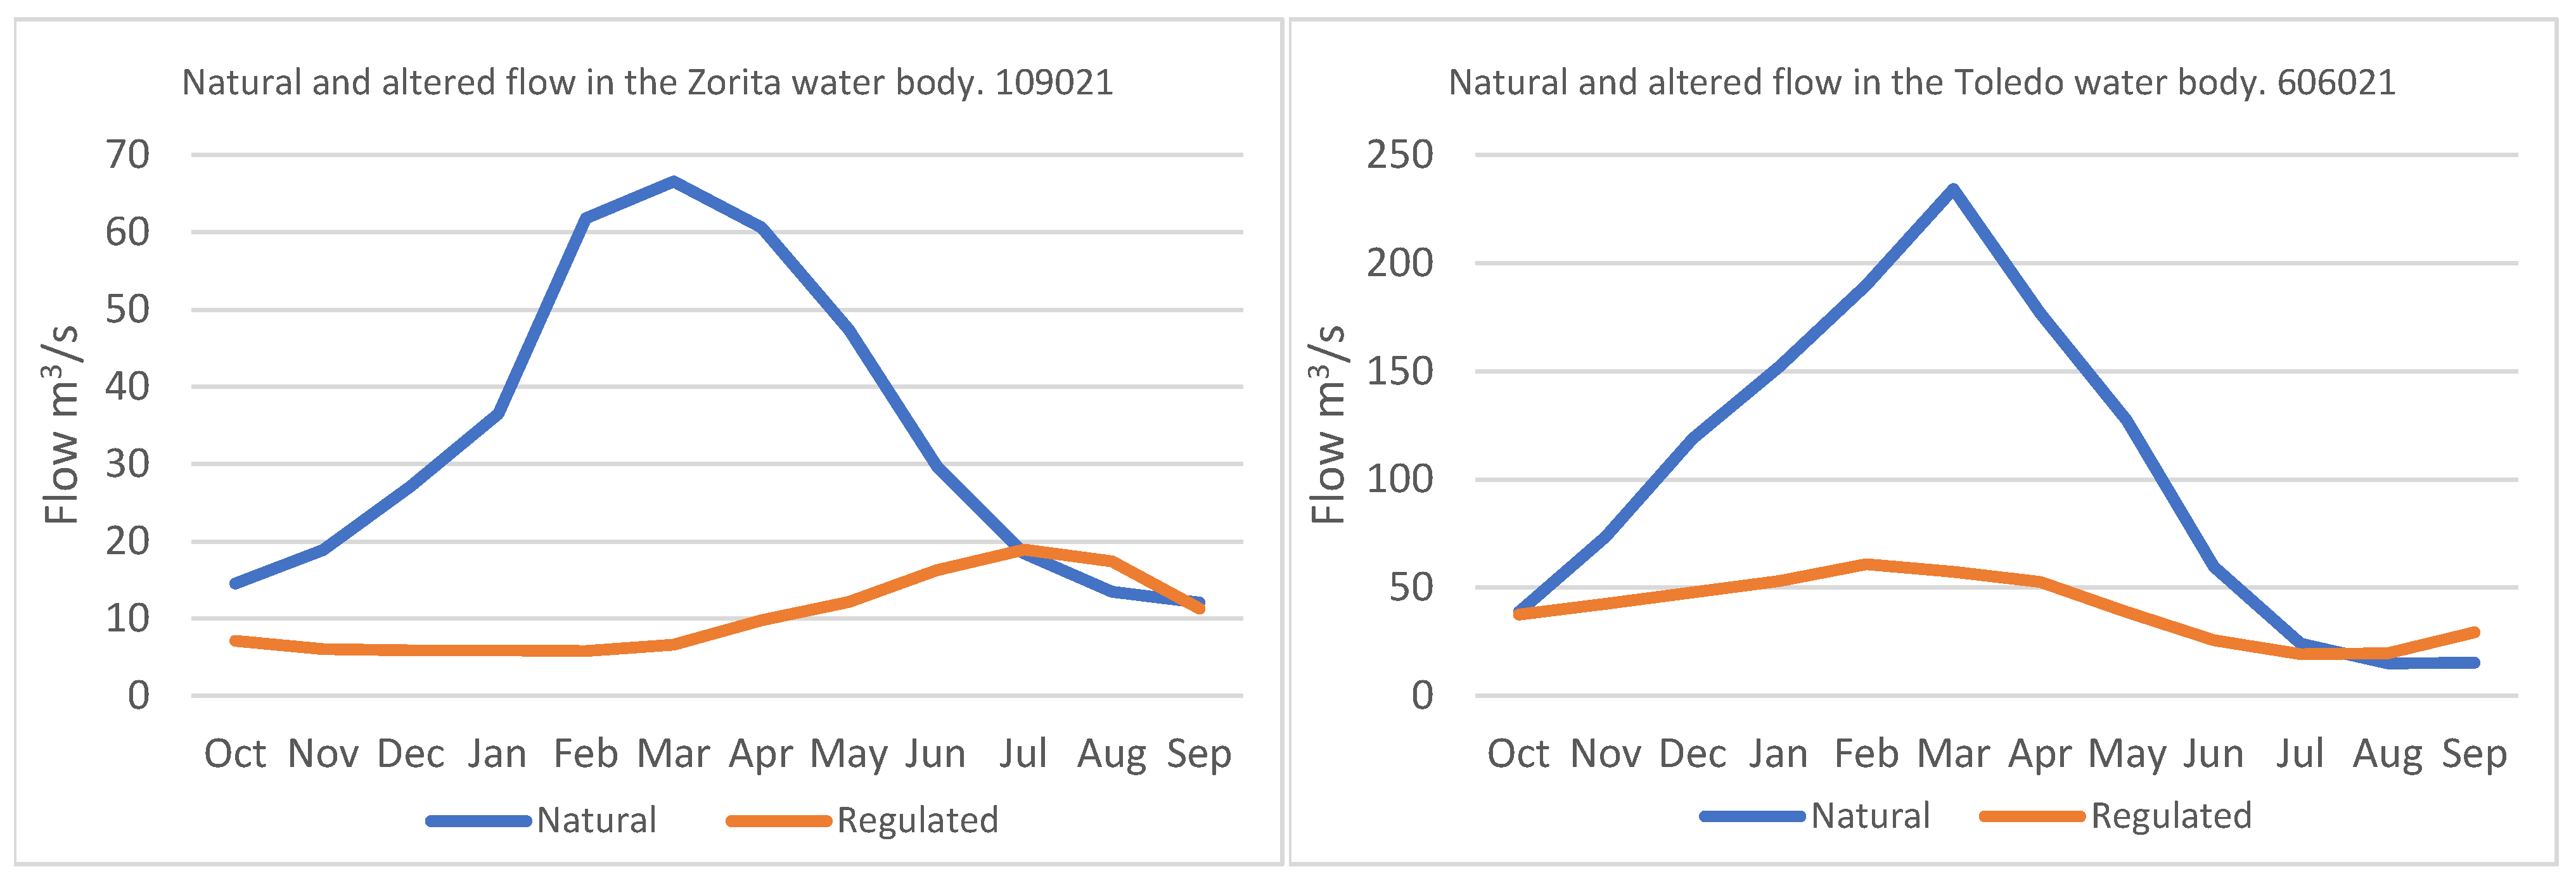
For these two series of data, the magnitude of variation of both the mean values and the coefficients of variation were compared. Figure 5 shows the values of the monthly mean flows of the two series, natural and altered, for two of the bodies, in which a difference altered regime and a different distribution of the alteration can be seen with respect to the natural regimes represented.
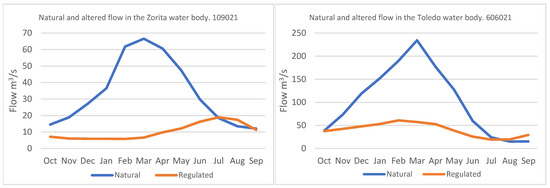
Figure 5.
Representation of the altered and natural monthly regime in the water bodies of the Tagus from Zorita reservoir to Almoguera reservoir, on the left, and the Tagus river in Toledo to Guadarrama river, on the right.
The identification, hydrological characteristics, alteration results and classification of hydrological alteration have been summarized in cards for each body, and the two groups with the greatest alteration in each water body have been highlighted.
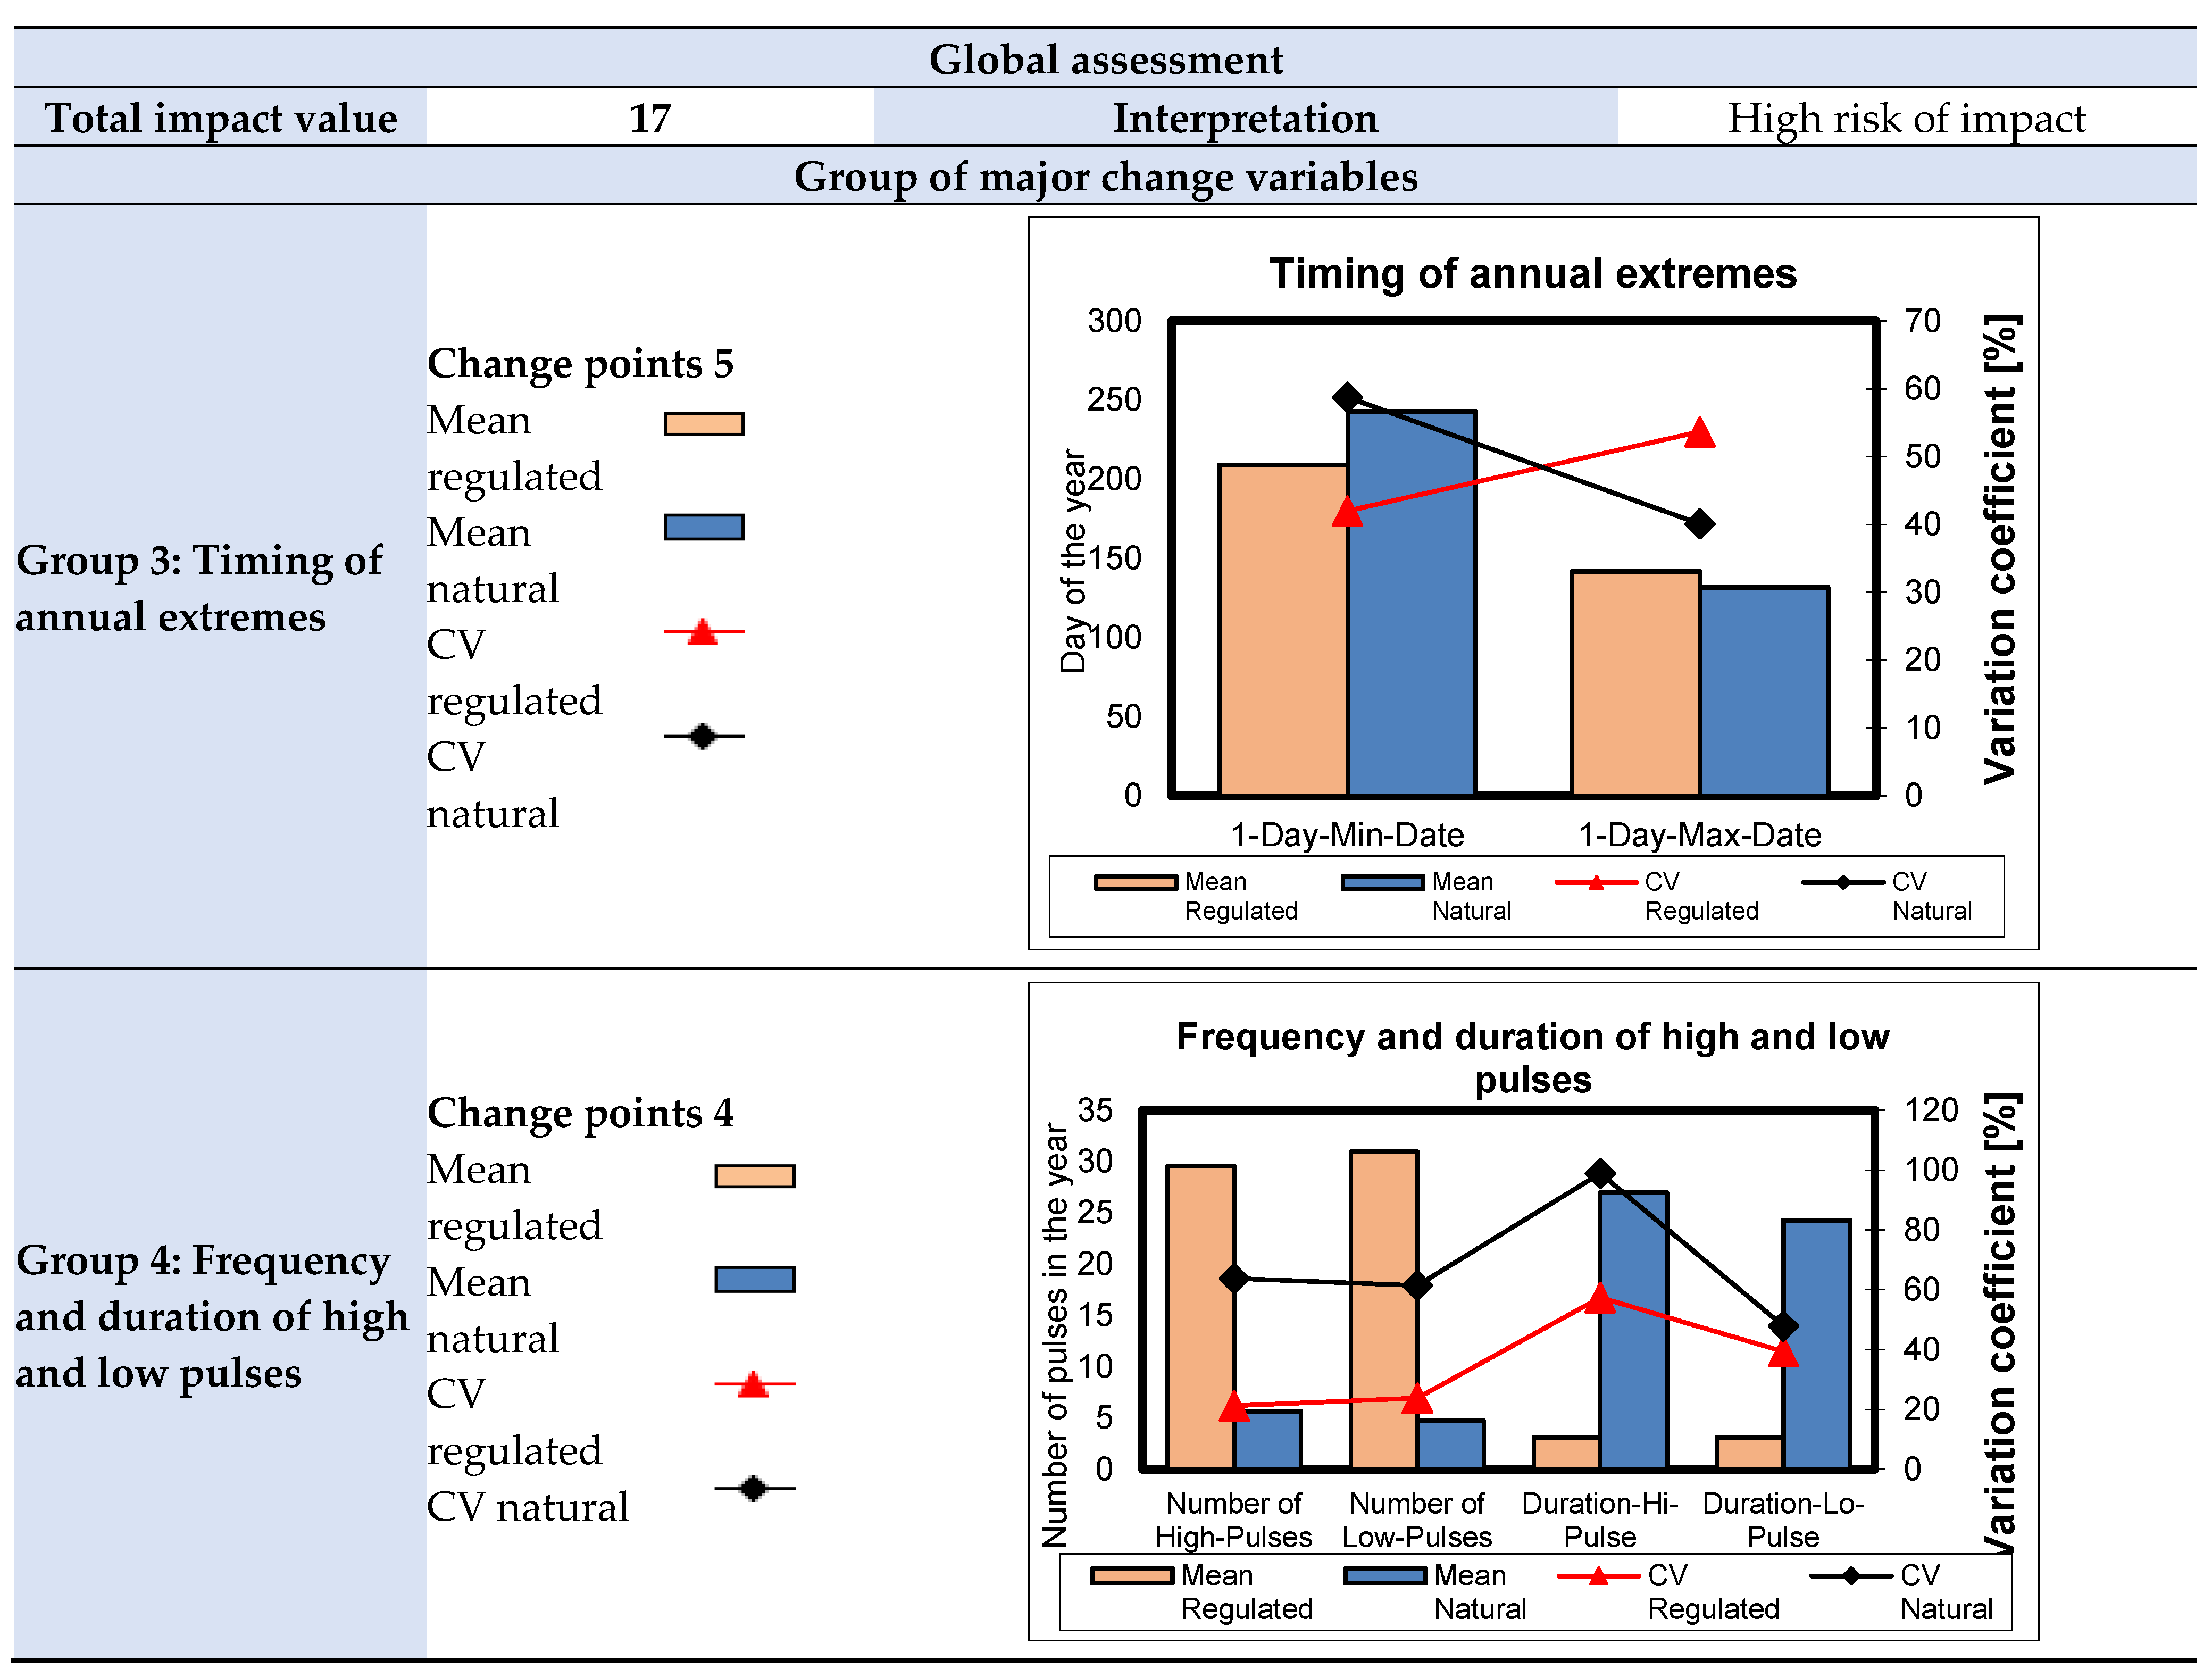
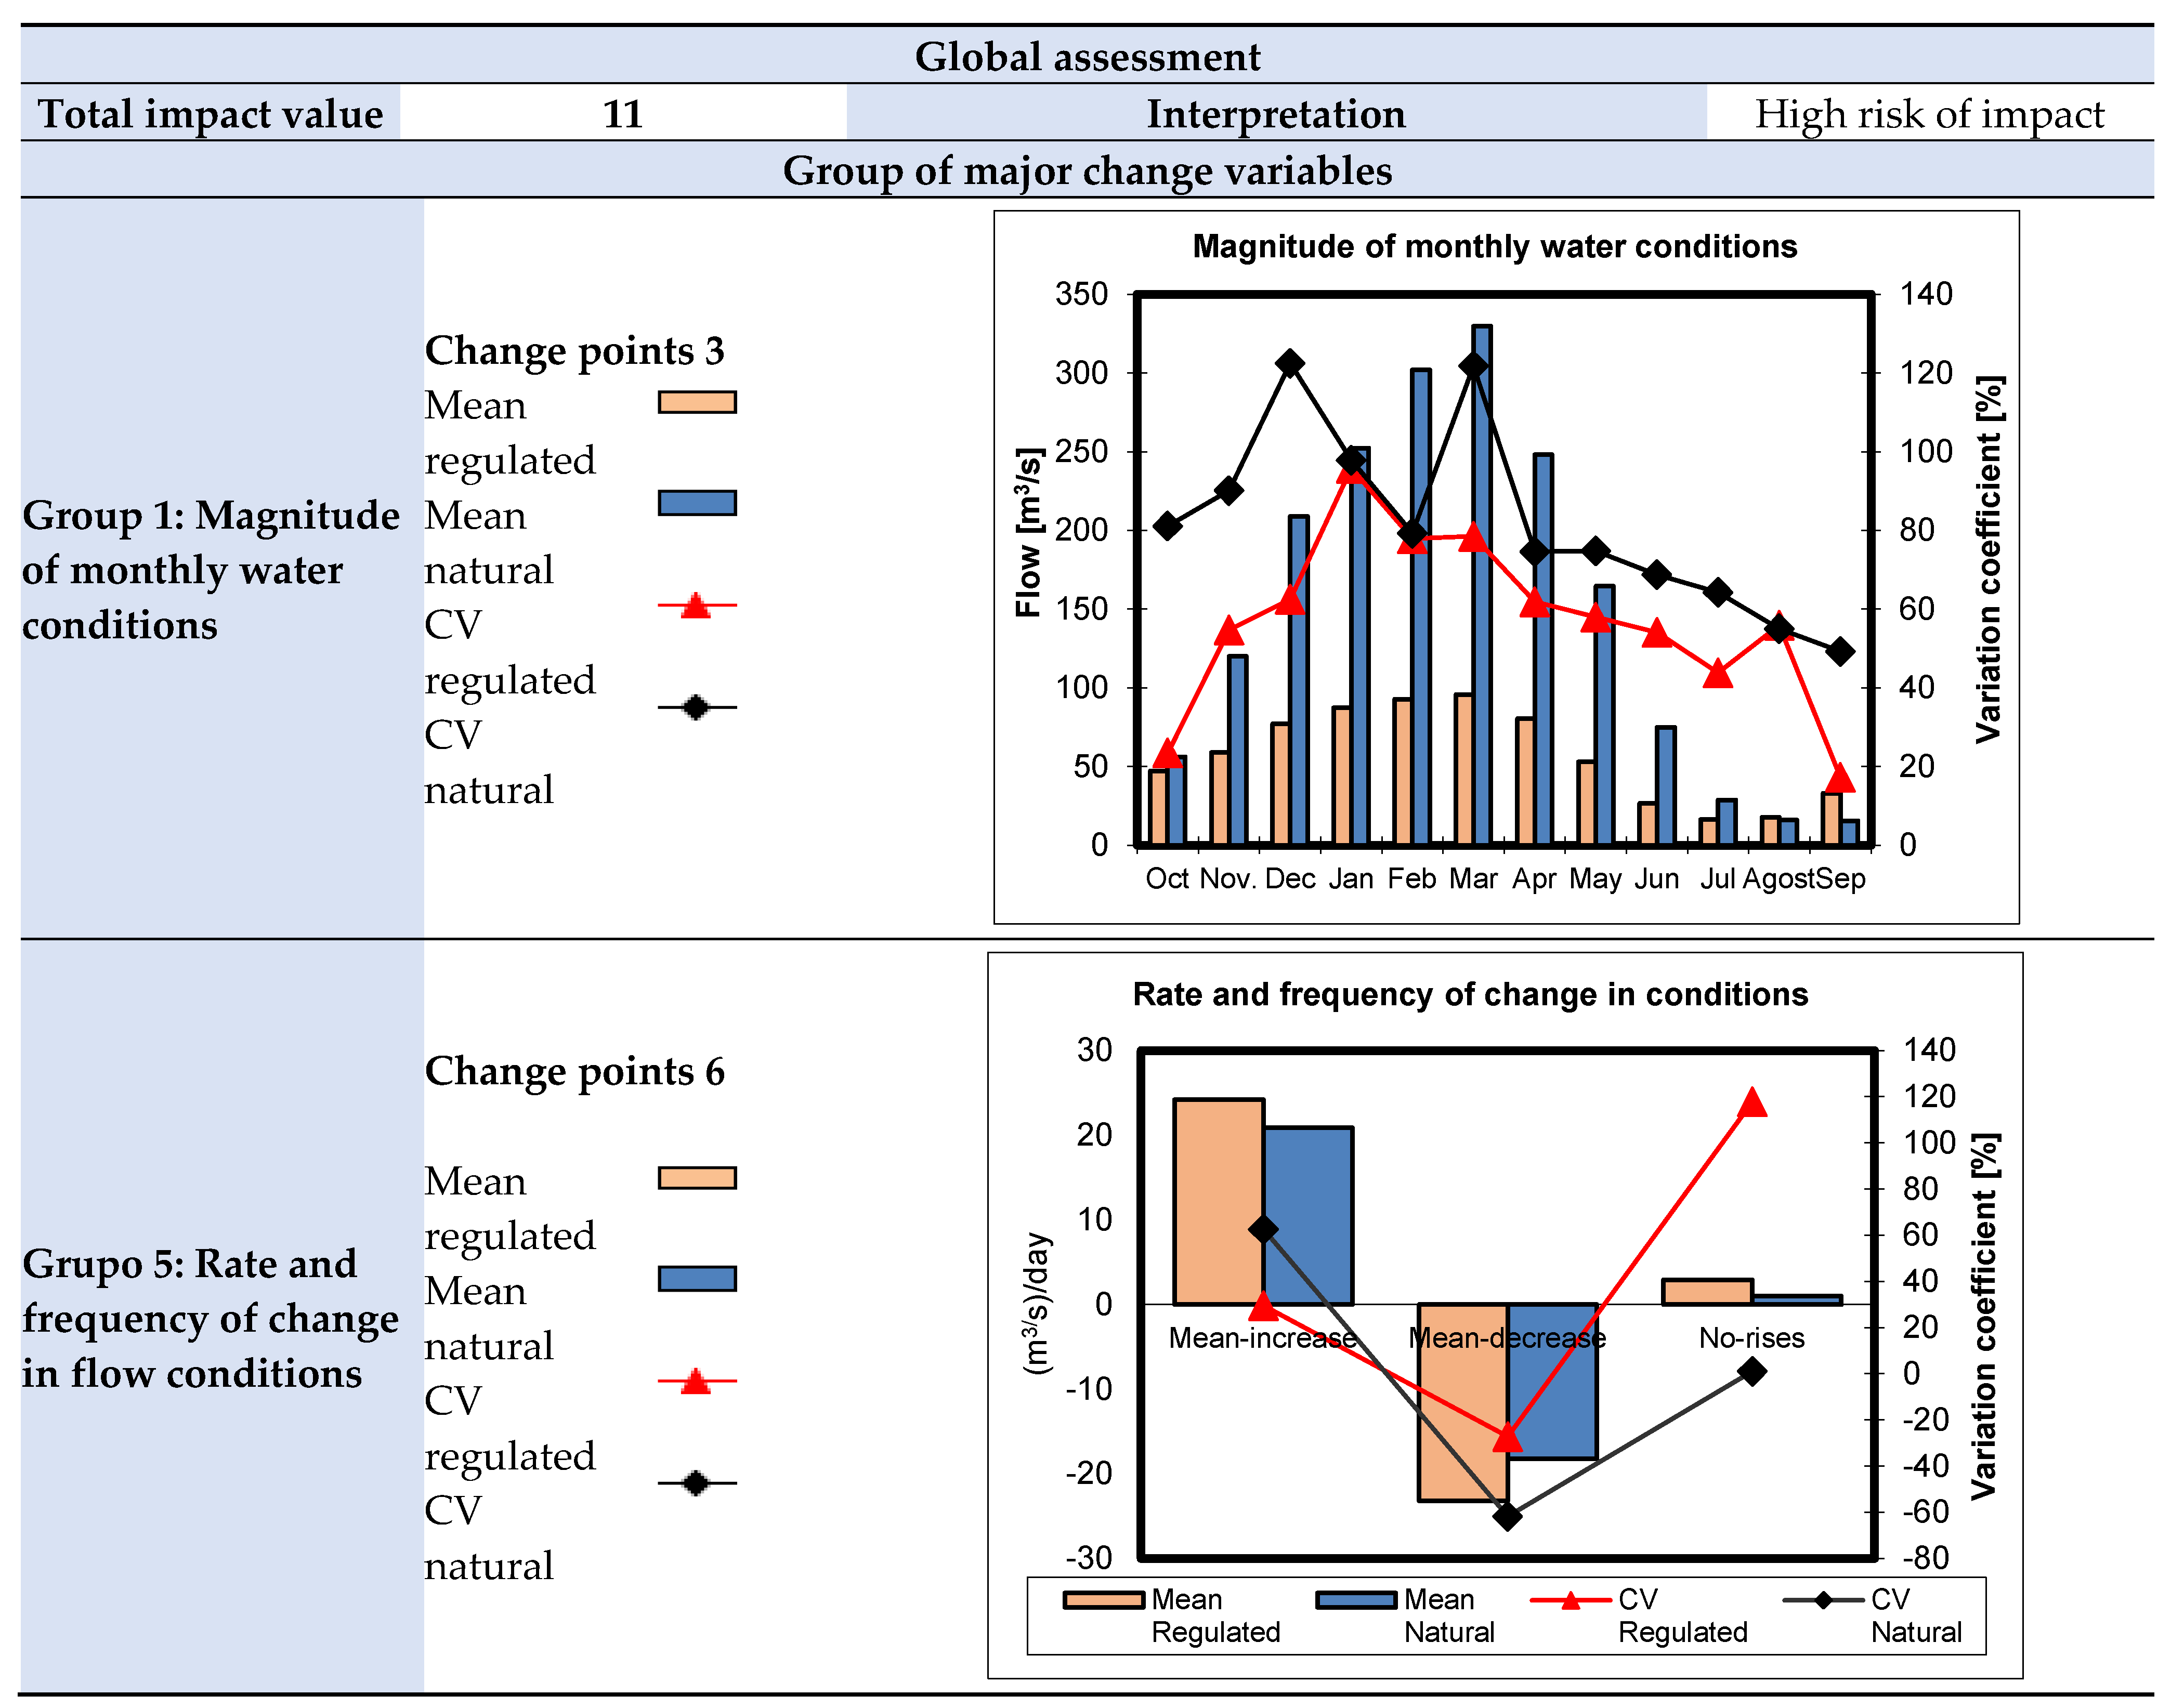
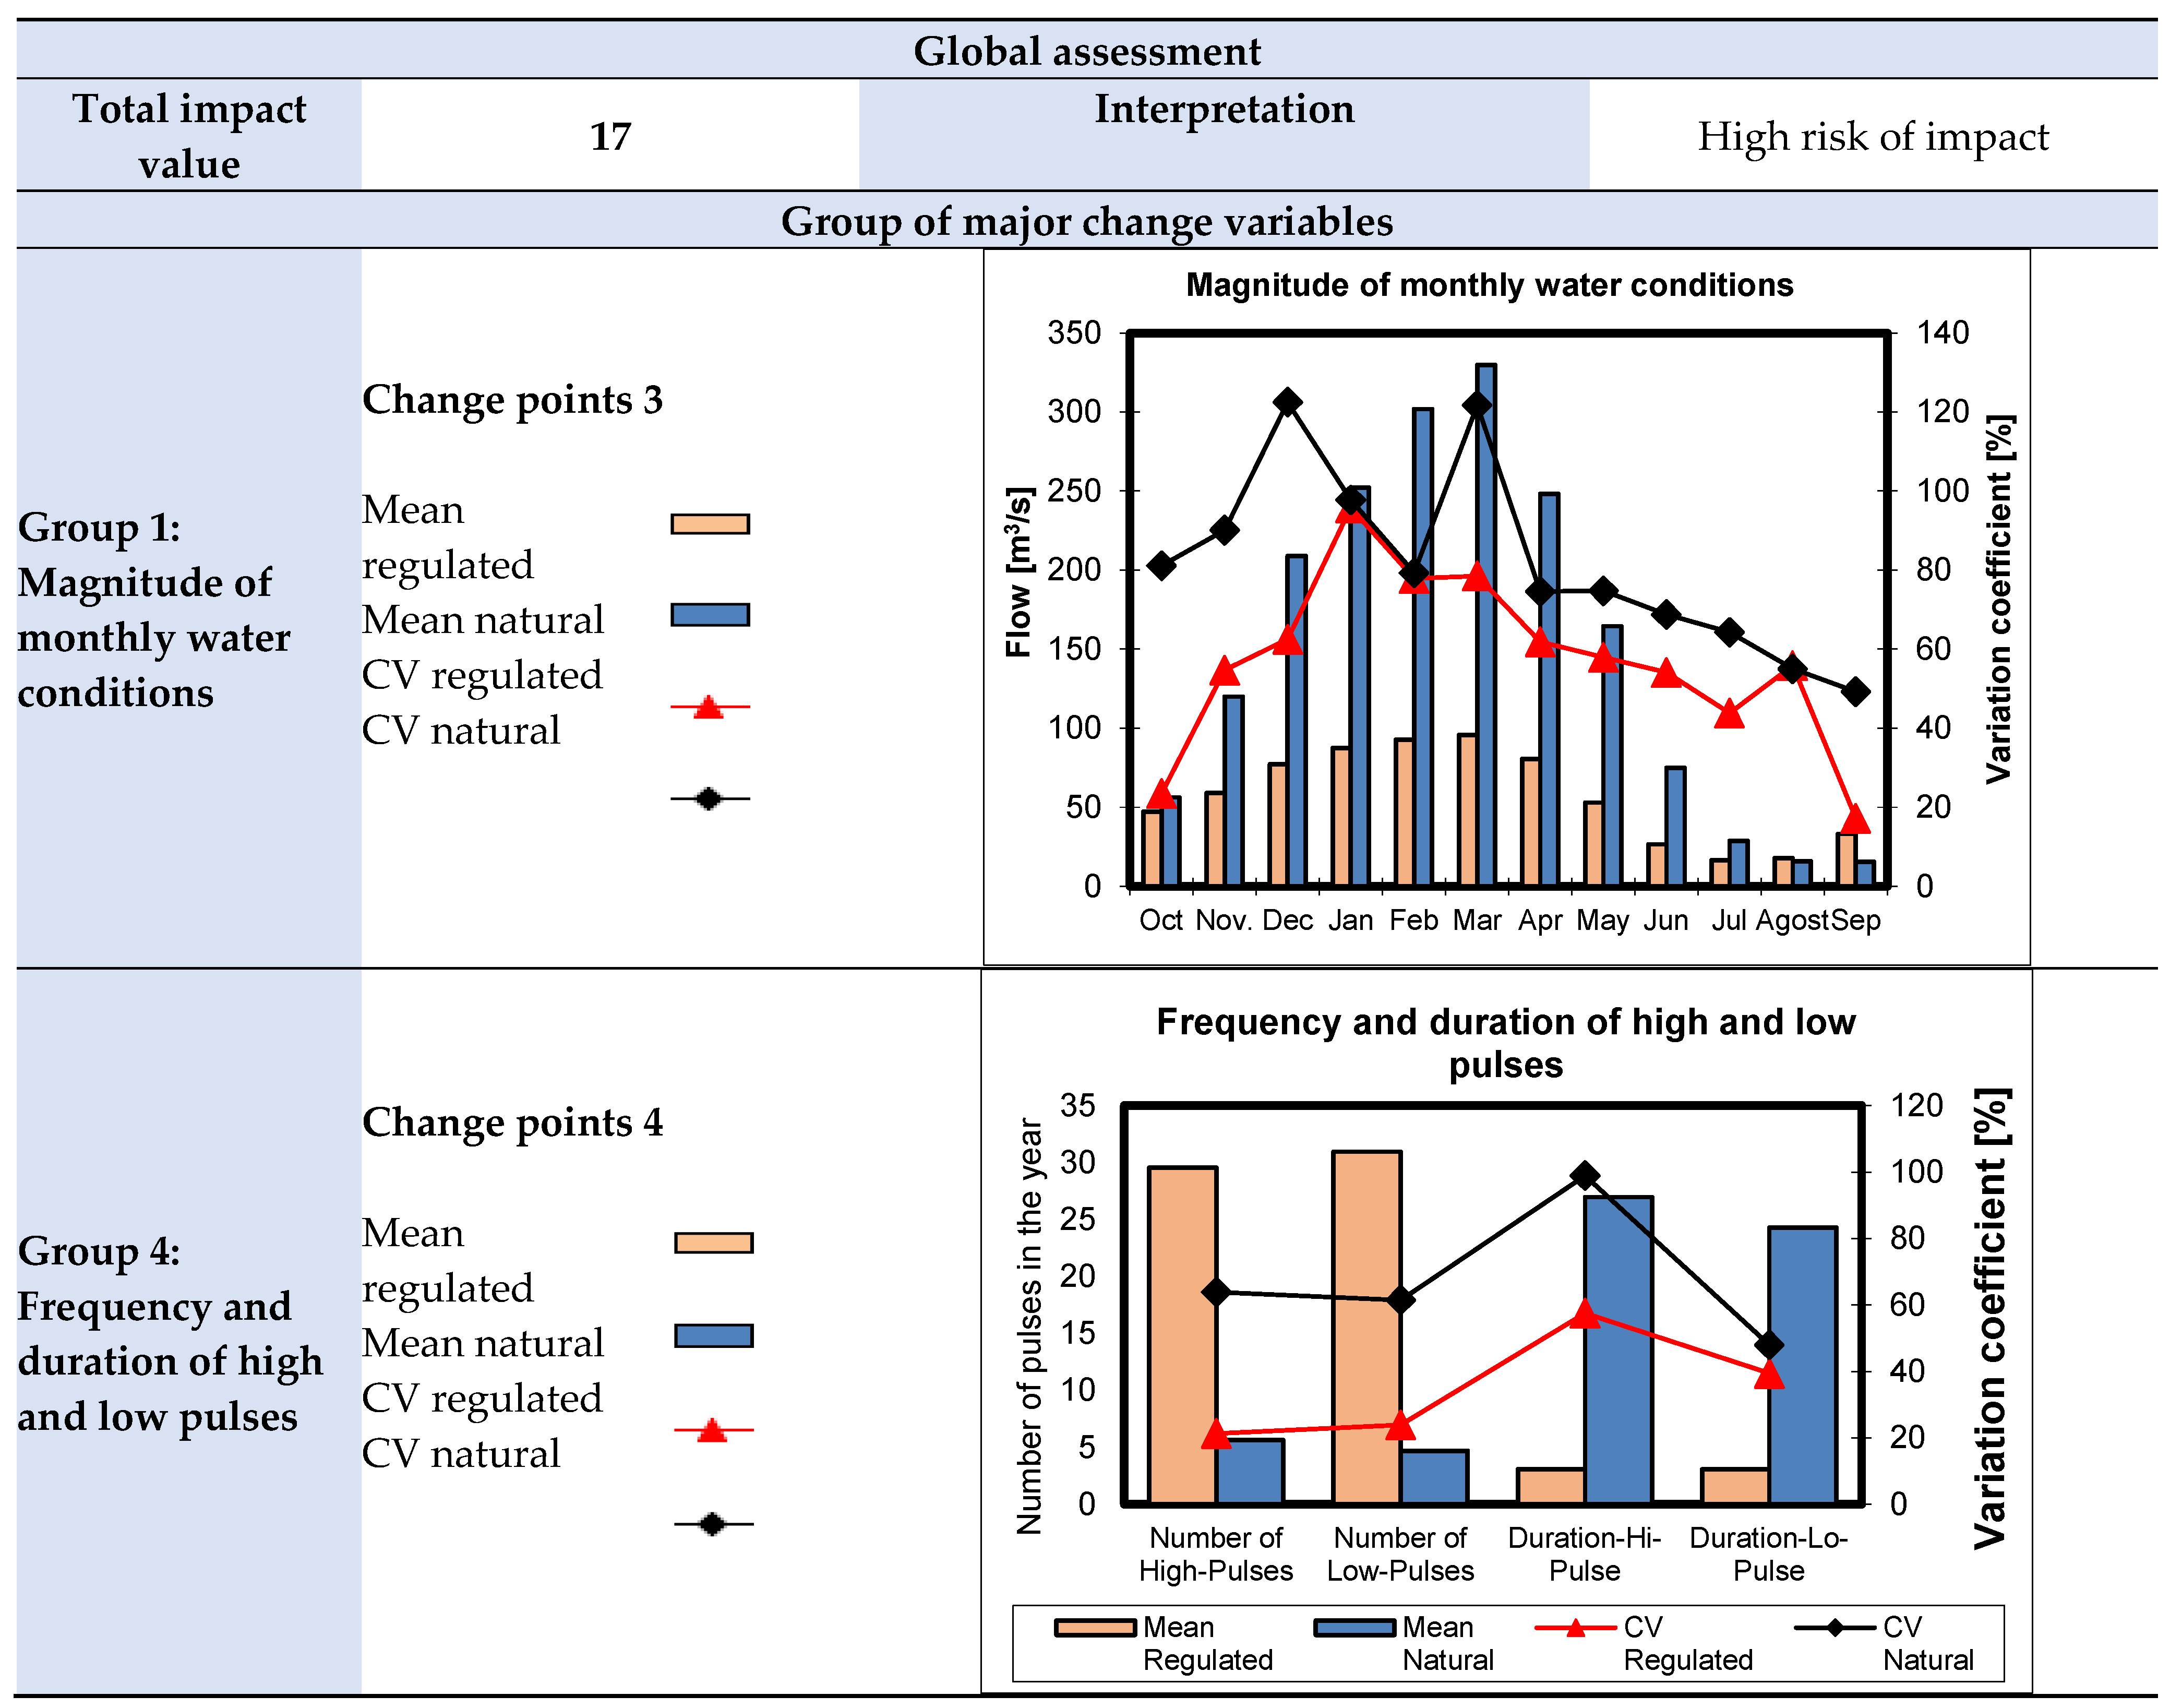
The following figures (Figure 6, Figure 7 and Figure 8) show the graphical representation of the values of the hydrological variables with the greatest alteration for three of the water bodies.
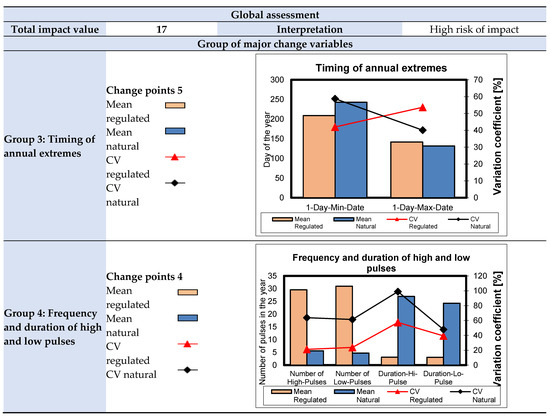
Figure 6.
Representation of the two groups where the greatest alteration has been detected for the Tagus River water body from Almoguera Reservoir to Estremera Reservoir; in this case, the date of extreme flows and the group related to the frequency and duration of high and low pulses. The vertical axis on the left measures changes in the magnitude of the variable, and the one on the right measures the CV.
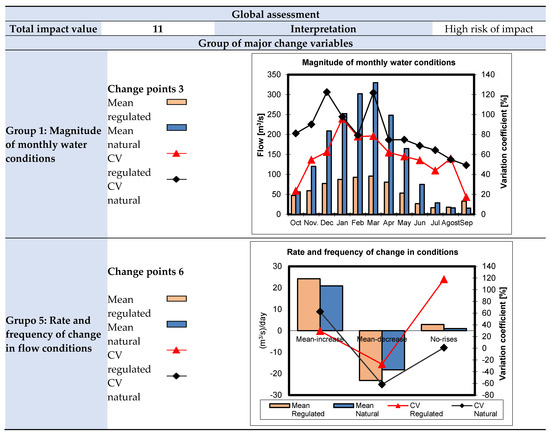
Figure 7.
Representation of the two groups where the greatest alteration has been detected for the water body Rio Tajo in Toledo to Rio Guadarrama; in this case, the magnitude of the monthly mean flows and the group related to change and frequency of flow conditions ratios. The vertical axis on the left measures changes in the magnitude of the variable, and the one on the right measures the CV.
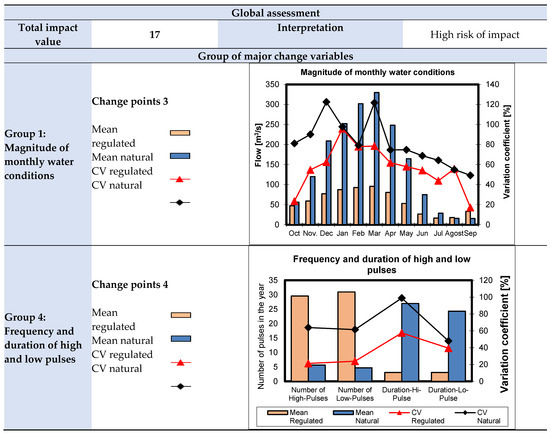
Figure 8.
Representation of the two groups where the greatest alteration has been detected for the Tagus River water body from Azután Reservoir to Valdecañas Reservoir; in this case, the variation in the magnitude of monthly flows and the group related to the frequency and duration of high and low pulses. The vertical axis on the left measures changes in the magnitude of the variable, and the one on the right measures the CV.
These three water bodies represented above have different locations: the first, at Almoguera village, is located at the highest point of the river section studied, the Toledo water body at an intermediate point, and the Azután water body at the lowest point. As can be seen, the variables that are most altered change; very significant is the variation in the time of occurrence of extreme flows, which offers a clear inversion in the first mass, when high flows circulate in summer. In the other two water bodies, one of the main changes is a reduction in the monthly mean discharge.
With the data for each group of changes, the final total change has been calculated, obtaining global values of change that increase according to the severity of the change. The total scores obtained to classify the alteration range from 0 to 30 points and have been classified according to the intervals in Table 2.
Table 3 summarizes the results for the 13 water bodies, presenting the alteration value by groups of variables and, finally, the total alteration.

Table 3.
Alteration values in the studied water bodies; distribution by groups of alterations and total alteration.
There is no clear trend in the total alteration as one moves downstream in the river. There are two cycles, with an initial increase and then a decrease: first, from the initial mass to the mass of the confluence with the Arroyo de Guatén, and a second cycle of increase from the latter water body to the end. The water bodies where the change are greater are those of the Tagus, from the Almoguera reservoir to the Estremera reservoir, and that of the Tagus downstream of the Castrejón reservoir.
It would be expected that the impact would increase downstream on the Tagus axis, due to the accumulation of extractions and hydraulic obstacles. However, this was not the case according to the results obtained. This may be due to the capacity of the large headwater reservoirs to alter the regime in relation to the total volume of water in that area, which is much greater than the storage capacity downstream, where there are fewer reservoirs and more water. For this reason, while the total alteration can be an indicator of the seriousness of the alteration, it is more useful for correcting hydrological alteration due to water management and land use, diagnosing specific impacts detected by specific variables.
Analyzing by groups of variables, it is observed that, in group 1, corresponding to the magnitude of the monthly flows, and, in group 2, the magnitude of the extreme flows, both high and low, the severity of the disturbance hardly changes, so these two variables in this river have not been used to make groups of reaches with similar disturbance.
However, in the case of the date on which the extreme values occur (group 3), the penalty tends to decrease as one moves downstream, as does the frequency and duration of extreme flows.
Conversely, the rate of change in flows from one day to the next increases, and therefore deviates more from the natural one, as one moves downstream in the basin.
Based on the observations of the results by alteration type, we can identify two distinct groups of river sections. The first group, located in the headwaters, is primarily affected by shifts in the timing of extreme flow events. This alteration may lead to a mismatch between flow conditions and critical phases of biological cycles. The second group consists of river sections where the rate of change in hydrological conditions deviates significantly from natural values. These sections exhibit highly homogenized flow regimes, with minimal seasonal variation.
3.1.1. Magnitude of the Minimum Flow and Monthly Flows Regime
For the group of water bodies where the main problem is the reduction of monthly flows, it is proposed to improve the definition of the minimum flow as a threshold that should never be lowered; in this work, we have calculated the minimum environmental flow for the water bodies downstream of the Aranjuez body, using the same methodology proposed in other works of our group for the water bodies upstream of Aranjuez [43], using the hydrological method of the 25-day moving average and applying the monthly variation factor proposed by Alcazar and Palau, [34]. Table 4 shows the proposed environmental flow regime obtained by applying this method to the eight water bodies located in this section.

Table 4.
Proposed environmental flow regime for the water bodies located from the confluence of the Jarama river. The value of the minimum flow (m3/s) has been calculated with the hydrological method Q25d; the monthly change pattern has followed that described in the methodology of Alcazar y Palau (2010) [34].
Table 5 shows some notable values of the proposed environmental flows in these water bodies: the amount of water required to contribute to the sustainability of the river; the contribution to the environmental flow compared to the total contribution of the river; and the relationship between the minimum environmental flow and the mean flow of these water bodies.

Table 5.
Mean values of total environmental volume and minimum environmental flow of the 8 water bodies. Also, the values of the initial and final water bodies are presented. The water requirements to cover the environmental flow regime are compared with the total natural volume contribution, and the minimum environmental flow with the value of the mean natural flow of the water body.
3.1.2. Magnitude and Duration of Peak Flows
Hydraulic simulations were carried out in two water bodies, Aranjuez (101021) and Almoguera (1030219), to solve the problem of the maximum flows that occur in the water bodies in the upper part of the basin; in this part of the river Tagus, the riverbed is used in the summer as a means of transporting irrigation water. The hydraulic simulation has been run to find the extreme flow that significantly reduces the refuge by generating very high velocities in most of the surface of the sections where the work has been done, as explained above. This maximum flow, which limits the habitability of the stretch, has been calculated for two periods, low water period and the rest of the year, since most of the problems with maximum flows occur in summer, when the fish juveniles have just emerged.
The condition for defining this maximum flow was to ensure that at least 50% of the wetted surface of the stretch is maintained as a refuge during the periods of predominance of the most-sensitive stages. The allowable velocities have been set to define the maximum flow in the dry period, the limit velocity for barbel fry (0.53 m/s), and, in the wet period, the limit velocity for juveniles (0.8 m/s).
The following tables (Table 6 and Table 7) show the distribution of velocities in the reaches for a limiting flow, which can have negative effects on the fauna by reducing the refuge for fish. The tables show the evolution of the percentage of areas with a valid surface in the reaches as the flow rate increases, from which we were able to select a limiting flow rate that we consider to be the maximum.

Table 6.
Percentage of the surface area of the river section that maintains a velocity value above the critical velocity for different flow rates at the Aranjuez water body of the R. Tagus. A surface percentage less than 30% is indicated in green color; yellow, a percentage between 30 and 50%; and in red color when it is higher than 50%.

Table 7.
Percentage of the surface area of the river section that maintains a velocity value above the critical velocity for different flow rates at the R. Tagus water body from Almoguera Reservoir to Estremera Reservoir. A surface percentage less than 30% is indicated in green color; yellow, a percentage between 30 and 50%; and in red color when it is higher than 50%.
The simulation results for the maximum flow rates allow us to propose a rate of 13 m3/s for the Aranjuez water body as the limiting flow for the summer and 14.5 m3/s for Almoguera; as for the limiting flow rate for the rest of the year, it would be 21 in Aranjuez and 36 m3/s in Almoguera.
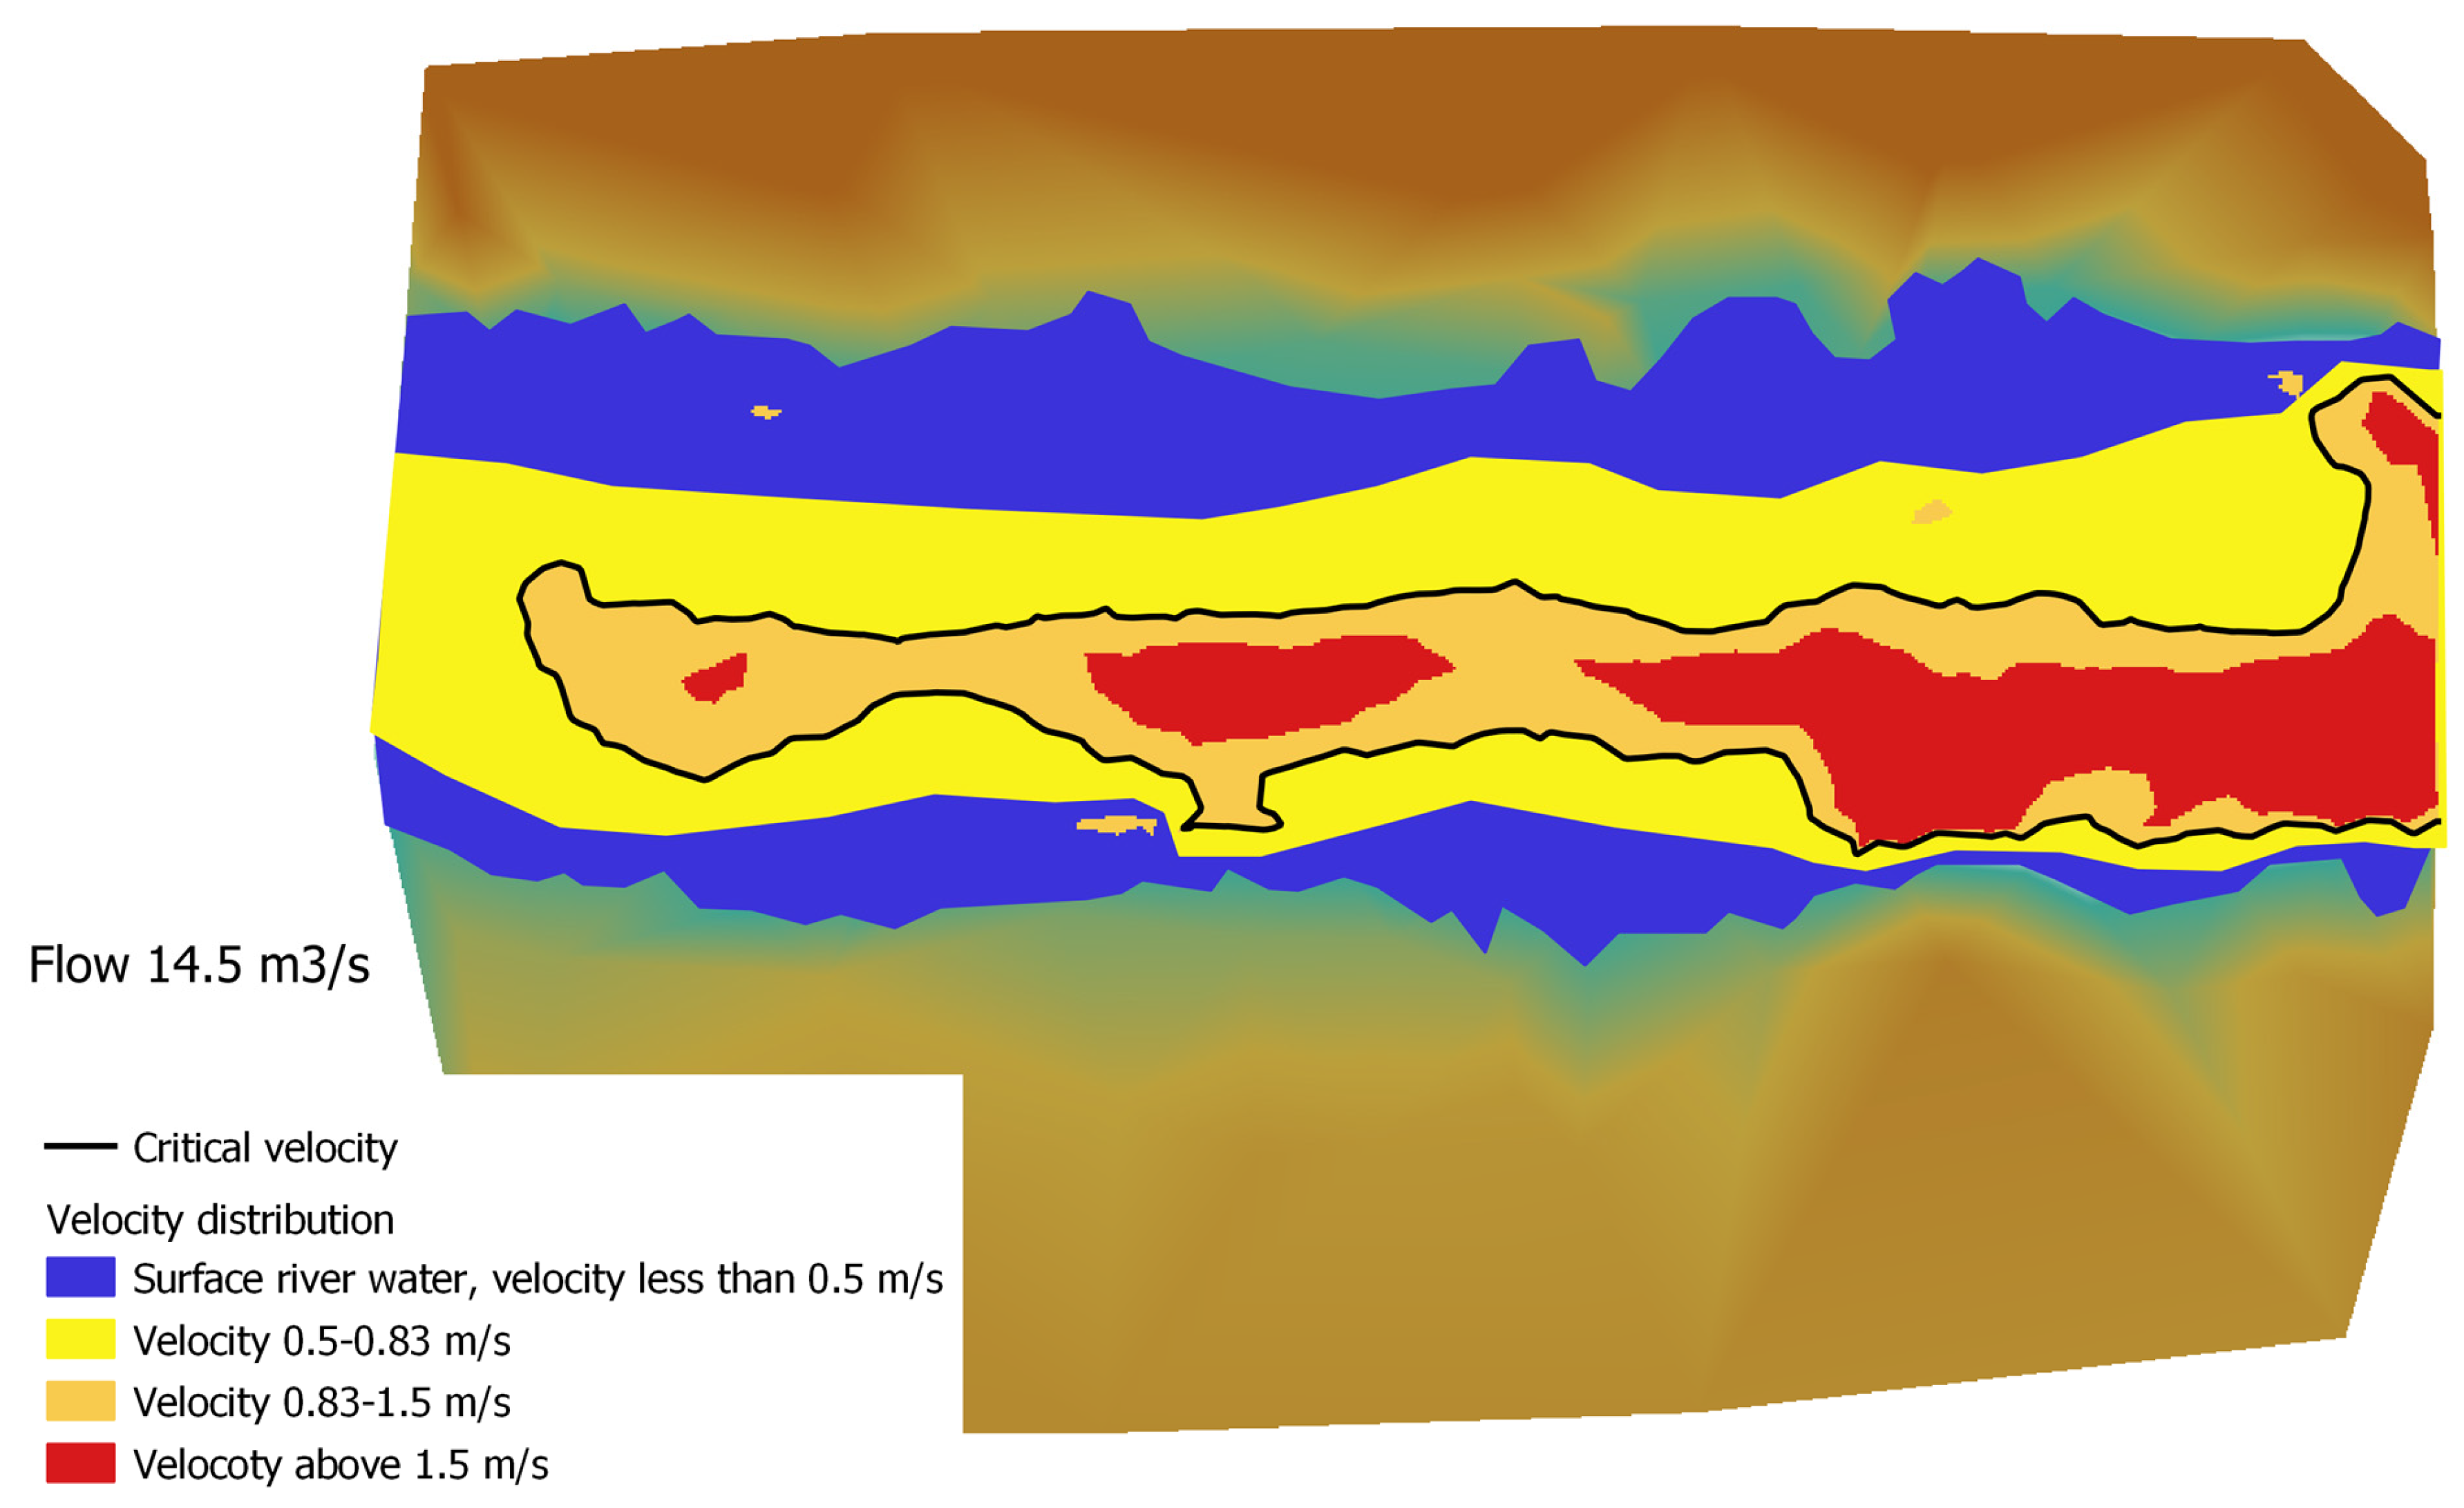
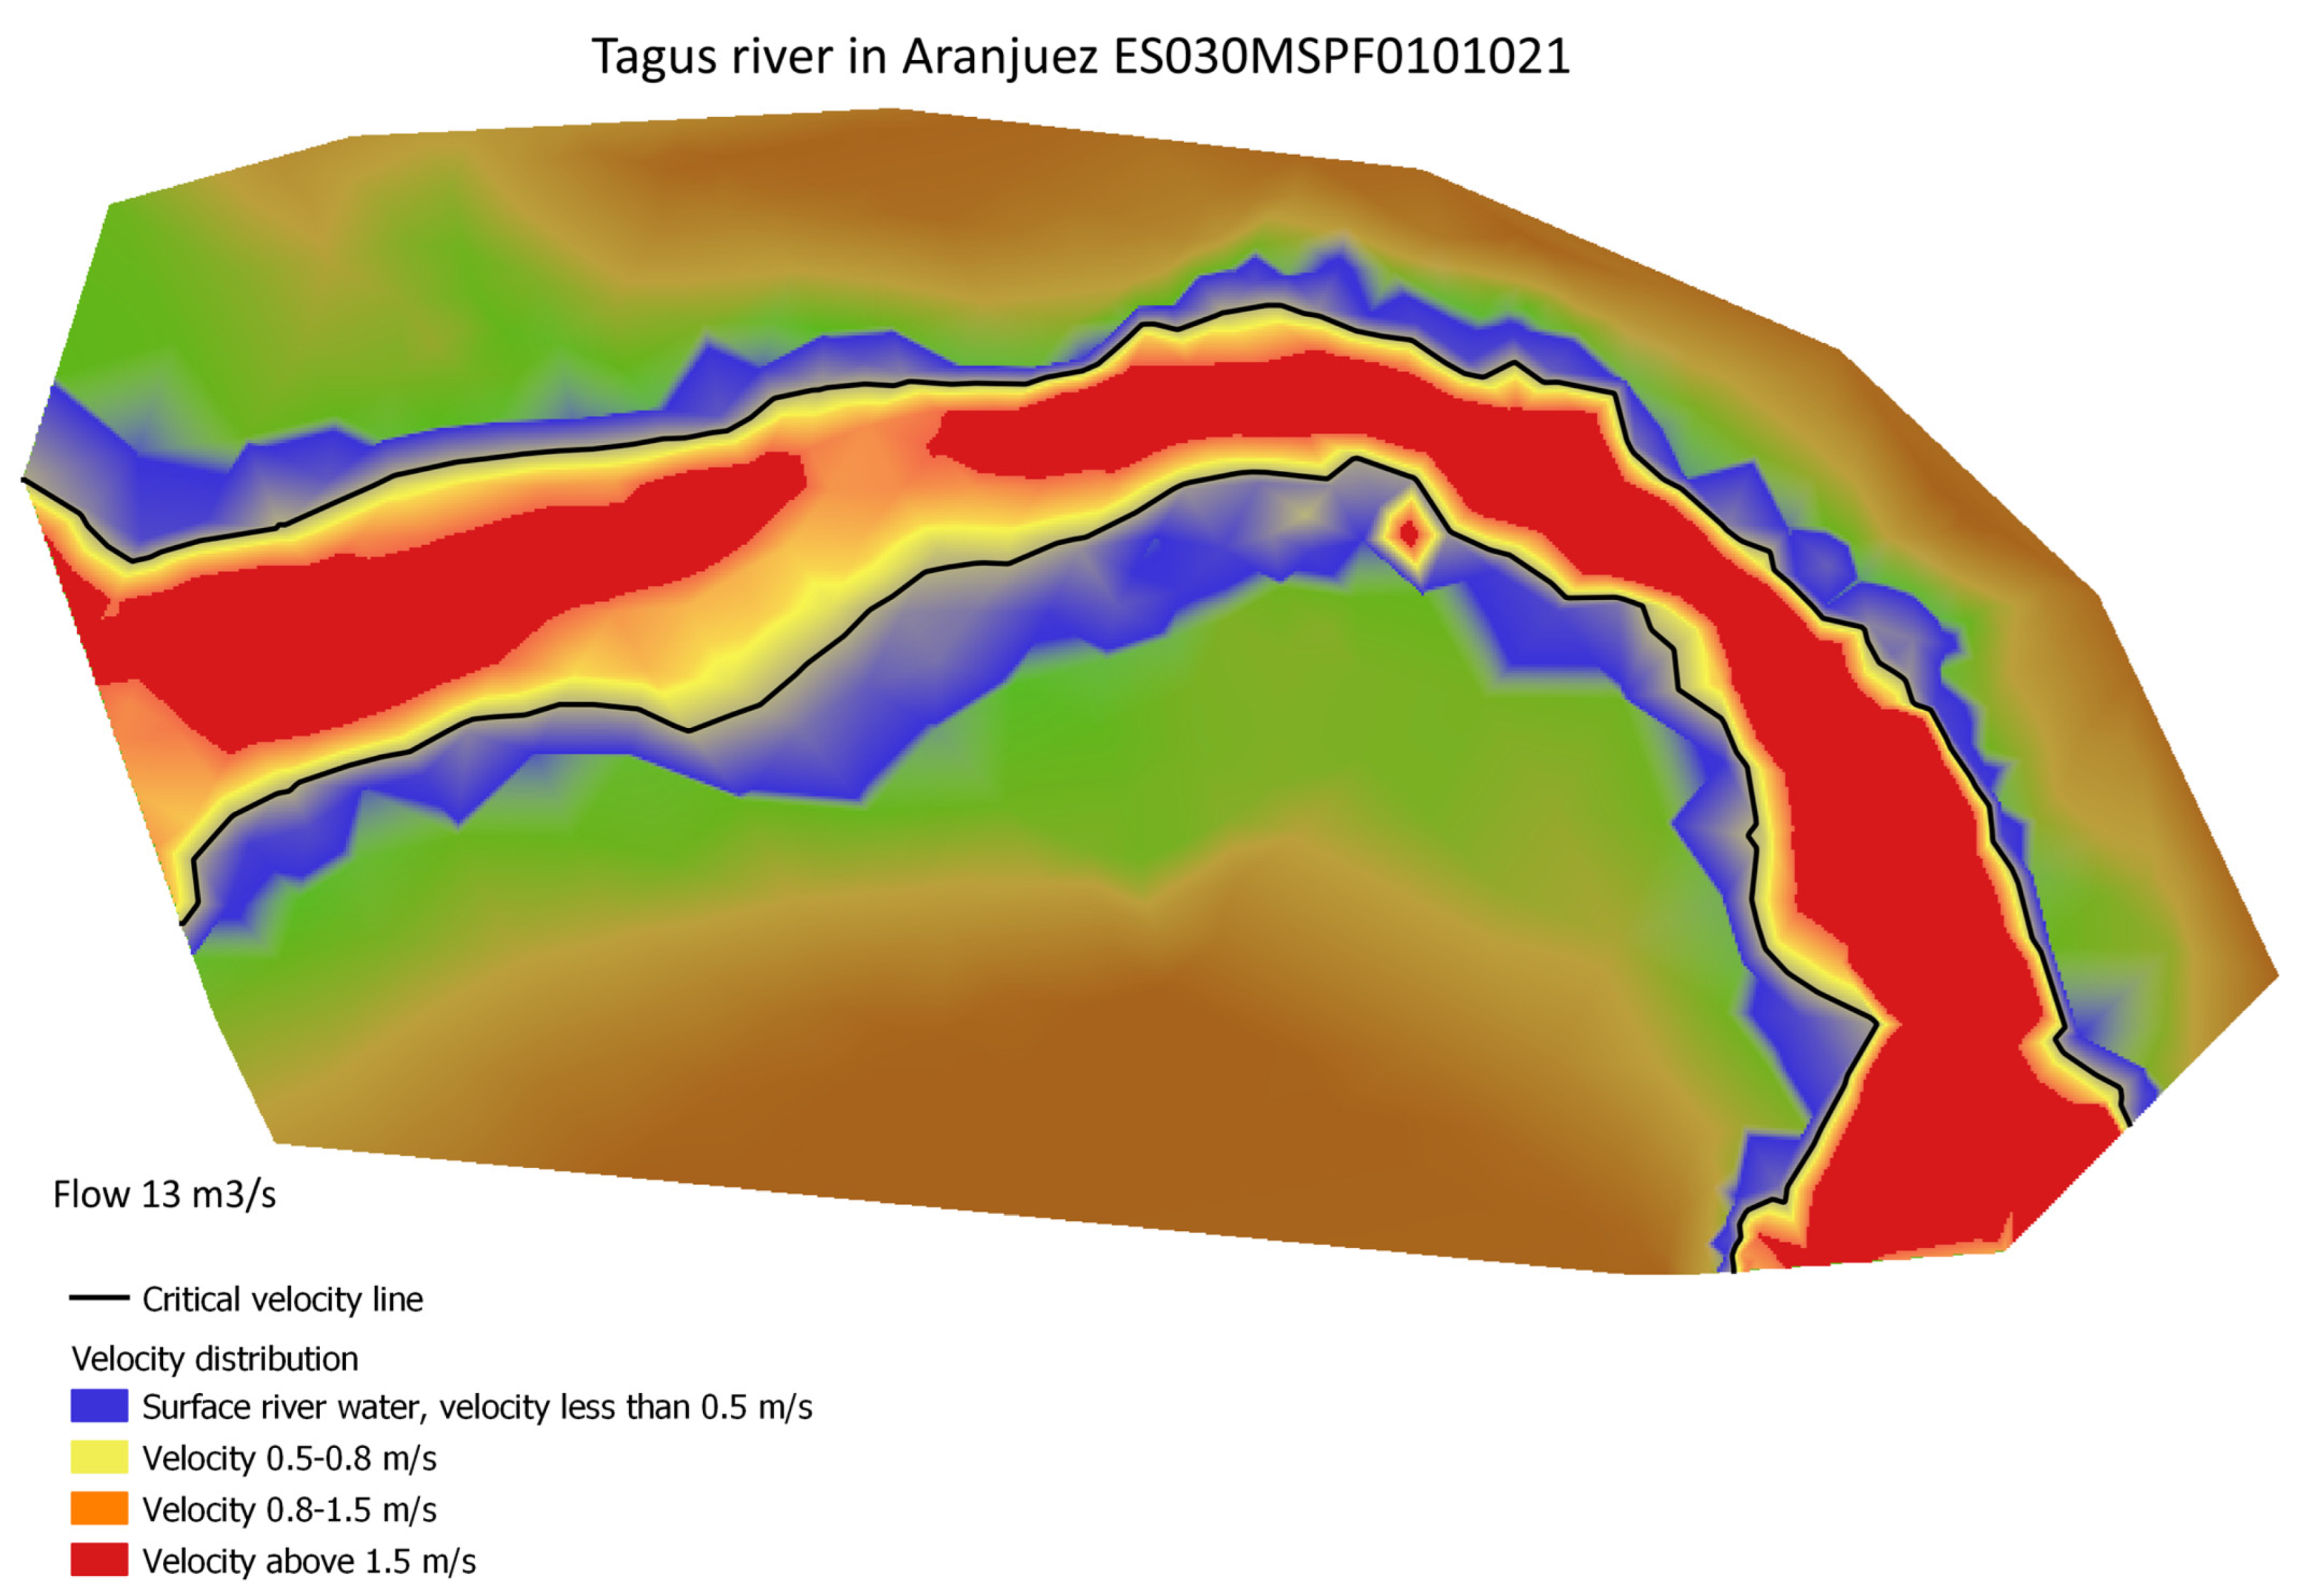
Figure 9 and Figure 10 show the distribution of velocities above the 0.5 m/s limit in the Aranjuez and Almoguera sections when flows of 13 and 14.5 m3/s are circulating.
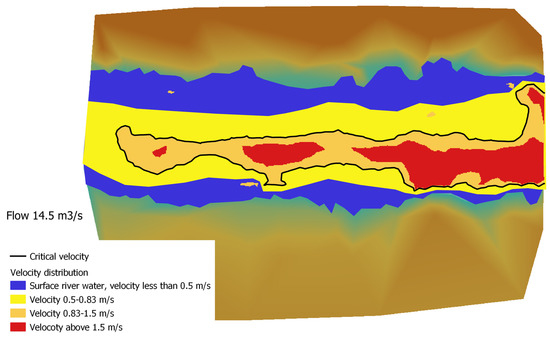
Figure 9.
Distribution of water velocities in the Almoguera water body with a river flow of 14.5 m3/s; it can be observed that the limiting velocity is distributed over a high surface in the center of the water current, leaving little surface as refuge for the most-sensitive fish ages. The velocity distribution covers a range of colours, from dark blue with values of 0 m/s to yellow with critical velocity values of 0.8 m/s.
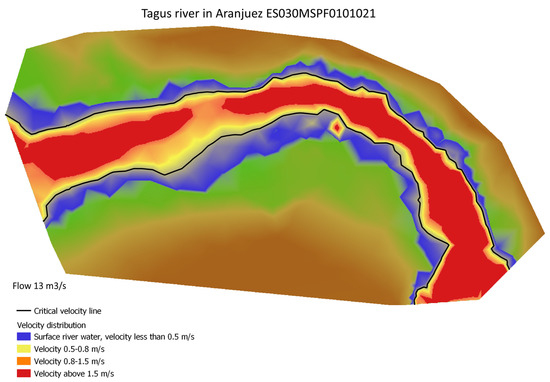
Figure 10.
Distribution of water velocities in the Aranjuez water body with a river flow of 13 m3/s; it can be observed that the refuge occupies a very small part of the riverbanks. The velocity distribution covers a range of colours, from dark blue with values of 0 m/s to yellow with critical velocity values of 0.83 m/s.
The flow that generates the critical velocities is higher in the Almoguera water body, despite being further upstream than that of Aranjuez; this is due to the different morphology of the river flow; the Tagus in this section downstream of the large reservoirs has incision problems that reduce the size of the channel and increase the velocity; this is more evident in the Aranjuez section than in the Almoguera section.
Exceeding a maximum flow in a section of the river has negative effects if it persists for a long time; the problem is aggravated if the maximum flows are circulated in the river for a long period of time during the period of emergency or persistence of the maximum flows.
The duration of the flow pulses that exceed the maximum low flows in the Almoguera and Aranjuez masses has been reviewed, with the most recent series of gauging data from 1998–1999 to 2017–2018, to observe the difference in the natural regime and in the current series with respect to the maximum flow situation structure. In the Almoguera water body, with the current regulated flows, the maximum flow restrictive for the habitability of the section, 14.5 m3/s flow, is exceeded twice a year; if we consider the duration of these pulses, in the irrigation season from 1 April to 30 September, the average duration of these pulses is 64 days. One of the most notable changes observed in the IHA study for this water body is the change in the duration and frequency of the exceptional flow pulses (Figure 5); the analysis of the hydrological behavior for the maximum flow in the natural regime reveals that the high flow pulses last an average of 26 days (Figure 6) and occur mainly in winter.
In the Aranjuez water body, this change is not as serious; in the natural regime, high flow pulses last for an average of 5 days and occur mainly in winter. In this water body, the number of times that the flow rate considered limiting for the development of barbel fry is exceeded during the irrigation season (April–September) is currently 3, and the duration of these pulses is 10 days on average.
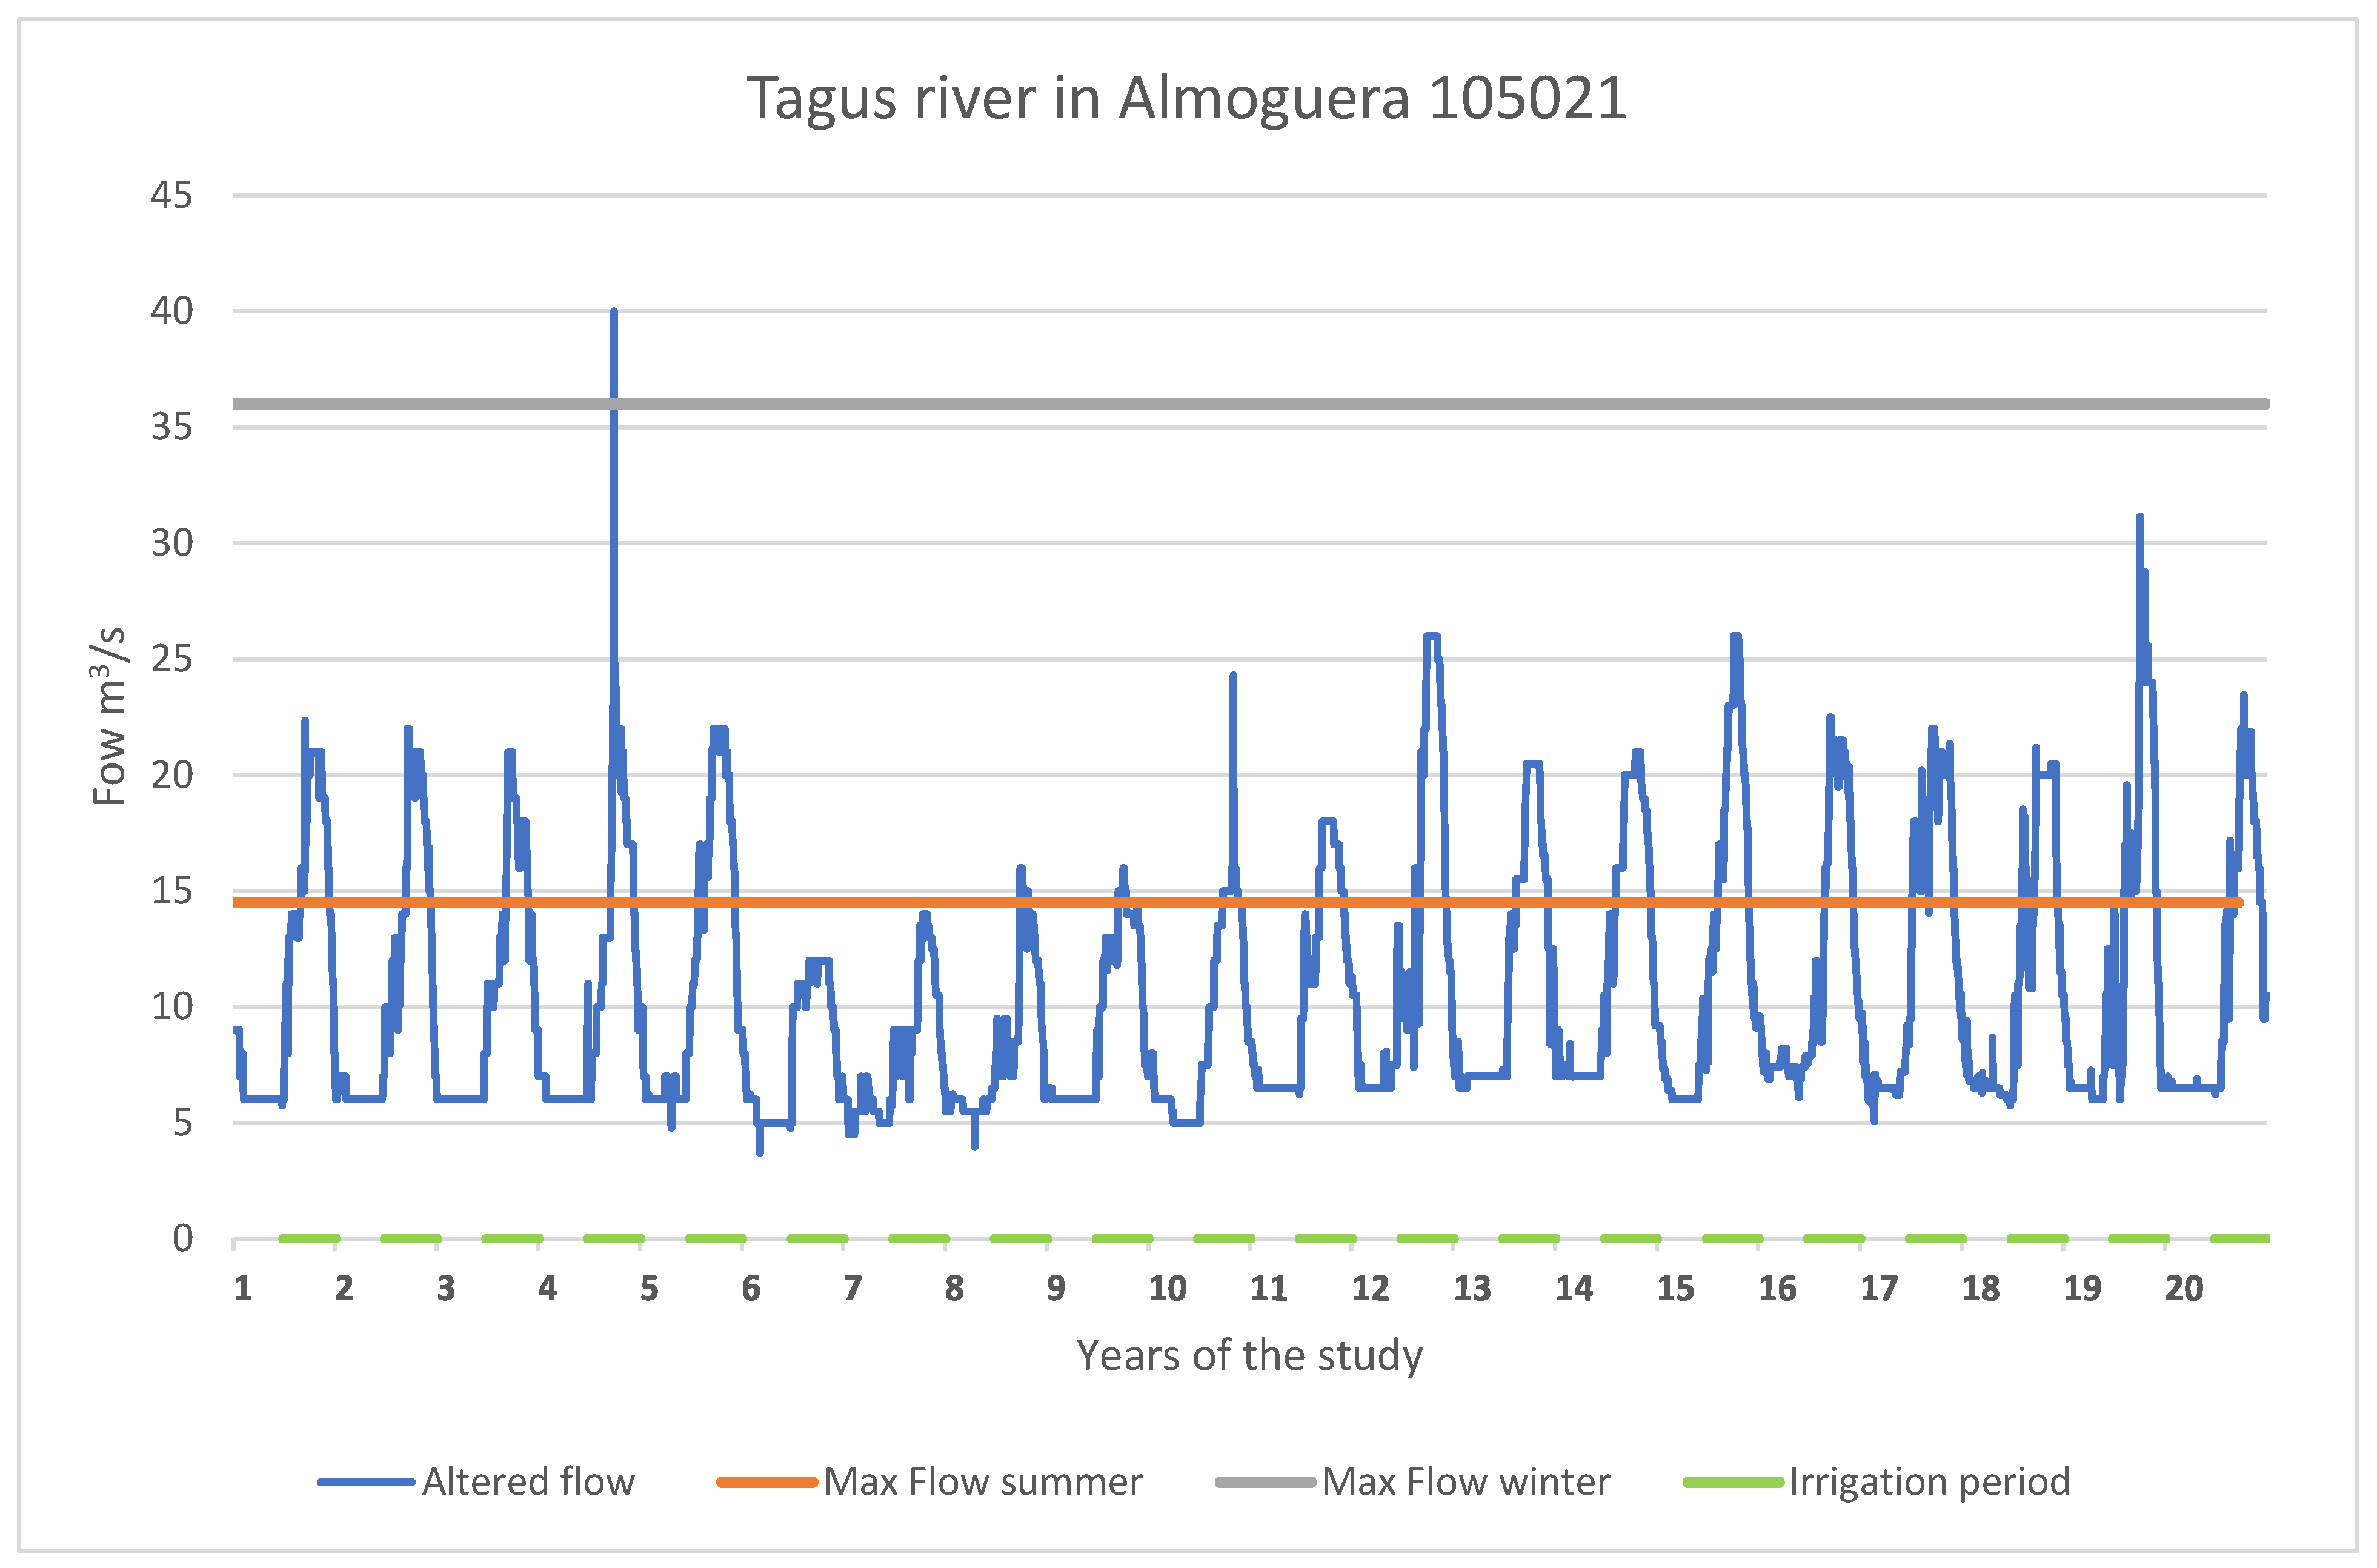
Figure 11 shows the series of 20 years of current flow recorded in the Almoguera gauge station, it can be observed the flow considered maximum is exceeded practically every year, for a very long time in the summer.
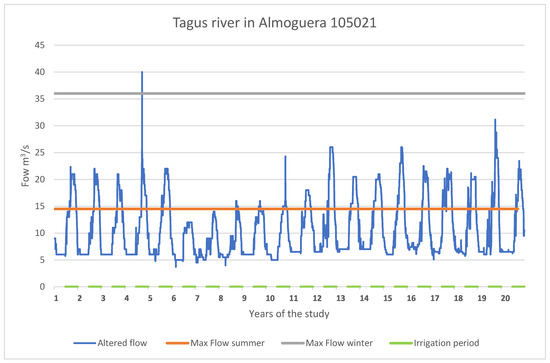
Figure 11.
Representation of the current flow rate in the 1999–2022 series in the Tagus downstream of the Almoguera reservoir; the flow rate rises at the end of each hydrological year during the agriculture water campaigns, and practically every year exceeds the critical flow rate of 14.5 m3/s during a very long period.
Utilizing these findings, we can formulate a regime of maximums encompassing two values: one for the period during which the most-sensitive stages of the barbel are present, subsequent to emergence [date], ranging from 1 April to 30 September, and another for the remainder of the year. This regime would encompass not only the magnitude of the flow but also a maximum pulse duration, thereby ensuring the limitation of any potential stress situations within the river. For the Almoguera section, the values would be as follows:
The maximum flow is 14.5 m3/s, from 1 April to 30 September. The maximum duration of the pulse is 10 days.
The maximum flow is 36 m3/s, with a time period ranging from 1 October to 30 March. The maximum pulse duration is 26 days.
This proposal could also be valid for the Aranjuez water body, located downstream, where there are no significant natural inflows and where there is not enough regulation to modify the releases, which can generate these maximum flows.
4. Discussion
The precise identification of the most significant alterations in flow regimes for each specific problem can enhance the effectiveness of interventions designed to address these changes.
Due to the complexity of hydrological planning, many rivers are subject to measures intended to minimize hydrological alteration that are often rigid and simplistic and serve as a one-size-fits-all solution for many rivers [22,44]. However, these strategies may not always effectively address the challenges presented in highly impacted regions such as in cases where flow regimes are reversed, leading to prolonged high flows during the summer months (as is the case on R. Tagus upstream R. Jarama conjunction, see Figure 5 at Zorita). The maintenance of high flows in summer seeks to ensure that the flow rate is always above the rate established as the minimum ecological flow. However, whilst this may meet requirements established in hydrological planning, it does not solve the hydrological alteration problem of these rivers.
The difference in the potential for river system between a well-designed environmental flow proposal and a more conservative one is crucial. Excessive high flow regimes have been shown to negatively affect river fauna and ecosystems [1,45]. It is particularly important to understand the risks posed to fish recruitment, as strong currents can easily wash away young fish, particularly along riverbanks. This impact also can significantly hinder the colonization of riparian vegetation which has established itself along the banks during spring and is now under excessive stress [46,47].
High flows in the upper reaches of the study area during the irrigation months negatively impact on the reproduction of fish species like the barbel, whose spawning season lasts from May to June [48]. This alteration could also adversely affect other species present in the river, such as the European nase Parachondrostoma toxostoma and the Chub Achondrostoma arcasii [49]. These studies show that this anomalous flow pattern can last for more than 100 days in some years.
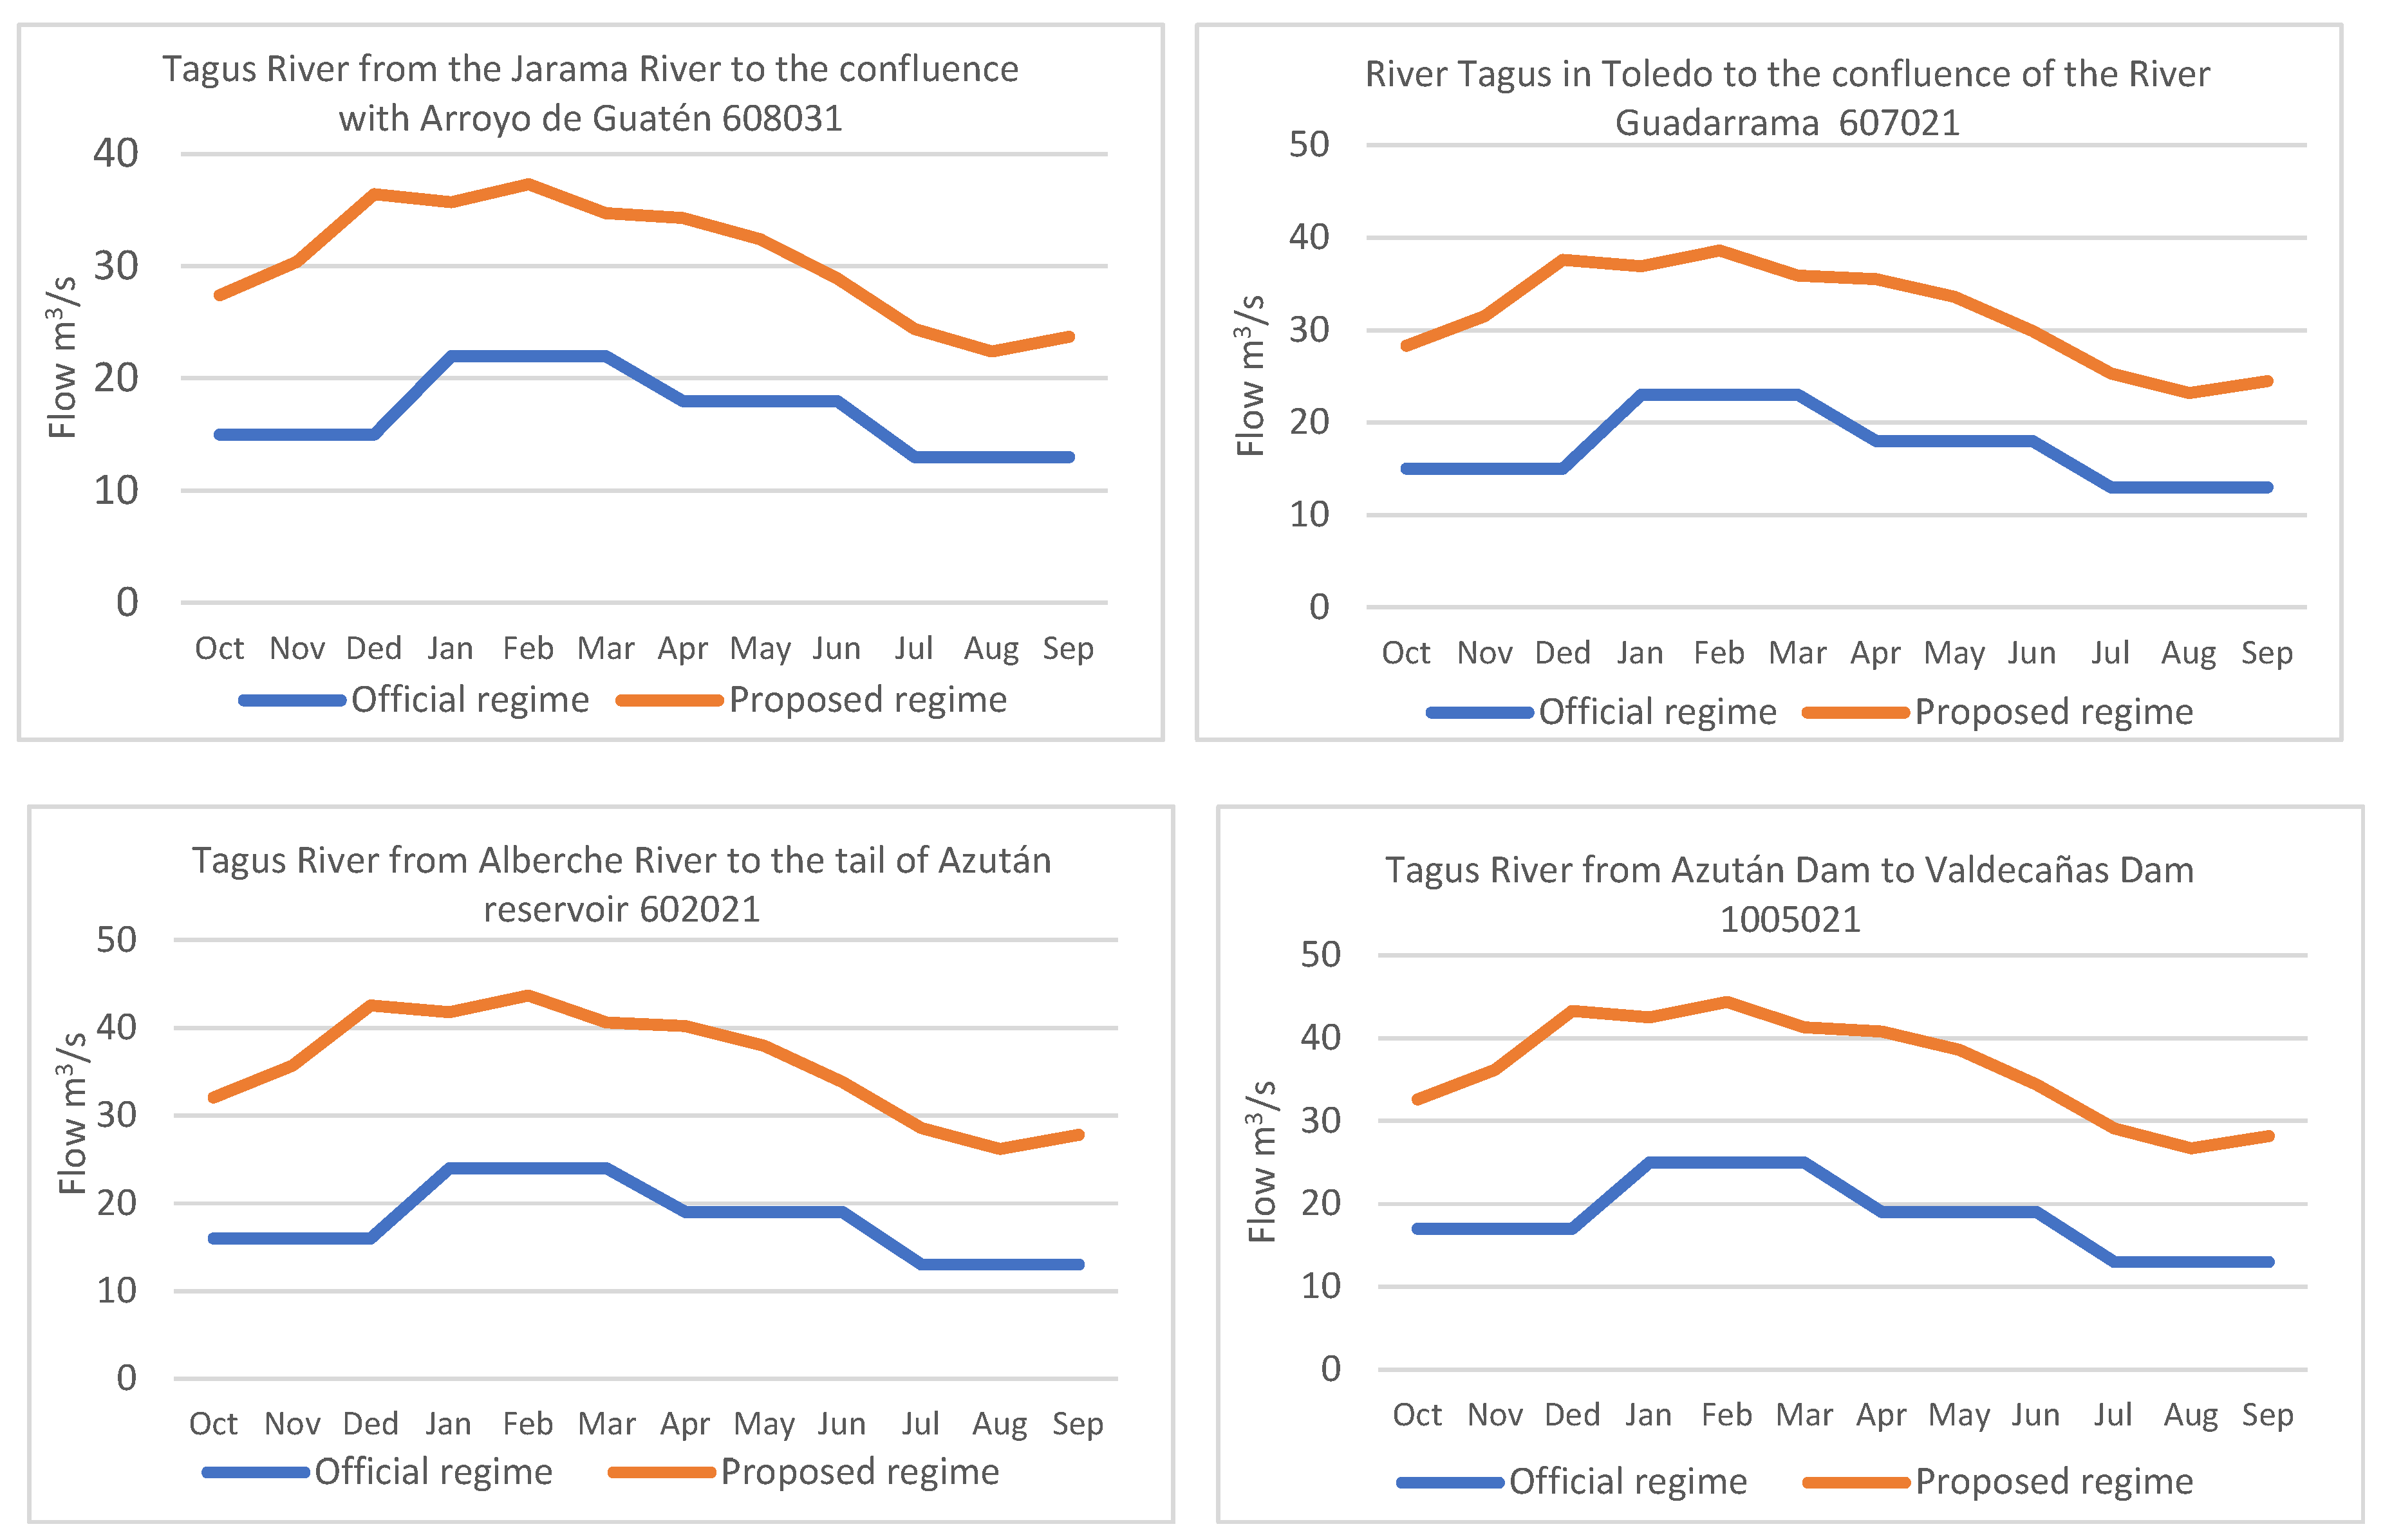
In response to these concerns, the River Basin administration, the official administration responsible for managing the region’s hydrology, has implemented an environmental flow regime as a restorative measure with quarterly values (Figure 12). The official proposal incorporates excessively low quarterly values with very simple seasonal variation and fails to address the disruption caused by excessive and prolonged maximum flows. The current environmental regime has undergone slight modifications in comparison to previous River Basin Plans, with a small increase in flow values in the last approved 2022 Hydrological Plan [20]. However, the proposal has been criticized for its technical design [50] and its lack of alignment with environmental objectives [51].
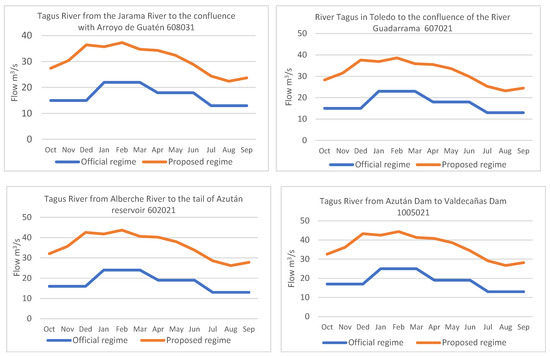
Figure 12.
Official environmental flows (blue line) and proposed environmental flow (orange line) regimes in 4 of the water bodies where they have been calculated. The official proposal of environmental flows does not change from the Jarama water body to Toledo, nor does it change in the masses upstream and downstream of the Azután reservoir.
To improve the official proposal, it has been suggested that the small monthly flow values should be increased, as they are currently insufficient (Figure 11). Additionally, the seasonal variation in flows is minimal, and changes from one season to another are barely perceptible. Finally, the proposal lacks clear definitions for maximum flows in most water bodies.
The primary issue is that, while the ecological status of water bodies is poor, the extent to which hydrological alterations contribute to this degradation remains under-explored. There are few studies that explore the consequences of these alterations on the biological communities or how specific components of the flow regime that are strongly altered influence ecosystem functioning. Further research in this area is essential to establish stronger connections.
Despite these gaps, some studies have documented the deteriorating condition of fish populations in this stretch of the river [52,53]. Other studies of rivers in the central Iberian Peninsula highlight the adverse effects of dam regulation, particularly the reduction of suitable habitats for species like the barbel [49]. Research in Portugal has shown that the release regimes from reservoirs can alter the quantity, quality, and location of barbel habitats [36]. Therefore, the way water is released from headwater reservoirs in the Tagus River, which affects the flow regime of its upper reaches, has significant consequences for the maintenance of fish populations.
Since water bodies follow a hydrological direction from upstream to downstream, alterations in upstream bodies can induce similar changes downstream, making flow reversals a significant issue for lower reaches. A key finding of this study is that the inverse initial alterations tend to be diluted downstream, emphasizing the need for comprehensive hydrological analyses across interconnected water bodies. It has been observed that the entry of significant tributaries, such as the Jarama, Alberche, and Guadarrama, or the influx of urban water, can alter downstream flows, leading to changes in the characteristics of other water bodies.
Another change that has been highlighted in the hydrological study is that the flow regime of the Tagus River downstream becomes more irregular due to the confluence of large tributaries such as the Jarama and the Guadarrama. The regularity is produced by the influence of Cretaceous aquifers in the headwaters of the river, which contribute to its consistent flow [33]. The natural loss of flow regularity is further accelerated by the excessive water use in the basin’s lower reaches. In the water bodies located at the end of the study area, the key issue is the reduction in flow compared to natural conditions [44].
An improvement in the environmental flow proposal of the Tagus Hydrological Plan could offer a solution to some of these challenges. Improvements can be directed at increasing flow magnitudes in areas where flows are significantly reduced and better defining, in magnitude and duration, other altered components of the flow regime.
However, the current Tagus Hydrological Plan [20] fails to meet the requirement to propose maximum flows. Maximum flows are only defined in the Almoguera reservoir, at an unusually high value of 125.0 m3/s, which is never reached. This does not help regulate the high discharges in the first sections of the river during summer, downstream of the major headwater reservoirs. Additionally, the current environmental flow regime, with its reduced values and minimal seasonal variation, fails to resolve the alterations observed in the water bodies downstream of the Jarama.
To improve the river’s environmental recovery, it is essential to align planning and management proposals for storage infrastructures, particularly dam releases. Environmental considerations should include a flow regime tailored to the specific issues of each river section [54,55,56], aimed at minimizing ecological impacts. This adaptation involves measuring alterations in each case [15,56,57] to identify and address the most severely altered characteristics with appropriate corrective measures.
Monitoring the compliance with a more rigorous flow regime, such as those outlined in Table 4, along with a proposal for maximum flows that limits their magnitude and duration, can reduce the hydrological alteration in this section. After implementing these measures, it will be crucial to monitor their impact on biological populations that are in a poor conservation status, ensuring these measures genuinely contribute to the improvement of the ecological status of these water bodies.
5. Conclusions
The analysis of hydrological alteration does not reveal a clear trend in the type of alteration along the Tagus River axis from upstream to downstream. However, it does identify two distinct groups of river sections, each characterized by a predominant type of alteration.
The first group, comprising the four headwater water bodies, is mainly affected by a reversal of the natural flow regime. This is marked by high summer flows driven by irrigation demands. In contrast, in the second group, which corresponds particularly to the last seven masses downstream, the most notable alteration is the ratio and frequency of change in hydrological conditions.
To address these issues, two types of hydrological management strategies have been proposed. The first involves limiting maximum flows in terms of both magnitude and duration, targeting the high summer flows that impact the headwater group. The second strategy aims to restore more natural seasonal flow patterns by enhancing seasonal flow variability. This last approach is intended to mitigate the impact on the downstream group, comprising the last eight water bodies in the study.
Author Contributions
Formal analysis, D.B. and A.A.; investigation, D.B. and A.A.; methodology, D.B. and D.G.d.J.; supervision, D.B. and A.A.; validation, D.G.d.J.; writing—original draft, D.B.; writing—review and editing, D.G.d.J. All authors have read and agreed to the published version of the manuscript.
Funding
This research received no external funding.
Data Availability Statement
The data that support the findings of this study are openly available in the following. Data from the gauging stations have been obtained from https://ceh.cedex.es/anuarioaforos/default.asp (accessed on 12 April 2025). Natural flows restored with the hydrological model have been obtained from https://www.miteco.gob.es/es/agua/temas/evaluacion-de-los-recursos-hidricos/evaluacion-recursos-hidricos-regimen-natural.html (accessed on 12 April 2025). The official environmental flow proposal has been obtained from Confederación del Tajo, accessible at https://www.chtajo.es/LaCuenca/Planes/PlanHidrologico/Planif_2021-2027/Documents/PHT_2021-2027/PHT2227_An05_CaudalesEcologicos_Ap01_Caracterizaci%C3%B3n_Dic22.pdf (accessed on 12 April 2025). The rest of the data, models, or code that support the findings of this study are available from the corresponding author upon reasonable request.
Conflicts of Interest
The authors declare no conflicts of interest.
References
- Poff, N.L.; Allan, J.D.; Bain, M.B.; Karr, J.R.; Prestegaard, K.L.; Richter, B.D.; Sparks, R.E.; Stromberg, C. The Natural Flow Regime. A paradigm for river conservation and restoration. BioScience 1997, 47, 769–784. [Google Scholar] [CrossRef]
- Arthington, A.H. Environmental flows: Ecological importance, methods and lessons from Australia. In Mekong Dialogue Workshop. International Transfer of River Basin Development Experience: Australia and the Mekong Region. 2 September 2002. [Google Scholar]
- Bunn, S.E.; Arthington, A. Basic principles and ecological consequences of altered flow regimes for acuatic biodiversity. Environ. Manag. 2002, 30, 492–507. [Google Scholar] [CrossRef] [PubMed]
- Naiman, R.J.; Bunn, S.E.; Nilsson, C.; Petts, G.E.; Pinay, G.; Thompson, L.C. Legitimizing Fluvial Ecosystems as Users of Water: An Overview. Environ. Manag. 2002, 30, 455–467. [Google Scholar] [CrossRef] [PubMed]
- Nilsson, C.; Svedmark, M. Basic principles and ecological consecuences of changing water regimes: Riparian plant communities. Environ. Manag. 2002, 30, 468–480. [Google Scholar] [CrossRef]
- WFD. Water Frame Directive 2000/60/EC of the European Parliament and of the Council Establishing a Framework for Community Action in the Field of Water Policy; Water Framework Directive: Brussels, Belgium, 2000. [Google Scholar]
- Ministerio Para la Transición Ecológica. “Protocolo de Caracterización Hidromorfológica de Masas de Agua de la Categoría Ríos” y “Protocolo Para el Cálculo de Métricas de los Indicadores Hidromorfológicos de Las Masas de Agua Categoría Río”; CÓDIGO: MET-R-HMF-2019; 22 de Abril de 2019; Ministerio para la Transición Ecológica: Madrid, Spain, 2019. [Google Scholar]
- Arthington, A.H. Wounded Rivers, Thirsty Land: Getting Water Management Right. Inaugural Professorial Lecture; Griffith University: Nathan, Australia, 1997. [Google Scholar]
- Richter, B.D.; Baumgartner, J.V.; Braun, D.P.; Powell, J. A spatial assessment of hydrologic alteration within a river network. Regul. Rivers Res. Manag. 1998, 14, 329–340. [Google Scholar] [CrossRef]
- Black, A.R.; Rowan, J.S.; Duck, R.W.; Bragg, O.M.; Clelland, B.E. DHRAM: A method for classifying river flow regime alterations for the EC Water Framework Directive. Aquat. Conserv. Mar. Freshw. Ecosyst. 2005, 15, 427–446. [Google Scholar] [CrossRef]
- Richter, B.D.; Baumgartner, J.V.; Wigington, R.; Braun, D.P. How much water does a river need? Freshw. Biol. 1997, 37, 231–249. [Google Scholar] [CrossRef]
- Olden, J.D.; Poff, N.L. Redundancy and the choice of Hydrologic Indices for characterizing streamflow regimes. River Res. Appl. 2003, 19, 101–121. [Google Scholar] [CrossRef]
- Baeza, D.; García de Jalón, D. Characterisation of streamflow regimes in central Spain, based on relevant Hydrobiological parameters. J. Hydrol. 2005, 310, 266–279. [Google Scholar] [CrossRef]
- Bejarano, M.D.; Marchamalo, M.; García de Jalón, D.; González del Tánago, M. Flow regime patterns and their controlling factors in the Ebro basin (Spain). J. Hydrol. 2010, 385, 323–335. [Google Scholar] [CrossRef]
- Solans, M.A.; Poff, N.L. Classification of Natural Flow Regimes in the Ebro Basin (Spain) by using a wide Range of Hydrologic Parameters. River Res. Appl. 2013, 29, 1147–1163. [Google Scholar] [CrossRef]
- Belmar, O.; Velasco, J.; Martínez Capel, F. Hydrological Classification of Natural Flow Regimes to Support Environmental Flow Assessments in Intensively Regulated Mediterranean Rivers, Segura River Basin (Spain). Environ. Manag. 2011, 47, 992–1004. [Google Scholar] [CrossRef] [PubMed]
- Santa-María, C.M.; Fernández Yuste, J.A. IAHRIS Índices de Alteración Hidrológica en Ríos. Manual de Referencia Metodológica; Versión 1; Dirección Generald el Agua (Ministerio de Medio Ambiente): Madrid, Spain, 2008. [Google Scholar]
- San Martín, E.; Larraz, B.; Gallego, M.S. When the river does not naturally flow: A case study of unsustainable management in the Tagus River (Spain). Water Int. 2020, 45, 189–221. [Google Scholar] [CrossRef]
- Bolinches, A.; De Stefano, L.; Paredes-Arquiola, J. Designing river water quality policy interventions with scarce data: The case of the Middle Tagus Basin, Spain. Hydrol. Sci. J. 2020, 65, 749–762. [Google Scholar] [CrossRef]
- OPH-CHTajo. Plan Hidrológico de la Parte Española de la Demarcación Hidrográfica del Tajo. Revisión de Tercer Ciclo (2022–2027). Memoria; Ministerio para la Transición Ecológica y el Reto Demográfico: Madrid, Spain, 2023. [Google Scholar]
- San Martín González, E.; Larraz Iribas, B.; Hernández-Mora, N.; Gallego Bernad, M.S. La Gestión Insostenible del río Tajo; Universidad de Barcelona: Barcelona, Spain, 2015; ISSN 1138-9796. Available online: http://www.ub.es/geocrit/b3w-1133.pdf (accessed on 11 April 2025).
- Mezger, G.; González del Tánago, M.; De Stefano, L. Environmental flows and the mitigation of hydrological alteration downstream from dams: The Spanish case. J. Hydrol. 2020, 598, 125732. [Google Scholar] [CrossRef]
- Álvarez, J.; Sánchez, A.; Quintas, L. SIMPA, a GRASS based tool for Hydrological Studies. In Proceedings of the FOSS/GRASS Users Conference, Bangkok, Thailand, 12–14 September 2004. [Google Scholar]
- Estrela, T.; Quintas, L. A distributed hydrological model for water resources assessment in large basins. In Proceedings of the RIVERTECH 96: 1st International Conference on New/Emerging Concepts for Rivers, Chicago, IL, USA, 22–26 September 1996; IWRA: Chicago, IL, USA. [Google Scholar]
- Estrela, T.; Cabezas, F.; Estrada, F. La evaluación de los recursos hídricos en el Libro Blanco del Agua en España. Ing. Agua 1999, 6, 125–138. [Google Scholar] [CrossRef]
- HPR. The Instruction for Hydrologic Planning; Spanish Environment Ministry: Madrid, Spain, 2008. [Google Scholar]
- MITECO. Guide to Environmental Flows; Ministero para la Transición Ecológica: Madrid, Spain, 2009. [Google Scholar]
- Quintas Ripoll, L. Clasificación hidrográfica de los ríos de España. Rev. Digit. Cedex 2016, 182, 5. [Google Scholar]
- Acreman, M.C.; Dunbar, M.J. Defining environmental river flow requirements—A review. Hydrol. Earth Syst. Sci. 2014, 8, 861–876. [Google Scholar] [CrossRef]
- Acreman, M.C.; Ferguson, A.J.D. Environmental Flows and the European Water Framework Directive. Freshw. Biol. 2010, 55, 32–48. [Google Scholar] [CrossRef]
- Baeza, D. Caracterización del Régimen Ecológico de Caudales en Ríos de la Cuenca del Tajo Basado en su Regionalización Hidrobiológica. Ph.D. Thesis, Departamento de Ingeniería Forestal, ETSI de Montes Universidad Politécnica Madrid, Madrid, Spain, 2002. [Google Scholar]
- Baeza, D.; García de Jalón, D. Calculo de caudales de mantenimiento en Ríos de la cuenca del Tajo a partir de variables climáticas y de sus cuencas. Limnética 1999, 16, 69–84. [Google Scholar] [CrossRef]
- Baeza, D.; García de Jalón, D. Basin influence on natural variability of rivers in semi-arid environments. J. River Basin Manag. 2005, 3, 247–259. [Google Scholar]
- Alcázar, J.; Palau, A. Establishing environmental flow regimes in a Mediterranean watershed based on a regional classification. J. Hydrol. 2010, 388, 41–51. [Google Scholar] [CrossRef]
- Alonso-González, C.; Gortázar, J.; Baeza, D.; García de Jalón, D. Dam function rules based on brown trout flow requirements: Design of environmental flow regimes in regulated streams. Hydrobiologia 2008, 609, 253–262. [Google Scholar] [CrossRef]
- Boavida, I.; Santos, J.M.; Ferreira, T.; Pinheiro, A. Barbel habitat alterations due to hydropeaking. J. Hydro-Environ. Res. 2015, 9, 237–247. [Google Scholar] [CrossRef]
- Knight, R.; Murphy, J.C.; Wolfe, W.J.; Saylor, C.F.; Wales, A.K. Ecological limit functions relating fish community response to hydrologic departures of the ecological flow regime in the Tennessee River basin, United States. Ecohydrology 2014, 7, 1262–1280. [Google Scholar] [CrossRef]
- Tudorache, C.; Viaene, P.; Blust, R.; Vereecken, H.; De Boeck, G. A comparison of swimming capacity and energy use in seven European freshwater fish species. Ecol. Freshw. Fish 2008, 17, 284–291. [Google Scholar] [CrossRef]
- Mateus, C.S.; Quintella, B.R.; Almeida, P.R. The critical swimming speed of Iberian barbel Barbus bocagei in relation to size and sex. J. Fish Biol. 2008, 73, 1783–1789. [Google Scholar] [CrossRef]
- Sanz-Ronda, F.J.; Bravo-Córdoba, F.J.; Fuentes-Pérez, J.F.; Castro-Santos, T. Ascent ability of brown trout, Salmo trutta, and two Iberian cyprinids—Iberian barbel, Luciobarbus bocagei, and northern straight-mouth nase, Pseudochondrostoma duriense—In a vertical slot fishway. Knowl. Manag. Aquat. Ecosyst. 2016, 417, 10. [Google Scholar] [CrossRef]
- Martínez-Capel, F.; García de Jalón, D.; Werentzky, D.; Baeza Sanz, D.; Rodilla-Alamá, M. Microhabitat use by three endemic Iberian cyprinids in Mediterranean rivers (Tagus river basin, Spain). Fish. Manag. Ecol. 2009, 16, 52–60. [Google Scholar] [CrossRef]
- Steffler, P.; Blackburn, J. River2D: Two-Dimensional Depth Averaged Model of River Hydrodynamics and Fish Habitat. In Introduction to Depth Averaged Modeling and User’s Manual; University of Alberta: Edmonton, AB, Canada, 2002. [Google Scholar]
- Baeza, D.; Larraz, B.; Chacón, P. Proposal for analysis of minimum ecological flow regimes based on the achievement of technical and environmental objectives: Tagus River basin case study (Spain). Environ. Earth Sci. 2025, 84, 26. [Google Scholar]
- Leone, M.; Gentil, F.; Lo Porto, A.; Ricci, G.F.; De Girolamo, A.M. Ecological flow in southern Europe: Status and trends in non-perennial rivers. J. Environ. Manag. 2023, 342, 118097. [Google Scholar] [CrossRef] [PubMed]
- González del Tánago, M.; Martínez-Fernández, V.; García de Jalón, D. Diagnosing problems produced by flow regulation and other disturbances in Southern European Rivers: The Porma and Curueño Rivers [Duero Basin, NW Spain]. Aquat. Sci. 2016, 78, 121–133. [Google Scholar] [CrossRef]
- Rivaes, R.; Boavida, I.; Santos, J.M.; Pinheiro, A.N.; Ferreira, T. Importance of considering riparian vegetation requirements for the long-term efficiency of environmental flows in aquatic microhabitats Hydrol. Earth Syst. Sci. 2017, 21, 5763–5780. [Google Scholar] [CrossRef]
- Merritt, D.M.; Scott, M.L.; Poff, N.L.; Auble, G.T.; Lytle, D.A. Theory, methods and tools for determining environmental flows for riparian vegetation: Riparian vegetation-flow response guilds. Freshw. Biol. 2010, 55, 206–225. [Google Scholar] [CrossRef]
- Salvador, A. Barbo común—Luciobarbus bocagei. In Enciclopedia Virtual de los Vertebrados Españoles; Sanz, J.J., Elvira, B., Eds.; Museo Nacional de Ciencias Naturales: Madrid, Spain, 2017; Available online: http://www.vertebradosibericos.org/ (accessed on 11 April 2025).
- Doadrio, I.; Perea, S.; Garzón-Heydt, P.; González, J.L. Ictiofauna Continental Española. Bases para su Seguimiento; Dirección General Medio Natural y Política Forestal, Ministerio de Medio Ambiente y Medio Rural y Marino: Madrid, Spain, 2011; p. 610. [Google Scholar]
- García Bautista, A.; Baeza, D.; Herrera, T.; La Calle, A.; Martínez, J. Los caudales ecológicos en el olvido en la Red Natura 2000. Quercus 2021, 427, 34–35. [Google Scholar]
- Gallego, M.S. Las Sentencias del Tribunal Supremo Sobre el Incumplimiento Por el Plan Hidrologico del Tajo de 2016 de la Regulación Sobre Caudales Ecológicos y Objetivos Medioambientales. Gabilex (18). Revista del Gabinete Jurídico de Castilla-La Mancha, 2019. Available online: https://dialnet.unirioja.es/servlet/articulo?codigo=7053184 (accessed on 12 April 2025).
- Elvira, B.; Almodóvar, A.; Nicola, G.G. Fish communities of the middle-upper Tagus River (central Spain): A story of river regulation and exotic introductions. Pol. Arch. Hydrobiol. 1998, 45, 165–171. [Google Scholar]
- Doadrio, I.; Garzón, P.; Alvarez, J.; Barrachina, P. La distribución de Barbus bocagei Steindachner, 1865 (Ostariophysi: Cyprinidae) en la Península Ibérica. Doñana Acta Vertebr. 1987, 14, 125–131. [Google Scholar]
- Fornaroli, R.; Muñoz-Mas, R.; Martínez-Capel, F. Fish community reponses to antedecent hydrological conditions based on long-term data in Meditrranean river basins [Iberian Peninsula]. Sci. Total Environ. 2020, 728, 138052. [Google Scholar] [CrossRef]
- Owusu, A.; Mul, M.; van der Zaag, P.; Slinger, J. Re-operating dams for environmental flows: From recommendation to practice. River Res. Appl. 2020, 37, 176–186. [Google Scholar] [CrossRef]
- Piqué, G.; Batalla, R.J.; Sabater, S. Hydrological characterization of dammed rivers in the NW Mediterranean region. Hydrol. Process. 2016, 30, 1691–1707. [Google Scholar] [CrossRef]
- Peñas, F.J.; Barquín, J.; Snelder, T.H.; Booker, D.J.; Álvarez, C. The influence of methodological procedures on hydrological classification performance. Hydrol. Earth Syst. Sci. 2014, 18, 3393–3409. [Google Scholar] [CrossRef]
Disclaimer/Publisher’s Note: The statements, opinions and data contained in all publications are solely those of the individual author(s) and contributor(s) and not of MDPI and/or the editor(s). MDPI and/or the editor(s) disclaim responsibility for any injury to people or property resulting from any ideas, methods, instructions or products referred to in the content. |
© 2025 by the authors. Licensee MDPI, Basel, Switzerland. This article is an open access article distributed under the terms and conditions of the Creative Commons Attribution (CC BY) license (https://creativecommons.org/licenses/by/4.0/).

