Article

Monitoring the Permeability and Evaluating the Impact of Cleaning on Two Permeable Pavement Systems

1
Department of Agricultural and Biological Engineering, University of Illinois at Urbana-Champaign, 1304 W. Pennsylvania Avenue, Urbana, IL 61801, USA
2
JW Eco-Technology, Ding Tai Co., Ltd., No. 23, Ln. 123, Junying Street, Shulin District, New Taipei City 23878, Taiwan
*
Author to whom correspondence should be addressed.
Water 2025, 17(14), 2140; https://doi.org/10.3390/w17142140
Submission received: 9 June 2025 / Revised: 4 July 2025 / Accepted: 15 July 2025 / Published: 18 July 2025
(This article belongs to the Special Issue Urban Water Management: Challenges and Prospects)

Abstract

Permeable pavement is an alternative to conventional impermeable pavement for various applications. However, a common issue with permeable pavement is clogging over time. Permeability is a parameter that reflects the capacity of the pavement to reduce surface runoff; a decline in permeability implies the occurrence of clogging. In this study, permeability data collected on pervious concrete (PC) and JW Eco-Technology (JW) revealed that JW maintained consistent permeability over time. However, PC displayed reduced values, and several locations along the edges had zero permeability, despite no regular vehicular and pedestrian use. Therefore, a portable pressure washer was used to clean the pavements. The cleaning procedure was able to recover the permeability of the areas that showed signs of clogging (0 to 2.69 cm/s) and restore the permeability of PC up to 4.60–5.58 cm/s for corner and center areas, respectively. Moreover, visual inspection using a borescope further revealed the full function of the JW pores (aqueducts), regardless of cleaning. Regardless, it is recommended that periodic cleaning maintenance be performed for both PC and JW using a pressure washer due to its convenience and efficacy, which will be discussed.

1. Introduction

Various types of pavements have commonly replaced natural cover to meet land use preferences and accommodate the demands of economic growth, mostly due to urbanization [1,2,3,4,5,6]. Historically, pavements have consisted of tightly sealed impermeable concrete or asphalt materials, which are impervious surfaces that prevent water infiltration, increase surface water pollution, and may increase the risk of urban heat island effects [7,8,9,10]. In contrast with pavements that are impermeable, permeable pavements have a porous surface to allow surface runoff to infiltrate into the underlying soil. The porous structure aids in filtering pollutants like sediment, heavy metals, and oils from water as it percolates through the pavement into the underlying gravel and soil [8,9,10,11,12]. It has also been reported that, in cold climates, permeable pavement is more resistant to freezing compared with impermeable pavement [13]. As a sustainable and green infrastructure strategy, permeable pavement systems are important in modern cities. Permeable pavement uses vary; however, they can be implemented in both urban and residential areas for parking lots, sidewalks, driveways, low-traffic areas, shoulders, and bike lanes to help manage stormwater and reduce surface runoff [8,10,12,14,15,16,17]. When used on commercial and industrial sites, they can be installed in warehouse and shopping center parking lots to comply with environmental regulations that seek to avoid groundwater contamination and ponding and with local stormwater management ordinances [18].
However, the application of permeable pavement systems also comes with some challenges. The porous nature of permeable pavement systems means that they have structural load limitations. These systems are not currently suitable for high-traffic roadways or heavy-load applications without substantial reinforcement to accommodate heavy-load scenarios [11,16]. Moreover, permeable pavements may be prone to clogging over time, depending on the structure of the pores, as accumulation of debris, sediments, or organic matter can reduce permeability over time [11,15,16,19,20,21,22,23,24,25,26,27,28,29,30,31]. Therefore, the effect of restoring the permeability of pavements has been studied to better understand its effect on permeability and pavement lifespan. For example, to restore permeability, various cleaning methods can be used in a variety of applications; manual removal, street sweeping, vacuuming, high-pressure washing, or milling can be performed because these are widely used in sidewalks, parking lots, and low-traffic urban areas for a wide range of applications [20]. For materials such as permeable interlocking concrete pavers (PICPs), which are commonly found in pedestrian walkways, driveways, and plazas, the methods of cleaning include vacuuming, pressurized water or air, vibration, and self-cleaning materials [26]. Table 1 summarizes studies on the permeability of multiple types of permeable pavements and the associated cleaning and maintenance practices.
As indicated in Table 1, depending on the applications and pavement types, most pavement systems encountered loss of infiltration capacity over time, indicating the existence of clogging. However, permeability measurements demonstrated partial to full recovery after appropriate maintenance and cleaning. Previously reported cleaning procedures included routine tasks like the use of a portable pressure washer or vacuum device, or something more intensive and permanent like removing a layer of the pavement surface through milling. These studies are examples that provide useful reference information. Meanwhile, this also reveals the importance of the routine monitoring of pavement permeability in conjunction with a cleaning plan for the various types of permeable pavement, especially for those pavement systems that are available but less documented.
Permeability data have been collected at the Permeable Pavement Project (P3) study site at the University of Illinois Urbana–Champaign (UIUC) since 2018 for two permeable pavement systems, PC and the patented JW, using adapted square frame methods, with the results indicating the existence of clogging [15,31]. While PC has been widely used for various applications, the first and the only construction of JW in the USA was at the P3 study site. JW has been listed in manuals of a low embodied-carbon building rating system and in technical regulations [32,33], but there is limited research literature on the long-term monitoring of its permeability, and there remains a lack of a cleaning plan for JW.
This study explored the permeability of PC and JW and the impact of a cleaning procedure on the two pavement systems 7 years after their installation. Surface runoff water percolates down to the subsurface layer through voids randomly distributed in the PC surface layer, but JW contains aqueducts constructed of recycled polypropylene (PP) that provide open and direct pathways for surface runoff water to be transported vertically to the subsurface layers. The impacts on the permeability due to differences in structure and pore distribution between PC and JW will also be discussed with the aid of visual observations.

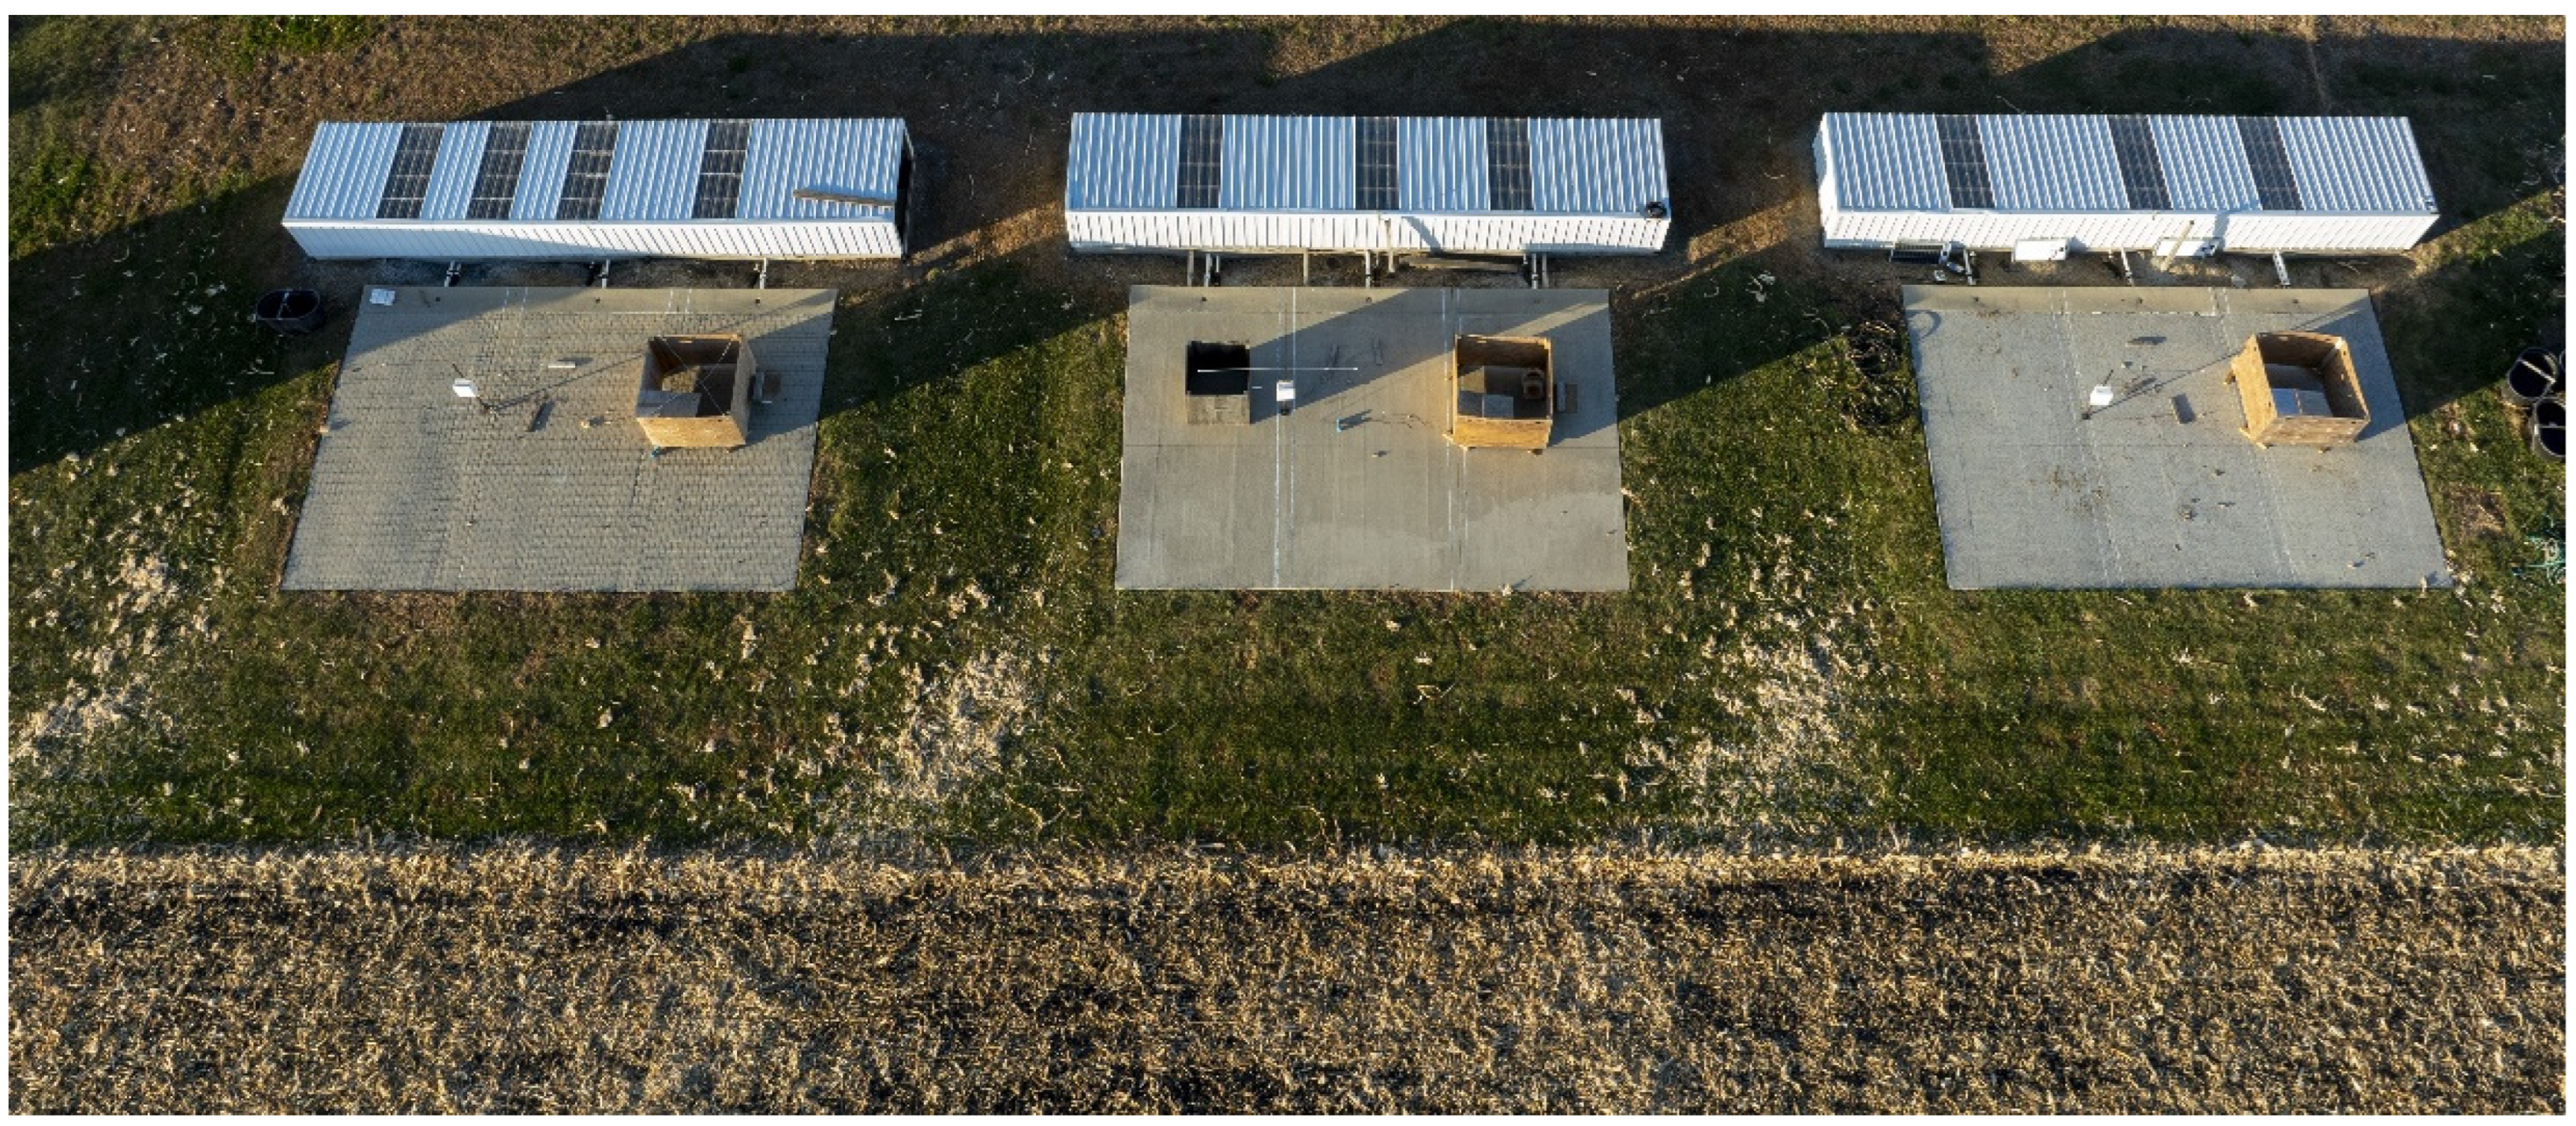
2. Methods and Experimental Design

This study was conducted at the Permeable Pavement Project (P3) research site at UIUC. Briefly, the P3 site consists of three different pavements installed in triplicate; two of the pavement systems discussed in this study are permeable pavement systems, PC and JW, and one is conventional impermeable concrete (IC). All three pavements were installed with a commercial concrete contractor using standard methods. Each pavement pad is approximately the size of a one-car driveway and contains a 2% slope to meet typical installation requirements for residential areas in the U.S. The P3 site has been located in an open area since its installation in November 2016. Figure 1 shows an overview of the P3 site taken by a drone. The three pavement systems were established in a grass field. The comparatively dry area at the bottom of the photo was a farmland after corn harvesting. The full details of the study site and historical permeability measurements have been published previously by this research team [15,31]. As this study will discuss PC and JW, the surface structure and conditions of the two systems will be shown in later sections.

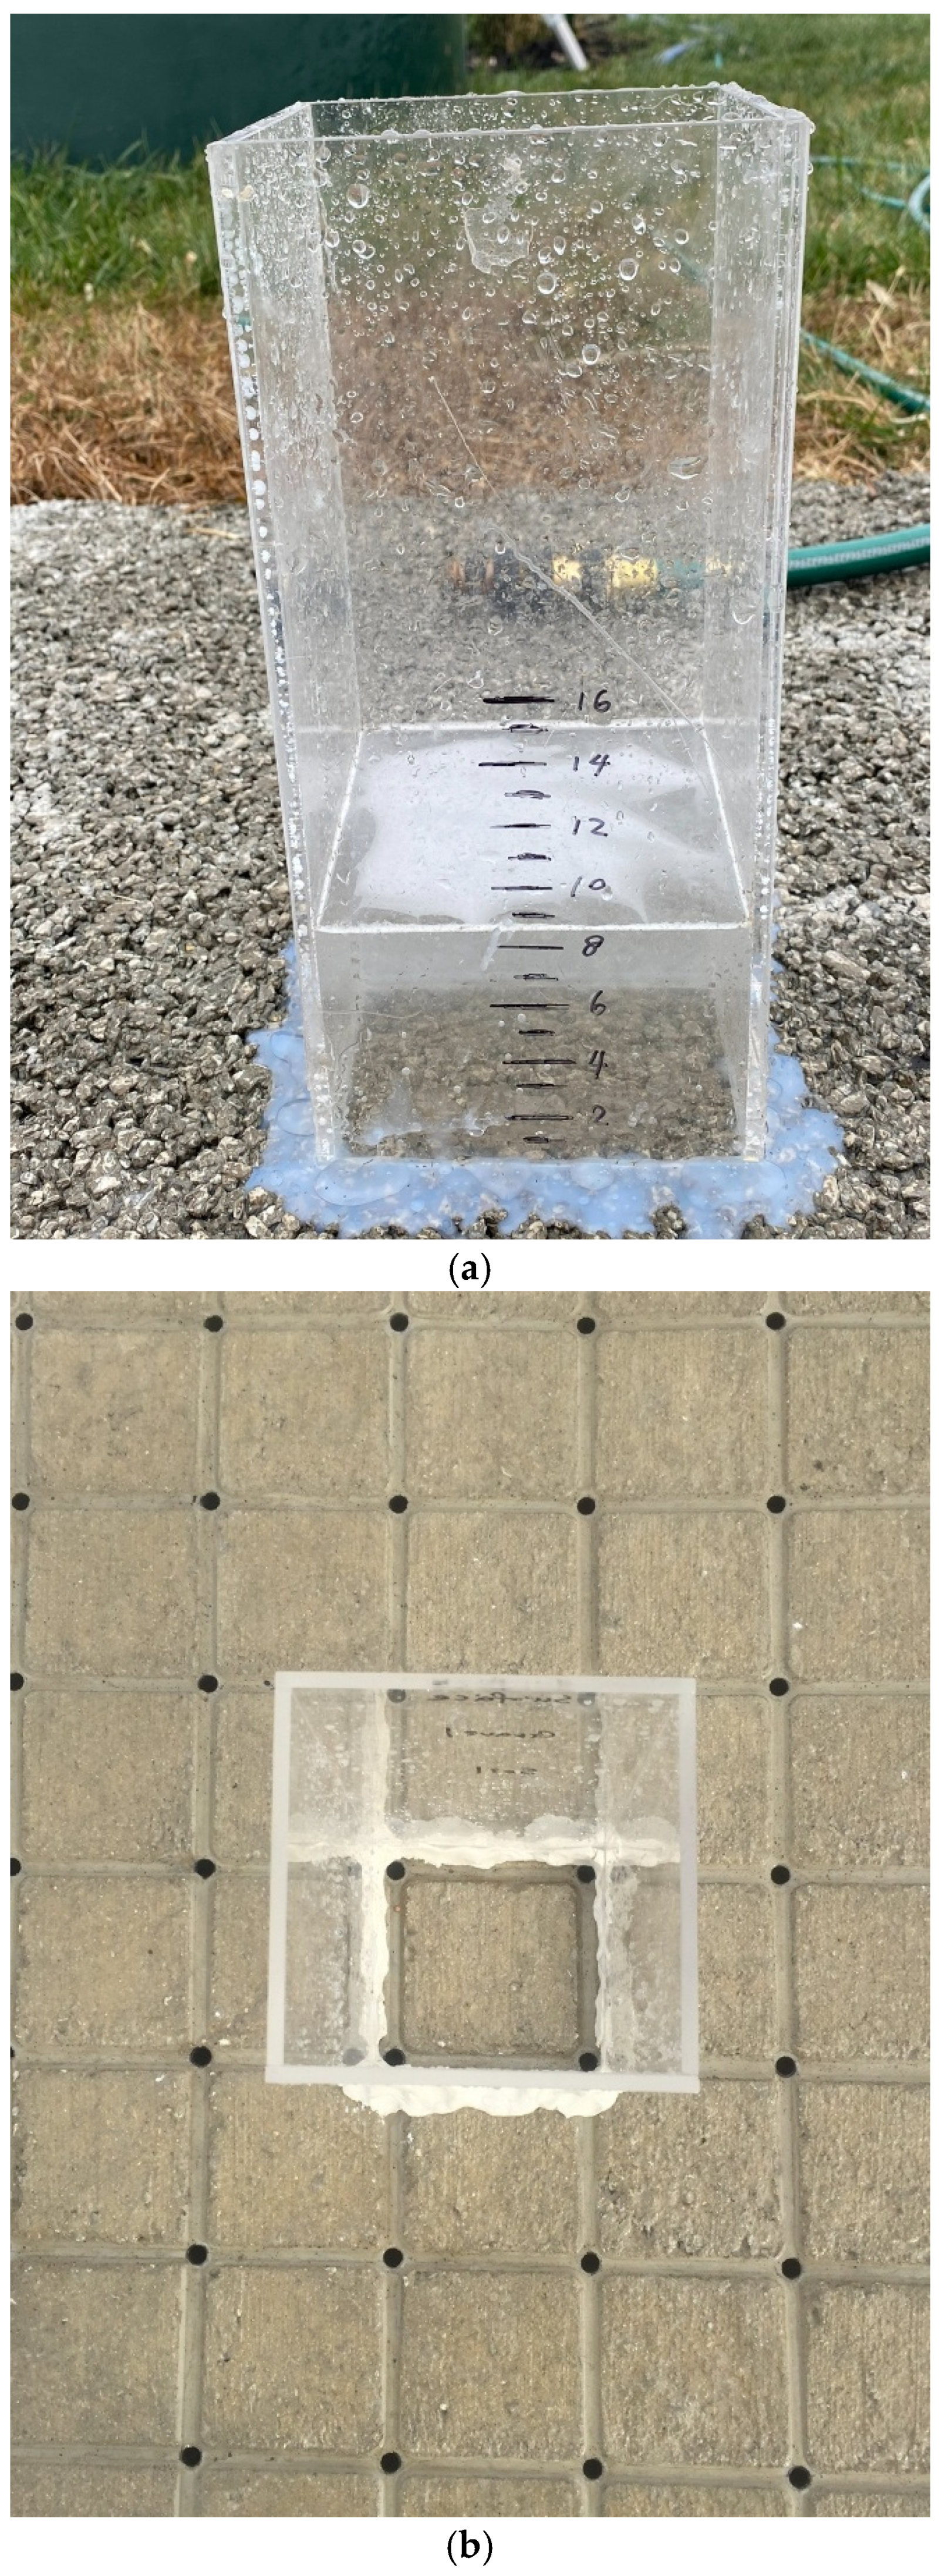
2.1. Permeability Measurement

The permeability of the pavements was measured using the SF-4 square frame method [15,31], including regular monitoring during 2020 and 2024 before cleaning, and the two sets of measurements that were performed after cleaning, one in September 2024 and the other in April 2025. The SF-4 and SF-9 square frame methods were developed and adapted from the National Center for Asphalt Technology (NCAT) design [34] and ASTM International (formerly American Society for Testing and Materials) standard [35], respectively. In addition, SF-4 covered four JW aqueduct openings, while SF-9 included nine within permeability test areas [15]. While both methods were effective and practical for measuring permeability on PC and JW according to previous studies, SF-4 was selected for use in this study because it can be performed faster, and far less water is consumed (<2.0 kg vs. 3.6 kg or 18.0 kg using SF-9 per measurement) [31]. The base area of SF-4 was 165 cm2 and included four JW aqueduct openings within the test area, as shown in Figure 2.
The detailed operation procedures can be found in the aforementioned articles. It should be noted, though, that the falling-head-based permeability equation followed the NCAT permeameter method, which is based on Darcy’s Law [34] and is shown in the following Equation (1):
K = a L A t × ln h 1 h 2 ,
where K = coefficient of permeability, cm/s; L = depth of the surface layer, cm; h1 = initial head (upper water column), cm; h2 = final head (lower water column), cm; and t = time required for water draining from h1 to h2, s. As the inside cross-sectional area of the device (a) and the cross-sectional area of the test area (A) were the same, the simpler form of Equation (1) can be expressed as the following Equation (2):
K = L t × ln h 1 h 2

2.2. Pavement Maintenance, Cleaning, and Operation Process

As mentioned by Chen et al., routine cleaning methods for approximately the first 8 years of study for JW, which is investigated in this study, included manual cleaning with a stick, leaf blower, and routine visual maintenance [15]. However, these methods of cleaning were only practical because of the small size of the triplicate pads at the P3 site. Therefore, a more thorough cleaning method suitable for both PC and JW was needed. The compact size and portability of a pressure washer made it ideal for maneuvering around the three small test sites, allowing for consistent and thorough cleaning. Hotsy EP-30100’s portability and access to power make it a convenient cleaning method for this triplicate test site. Therefore, pressure washing was selected for this study due to its effectiveness and practicality for both small test sites and larger paved areas. To evaluate the effect of cleaning on permeable pavement performance, a Hotsy EP-301009D 120V Electric Cold Water pressure washer manufactured by Hotsy (Aurora, CO, USA), was used to remove accumulated debris and sediment from the pavement surface. Designed for industrial and commercial use, the device is equipped with a 1.47 kW (2 HP) motor and a Hotsy HE2825S.1 DIRECT pump that produces 6.895 × 10⁶ kg/m.s2 (1000 psi) of pressure. The pressure washer was connected to a 120-volt outlet on-site. A hose was routed from the nearest faucet to the pavement site and attached to the pressure washer to supply water at a rate of 11.35 L/min (3.0 gallons per minute) for cleaning. As specific spray tips designed to produce a specific spray angle affected the pressure and coverage area, a 25° Green-Nozzle was selected for PC and JW to ensure the proper cleaning pressure of the pavement system based on the scale of the pavement pad.
The cleaning process was conducted on the designated test locations over PC and JW on the southernmost quarter, as there were other experiments on the northern half of the pavement. The dimensions of each of the surface areas for cleaning were 10.7 m (32 ft) by 1.5 m (5 ft), forming a strip across the triplicates on the south side. The total size of the cleaned area was one quarter of the total pavement pad. The selection of the area for cleaning also considered the locations where regular permeability tests were performed.
Three minutes were allocated for cleaning the designated areas on each triplicate. This duration was chosen to allow sufficient time for debris removal over the designated areas while minimizing water consumption. However, additional passes were made, as needed, based on previous permeability measurements and observations made while performing the maintenance. More details about the use of the portable pressure washer and observations made during the cleaning process will be discussed later. Figure 3 shows the pressure washer and demonstrates an example of the cleaning operation on the pavement.

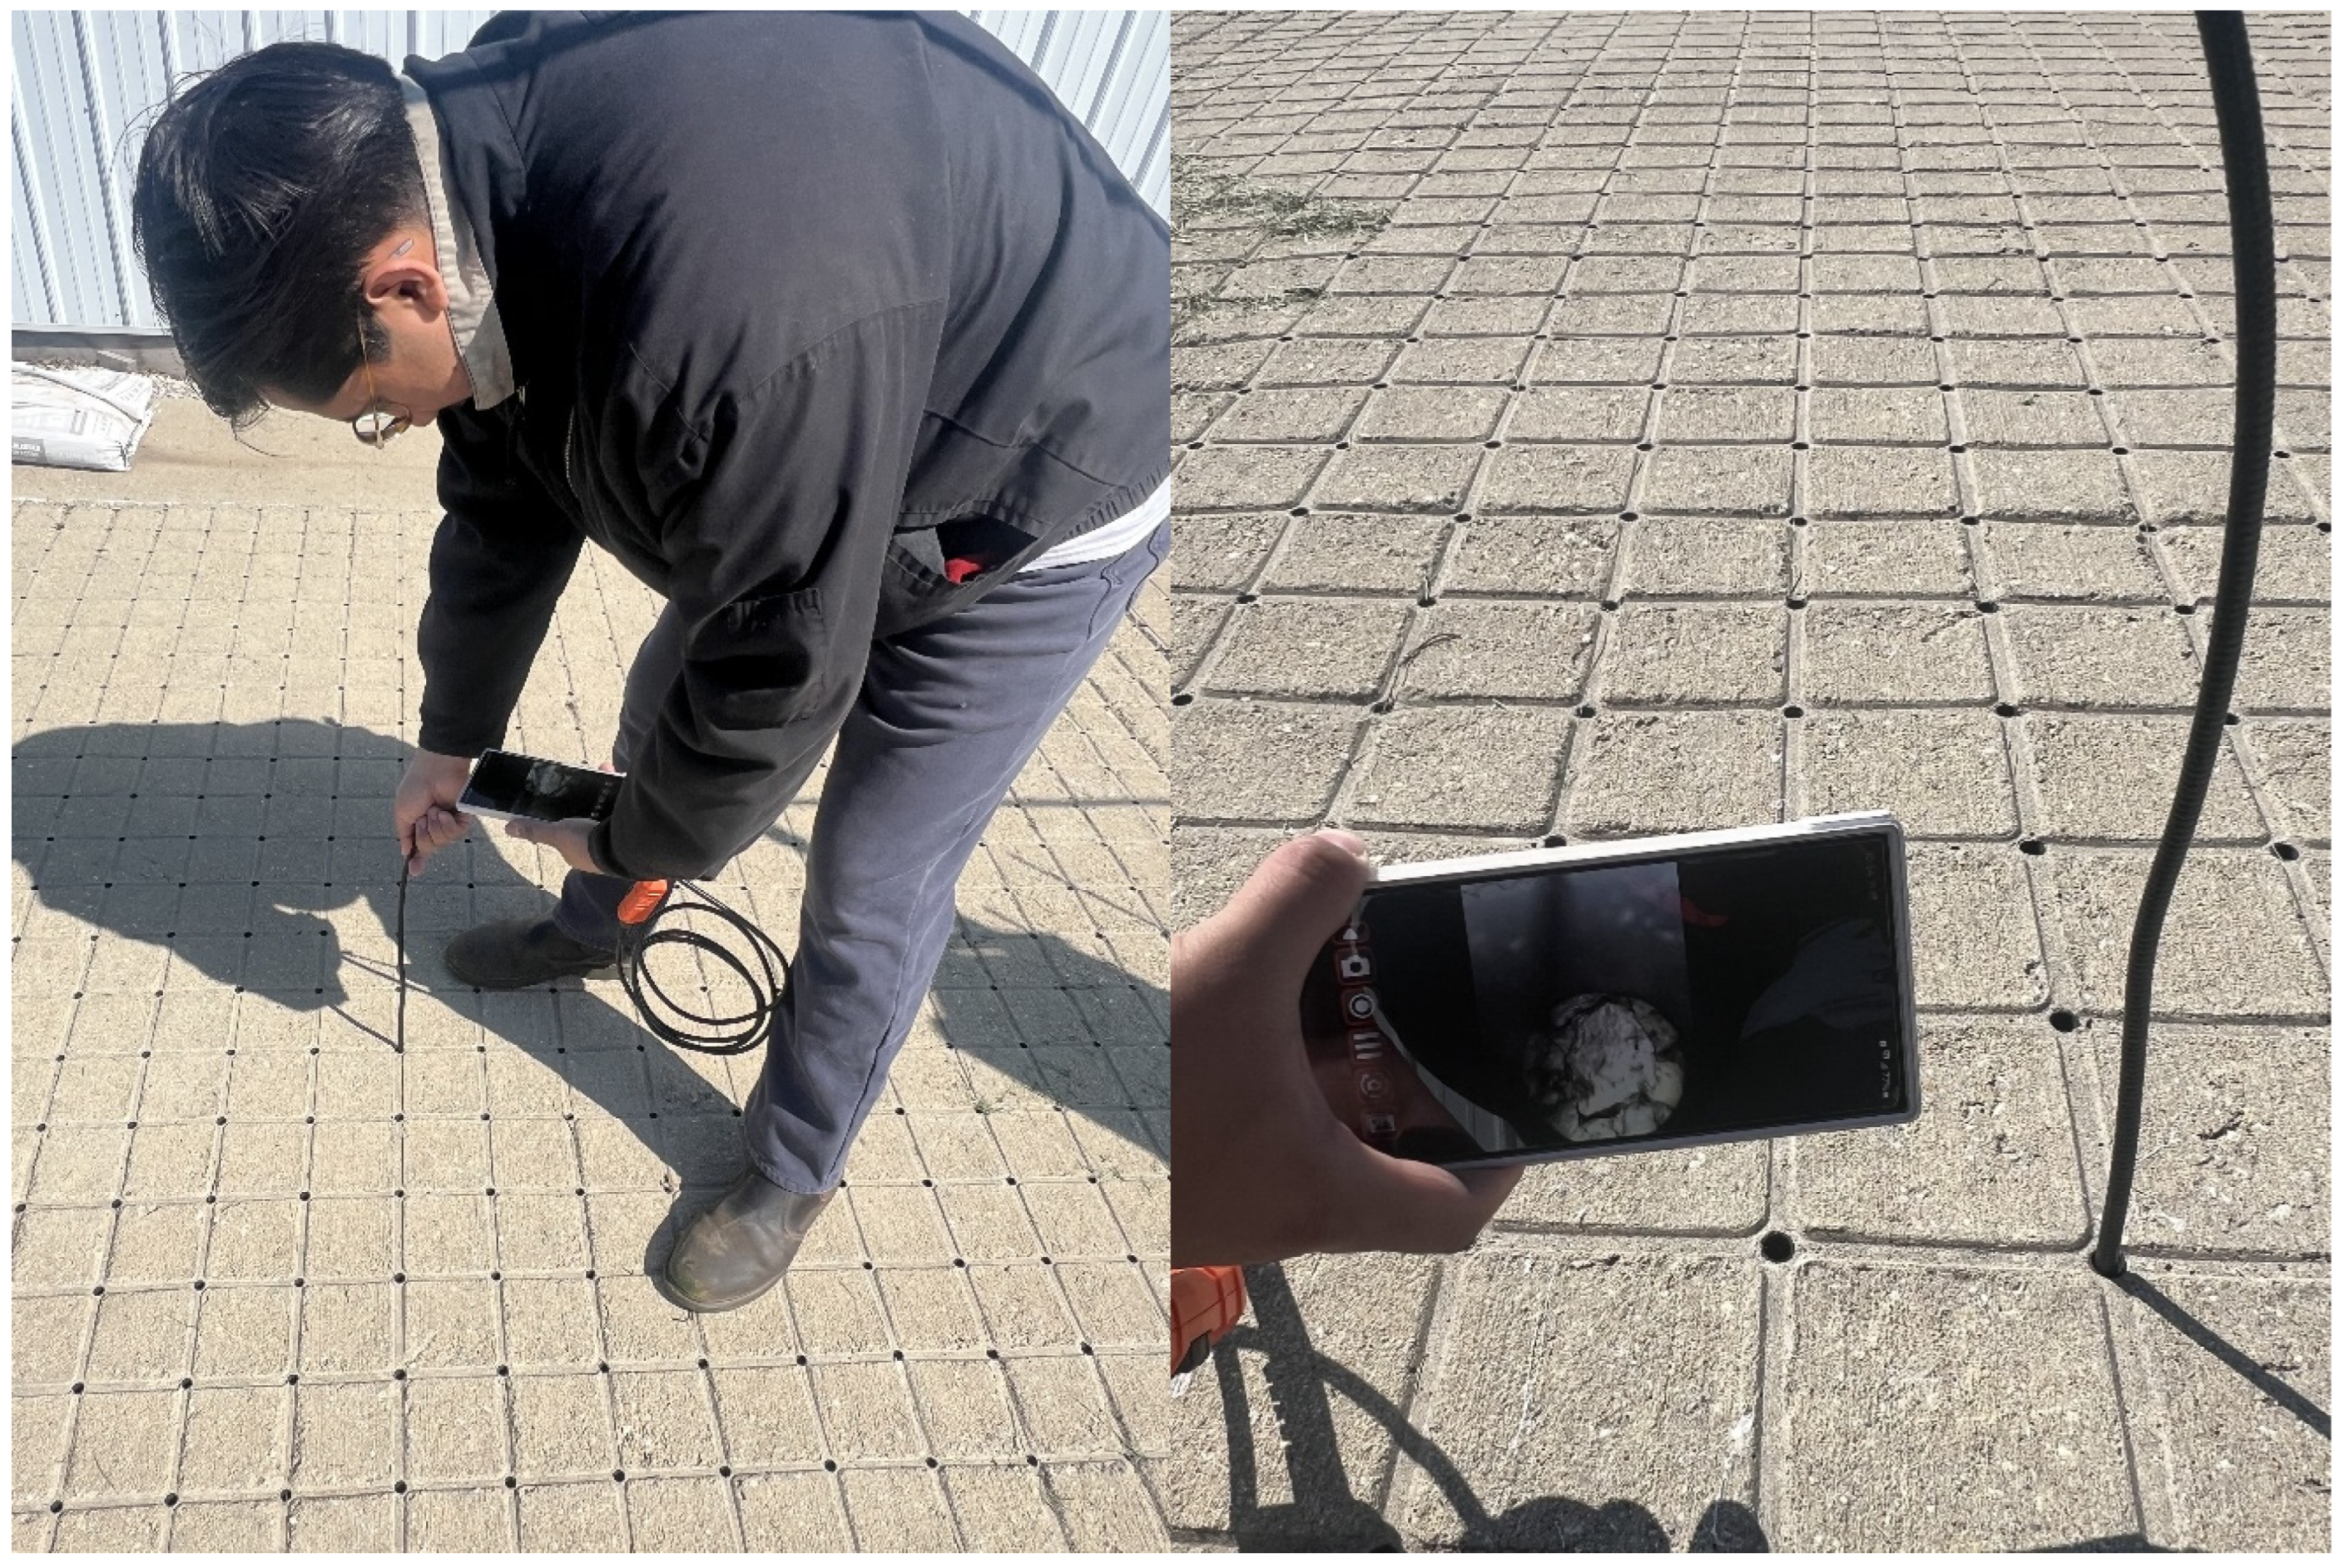
2.3. Visual Inspection of the Pavement Site

In addition to collecting the permeability measurements, visual inspections were performed to help understand the conditions of pavement surfaces and the factors that might have contributed to clogging. A borescope with a 3.05 m (10 ft) armored gooseneck and a 9.0 mm (0.4 in) camera with LED lights manufactured by Klein Tools, Inc. (Lincolnshire, IL, USA), as shown in Figure 4, was used to observe the inner side along the JW aqueducts from the surface to the gravel layers. As PC does not contain any large direct openings like the JW aqueducts, it was not possible to utilize the borescope on PC.

3. Results and Discussion

In this study, permeability measurements were collected regularly before cleaning during the summers of 2020 to 2023 and also before and after pressure washer cleaning in 2024 and 2025. The status of PC and JW pavement pads through visual inspection will also be discussed to aid in explaining potential causes of clogging.

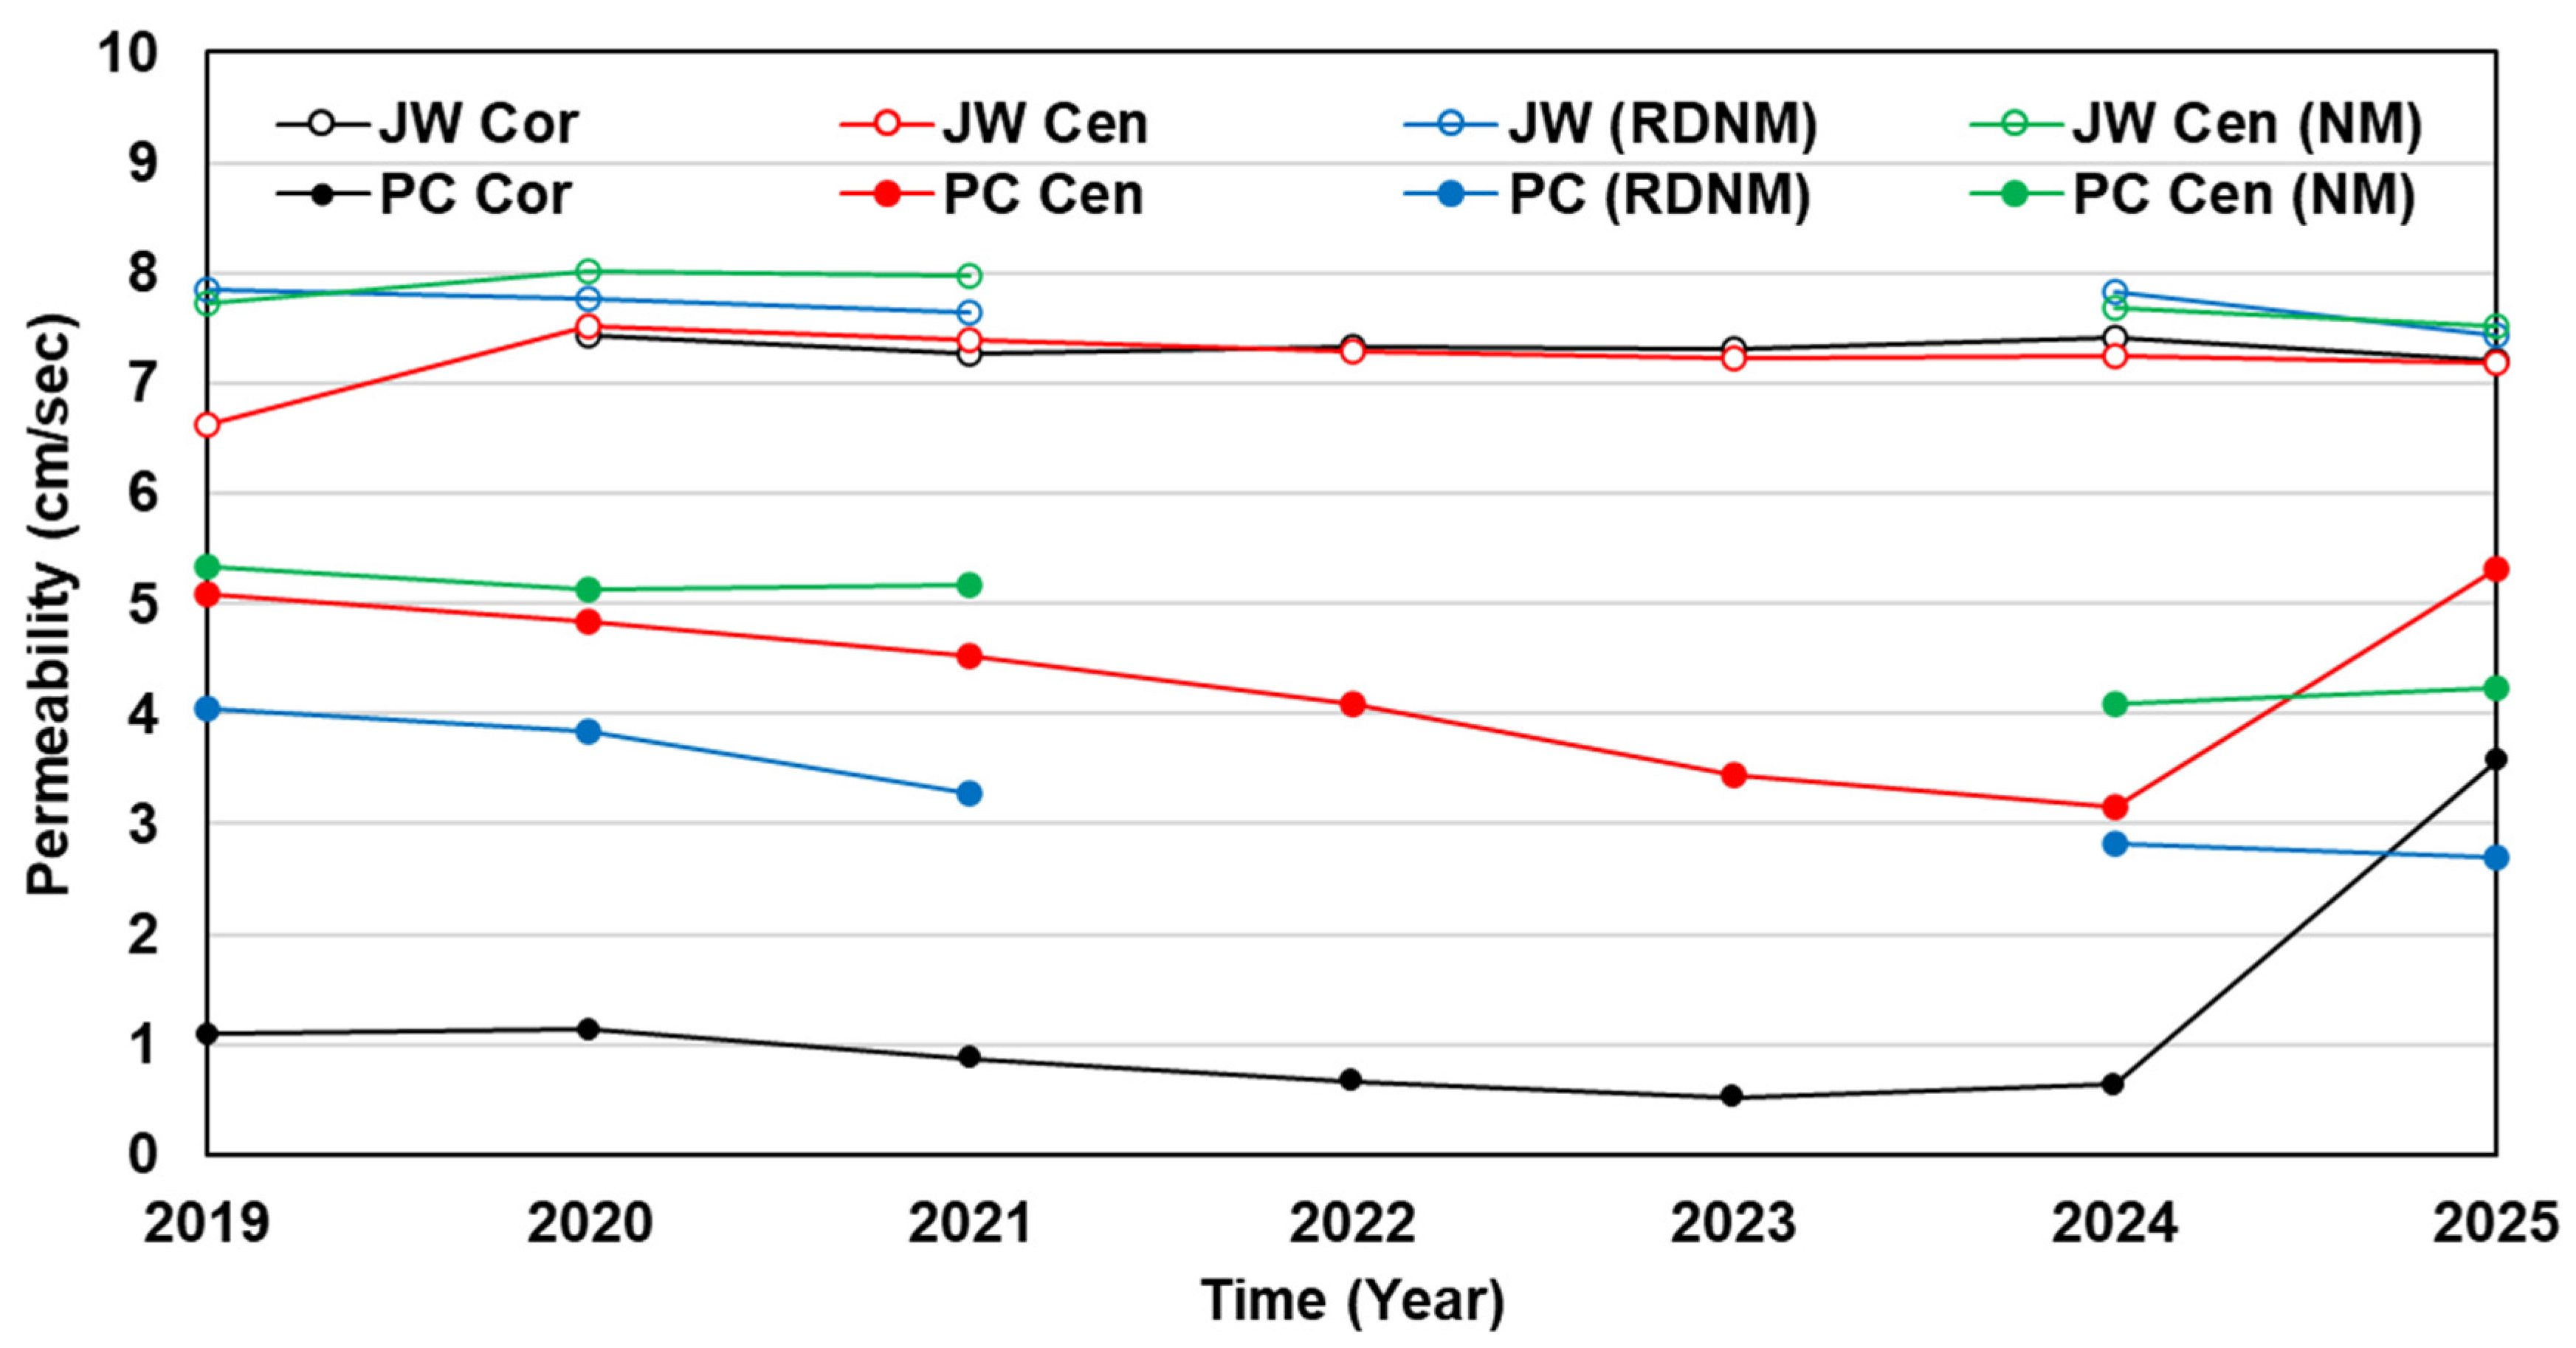
3.1. Permeability Trend of PC and JW

The permeability of PC and JW measured before cleaning during the summer seasons of 2020 to 2023 are summarized in Table 2 and Table 3, respectively.
According to Table 2, the permeability of PC declined gradually, especially on the corners and along the edges of the pavement pad. It should be noted that the locations of corners and edges were at least 0.3 m (1 ft) away from the margins of the pavements, and values ranged from 0.25 cm/s to 2.05 cm/s in 2020, and dropped to anywhere from zero permeability to 1.46 cm/s. While the center locations of PC showed comparatively higher permeability values than those measured along the sides, the numbers also implied lower permeability gradually after years of installation, which indicates potential clogging issues over time.
Based on Table 3, JW maintained its permeability, regardless of the locations of measurements, indicating no evidence of clogging. The corners and edges were also at least 0.3 m (1 ft) away from the margins of the pavements. Permeability values ranged from 6.90 cm/s to 8.17 cm/s, measured between 2020 and 2023. The center locations of JW showed similar permeability values to those measured along the sides. The numbers also revealed that the permeability of JW did not change after several years of installation, regardless of the locations.

3.2. Permeability of PC and JW Before and After Maintenance

As the trend of permeability measured on PC pavements continued to decline, a cleaning operation using a household pressure washer, as described previously, was used to clean both PC and JW. To evaluate the impact of the cleaning operation on permeability more accurately, a set of permeability tests was performed on both PC and JW in August 2024 just before the cleaning, which was conducted in September 2024. A set of permeability measurements was also collected after the cleaning, and an additional set of tests was carried out in April 2025 after the winter season. The permeability data collected during these periods are summarized in Table 4.
Data revealed that permeability measured on JW before and after cleaning did not show any noticeable differences; the values are consistent with those measured previously, suggesting that the cleaning procedure did not increase the permeability of JW pavement and therefore may not be necessary. It should be noted that a few measurements showed decreased permeability of JW after cleaning, which is likely due to minor variations in data collection due to the person collecting the measurements. On the contrary, PC showed recovery of permeability after cleaning, suggesting that pressure washing was able to recover the lost permeability of PC from 0 to 2.69 cm/s and from 0.13 to 3.09 cm/s, according to the most recent permeability measurements shown in Table 4. The higher permeability measurements on corner areas were 4.74 cm/s and 4.41 cm/s, restored from 0.51 cm/s and 1.28 cm/s, respectively. In the center areas where permeability values were comparatively higher than in corner areas, permeability capacity was also increased from 2.44–4.99 cm/s to 2.80–5.42 cm/s. It was noticed that, on the center pad, while permeability was 4.25 cm/s before maintenance, permeability reached 5.53 cm/s afterwards. Based on the published data obtained at the P3 site, the values were very close to the maximum values measured [15,31]. On the contrary, the permeability data obtained at randomly selected locations on the half pad (see Figure S1) without cleaning maintenance showed that permeability continued to be lower than those measured at the corner and center locations before cleaning. Data collected ranged from 2.44 to 2.93 cm/s, which was a decrease from 3.43 to 4.66 cm/s measured in 2019 and from 4.15 to 4.32 cm/s, which was a decrease from 4.85 cm/s and 5.83 cm/s at the center locations measured in 2019, respectively. The results further revealed that PC was highly likely to continue to lose its permeability at locations that were not cleaned.
In addition to the permeability shown in Table 2 and Table 3, previously published data with values from 2 years after the site installation are combined and displayed in Figure 5 to further represent the trend and permeability changes of PC and JW.
The graph further revealed that PC declined in permeability performance gradually, but after maintenance, on average, the restored permeability was nearly 7 times greater than its lowest measurement. Similar to the permeability measured in corner areas, permeability was restored to close or even higher than that measured in 2019. In addition, the areas without maintenance did not show an abrupt or dramatic drop in permeability, but the trend of a gradual decline in permeability was observed. In contrast, Figure 5 indicates that JW maintained its permeability and concludes that there was no loss of permeability, compared with the values with the aqueducts fully clear and open [31].

3.3. Observations on PC and JW

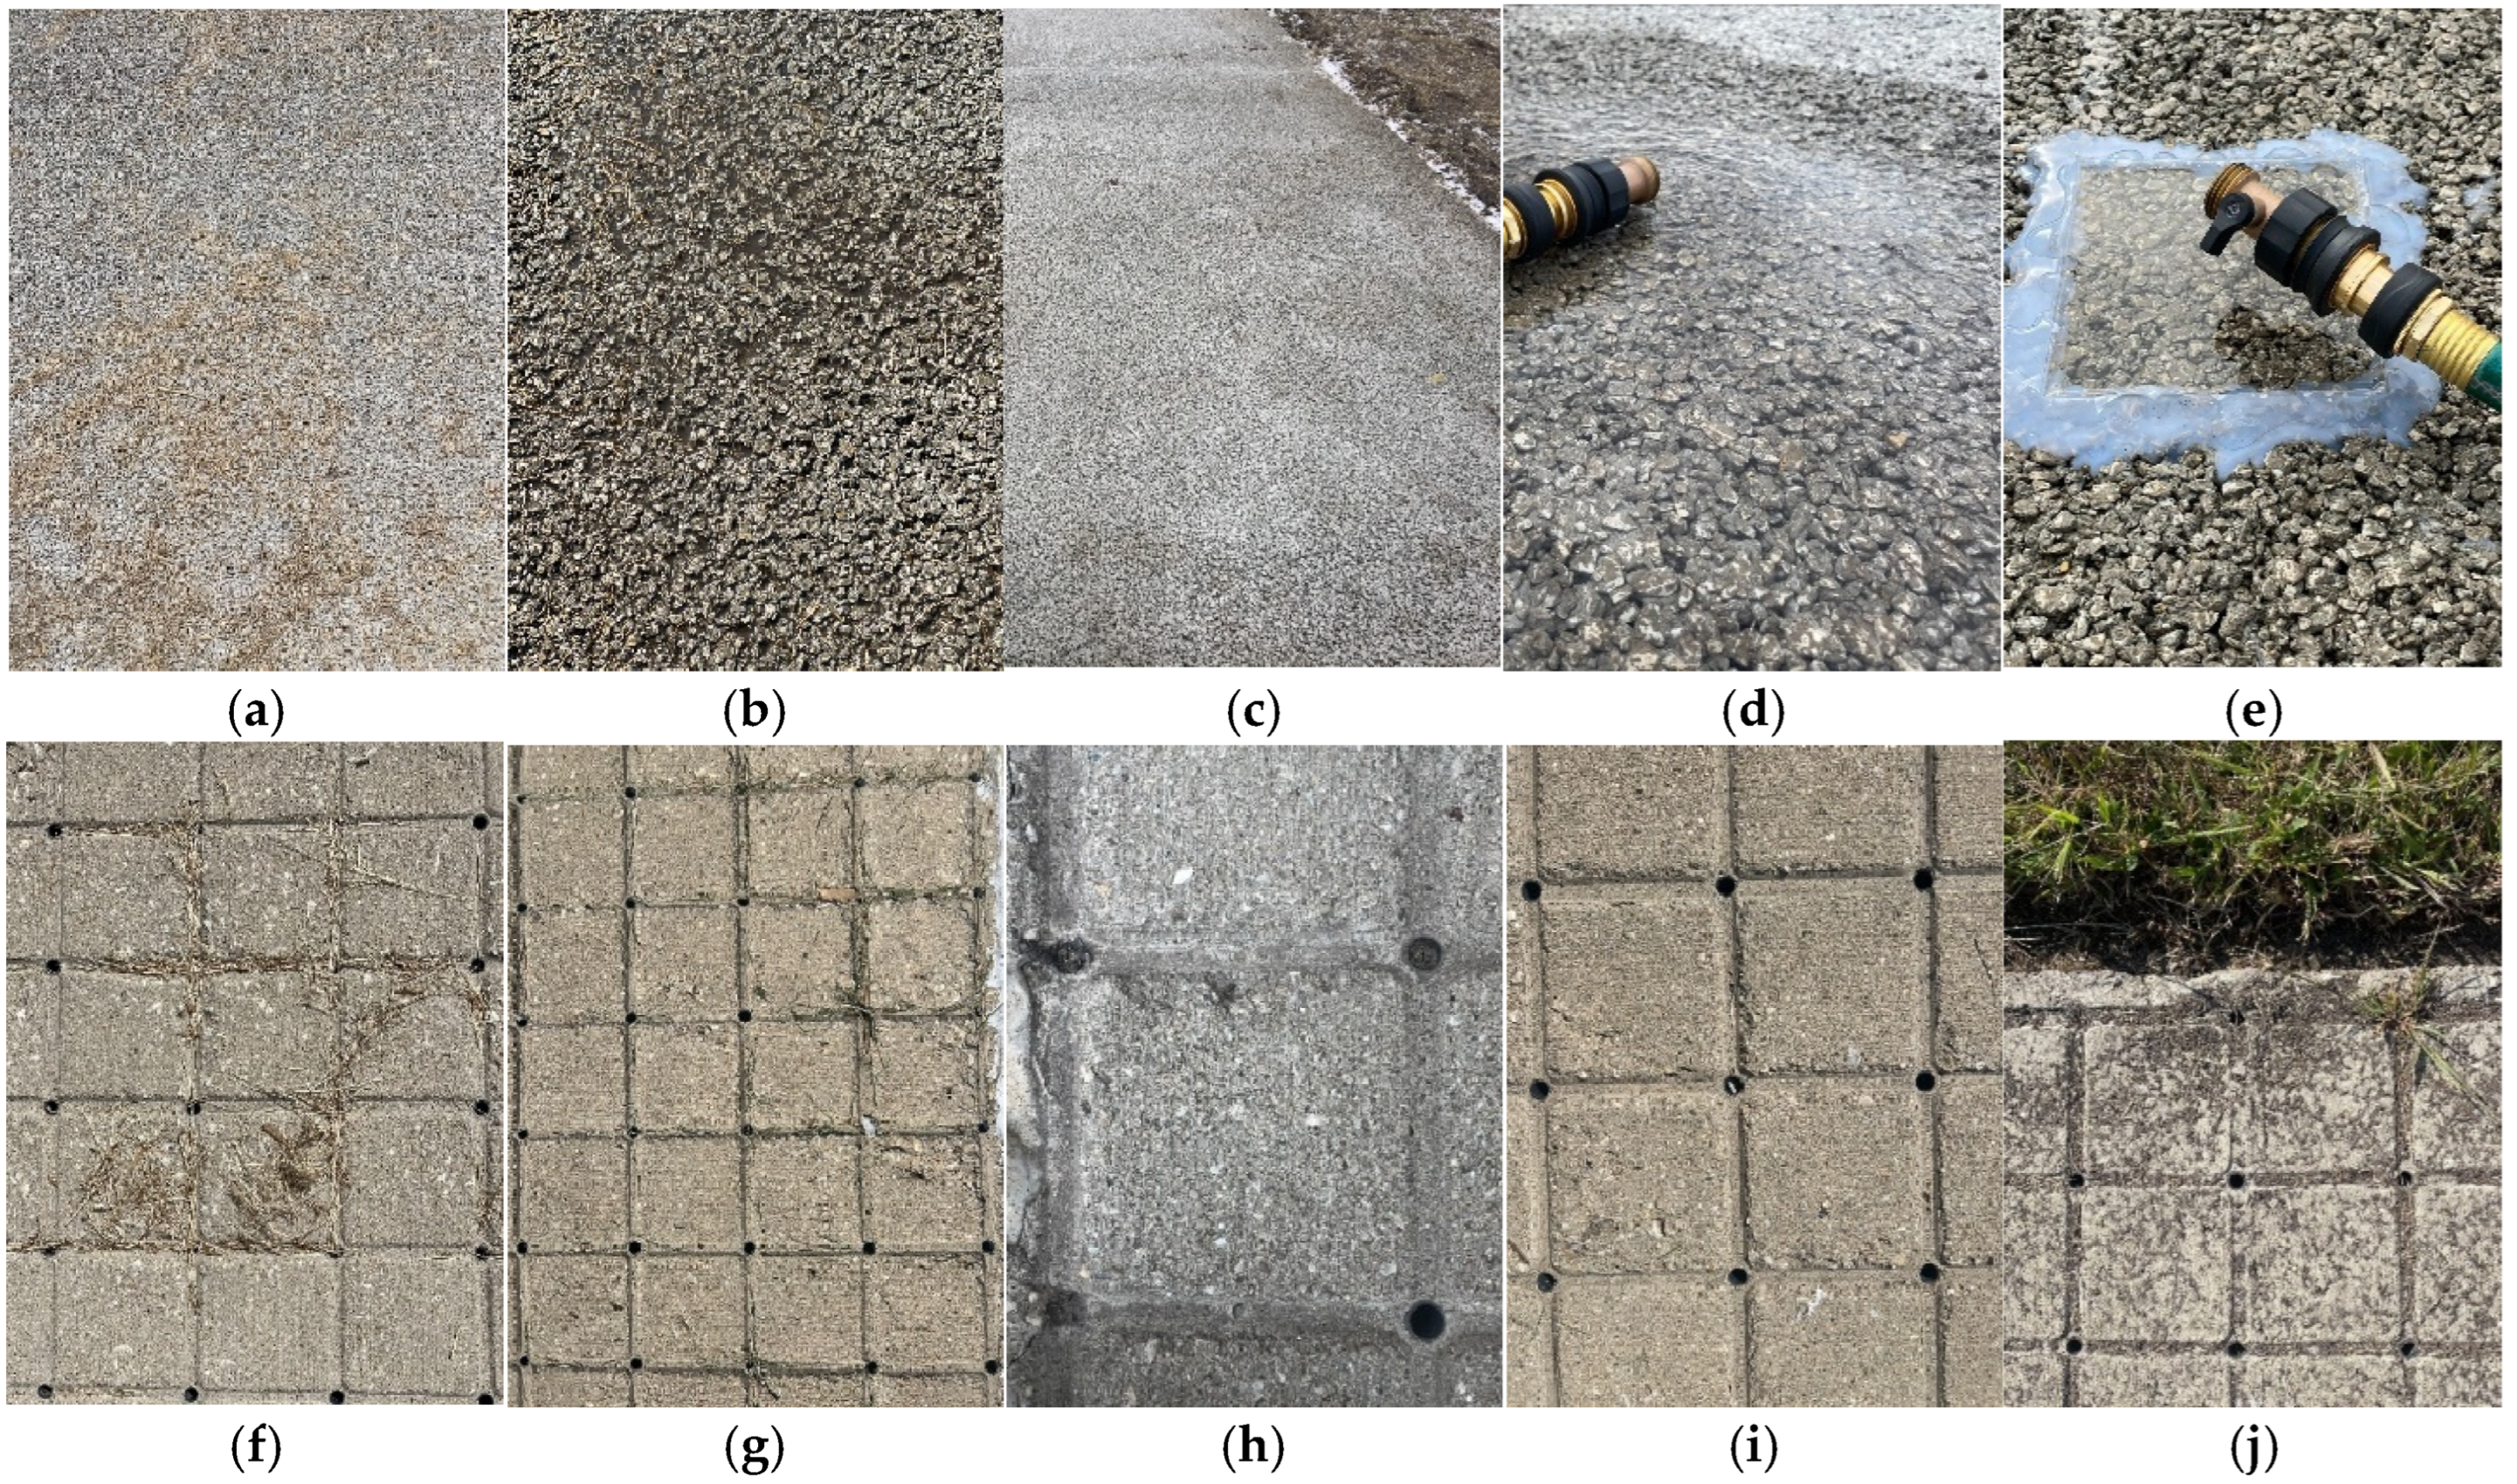
3.3.1. Visual Inspection on the Surface of Pavements

In addition to permeability measurements for PC and JW, visual inspection during the study periods was also performed and recorded, serving as another way to support the permeability data collected. Figure 6 categorizes several patterns observed on PC (a–e) and JW (f–j) with substances deposited on the surfaces of pavements that might have impacted the permeability.
As seen in Figure 6a–c, debris from grass mowing and crop residues from nearby harvesting deposited on PC pavements were seen on both edges and areas near the center of the pavement pad. Additionally, small substances, including debris, stalks, and sediment, were found stuck in the voids of the surface layer. Consequently, the permeability on PC was affected, especially the pavement edge near the south side. Figure 6d,e further display ponded water on PC in the areas that correspond to the bottom-right corner area on PC (refer to Figure 1), revealing that the affected areas had effectively zero permeability. In addition to the substances deposited on or stuck in the pavement, the grass zone on the south side of the pavement was the path for farm machinery. These machines and vehicles might have further contributed dirt and residues to the top of the surface layer of PC. Furthermore, the activities might have also imposed external force on the path so that the compaction and hardening of soil along the edge of PC further filled the pore spaces from the side.
As all pavement pads were exposed to the same surrounding environment, it was also common for debris to be transported and deposited on the JW surface. In addition, small irregular rocks or dirt commonly fell into the top section of the aqueduct and reduced the opening areas of the aqueduct. In the case of these larger particles, indicated by the four photos shown in Figure 6f–i, they could be removed from the JW surface using a leaf blower or a stick. However, it was also observed only on the edge of JW and grass adjacent to it; an aqueduct opening was totally filled with soil, and grass was grown along the aqueduct, as shown in Figure 6j. This was somewhat rare, occurring in 7 out of 5152 aqueducts, and was only seen on a specific side (south) of the JW pavement, indicating that it might be due to the disturbances of soil by activities of farm machinery on the grass zone.

3.3.2. Permeability at Various Locations

The key to the permeability of a pavement system relies on the pore ratio that allows water to flow into the subsurface layer. While it was not practical to measure the void area of PC after installation without causing destruction, it has been suggested that the typical range of the volume void ratio of pervious concrete is approximately 15% to 35% [21,22,23]. On the other hand, at the P3 site, there are 5152 JW aqueduct openings evenly distributed on the 59.5 m2 JW pavement, creating a 0.4 m2 or 0.7% porous area on the surface layer of JW. As the vertical cross-section of the surface layer of JW is homogeneously distributed along the whole length, the volume void ratio should be 0.7% as well. When only comparing the percentages of the voids, PC certainly surpassed JW, but as the percentages of the voids and solid concrete changed with respect to time due to clogging, this would impact the permeability. According to the data presented in Section 3.1 and Section 3.2, while the values of permeability measured were within a certain range across the JW pavement, permeability measured on PC varied with locations. In one aspect, water percolated from any pore on the PC surface had to follow one or several paths created by the connected void areas to lead to the gravel layer. Therefore, if within a test area a path starting from the surface pore was blocked somewhere between the surface and gravel layer, the permeability through that path was 0, and another path, if available, had to be used, which would impact the void ratio and permeability within that area. The data in the previous sections also revealed that the permeability of PC decreased over time, and it was evident that the permeability of the pavement edges of the triplicates that were adjacent to the grass zone was lower than the areas near the center, especially the two bottom corners.
Each pore from the surface to the gravel layer of JW had one, and only one, path that was through the one-dimensional aqueducts to the subsurface layer directly. However, this one path was much larger than any one path in PC. While the same concept applied that the permeability would be zero if the path was completely blocked, based on the observations made during the study period, most of the aqueducts were nearly fully open, which meant that once water reached the top of the aqueduct, water would pass to the gravel layer. This was consistent with the data displayed in previous sections.

3.3.3. Operation of the Pressure Washer

In order to minimize the consumption of water and electricity, the areas that were proposed to be cleaned on both pavements were swept by a leaf blower to remove substances that had been deposited on the slabs before using the pressure washer. In contrast with the regular and ongoing maintenance performed at the P3 site, there was no additional manual removal activity after the use of the leaf blower.
During the cleaning operation, a swaying motion (left to right) was used while moving down across each zone. As mentioned, while there were several nozzles available, the green tip that shot a 25° angle spray was chosen for this task as it provided the optimal balance between high-pressure penetration and area coverage. The nozzle of the spray gun was kept approximately 15.2 cm (6 in) to 30.5 cm (12 in) from the surface to cover a reasonable area per pass. In addition, the operator adjusted the angle of the pressure washer gun for best performance for PC.
As described in the Section 2, during the cleaning performance, the nozzle passed and sprayed water on the designated range in triplicate for 3 min. It went over JW pavement easily and smoothly without any pauses on specific locations. The nozzle was directed perpendicular to the pavement, maintaining a 90° angle to maximize pressure application during maintenance. Although it was not possible to visually tell the clogging status in the aqueducts, the high pressure of the water directed downward into the aqueduct encouraged the cleaning and removal of any particles. As the openings of the pores on PC were smaller than on JW and intertwined across the depth of the pavement, substances stuck in the surface layer were not always removed by the pressure washer. Therefore, it was necessary to adjust the angle of the pressure washer gun to dislodge the substances from entrapment. For these reasons, the cleaning process on PC took a longer time than that performed on the JW pavement. Figure 7a,b shows examples of cleaning on both PC and JW, respectively, using the pressure washer. The angles of water spraying during the cleaning operation on PC and JW were different for better cleaning on each pavement system.
Also demonstrated in Figure 7 was that, after the cleaning procedure, the appearance of PC pavement surfaces that were cleaned were cleaner than that in the nearby areas that were not pressure-washed; substances including dirt and plant residue were removed from their original locations. It should be noted that since the pressure washer did not have a vacuum function, some fine sediments that were dislodged from the surface layer eventually settled back onto the pavement surface. Therefore, a device with a vacuuming function might provide an additional benefit of permanently removing dislodged substances from the pavement and further improving permeability. However, measurements revealed the restoration of the permeability of PC, indicating that the cleaning alleviated much of the clogging. Previous related studies suggested that clogging occurred on the top sections of the surface layer for pervious asphalt and pervious concrete, including fine sediments that were retained in the upper paver and bedding layers after cleaning [13,28,29,30]. Regardless, the procedure of using a pressure washer restored permeability on PC in this study.
Based on the specifications of the pressure washer, the water usage was 11.4 L/min (3.0 gallons per minute). Therefore, water consumption was approximately 340.5 L for PC and 102.2 L for JW maintenance in this study. The additional water consumption for PC was due to the additional passes necessary to remove particles entrapped in the pavement surface. Since JW consists of large aqueduct openings, only one pass of the pressure washer was needed to clear any debris.
In this study, the cleaning of PC and JW using a pressure washer was first performed approximately 8 years after installation. As permeability measurements showed the clogging of PC, the 25° spray tip that provided stronger pressure was used. Despite the external force from the pressure washer, there was no damage observed to the pavement surface structure or the binding materials of the two pavement systems.

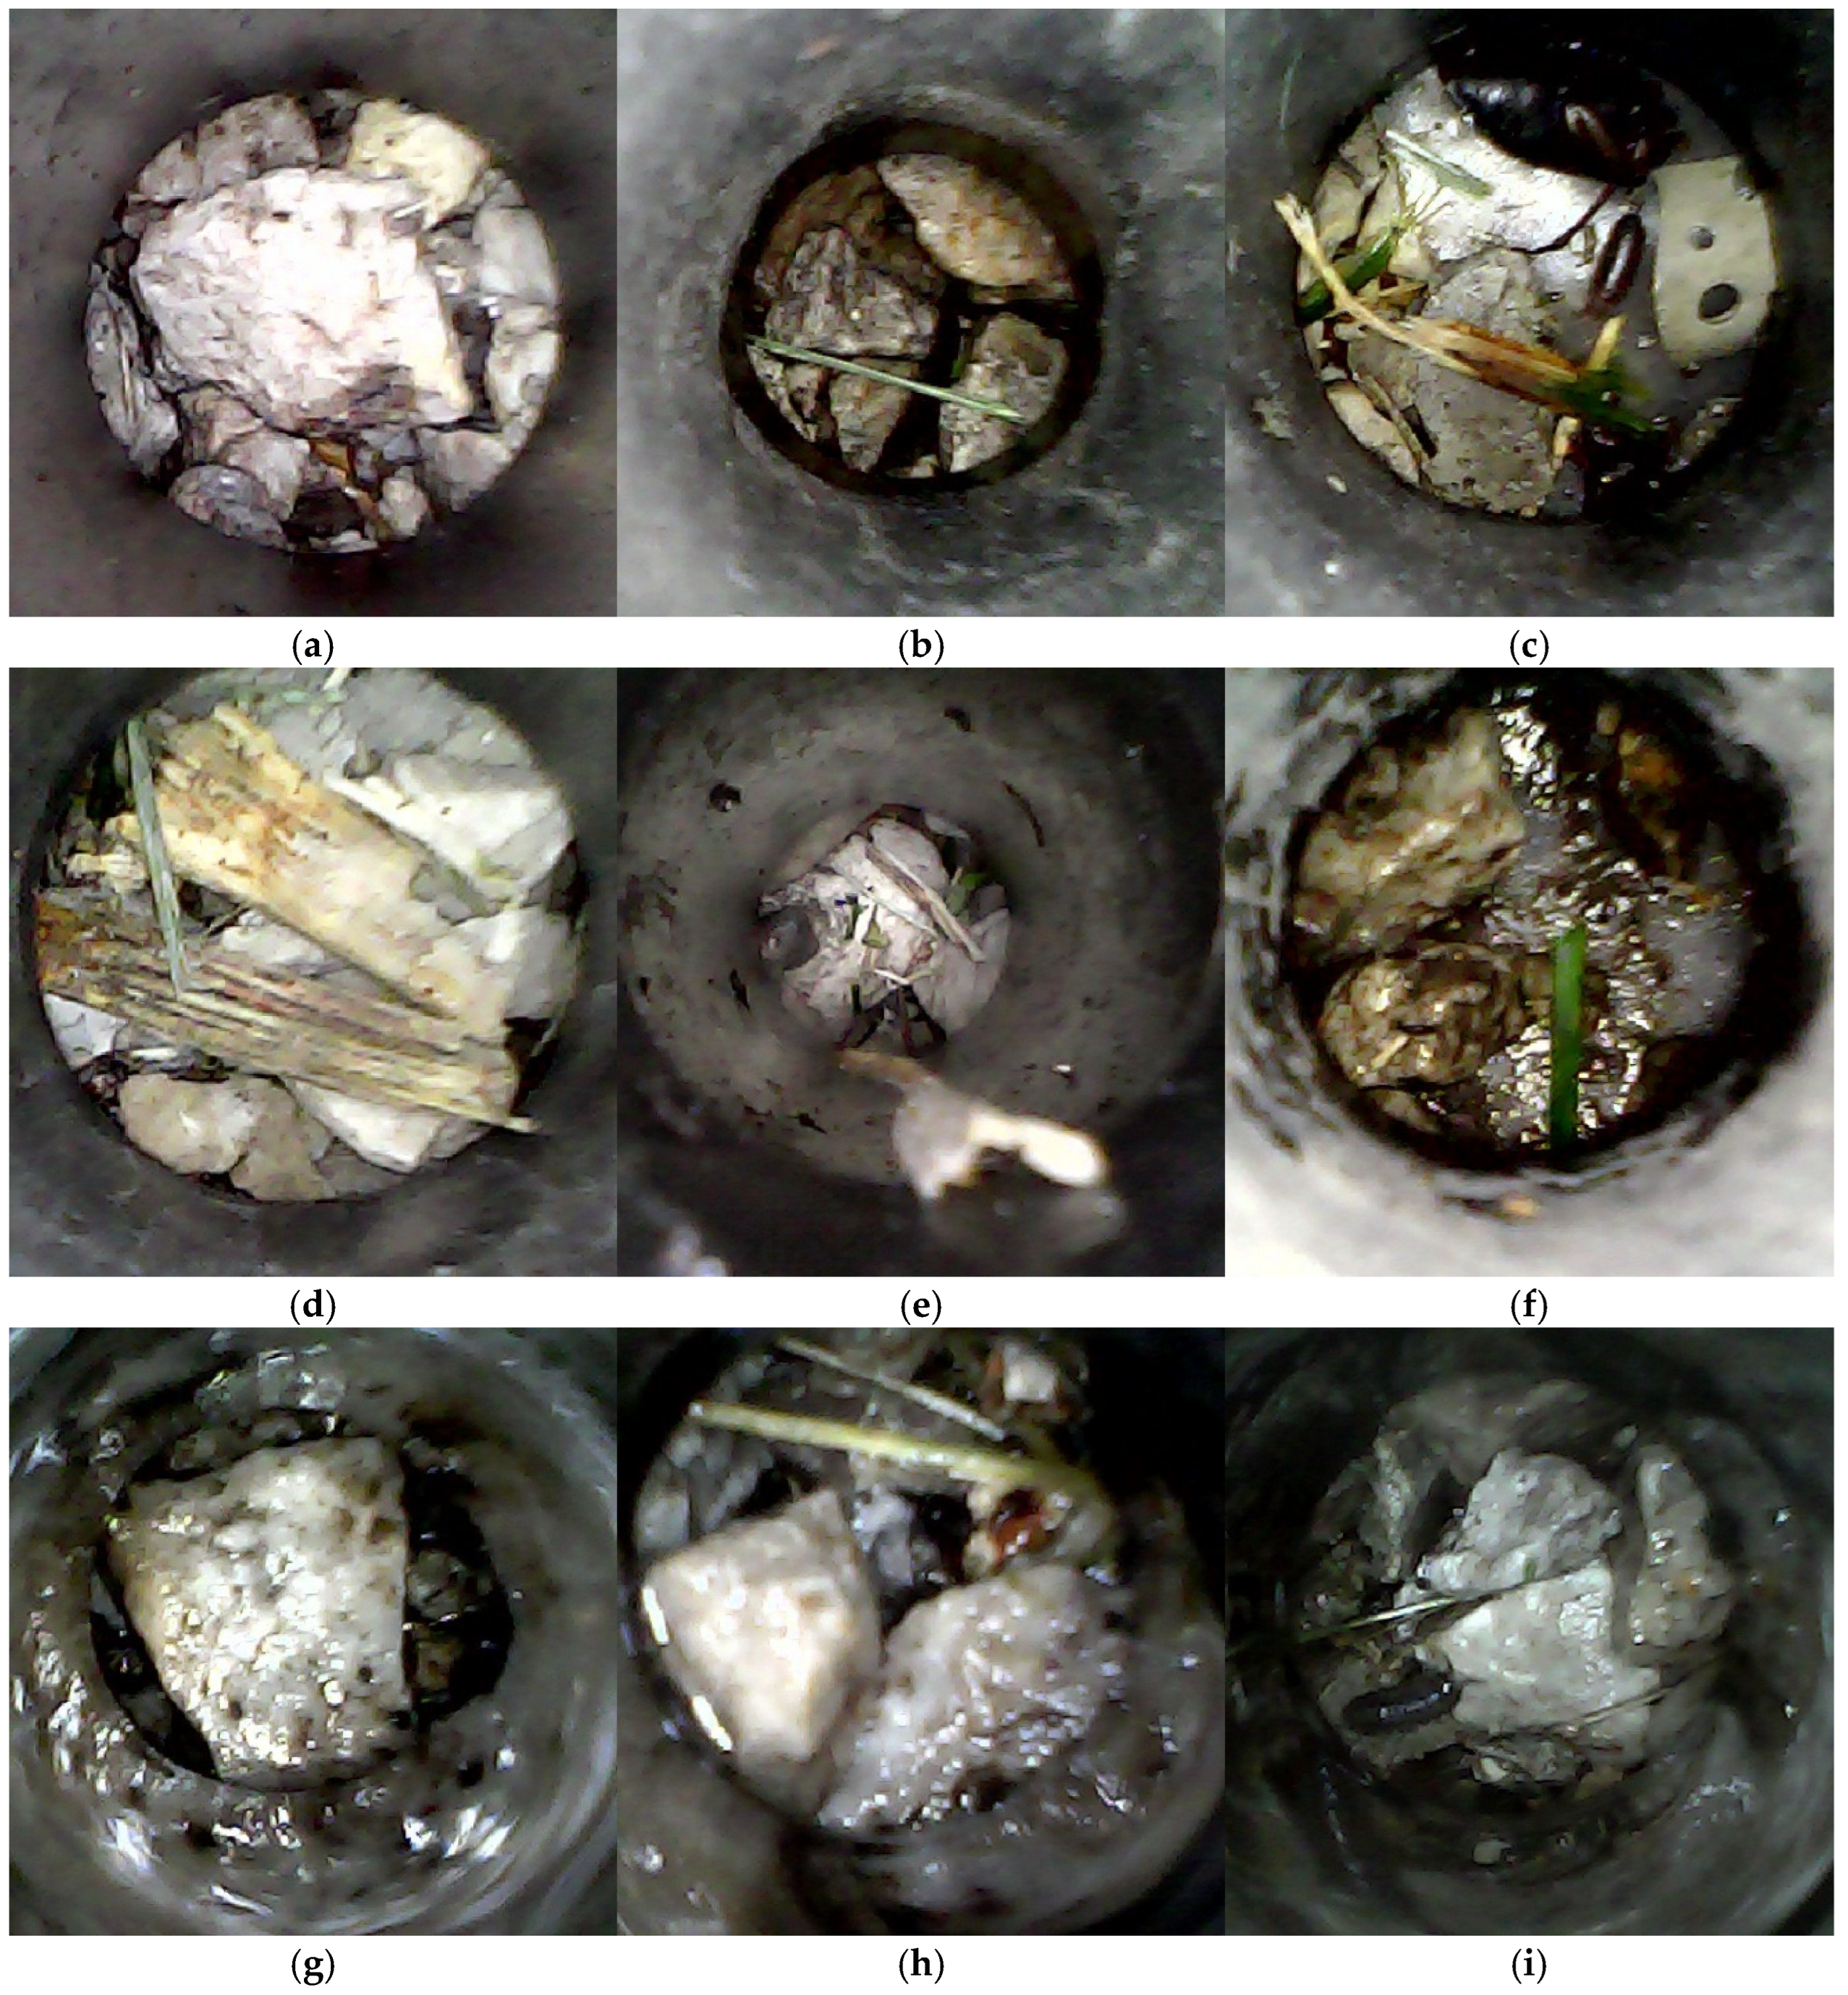
3.3.4. Observations Inside JW Aqueducts

As discussed in the previous section, it was not possible to investigate individual pores within PC without destroying the pavement structure. However, it was possible to inspect the inner volume of individual JW aqueducts using a borescope. As this study focused on the impacts of maintenance, the borescope was used to observe several aqueducts selected from both sections with and without cleaning on a sunny day in April 2025, as displayed in Figure 8. The armored gooseneck of the borescope was inserted in the aqueduct through its top opening down to the top of the gravel layer below.
Figure 8a–c, which represent aqueducts in the zone with pressure washer maintenance, show irregular gravels at the bottom of the aqueducts. There was no ponded water on top of the gravel layer. Green grass debris, possibly from lawn mowing, and the existence of small worms were observed. In Figure 8d–f, in addition to the small piece of grass, dry plant residue is observed. It was also noticed that small substances such as dirt and debris could temporarily attach to the inner smooth wall of an aqueduct. It was also noted that the photo on the right shows a wet gravel layer, as opposed to the other aqueducts shown. It might be related to the water collection plate component that was attached to the bottom of some of the JW aqueducts to increase water storage. However, it is beyond the scope of this study. In addition, selected aqueducts within an approximately 2 × 2 m area in the section that had not been maintained were also inspected after pouring 5 gallons of water twice, as shown in Figure 8g–i. First of all, there was no water-retaining layer in the aqueducts. Furthermore, similar to what was observed in the aqueducts presented in the figure, small-sized debris was inside the aqueduct, and living creatures were also observed.
From all the photos taken, the interior of the aqueducts remained hollow under different conditions. These observations further indicate that small substances could get into the aqueducts from the top of the aqueduct openings. While soil could possibly be pushed into the pores of PC, the structure of JW with vertically placed aqueducts surrounded by concrete prevented soil and other materials from entering the aqueducts from the side and from the bottom. Furthermore, from the above photos, the gravel layer could be seen clearly beneath the bottom of each aqueduct, which further shows that along the aqueduct was a smooth path with an open channel for water to flow down to the subsurface layer. It should be noted that the borescope did not encounter any obstructions when taking photos. Through the observations of the borescope in this study, it further supports the findings reflected from the consistency of permeability of JW pavement over time and after cleaning and maintenance.

3.3.5. Limitations

As mentioned, JW was not installed anywhere in the US until the construction of the P3 research and demonstration site to explore its impacts on the environment. The selection of a pressure washer as the cleaning method at the P3 site was based on the size of the scale of the application. While the operation of the pressure washer proved to be practical and convenient to use and was capable of restoring the permeability of PC after approximately 8 years of installation, it has to be noted that the cleaning procedure and duration of cleaning were also based on the scale of the pavement and the section of the test areas. Therefore, the timeframe of cleaning may need to be adjusted according to the size of the infrastructure or applications. Consequently, water consumption would also be affected. Regardless, the maintenance by cleaning described in this study is practical for small-scale applications, such as sidewalks, driveways, and small parking lots.
In addition, as this study on P3 is one part of a larger project and there were other investigations conducted simultaneously sometime during the study period, there was no daily vehicular or pedestrian traffic using the pad to prevent the site from being damaged and to maintain its integrity. Therefore, the results obtained and the observations made might not reflect the entire performance under the condition when JW is used. Moreover, according to Chen et al., the number of blocked aqueduct openings impacted its overall permeability [31]. Therefore, even though JW showed a nearly constant permeability in this study, regular scheduled maintenance by pressure washer cleaning is recommended to further guarantee the function of the open aqueducts. As literature on the long-term monitoring of the permeability of JW was not available, any results obtained from this study are a valuable addition to the body of research. Further investigation on the permeability monitoring of JW with daily vehicular or pedestrian use and at larger-scale applications is encouraged to ensure further understanding of JW.

4. Conclusions

This study presents the permeability data of two pavement systems, PC and JW, at the P3 site between 2020 and 2025, along with the data collected in 2019 [31]. As the regular site maintenance and cleaning were performed through various leaf blowers and manual efforts to remove obstacles on the pavements, the permeability of PC declined gradually, especially in the corner areas, where several impermeable areas were noticed. Therefore, a cleaning plan using a portable pressure washer on the P3 site was implemented in 2024. Data collected after the process showed that the permeability of PC was restored in the areas cleaned, compared with that collected before the cleaning maintenance. The permeability after cleaning was 22–24 times higher than that before cleaning, while the highest permeability for corner areas reached 4.60 cm/s, or 3.6 times higher than that before cleaning. The permeability for center areas increased from pre-cleaning permeability values of 2.44 to 4.53 cm/s to post-cleaning permeability values of 4.99 to 5.70 cm/s. These permeability values measured after cleaning indicate the recovery of at least 90% of the original capacity. For the areas without washing but adjacent to the cleaned section, the permeability values were lower than those from the previous measurements, further highlighting a continuous and gradual decrease over time. All these findings indicate the necessity of cleaning maintenance for PC, and a pressure washer showed that it was sufficient for cleaning the PC pad. Despite the permeability values of JW remaining constant since installation, one pass of the pressure washer may be used to ensure that the aqueducts are clear. Furthermore, with the efficacy and convenience of the portable pressure washer in this study, it is suggested that a routine cleaning maintenance be scheduled regularly for both the PC and JW pavement systems. At the P3 research site, which has been absent daily vehicular and pedestrian use, annual or biannual cleaning should be appropriate and necessary, whereas a less frequent cleaning plan should be sufficient for JW.

Supplementary Materials

The following supporting information can be downloaded at https://www.mdpi.com/article/10.3390/w17142140/s1, Figure S1. Locations on PC and JW where permeability data demonstrated in Table 1 and Table 2 were regularly performed, marked in black, between 2020 and 2023. Measurements were also performed randomly picked on the locations marked in green, data obtained from which were discussed but not shown in the two tables, Figure S2. Half of the paved areas on the bottom side of the pavement pad of PC and JW were cleaned by pressure washer. Test locations, both in center and corner areas, for permeability experiments before and after pressure washer maintenance were in blue; test locations without cleaning were marked in black, Figure S3. Operation of the borescope to observe the inside of the JW aqueduct from top to the top of the gravel layer.

Author Contributions

Conceptualization, O.P., L.-M.C., J.-W.C., T.J.L., L.A.S., T.-H.C. and P.C.D.; resource, L.-M.C., J.-W.C., T.J.L., L.A.S., T.-H.C. and P.C.D.; methodology, O.P., L.-M.C., T.J.L., L.A.S. and P.C.D.; investigation, O.P., L.-M.C., T.J.L., L.A.S. and P.C.D.; formal analysis, O.P., L.-M.C. and P.C.D.; data curation, L.-M.C.; funding acquisition, P.C.D.; project administration, P.C.D.; writing—original draft, O.P., L.-M.C. and P.C.D.; writing—review and editing, O.P., L.-M.C., T.J.L., L.A.S. and P.C.D. All authors have read and agreed to the published version of the manuscript.

Funding

This work was funded by gifts from a consortium of sources.

Data Availability Statement

The data presented in this study are available upon request from the corresponding author.

Acknowledgments

The authors would like to thank the then undergraduate students of the Department of Agricultural and Biological Engineering, Tyler Stuckemeyer and Matthew Hunzinger, and Mitchell Wright of Parkland College for their preparation of materials and maintenance for this study. The authors would also like to thank James Baltz, Computer-Assisted Instructional Design Specialist at the Department of Agricultural and Consumer Economics, for the photo of the site.

Conflicts of Interest

The authors Jui-Wen Chen and Ting-Hao Chen were employed by the company JW Eco-Technology, Ding Tai Co., Ltd. The remaining authors declare that this research was conducted in the absence of any commercial or financial relationships that could be construed as a potential conflict of interest. The authors Jui-Wen Chen and Ting-Hao Chen are the patent holders of JW Eco-Technology; however, they were only engaged in the site development and installation to ensure the proper implementation of the JW Eco-Technology system, as it has never been installed in the U.S. previously. They declare no influence over the study design, data interpretation, results, and discussion or conclusions of this study. Other authors declare no conflicts of interest. The funders had no role in the design of the study; in the collection, analyses, or interpretation of data; in the writing of the manuscript; or in the decision to publish the results.

References

  1. Kalnay, E.; Cai, M. Impact of urbanization and land-use change on climate. Nature 2003, 423, 528–531. [Google Scholar] [CrossRef] [PubMed]
  2. Buyantuyev, A.; Wu, J. Urban heat islands and landscape heterogeneity: Linking spatiotemporal variations in surface temperatures to land-cover and socioeconomic patterns. Landsc. Ecol. 2010, 25, 17–33. [Google Scholar] [CrossRef]
  3. Carlson, T.N.; Arthur, S.T. The impact of land use—Land cover changes due to urbanization on surface microclimate and hydrology: A satellite perspective. Glob. Planet. Change 2000, 25, 49–65. [Google Scholar] [CrossRef]
  4. Qu, Y.; Long, H. The economic and environmental effects of land use transitions under rapid urbanization and the implications for land use management. Habitat Int. 2018, 82, 113–121. [Google Scholar] [CrossRef]
  5. Satterthwaite, D. The implications of population growth and urbanization for climate change. Environ. Urban. 2009, 21, 545–567. [Google Scholar] [CrossRef]
  6. Chapman, S.; Watson, J.E.M.; Salazar, A.; Thatcher, M.; McAlpine, C.A. The impact of urbanization and climate change on urban temperatures: A systematic review. Landsc. Ecol. 2017, 32, 1921–1935. [Google Scholar] [CrossRef]
  7. Arnold, C.L.; Gibbons, C.J. Impervious Surface Coverage: The Emergence of a Key Environmental Indicator. J. Am. Plan. Assoc. 1996, 62, 243–258. [Google Scholar] [CrossRef]
  8. Afonso, M.L.; Dinis-Almeida, M.; Fael, C.S. Permeable pavements—Green infrastructures as a flood mitigation measure. Acta Hortic. 2018, 1215, 369–376. [Google Scholar] [CrossRef]
  9. Stempihar, J.J.; Pourshams-Manzouri, T.; Kaloush, K.E.; Rodezno, M.C. Porous Asphalt Pavement Temperature Effects for Urban Heat Island Analysis. Transp. Res. Rec. 2012, 2293, 123–130. [Google Scholar] [CrossRef]
  10. Booth, D.B.; Leavitt, J. Field Evaluation of Permeable Pavement Systems for Improved Stormwater Management. J. Am. Plan. Assoc. 1999, 65, 314–325. [Google Scholar] [CrossRef]
  11. Chandrappa, A.K.; Biligiri, K.P. Pervious concrete as a sustainable pavement material–research findings and future prospects: A state-of-the-art review. Constr. Build. Mater. 2016, 111, 262–274. [Google Scholar] [CrossRef]
  12. Imran, H.M.; Akib, S.; Karim, M.R. Permeable pavement and stormwater management systems: A review. Environ. Technol. 2013, 34, 2649–2656. [Google Scholar] [CrossRef] [PubMed]
  13. Bäckström, M. Ground temperature in porous pavement during freezing and thawing. J. Transp. Eng. 2000, 126, 375–381. [Google Scholar] [CrossRef]
  14. Al-Rubaei, A.M.; Stenglein, A.L.; Viklander, M.; Blecken, G.-T. Long-term hydraulic performance of porous asphalt pavements in northern Sweden. J. Irrig. Drain. Eng. 2013, 139, 499–505. [Google Scholar] [CrossRef]
  15. Chen, L.M.; Chen, J.W.; Chen, T.H.; Lecher, T.; Davidson, P.C. Measurement of permeability and comparison of pavements. Water 2019, 11, 444. [Google Scholar] [CrossRef]
  16. Ning, X.; Akin, M.; Shi, X. Permeable concrete pavements: A review of environmental benefits and durability. J. Clean. Prod. 2019, 210, 1605–1621. [Google Scholar] [CrossRef]
  17. Kuruppu, U.; Rahman, A.; Rahman, M.A. Permeable pavement as a stormwater best management practice: A review and discussion. Environ. Earth Sci. 2019, 78, 327. [Google Scholar] [CrossRef]
  18. Illinois Department of Natural Resources. Model Stormwater Management Ordinance. Version 1. Office of Water Resources. 2015. Available online: https://dnr.illinois.gov/content/dam/soi/en/web/dnr/waterresources/documents/il-model-stormwater-ordinance.pdf (accessed on 1 April 2025).
  19. Razzaghmanesh, M.; Beecham, S. A review of permeable pavement clogging investigations and recommended maintenance regimes. Water 2018, 10, 337. [Google Scholar] [CrossRef]
  20. Winston, R.J.; Al-Rubaei, A.M.; Blecken, G.T.; Viklander, M.; Hunt, W.F. Maintenance measures for preservation and recovery of permeable pavement surface infiltration rate: The effects of street sweeping, vacuum cleaning, high pressure washing, and milling. J. Environ. Manag. 2016, 169, 132–144. [Google Scholar] [CrossRef] [PubMed]
  21. Shan, J.; Zhang, Y.; Wu, S.; Lin, Z.; Li, L.; Wu, Q. Pore characteristics of pervious concrete and their influence on permeability attributes. Constr. Build. Mater. 2022, 327, 126074. [Google Scholar] [CrossRef]
  22. Wang, X.; Wang, Y.; Ge, X.; Tong, B.; Schaefer, V.; Wang, K.; Li, C. The quantitative assessment of clogging and cleaning effects on the permeability of pervious concrete. Constr. Build. Mater. 2022, 335, 127455. [Google Scholar] [CrossRef]
  23. Zhong, R.; Wille, K. Linking pore system characteristics to the compressive behavior of pervious concrete. Cem. Concr. Compos. 2016, 70, 130–138. [Google Scholar] [CrossRef]
  24. Kia, A.; Wong, H.S.; Cheeseman, C.R. High-strength clogging resistant permeable pavement. Int. J. Pavement Eng. 2021, 22, 271–282. [Google Scholar] [CrossRef]
  25. Kumar, K.; Kozak, J.; Hundal, L.; Cox, A.; Zhang, H.; Granato, T. In-situ infiltration performance of different permeable pavements in an employee used parking lot—A four-year study. J. Environ. Manag. 2016, 167, 8–14. [Google Scholar] [CrossRef] [PubMed]
  26. Rahman, T.; Tajudin, A.N.; Wulaningtyas, A.H.; Andika, N.; Irawan, M.Z.; Widyatmoko, I. Recent developments in mitigating clogging in permeable pavements: A state-of-the-art review. Innov. Infrastruct. Solut. 2025, 10, 80. [Google Scholar] [CrossRef]
  27. Boogaard, F.; Lucke, T.; Beecham, S. Effect of age of permeable pavements on their infiltration function. Clean Soil Air Water 2014, 42, 146–152. [Google Scholar] [CrossRef]
  28. Bean, E.Z. A Field Study to Evaluate Permeable Pavement Surface Infiltration Rates, Runoff Quantity, Runoff Quality, and Exfiltrate Quality. Master’s Thesis, North Carolina State University, Raleigh, NC, USA, 2005. Available online: https://repository.lib.ncsu.edu/items/c837c72a-b432-42a5-98eb-11f4b49f8b9d (accessed on 5 August 2024).
  29. Lucke, T.; Beecham, S. Field investigation of clogging in a permeable pavement system. Build. Res. J. 2011, 39, 603–615. [Google Scholar] [CrossRef]
  30. Marcaida, A.K.; Nguyen, T.H.; Ahn, J. Investigation of particle-related clogging of sustainable concrete pavements. Sustainability 2018, 10, 4845. [Google Scholar] [CrossRef]
  31. Chen, L.M.; Chen, J.W.; Lecher, T.; Chen, T.H.; Davidson, P. Assessment of clogging of permeable pavements by measuring change in permeability. Sci. Total Environ. 2020, 749, 141352. [Google Scholar] [CrossRef] [PubMed]
  32. Architecture and Building Research Institute of Taiwan. Manual of Low Embodied-Carbon Building Rating System; Architecture and Building Research Institute of Taiwan: Taiwan, China, 2023. [Google Scholar]
  33. China Municipality. Sponge City Construction: Practical Technical Handbook; China Building Materials Industry Press: Beijing, China, 2017. [Google Scholar]
  34. Cooley, L.A., Jr. Permeability of superpave mixtures: Evaluation of field permeameters. In NCAT Report 99-1; National Center for Asphalt Technology (NCAT): Auburn, AL, USA, 1999. [Google Scholar]
  35. C1701/C1701M; Standard Test Method for Infiltration Rate of in Place Pervious Concrete. American Society for Testing and Materials (ASTM): West Conshohocken, PA, USA, 2017.
Figure 1. A photo taken from above the P3 study site demonstrates an overview of the three pavement systems, facing north from left to right: JW, IC, and PC (photo courtesy of James Boltz).
Water 17 02140 g001
Figure 2. Square frame S-4 was used in this study for permeability measurement on (a) PC and (b) JW.
Water 17 02140 g002
Figure 3. (a) The electric pressure washer used for cleaning maintenance; (b) the operator was holding the spray nozzles to perform processes of pavement cleaning.
Water 17 02140 g003
Figure 4. A borescope was utilized to observe JW aqueducts through the top of its opening on the JW pavement surfaces.
Water 17 02140 g004
Figure 5. The permeability trend of PC and JW measured between 2019 and 2025. Note: Data used for 2019 were based on the previous study [31]; data displayed in the year 2024 were the data before the maintenance (Table 3). Cor: corner area; Cen: center area; NM: no maintenance; and RDNM: random areas on the other half of the pavement pad without maintenance. Some RDNM data were not collected to prevent other investigations from being affected.
Water 17 02140 g005
Figure 6. Patterns that were commonly observed on the surfaces of PC (ae) and on the surfaces of JW (fj), with substances on or in the surface layer, some of which caused reduced permeability if they could not be removed.
Water 17 02140 g006
Figure 7. Photo that shows surfaces of (a) PC and (b) JW during cleaning operation.
Water 17 02140 g007
Figure 8. Photos taken in JW aqueducts in the sections (ac) with pressure washer maintenance, (df) without maintenance, and (gi) without maintenance but after pouring water.
Water 17 02140 g008
Table 1. Multiple types of permeable pavement systems with applications, associated maintenance practices, and performance after maintenance.
Pavement TypeApplicationMaintenancePerformance
Porous asphalt (PA)Traffic/pedestrian surfaces and infiltrationVacuum, pressure wash, mill, and seasonal upkeep
  • Infiltration rose from 0.50 ± 0.26 to 3.48 ± 3.00 mm/min (initially > 290 mm/min) after pressure washing and vacuuming, indicating partial restoration [14].
  • Unmaintained pavements fell below 1000 mm/h by year 4, but milling at 2.5 cm restored a 21-year-old porous asphalt pavement to near-original levels [20].
Concrete grid pavement (CGP)Lots, driveways, and access roadsVacuum removal of debris
  • At the Kinston CGP, 40 mm of runoff from 65 mm rain (pre-maintenance) dropped to 2 mm from 345 mm of rainfall over 16 events (post-sweeping).
  • Simulated infiltration rose by 76% from 4.9 cm/h to 8.6 cm/h, after removing 13–19 mm of surface material [28].
Permeable interlocking concrete pavers (PICPs)Roads, parking, and pedestrian zonesSurface joint cleaning
  • After 8 years of nonmaintenance, PICP infiltration ranged from 6 mm/h (blocked) to 11,100 mm/h (unblocked). Despite up to 5 orders of magnitude reduction, >90% of sediments were retained in the paver and bedding layers [29].
Concrete block pavers (CBPs), plastic grids, and pervious/porous pavementLots, paths, driveways, and turfNo method
  • Permeable pavements decline in performance within 3–4 years due to sediment clogging and pore collapse, reducing infiltration and stability. Turfstone®, UNI Eco-Stone®, and Grasspave™ reduced runoff significantly, Grasspave™ by up to 93% vs. asphalt [12].
Permeable pavers (PPs)Employee parking lotSpray, sweep, and vacuum; jet wash and suction
  • After 4 years, infiltration in permeable pavers fell from 25.4 mm/s to 3.8 mm/s, a 90% drop in driving areas. Even 3.8 mm/s remained 380 higher than a 5-year, 1 h storm rate (0.01 mm/s), showing sustained hydrological function [25].
Permeable concrete pavements (PCPs)LID zones, low traffic, and pedestrian areasHose rinse and vacuum
  • Permeability declined by up to 90% with graded sand (CP 4) and 67% with single-sized sand (CP 3); PC dropped by 67% and 61%, but pressure washing restored initial rates [30].
  • Permeable concrete lost ~35% conductivity; maintenance like vacuuming restored up to 90%, pressure washing with power blowing increased rates ~200 times [16].
Clogging-resistant pavement (CRP)Urban drainage and low-traffic areasCRP’s design resists clogging
  • CRP maintained up to 11.9 cm/s permeability with no flow loss after multiple clogging cycles, showing strong resistance to sediment blockage [24].
Table 2. Mean permeability (cm/s) of PC measured at multiple locations during summer seasons in 2020–2023. Measurements show the total number of measurements performed on locations indicated.
PadLeftMiddleRight
Area 1CrlCtrCrrCrlCtrCrrCrlCtrCrr
Measurement262262262
20201.384.501.021.825.452.050.324.540.25
20210.764.260.401.655.221.940.414.090.14
20220.223.750.281.524.741.720.283.820
202303.2201.324.221.460.352.890
Note: Data of the corners of PC shown did not fully overlap the locations in the previous year. 1 Ctl: left corner; Ctr: center; and Crr: right corner, as indicated in Figure S1.
Table 3. Mean permeability (cm/s) of JW measured at multiple locations during summer seasons in 2020–2023. Measurement shows the total number of measurements performed on the locations indicated.
PadLeftMiddleRight
Area 1CrlCtrCrrCrlCtrCrrCrlCtrCrr
Measurement666666666
20207.057.677.287.327.047.137.137.867.62
20217.267.627.867.397.127.357.057.447.02
20226.907.397.597.266.827.287.337.667.48
20237.127.288.177.577.117.527.047.267.11
1 Ctl: left corner; Ctr: center; and Crr: right corner, as indicated in Figure S1.
Table 4. Mean permeability (cm/s) of PC and JW measured at the center and corner locations before pressure washing maintenance in August 2024 and after maintenance in September 2024 and April 2025. Measurement shows the total number of measurements performed on the locations indicated.
PavementPCJW
PadLeftMiddleRightLeftMiddleRight
Location 1CrlCtrCrrCrlCtrCrrCrlCtrCrrCrlCtrCrrCrlCtrCrrCrlCtrCrr
Measurement333333333333333333
Before Wash08/20240.132.800.371.284.251.560.512.4407.526.787.347.047.307.526.957.636.85
After Wash09/20242.875.582.554.605.704.434.505.052.547.306.677.287.627.227.947.207.197.63
04/20253.095.422.494.415.534.044.744.992.696.986.647.587.127.657.256.987.287.25
Note: The corner locations where the two measurements were performed after maintenance did not overlap. 1 Ctl: left corner; Ctr: center; and Crr: right corner, as indicated in Figure S2.
Disclaimer/Publisher’s Note: The statements, opinions and data contained in all publications are solely those of the individual author(s) and contributor(s) and not of MDPI and/or the editor(s). MDPI and/or the editor(s) disclaim responsibility for any injury to people or property resulting from any ideas, methods, instructions or products referred to in the content.

