Abstract
Water scarcity and the growing demand for sustainable energy solutions have driven the need for renewable-powered desalination. This study evaluates three scenarios for reverse osmosis (RO) desalination powered by photovoltaic (PV), wind turbine (WT), and hybrid PV–WT systems, aiming to minimize the levelized costs of electricity (LCOE) and water (LCOW) while reducing grid dependence. The city studied is Zahedan, Iran, which has high potential in renewable energy. A multi-objective optimization approach using the Non-dominated Sorting Genetic Algorithm II (NSGA-II), a popular evolutionary algorithm, is employed to determine the optimal number of PV panels and wind turbines. The results show that the hybrid system outperforms single-source configurations, supplying 34.79 MWh of electricity and 34.19 m3 of desalinated water, while achieving the lowest LCOE (2.73 cent/kWh−1) and LCOW (35.33 cent/m−3). The hybrid scenario covers 65.49% of the electricity demand and 58.54% of the water demand, significantly reducing reliance on the grid compared to the PV and WT scenarios. Additionally, it ensures greater energy stability by leveraging the complementary nature of PV and WT. These findings highlight the techno-economic feasibility of hybrid renewable-powered desalination as a cost-effective and sustainable solution. Future research should focus on integrating energy storage to further enhance efficiency and minimize grid dependency.
1. Introduction
Water scarcity has emerged as one of the most pressing challenges worldwide, exacerbated by climate change and the rapid growth of urban populations [1]. Coupled with this, the increasing global demand for electricity further strains existing resources, highlighting the need for innovative solutions that address both water and energy shortages [2]. Desalination, particularly reverse osmosis (RO), has become a key method for producing freshwater, but its high energy consumption poses significant economic and environmental hurdles [3]. Other important technologies include multi-effect distillation (MED) and multi-stage flash (MSF), which are thermal-based processes commonly used in large-scale desalination plants, especially where low-cost thermal energy is available. However, their higher energy demand compared to that for RO makes them less suitable for small-scale or renewable-powered applications.
Renewable energy sources, such as photovoltaic (PV) solar panels and wind turbines (WTs), offer promising alternatives to traditional fossil fuels, providing clean and sustainable power while reducing reliance on the grid and lowering carbon emissions [4].
This study explores the integration of renewable energy into desalination systems to address these dual concerns. It evaluates three distinct scenarios in which RO desalination is powered by PVs, WTs, and a hybrid system of both. By assessing the potential of each system to meet energy demands while producing freshwater, this research aims to identify the most effective configurations. Through an optimization approach, this study determines the optimal number of PV panels and wind turbines needed to minimize the levelized costs of electricity (LCOE) and water (LCOW). The results offer insights into the feasibility and economic viability of renewable energy-powered desalination, providing a pathway for the development of more sustainable, hybrid energy–water systems. The following are some of the studies that have been conducted in this field.
Some studies have examined only the combination of desalination and solar systems. Kensara et al. [5] designed a solar-powered RO desalination plant for a power station. The system, generating 13,649 kWh daily, used PV panels for daytime operation and batteries for nighttime storage. Sizing was based on solar radiation and ambient temperature, with performance simulated in TNSYS. The results confirmed the system’s reliability, highlighting PV technology’s potential to improve RO desalination efficiency. Tourab et al. [6] analyzed a hybrid desalination system combining RO and humidification–dehumidification (HDH), enhanced by a solar PV system. A pressure exchanger improved RO efficiency, and exergy analysis showed maximum efficiencies of 23 and 23.25% for different configurations. Cost analysis revealed desalinated water costs ranging from USD 3.22 to 7.12 per m3, depending on battery storage. The findings demonstrated the system’s potential for improved energy efficiency and cost-effectiveness. Ayou et al. [7] assessed the techno-economic feasibility of a small-scale grid-connected PV-powered RO desalination plant in Madura Island, Indonesia. The plant, with a capacity of 11.6 m3·day−1, also utilized brine concentrate for salt production. Simulations based on local weather data confirmed the economic viability, with a payback period of four years and an 84% solar contribution. The LCOW was USD 9.0 per m3, making it more cost-effective than existing potable water sources. The results demonstrated that PV–RO desalination could provide a sustainable solution for water-stressed regions while reducing greenhouse gas emissions. Hekmatmehr et al. [8] designed a small-scale PV-powered RO desalination unit using a 9-year water analysis. The RO system was modeled in WAVE software under extreme feed water conditions, while the PV system was designed in PVSOL to reduce CO2 emissions and peak demand. During a 184-day period, the PV system met energy needs for 154 days, exporting excess power to the grid. The results showed that increasing the total dissolved solids had a greater impact on energy consumption than temperature changes. The system effectively reduced emissions and provided a sustainable solution for drinking water supply. Abdelrahman et al. [9] examined a PV-powered RO desalination plant with a solar thermal preheating system to improve efficiency. Simulations and experiments showed that increasing the feed water temperature reduced energy consumption by 6% and increased water production by 2.73%. The system also improved PV efficiency and reduced CO2 emissions by up to 521.4 tons annually. The results demonstrated the benefits of integrating thermal preheating into solar desalination systems.
Ravajiri et al. [10] integrated waste-to-energy technology with solar power and desalination to enhance sustainability. A system combining RO and HDH desalination, CO2 conversion, and renewable energy was analyzed. Energy and exergy efficiencies were 17.48% and 15.15%, with 8.42 MW net power output. Optimization improved exergy efficiency to 20.7%. The system demonstrated high CO2 conversion (99.96%) and economic feasibility. Abdelgaied et al. [11] simulated a stand-alone RO desalination plant with solar-powered pre-heating to reduce energy consumption. A PV system with thermal recovery and a solar dish concentrator pre-heated feed water in two stages, improving membrane performance. The results showed a 24.33–35.79% reduction in specific power consumption for brackish water and 18.69–22.87% for seawater. The system proved effective for remote areas, enhancing efficiency and sustainability.
Other studies have examined the combination of wind energy and desalination. Dehmas et al. [12] analyzed wind energy potential for seawater reverse osmosis (SWRO) desalination in Algeria, using Wasp and RET Screen software. A hypothetical wind farm with five turbines of type 2 MW was assessed for energy yield, economic feasibility, and CO2 emissions reduction. The results showed that wind energy could effectively power an SWRO plant in the region, highlighting its viability as a sustainable desalination solution. Alzahrani et al. [13] explored a novel battery-free desalination system using a compressed air energy storage system coupled with vertical axis wind turbines to drive RO desalination. A Simulink model was developed for technical and economic assessments, identifying the optimal configuration. The most cost-effective setup, using 11 VAWTs (vertical axis wind turbines) and a pressure exchanger, achieves an LCOW of USD 1.63 per m3 with an annual production of 9400 m3. This system effectively mitigates wind energy intermittency, providing a sustainable desalination solution for remote communities.
Ali et al. [14] optimized the design and operation of a wind-powered large-scale RO desalination plant. Different scenarios were analyzed, including the use of storage tanks or batteries and variable or fixed feed pressure. The results showed that using storage tanks led to lower water costs (USD 7.42 per m3) and a simpler structure compared to batteries (19.7 USD·m−3). Variable feed pressure helped manage wind intermittency, while fixed feed pressure ensured steady operation but required advanced control systems. The findings highlight the benefits of storage-based designs for cost-effective desalination. Hassan et al. [15] optimized a hybrid wind-turbine–diesel-battery system for SWRO desalination in NEOM city, aiming to minimize energy costs while producing 100 m3 of water per day. Using HOMER software, different SWRO unit sizes, control strategies, and battery types were analyzed. The optimal system, including a 90 kW wind turbine, 25 kW diesel generator, 47 Trojan SAGM batteries, and an SWRO-100 unit, achieved the lowest cost of energy at USD 0.337 per kWh. Compared to a diesel-only system, it reduced costs by 9.65%, with an 8.3-year payback period and a net present cost of USD 950,725. Esquivel-Puentes et al. [16] demonstrated a wind-powered system integrating hydrostatic transmission for simultaneous electricity generation and desalination. The system, comprising a simulated wind turbine, hydrostatic transmission, generator, and reverse osmosis unit, achieved 79% efficiency and stabilized wind fluctuations by 5%. Specific energy consumption ranged from 1.6 to 6.8 kWh·m−3, with energy recovery devices reducing consumption by up to 39%. The proposed system minimized costs and enabled net-zero CO2 emissions.
In another investigation, Li et al. [17] developed a multi-objective optimization model for large-scale hydropower stations, considering energy generation, grid firm power, and downstream ecological requirements for fish spawning. The model, solved using NSGA-II, was applied to a reservoir on the upper Yellow River in China, and the results demonstrated that a reasonable balance among energy and ecological goals can be achieved. Furthermore, Li et al. [18] proposed a multi-objective optimization framework for the long-term equilibrium operation of a hybrid hydro-PV power system, using the Longyangxia project in China as a case study. Their model aimed to balance economic benefits, power supply stability, and grid tolerance and was solved using NSGA-II. The results revealed competitive interactions among the objectives and identified key inflection points on the Pareto front as optimal trade-off solutions.
Other studies have examined hybrid wind and solar systems and the use of desalination. Ghaithan et al. [19] developed a multi-objective model for sizing a grid-connected PV–wind system to power an RO desalination plant in Saudi Arabia. The model optimized cost, emissions, and grid reliance, generating Pareto-optimal solutions. The best scenario with 100 PV modules and 94 wind turbines covered 18% of energy demand while minimizing CO2 emissions (90,899 kg·year−1) at a cost of USD 0.0557 per kWh. The results highlighted the economic and environmental benefits of hybrid renewable energy for desalination. Ghanbari et al. [20] designed and optimized a hybrid renewable energy system using PV, wind turbines, batteries, and an RO desalination unit to supply potable water and electricity. Six optimization algorithms were tested; particle swarm optimization demonstrated the highest performance in single-objective optimization, while multi-objective particle swarm optimization excelled in multi-objective optimization. The optimal system had a total annual cost of USD 4.37 million (single-objective) and USD 6.09 million (multi-objective). Sensitivity analysis showed solar panel price as the most influential factor, affecting the TAC (total annual cost) by up to 17%. Qudah et al. [21] optimized a hybrid renewable energy system with water tank storage to power an RO unit using a Differential Evolution algorithm. For constant demand (0.208 m3·day−1), the optimal setup included 6.8 kW PV, 2 kW WT, and a 10.5 m3 tank, achieving an LCOW of USD 1.44 per m3. For variable demand (15 m3·day−1), the system adjusted to 12.4 kW PV, 7 kW WT, and a 42.8 m3 tank, lowering the LCOW to USD 1.29 per m3. Utilizing surplus energy for desalination further reduced costs to USD 0.95 per m3. The system cut CO2 emissions by up to 12 tons/year and improved cost efficiency. Eltamaly et al. [22] proposed an autonomous hybrid renewable energy system to supply 1000 m3·day−1 of desalinated water using RO technology. The system, consisting of PV, wind turbines, and batteries, was designed to generate 2440 kW at minimal cost and supply loss. Three optimization methods—particle swarm optimization, Bat Algorithm (BA), and Social Mimic Optimization—were compared, with BA proving to be the fastest and most accurate. The system demonstrated the feasibility of RES for RO desalination, achieving a desalinated water cost of USD 0.745 per m3.
Despite the valuable studies that have been conducted in this field, there are a number of points that have not yet been seen:
- In the studies conducted, each system has been examined separately and the comparison of these systems with each other has not been examined.
- The optimal combined system used from energy and economic perspectives to reduce the need for the grid has not been examined.
In this study, as an innovation:
- Three systems with renewable sources of photovoltaics, wind turbines, and a hybrid system are compared from an energy and economic perspective to select the best scenario.
- In a multi-objective optimization study, the optimal systems in each scenario are selected from energy and economic perspectives to create the greatest reduction in the electricity grid.
It should be mentioned that the word “Artificial Intelligence (AI)” in the title was based on the application of NSGA-II, which is a well-established evolutionary algorithm categorized under the broader AI/soft-computing umbrella.
2. Materials and Methods
2.1. System Description
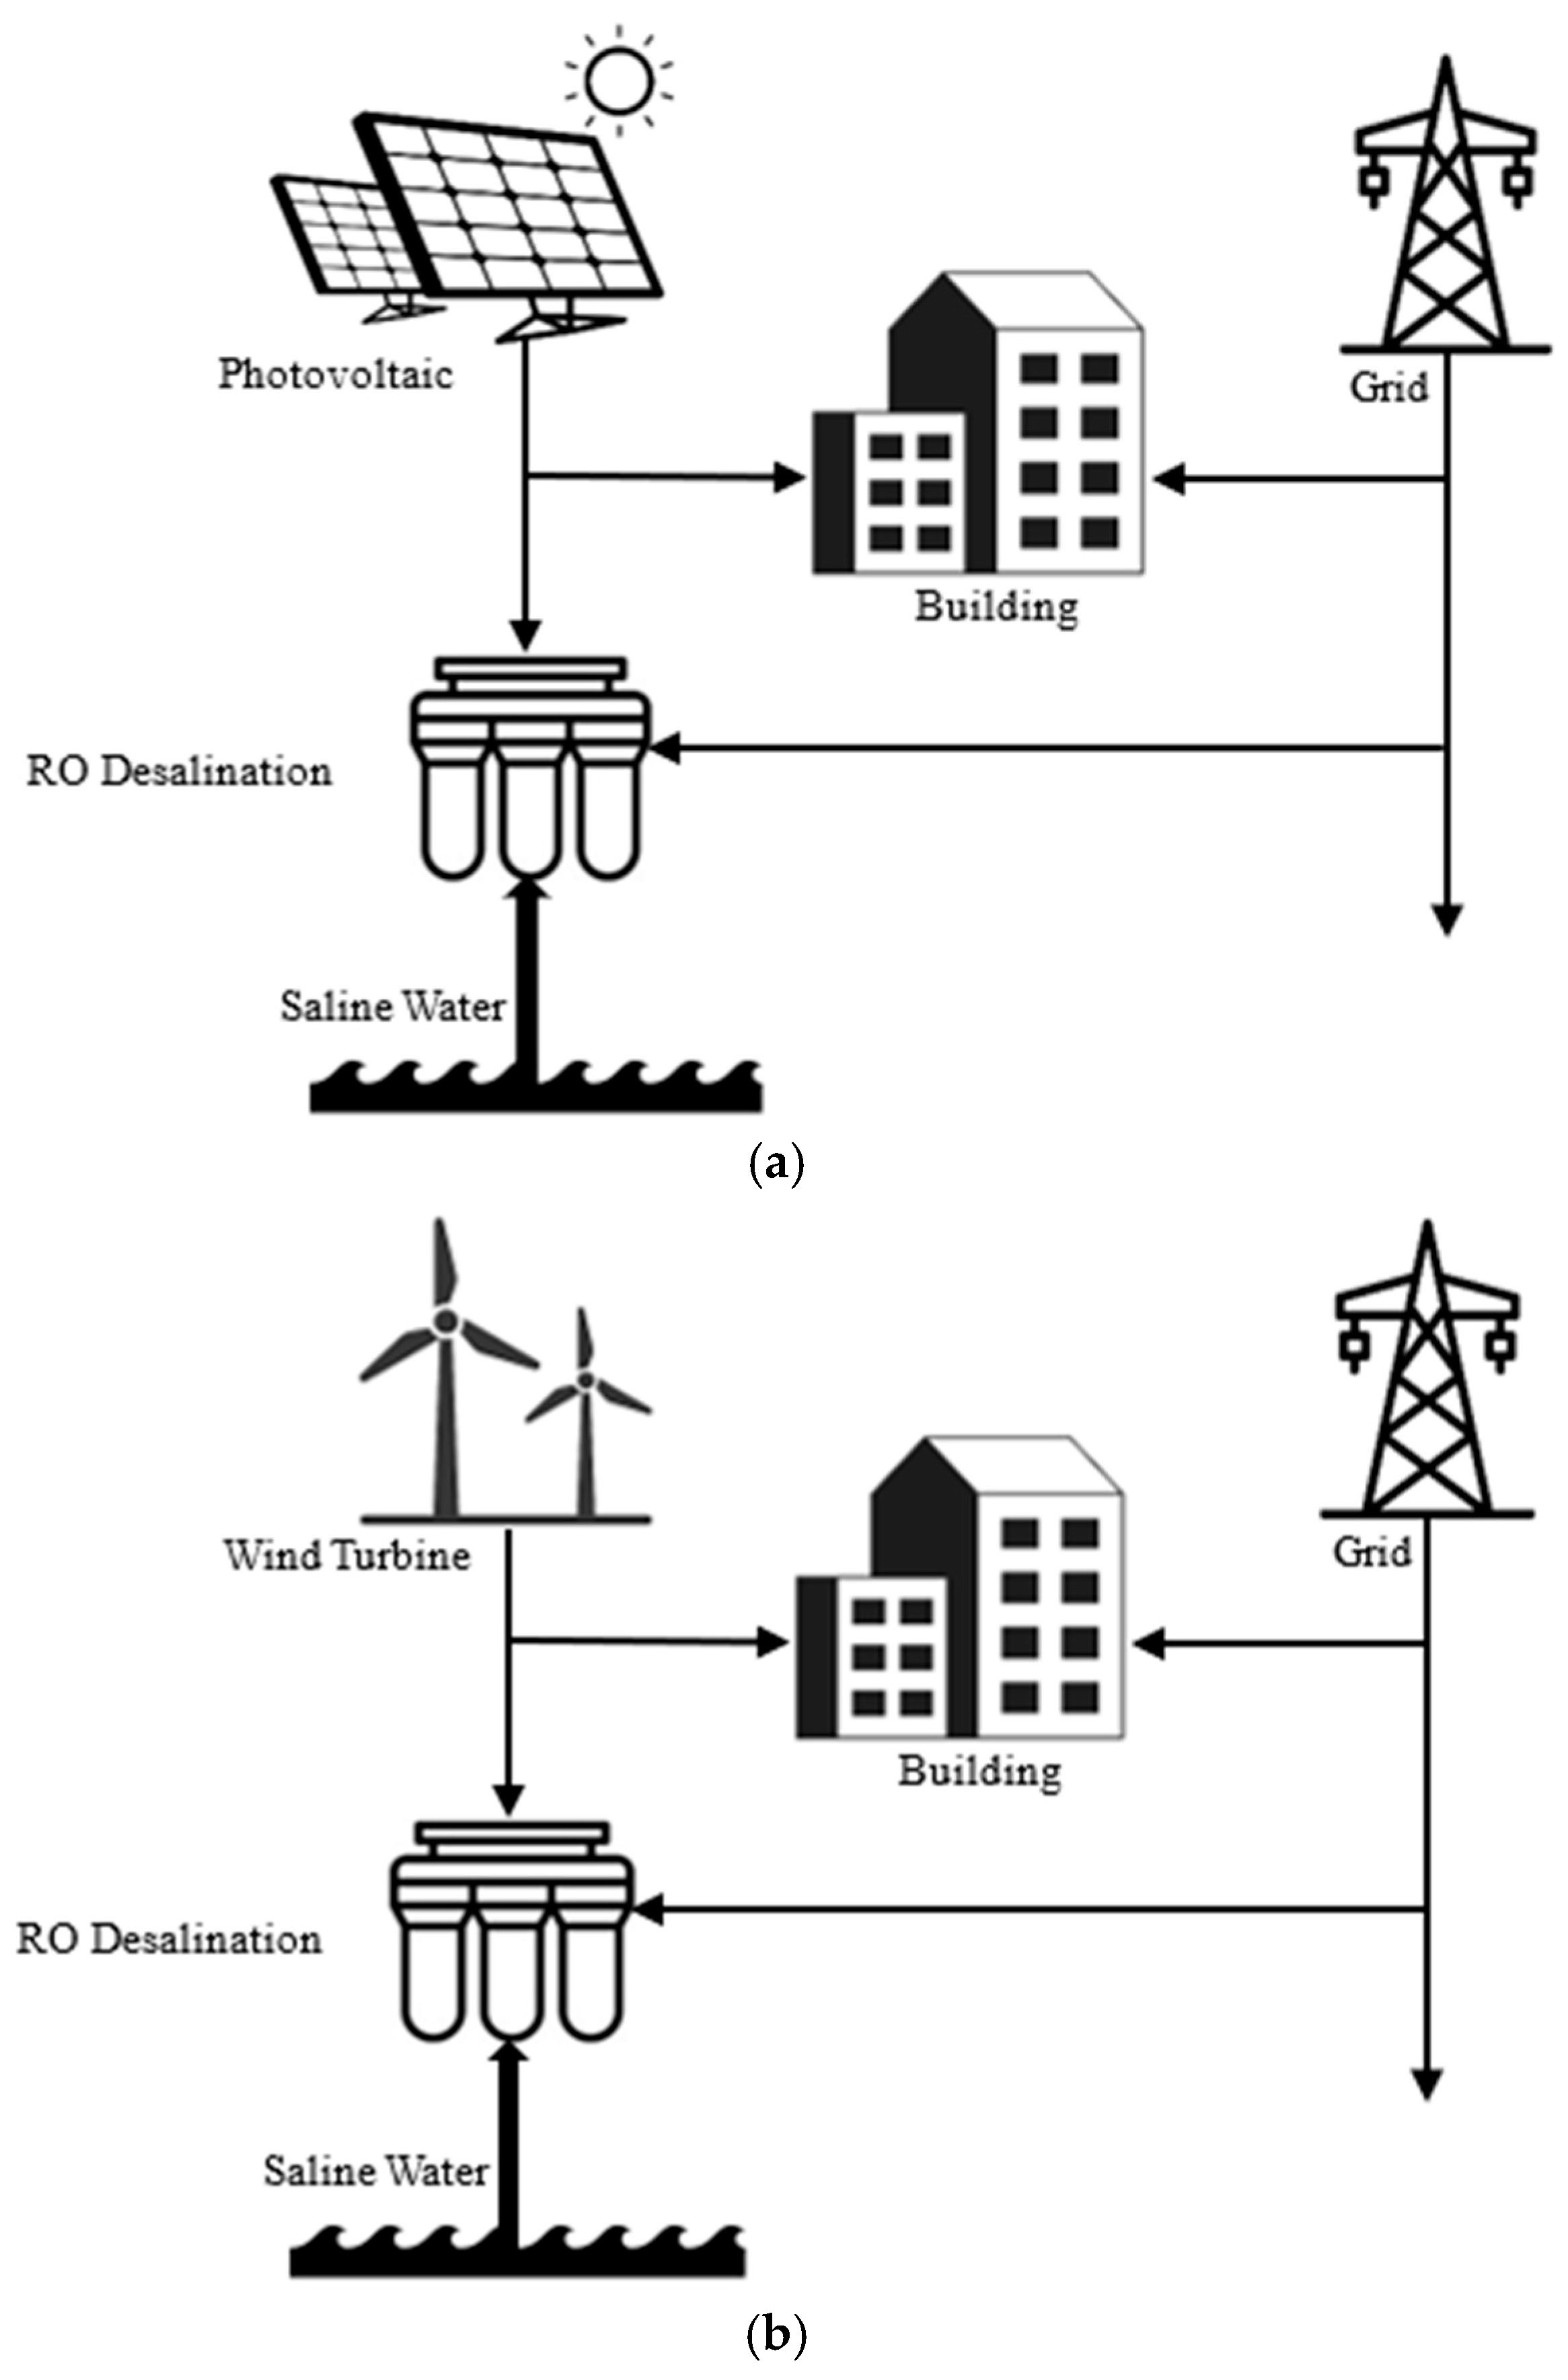
The system examined includes three scenarios. In the first scenario, the PV system is responsible for generating power. This generated electrical energy is used in a consumer building, and the excess of the generated energy supplies the electrical energy required for the desalination of water in an RO desalination system. Moreover, during hours when the generated electrical energy is low, the required energy is supplied from the grid, and during hours when the generated electrical energy is more than required, the electrical energy is sold to the grid. In the second scenario, instead of the PV system, WTs are used. In the third scenario, the power generation system is the PV system and WTs. Figure 1 shows the three introduced scenarios.

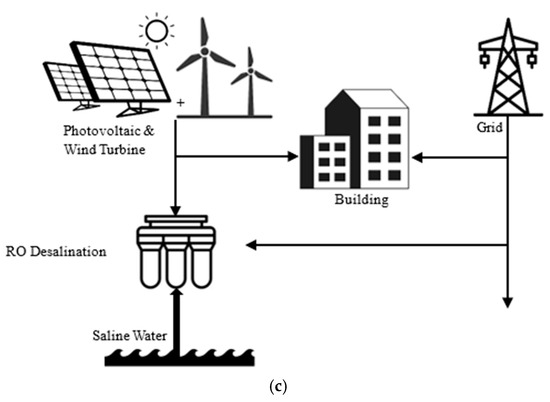
Figure 1.
Systems under study: (a) PV; (b) WT; (c) Hybrid.
PV, WT, and hybrid PV–WT systems each offer distinct advantages for powering reverse osmosis (RO) desalination. PV systems are simpler to install and maintain, especially in sunny regions, but they suffer from lower efficiency during cloudy conditions or at night [23]. WT systems can provide more stable output in windy areas but are sensitive to seasonal wind variability and may require higher initial investment. Hybrid PV–WT systems combine the strengths of both, offering more consistent energy supply and better system reliability, especially in places like Zahedan, which enjoys high potential for both solar and wind energies. Although hybrid systems typically involve higher capital costs, they often result in a lower levelized cost of water due to improved capacity utilization and reduced reliance on battery storage or backup generators.
2.2. Case Study
In this section, the city and the building under study are analyzed. The city under study is Zahedan, located in Sistan and Baluchestan. The high potential of this city in solar and wind energy has made this city have high potential in terms of renewable energy. The characteristics of this city are given in Table 1. Moreover, the chosen building is a 5-story residential building with two units on each floor. More characteristics of the building are given in Table 2. In addition, in order not to make the paper so long, the reference for the received solar irradiance and wind velocity is introduced, which is [24].

Table 1.
Zahedan weather overview [24].
Table 2.
Overall heat transfer coefficient values (W·m−2·K−1) [25].
2.3. Energy Modeling
The equipment used in this modeling were a photovoltaic system, a wind turbine, and an RO desalination plant. All the utilized parts of the modeling came from the well-established and validated models that are widely applied in the literature, like [20,26], and for the simulation and analysis of hybrid renewable energy systems. The assumption about the treatment of inefficiencies is exactly the same as in them.
The modeling method for each is given below.
2.3.1. PV Panel
Equation (1) is used to calculate the power output of PV panel [27]:
where is produced energy; is reference efficiency; is temperature coefficient; is the reference temperature, which is equal to 25 °C; is irradiance; is area of PV panel; and is temperature of the PV, which is calculated from Equation (2).
in which is ambient temperature and is nominal operating cell temperature.
2.3.2. Wind Turbine
To calculate the power generated in wind turbines, the wind speed received by the turbine must be determined. Given that information about the wind speed of an area is often known at a reference height, , then the wind speed at the center of the turbine must be obtained, which is specified in Equation (3) [28].
Once the wind speed is determined, the power generated by the wind turbine is determined according to Equation (4) [29].
in which is cut-in wind speed (3 m·s−1), is rated wind (12 m·s−1), and is cut-out wind speed (25 m·s−1). Moreover, is nominal power of WT.
2.3.3. RO Desalination
The RO desalination plant requires electrical energy to produce desalinated water. The electrical energy consumption of this desalination plant is obtained according to Equation (5) [20].
where is RO desalination demand, is feed water mass flow rate, is energy needed for pumping feed water, is concentrate mass flow rate, and is energy required for concentrate disposal. Equation (6) is also used to calculate the amount of fresh water [30].
in which is recovery rate. Equation (7) is also used to calculate concentrate mass flow rate [20].
The constant values of the energy parameters used are given in Table 3.
Table 3.
The constant values of the energy modeling [31].
The PV module used is a 580 W monocrystalline panel with dimensions 2.278 m × 1.133 m and an efficiency of 22.47%, sourced from AE Solar’s high-performance series. The panel characteristics are selected based on high-temperature operation suitability, important for Zahedan’s climate.
The wind turbine is a 2 kW horizontal-axis turbine designed for residential-scale deployment which is appropriate for Zahedan’s moderate but consistent wind conditions. The turbine operates at a hub height of 13 m, consistent with typical low-rise installations.
2.4. Economic Modeling
To compare the scenarios studied from an economic perspective, two parameters, LCOE and LCOW, have been calculated. The method for calculating LCOE is given in Equation (8) [32].
in which is present cost, is initial cost, is operating and maintenance, and is generated electricity. Equation (9) is used to calculate the present cost of initial costs.
Equation (10) is used to calculate the present cost of maintenance.
in which and are discount rate and lifetime of system. Equation (11) can also be used for LCOW [33].
in which is desalinated water. The constant values of the economic parameters used are given in Table 4.
Table 4.
The values used to conduct the economic modeling.
In this study, the LCOE was calculated using the standard techno-economic formulations widely validated in the literature. While software tools like HOMER and PVsyst are well-established for such analyses, our primary focus was to develop a flexible and integrative optimization framework based on NSGA-II. This allowed simultaneous consideration of technical and economic objectives under specific constraints tailored to the case study.
2.5. Optimization Procedure
As mentioned, three scenarios including the PV system, WT system, and hybrid system are considered. In order to determine the best system size, optimization is required [34]. The number of each system is introduced as a decision variable, which is given in Equation (12).
Moreover, the decision functions include LCOE, LCOW, GE, and DW, according to Equation (13).
As an important note, it should be mentioned that although the four objectives used in this study are not entirely independent, they have been widely adopted in the existing literature as the key performance indicators for water–energy systems. Consequently, having these objectives enables direct comparison with previously published works and aligns with standard benchmarking practices.
Moreover, despite the point that they might have some mathematical dependence (e.g., GW depending on GE and both cost indicators being functions of system outputs and capital costs), each of these objectives reflects a unique and practically relevant aspect of the system: energy supply, water output, and cost efficiency.
Moreover, the optimization method used is the non-dominated sorting genetic algorithm II (NSGA-II) [35], which extracts optimal solutions using MATLAB software (R2025a). Hourly weather data from Zahedan was employed for a full year, and the corresponding results were extracted at the same hourly intervals.
3. Results and Discussion
3.1. Validation
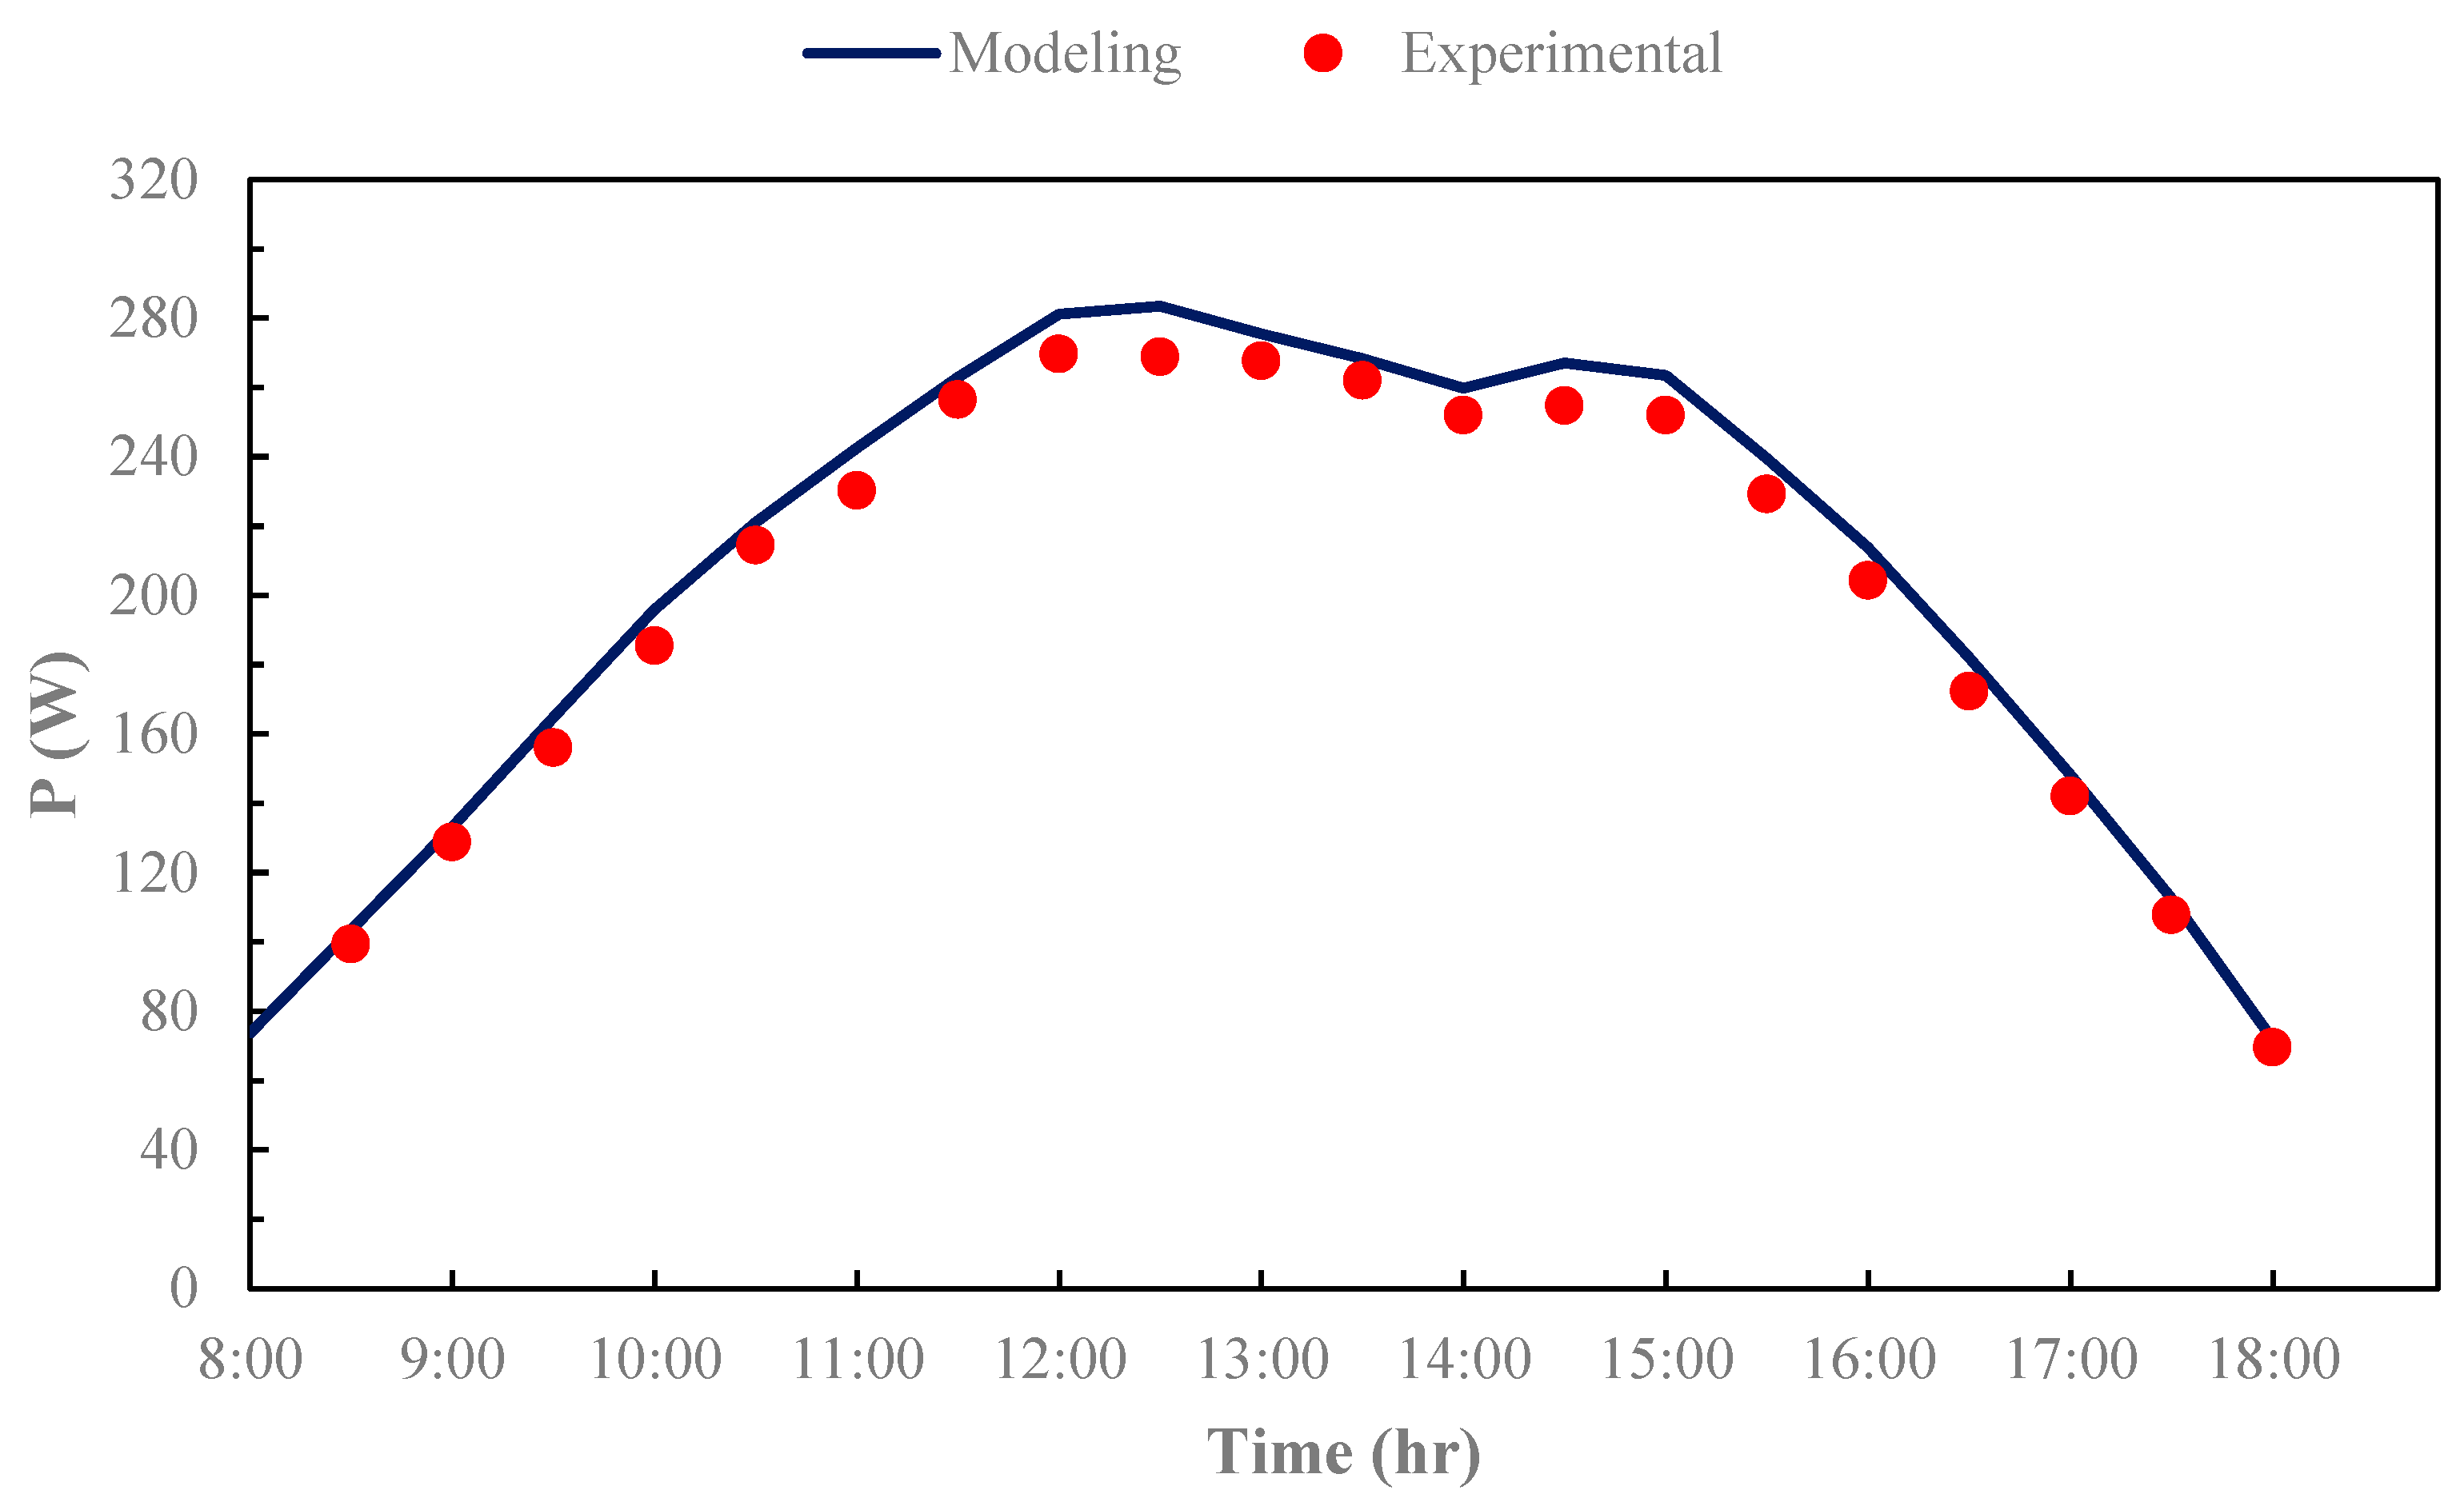
To ensure the accuracy of the simulation methods, validation has been carried out for both PV and wind turbines. The average prediction error for the PV system is observed in Figure 2 to be 4.00%, demonstrating that the modeling methods are reliable for further analysis. The validation was performed using the empirical data from one of the research group’s previous studies [36] and corresponded to a sample clear-sky day.
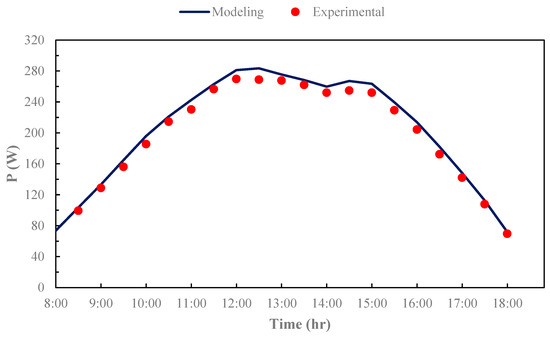
Figure 2.
Validation of solar system modeling using the experimental data available in [36].
For the wind turbine validation, data from the reference [37] was utilized. A comparison between the simulation results and the experimental data from [37] reveals an average error of 4.79%. Consequently, the reliability of the simulation model used for the wind turbine is confirmed.
3.2. Optimization Result
The results obtained from the optimization in each scenario are described in detail below.
3.2.1. PV System
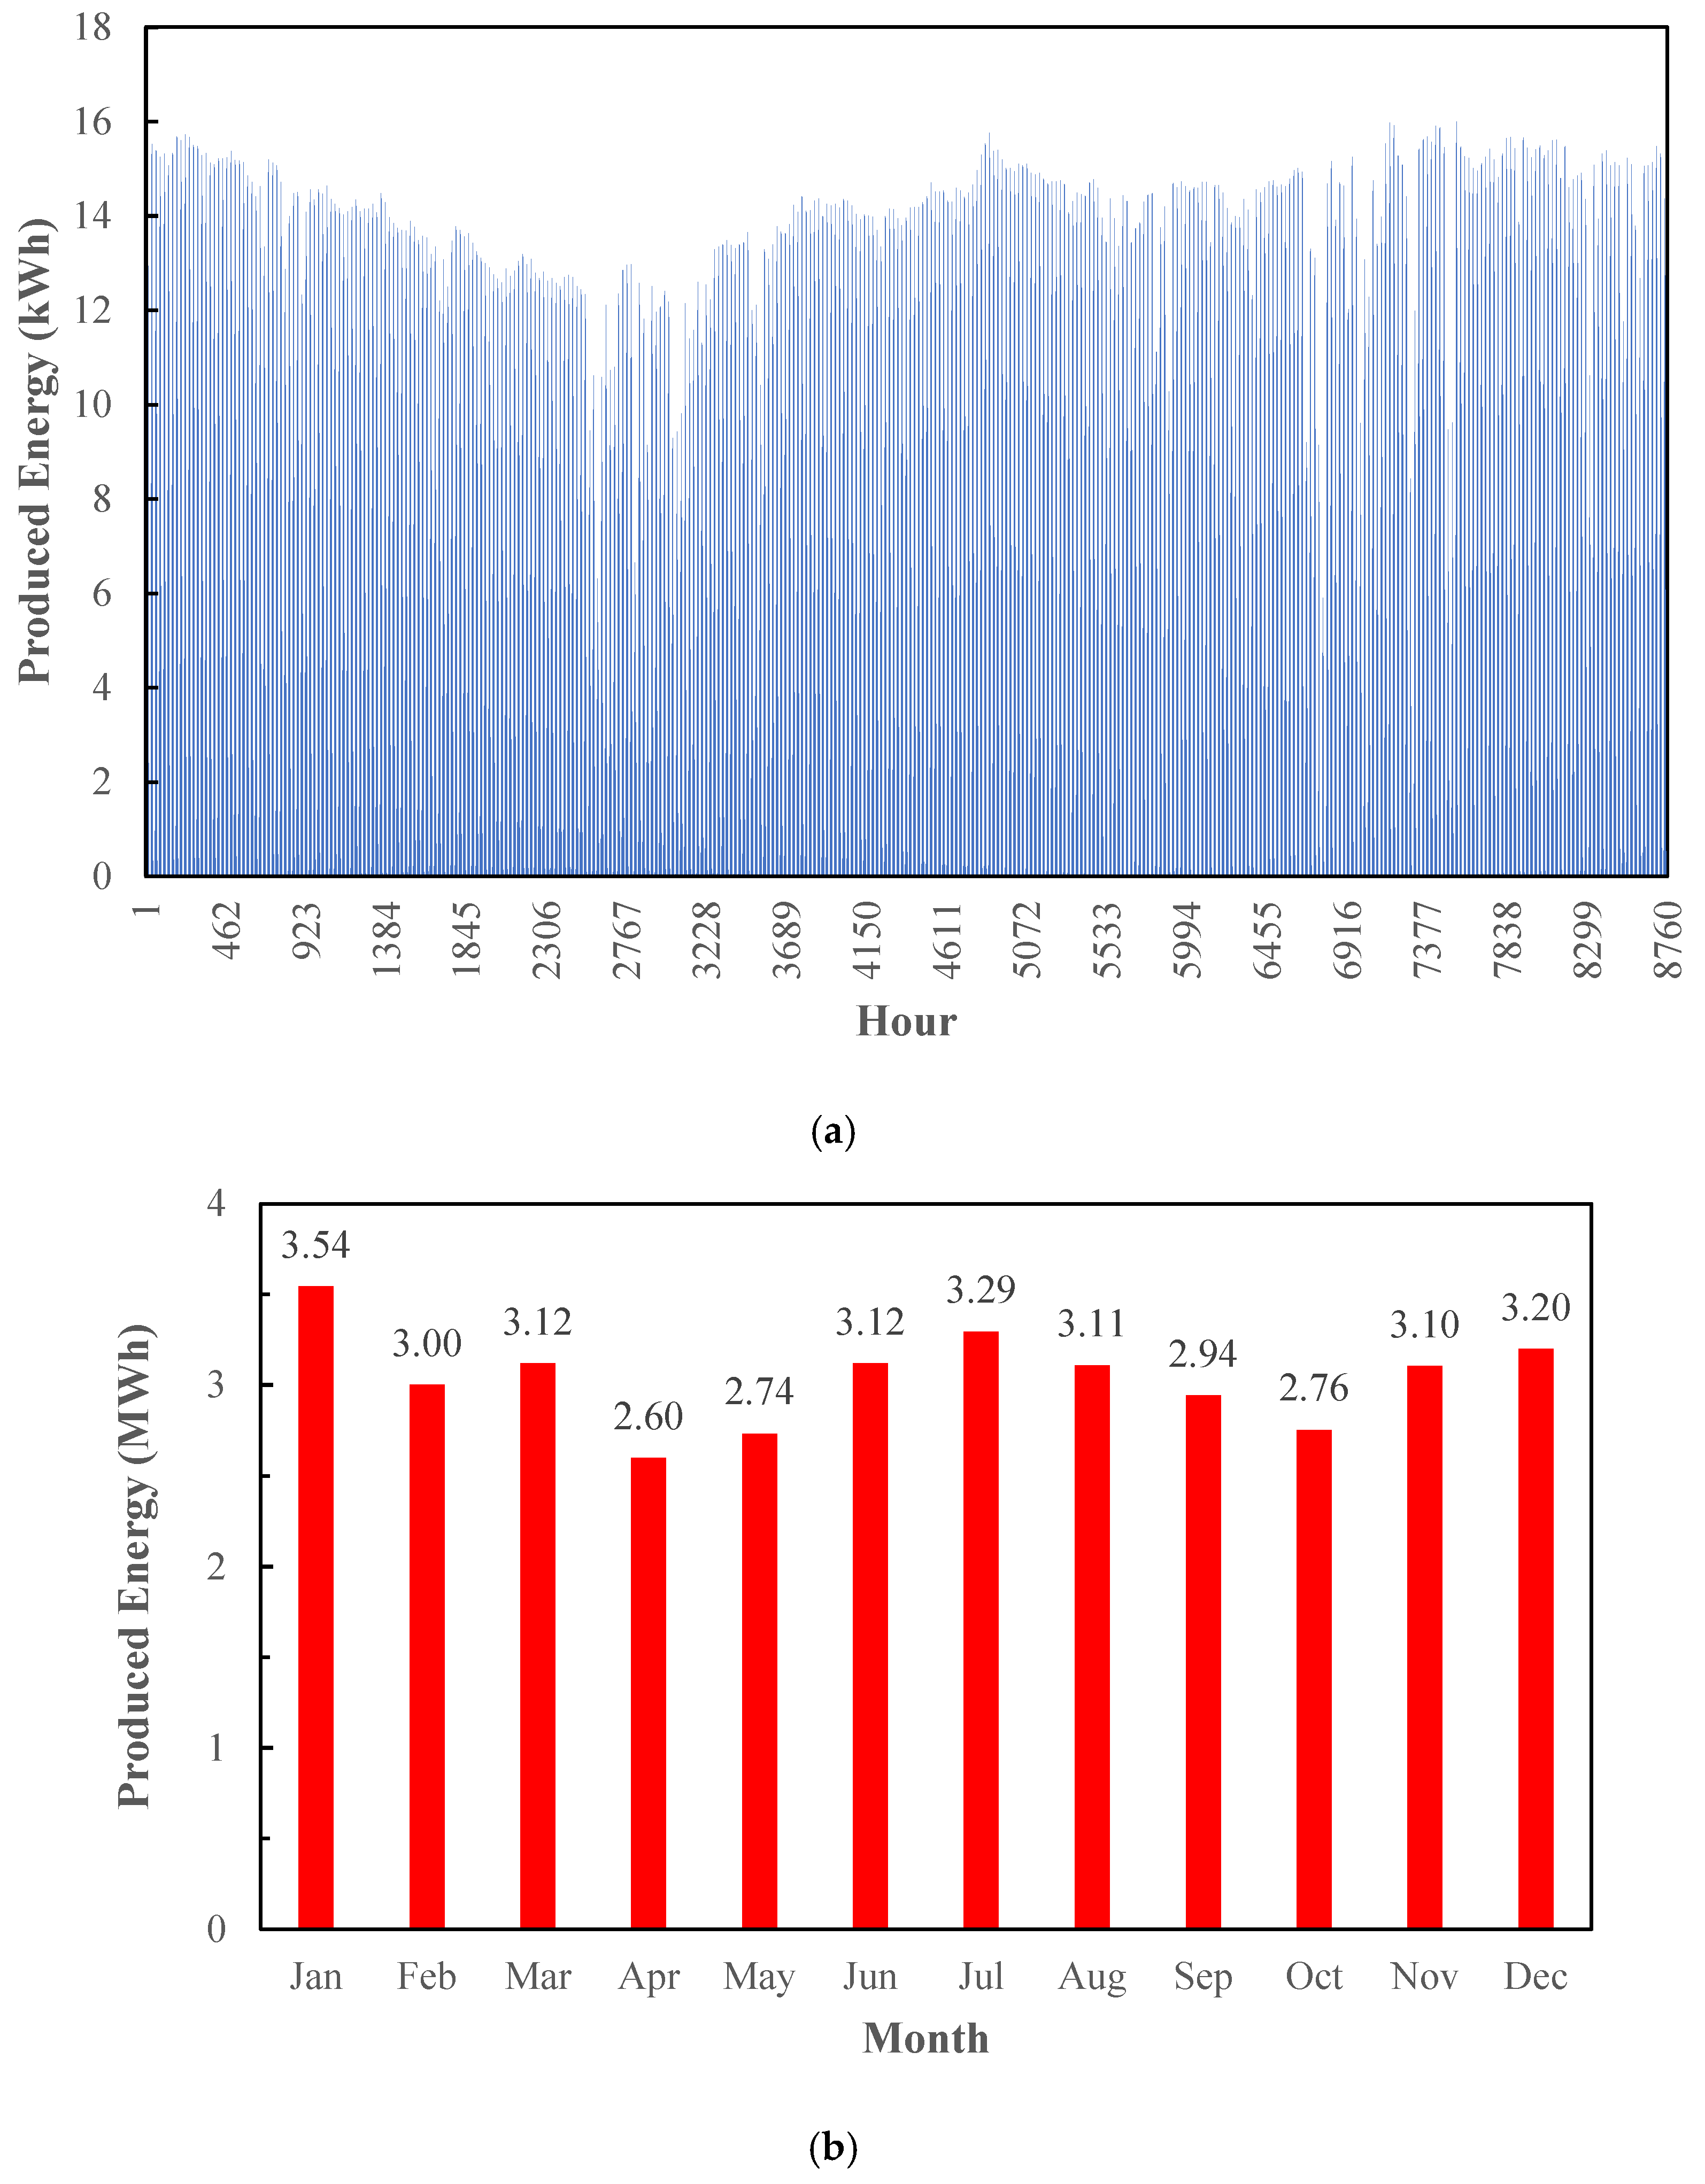
Figure 3 presents the energy production of the PV system on an hourly (a) and monthly (b) basis. The hourly profile indicates peak production during midday when solar irradiance is at its highest. For example, at 1 pm in July, 14.17 energy is produced from photovoltaics, but at 1 pm on 1 February this energy is produced at 13.07 kWh. The monthly production shows seasonal variations, with higher energy generation in summer months due to increased sunlight availability. Moreover, the high solar potential in Zahedan has led to the production of high electrical energy in other months of the year due to low ambient temperatures and issues related to panel cooling. For example, the amount of energy produced in January and July is at its highest, equal to 3.54 and 3.29 MWh, while in April and October, the amount of energy produced is at its lowest, equal to 2.60 and 2.76 MWh.

Figure 3.
Produced energy in PV scenario: (a) hourly; (b) monthly.
The high energy production in January can be explained by the combination of relatively high solar irradiance and low ambient temperatures in Zahedan. While July also receives strong solar radiation, higher ambient temperatures reduce the efficiency of PV modules. In contrast, the cooler conditions in January improve PV performance by keeping the module temperature low, resulting in the highest efficiency and also the greatest monthly energy output despite shorter daylight hours.
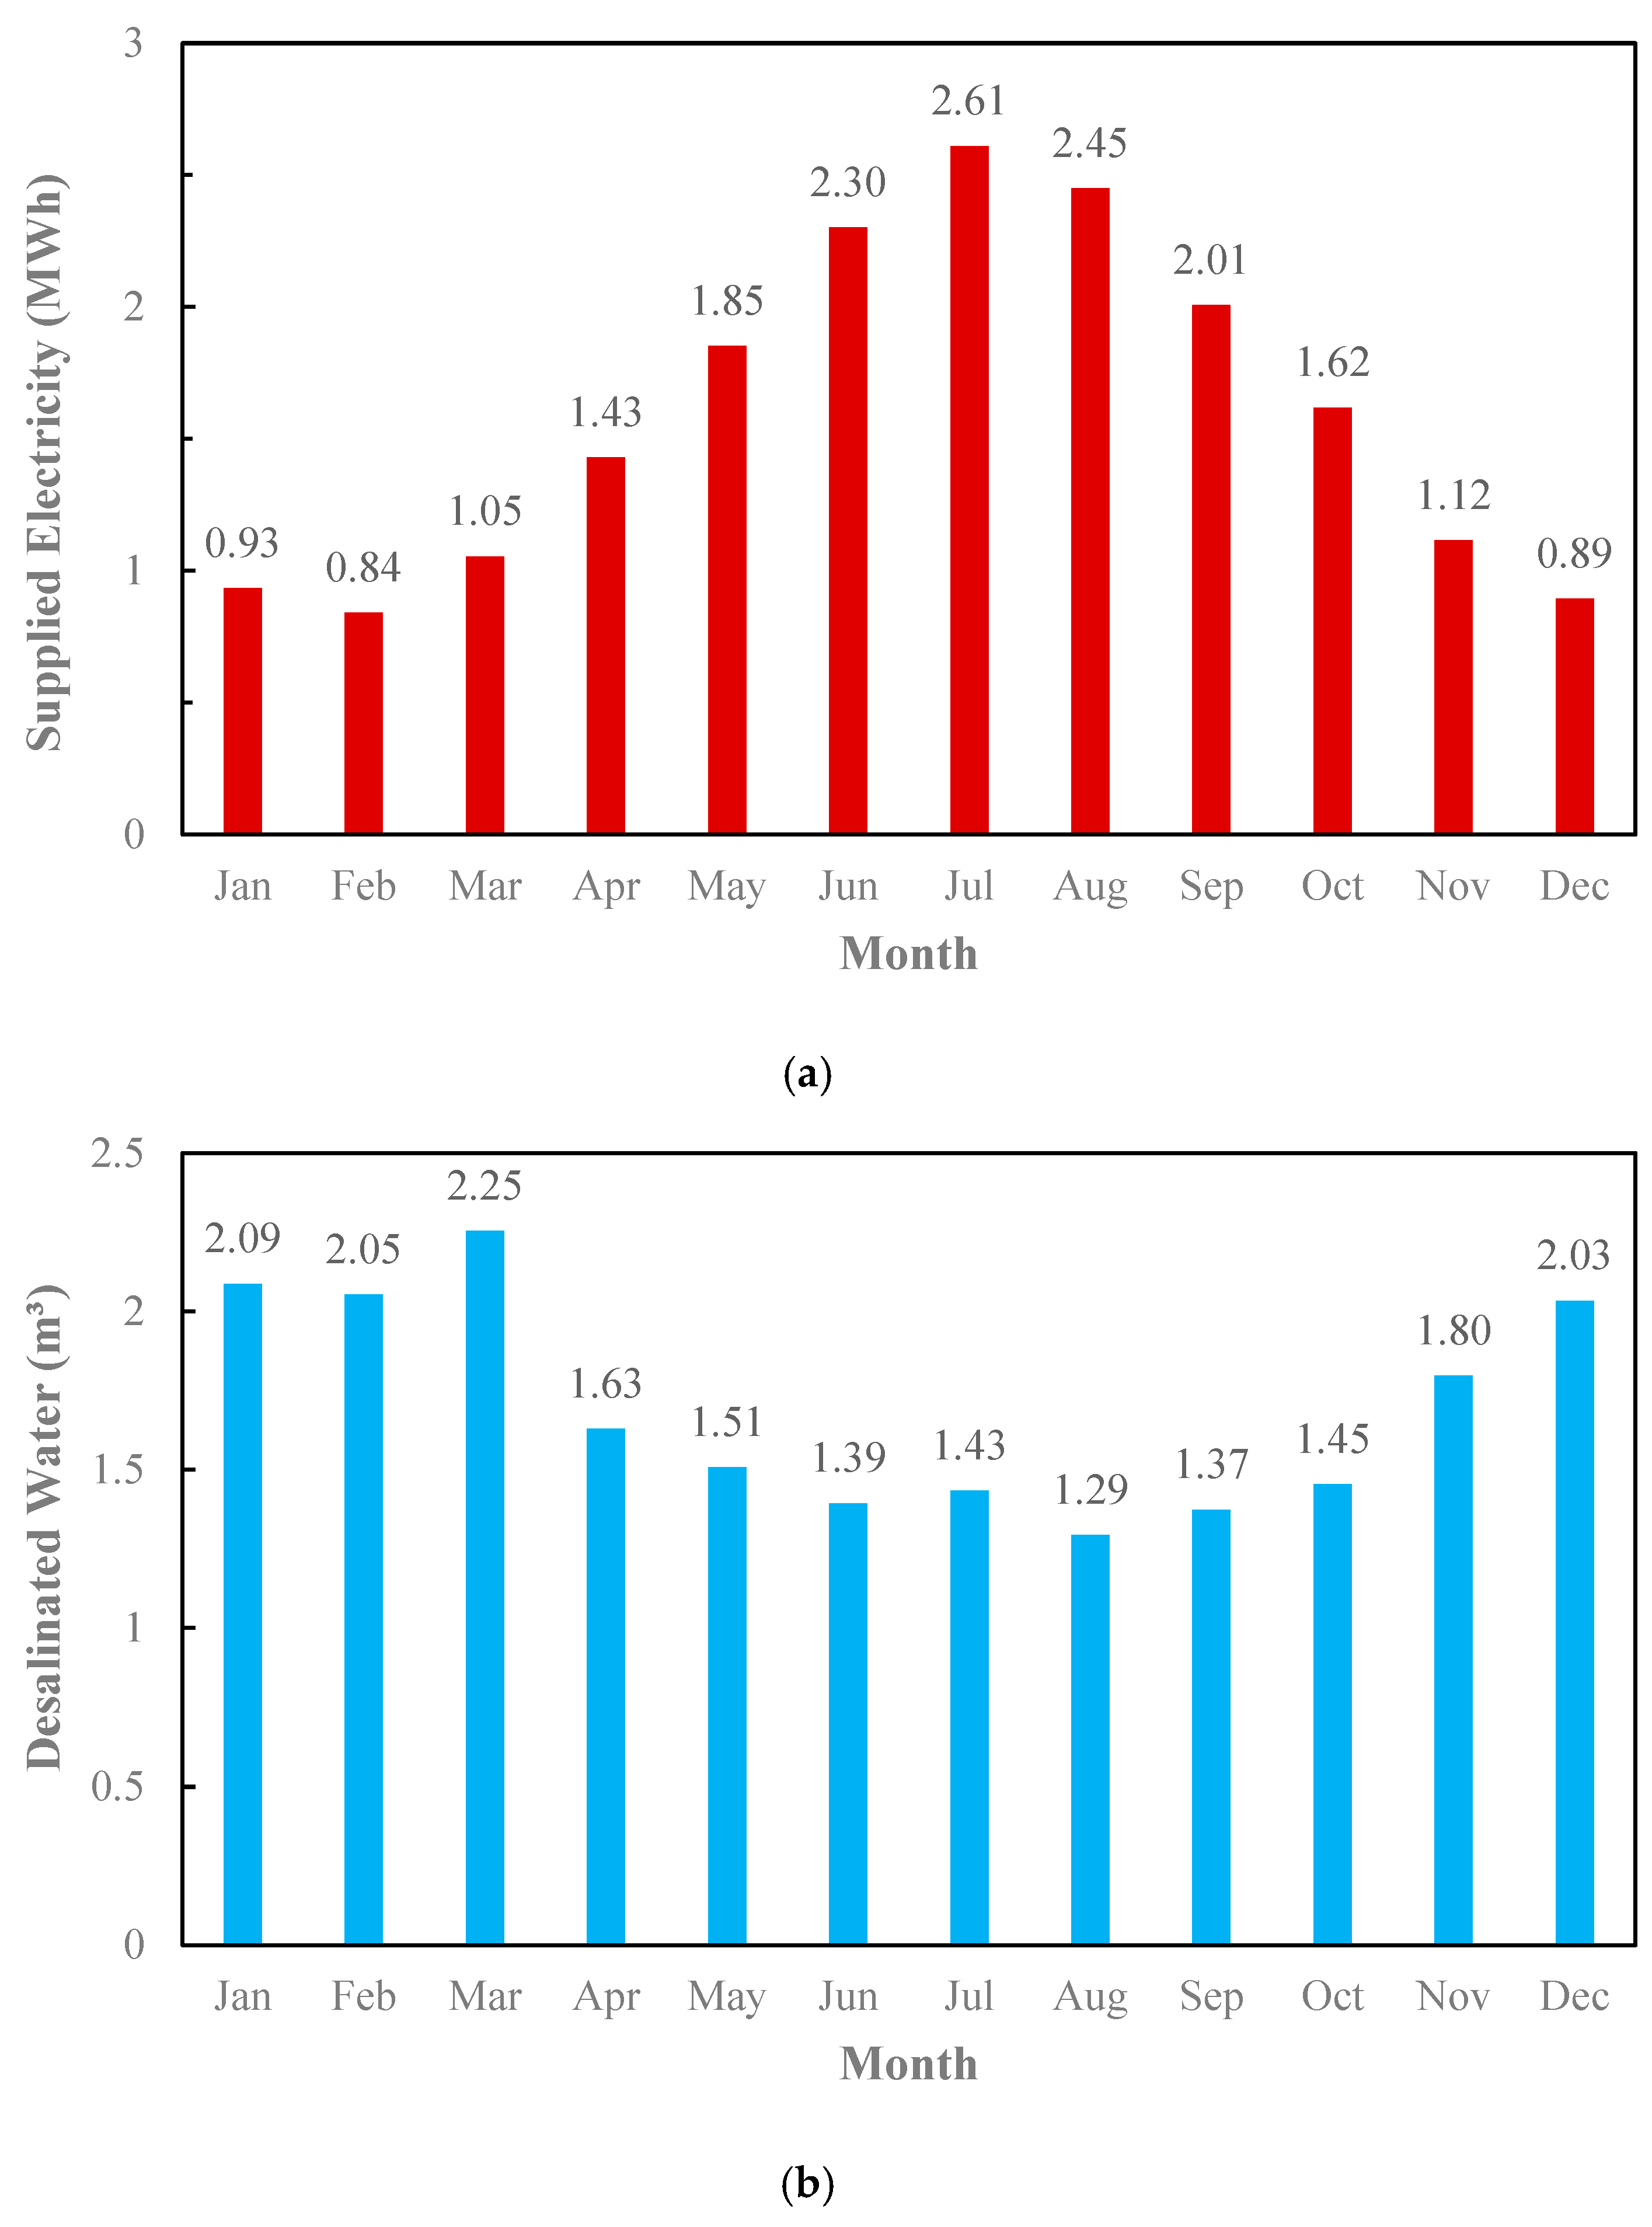
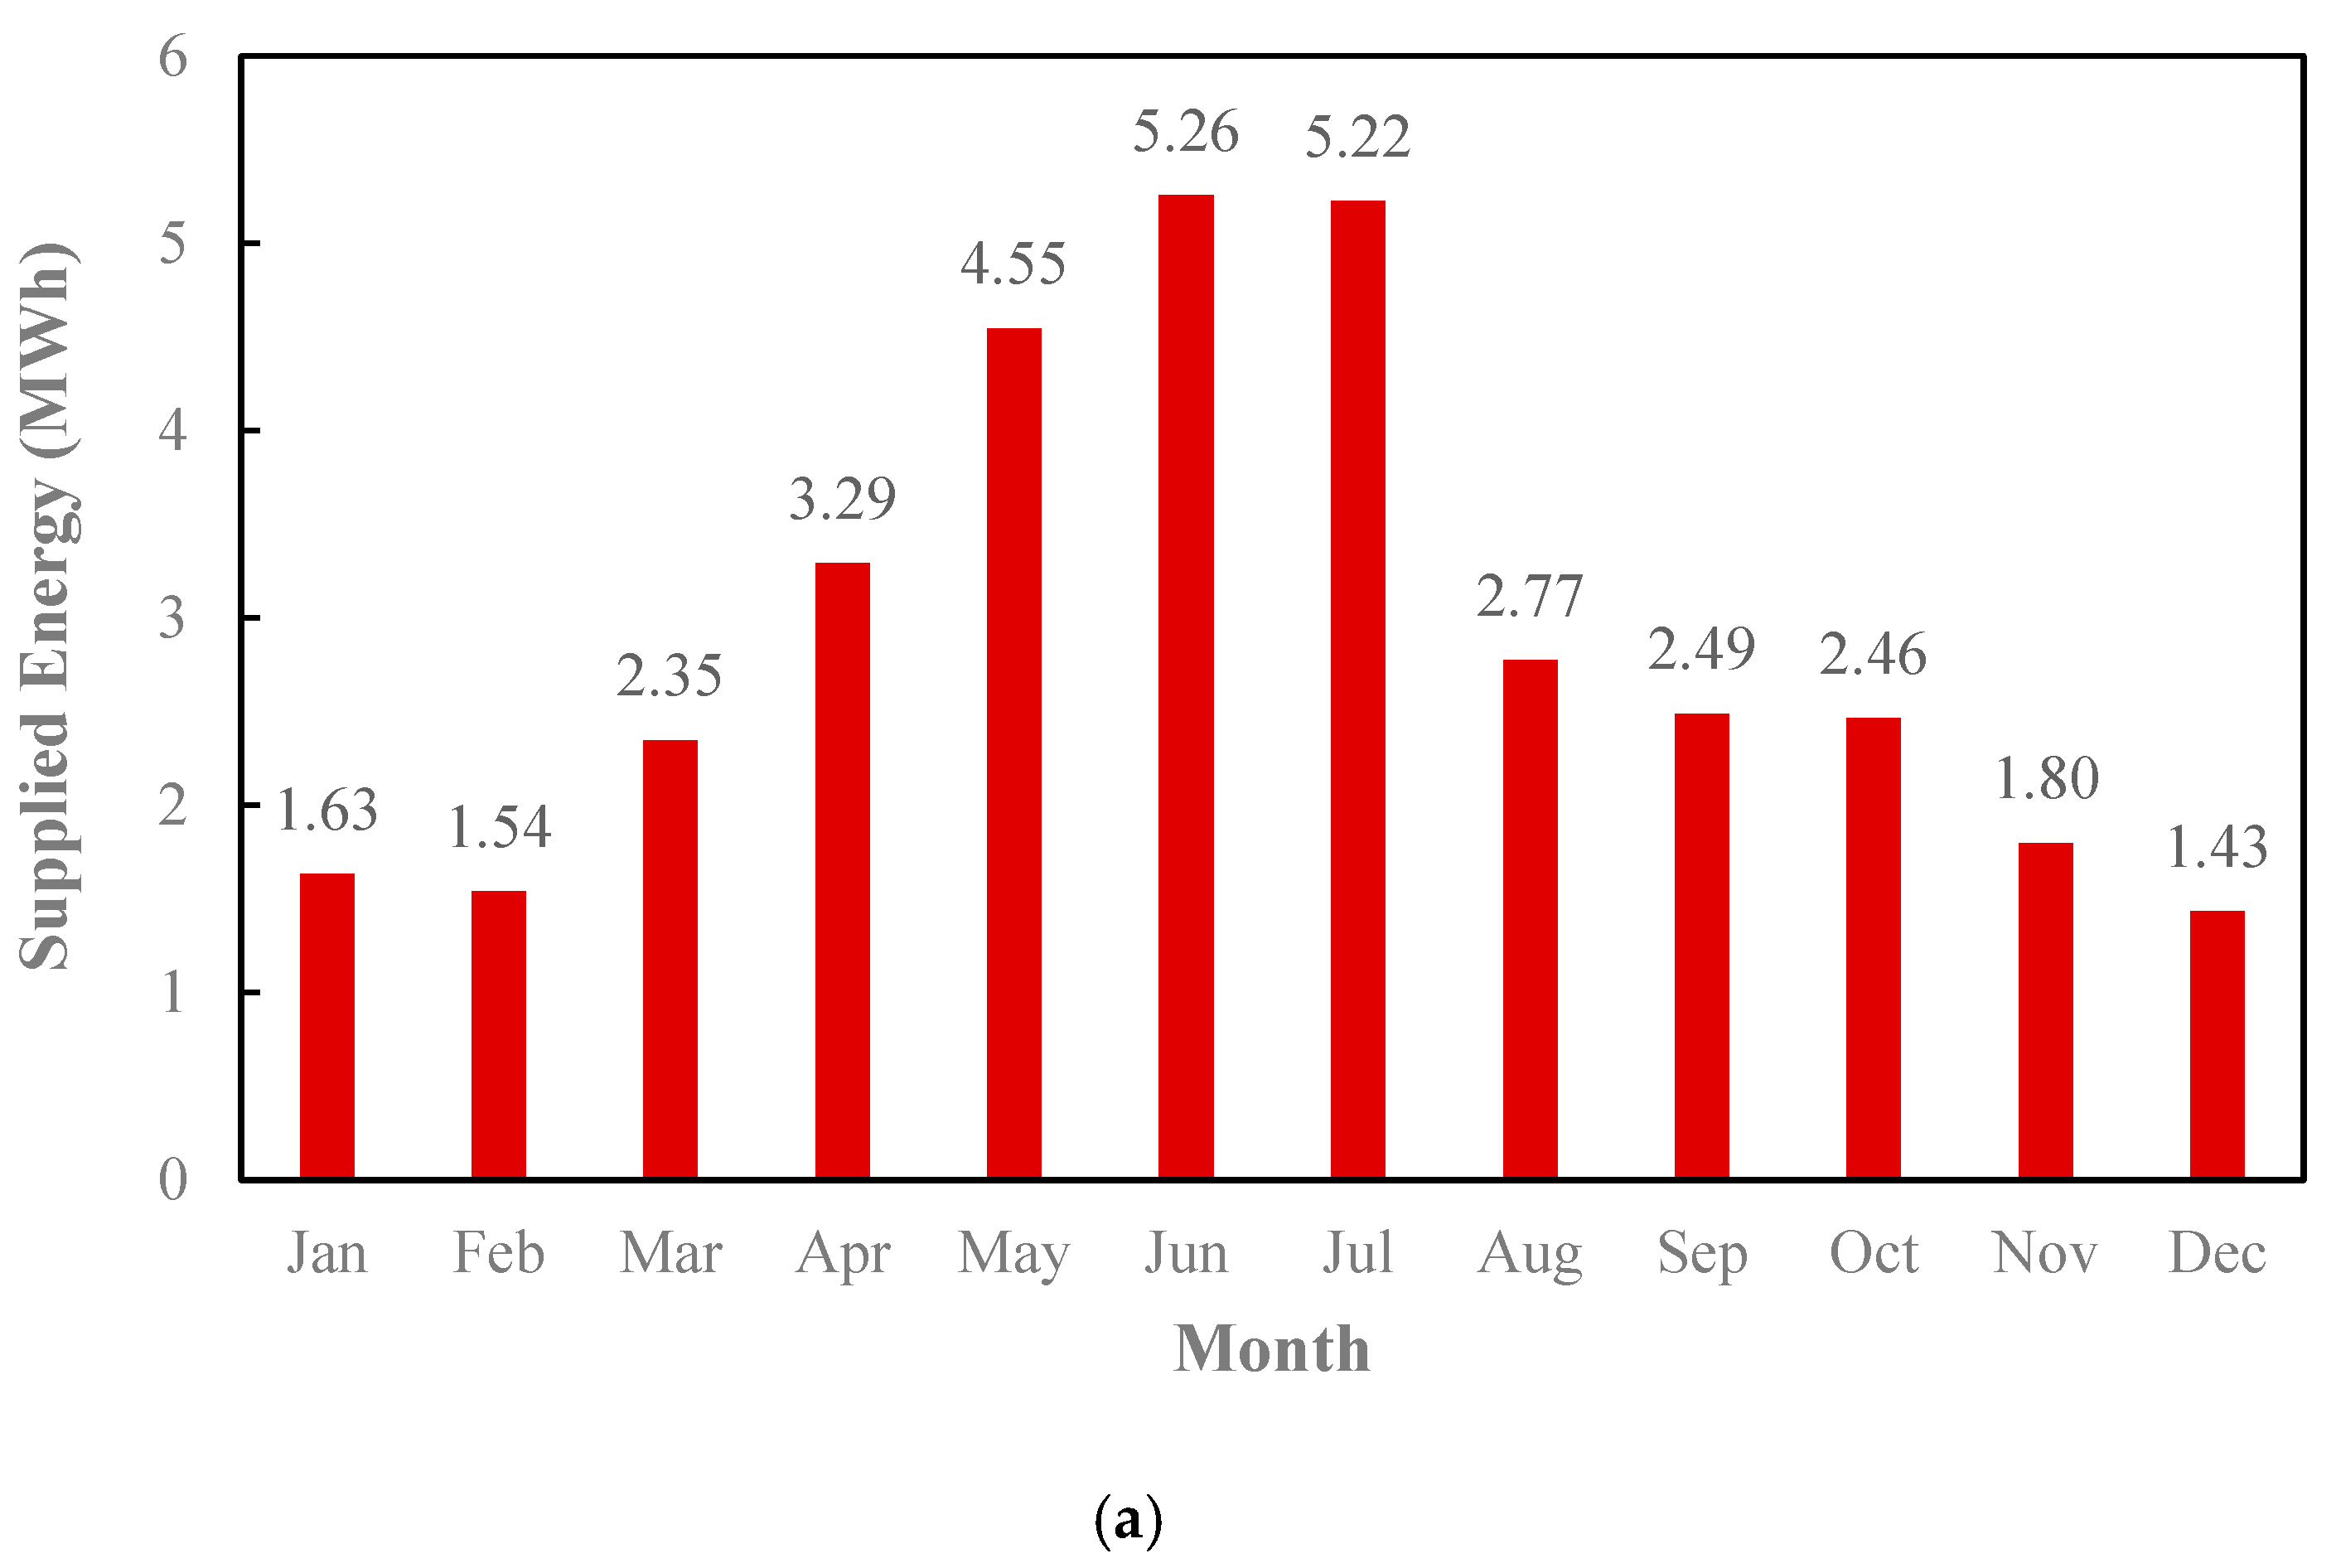
Figure 4 highlights the electricity (a) and water (b) supplied by the PV system. The seasonal variations observed in energy production directly impact water desalination, as increased solar power availability in summer results in higher desalinated water. The monthly electricity supply follows the same pattern, peaking in summer and dropping in winter. The reason for this is the high demand for energy in the summer months and the reduced demand for electrical energy in the cold months of the year, which causes more energy to be supplied in the warm months of the year. Moreover, given that electricity consumption is high in the warm months of the year, as a result, the desalinated water decreases in these months and increases in the cold months of the year. For example, the energy supplied in July is 2.61 MWh, while the amount of freshwater supplied in this month is the lowest, at 1.43 m3.

Figure 4.
Supplied energy in PV scenario: (a) electricity; (b) water.
Figure 5 illustrates the monthly energy exchange with the power grid in the PV scenario, showing both the electricity sold (excess generation) and the electricity bought (energy deficits). The results indicate that during high solar output months, surplus energy is injected into the grid, whereas in low-output months, energy must be purchased to meet demand. This figure provides insights into the economic implications of grid interactions. The ability to sell excess electricity improves financial feasibility, but reliance on the grid during low-production periods adds operational costs. For example, in July and August, despite the high energy supply, the need to purchase electricity from the power grid is the highest—4.71 and 4.64 MWh, respectively—due to the high electricity demand. In the cold months of the year, when the demand for electricity is at its lowest, electricity sales are higher, with January and December having the highest electricity sales at 2.6 and 2.3 MWh.
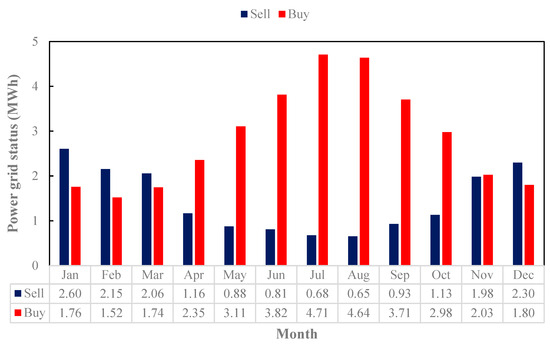
Figure 5.
Monthly energy exchange with the grid, including electricity sold and purchased.
3.2.2. WT System
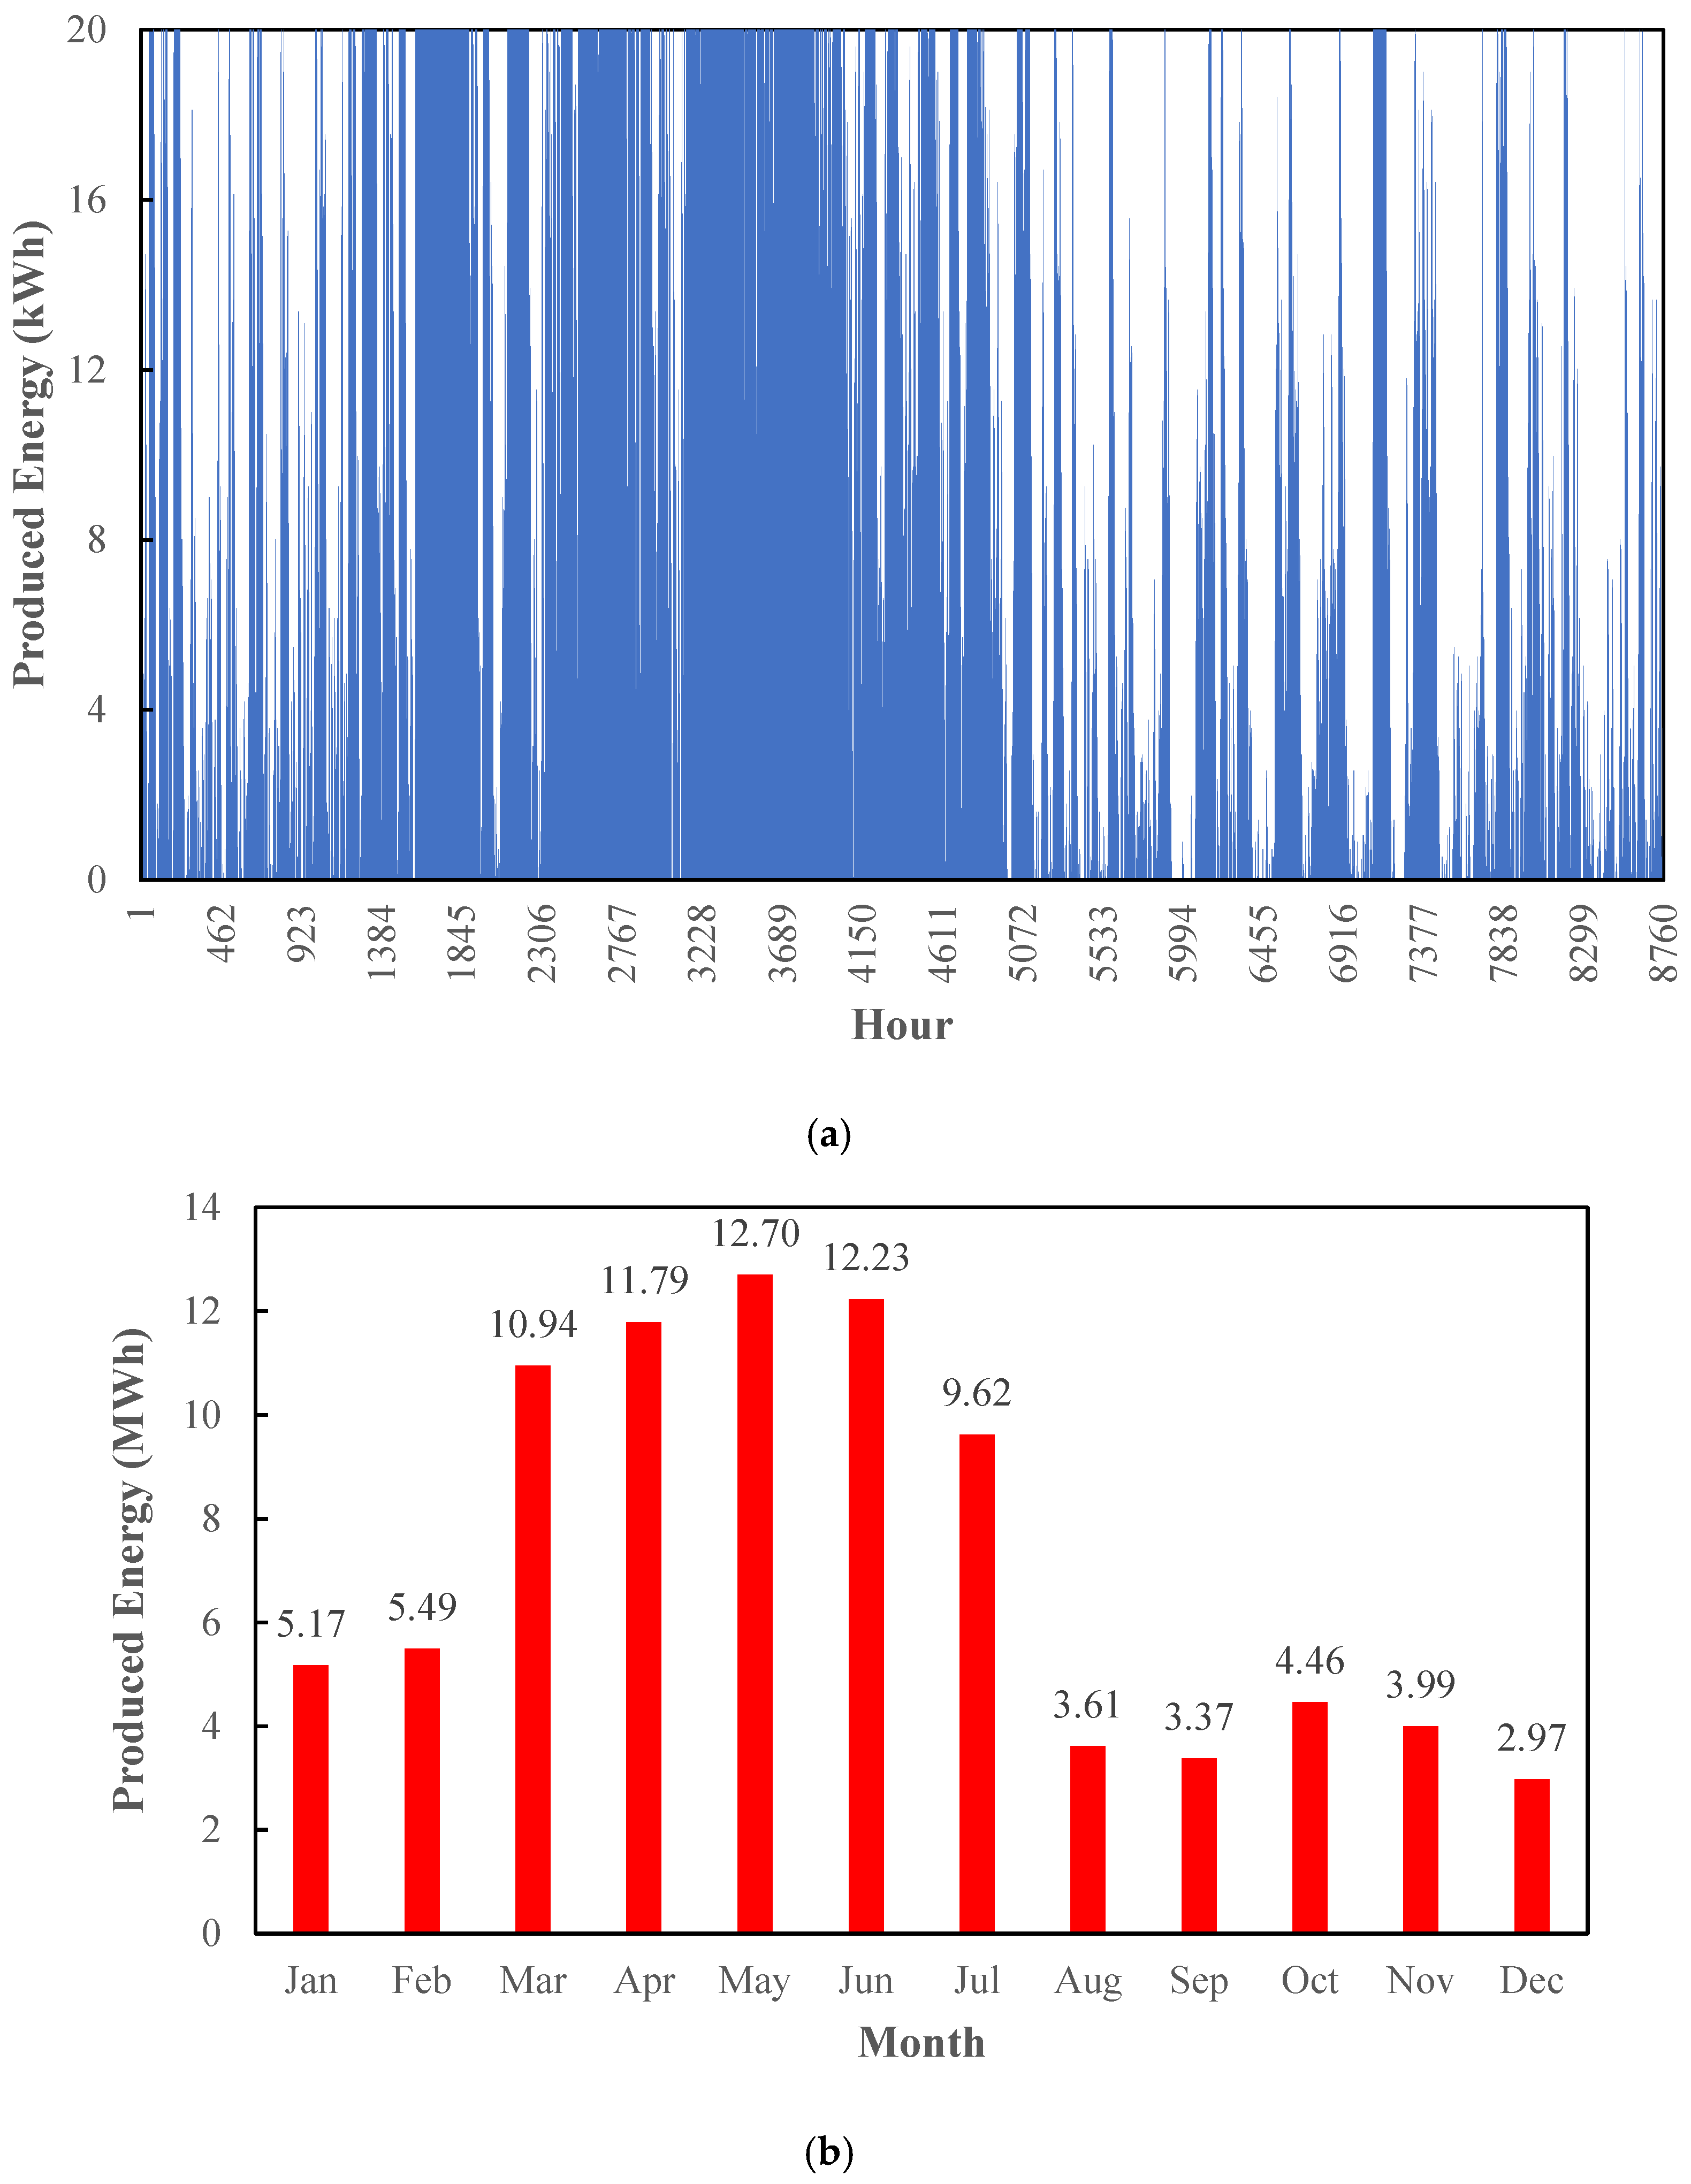
Figure 6 displays the energy generation in the WT scenario on an hourly (a) and monthly (b) basis. Unlike PV, wind energy is not as predictable and shows fluctuations based on wind speed variations. The monthly energy production graph reveals a relatively stable output compared to the seasonal variations of PV. This figure demonstrates the advantage of wind energy in providing a more consistent power supply, particularly in regions with strong wind resources. However, the intermittency of wind necessitates careful system design, potentially requiring hybridization with PV or energy storage to maintain stable desalination operations. For example, the energy produced in May and June, when spring winds are higher, is also high, with the amount of energy produced being 12.7 and 12.23 MWh. However, in December and September, due to the decrease in wind speed, the energy produced has also decreased, with the amount being 2.97 and 3.37 MWh.
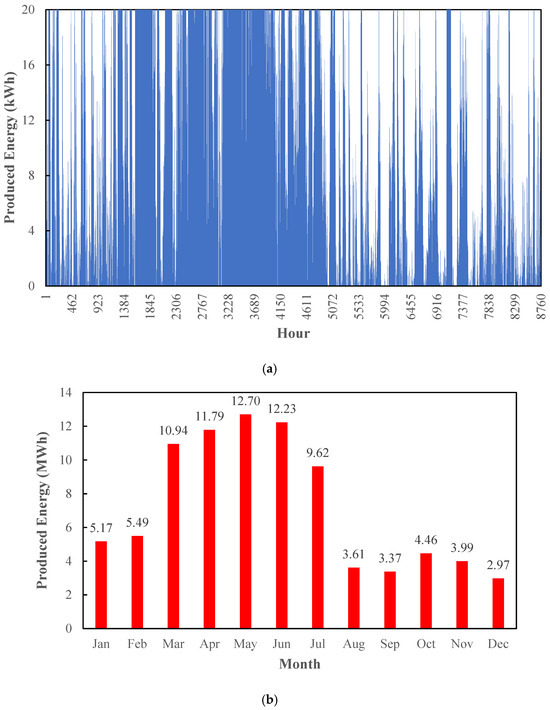
Figure 6.
Produced energy in WT scenario: (a) hourly; (b) monthly.
Figure 7 shows the electricity (a) and water (b) supplied in the WT scenario. The data indicates that wind energy contributes significantly to desalination, particularly in high-wind months. However, variations in wind speed can cause fluctuations in energy availability, affecting freshwater production. This figure emphasizes the need for either energy storage or hybridization with PV to ensure stable desalination performance. For example, the energy supplied in July is 5.79 MWh, while the amount of desalinated water in this month is the lowest at 3.41 m3. Like the photovoltaic scenario, in this scenario, more energy is supplied in the months when electricity is also higher.
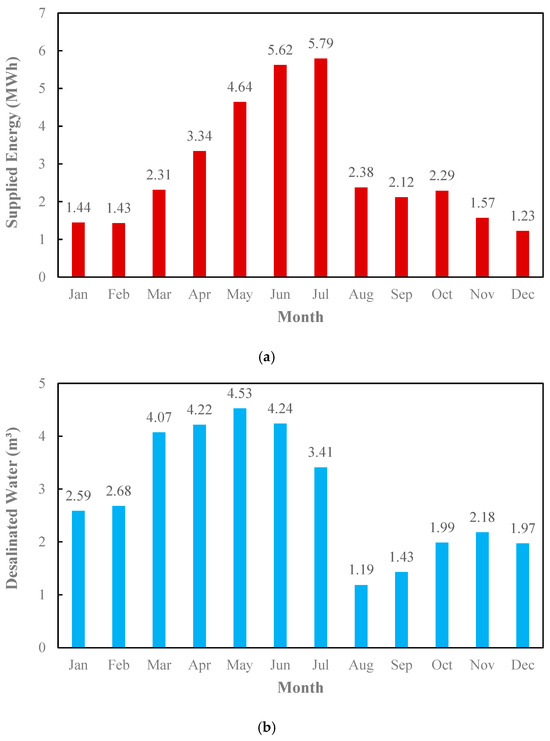
Figure 7.
Supplied energy in WT scenario: (a) electricity; (b) water.
Figure 8 presents the power exchange with the grid in the WT scenario. The energy sold to the grid fluctuates based on wind availability, with higher sales during high-wind months and increased grid purchases in low-wind periods. This figure highlights the economic trade-offs of a wind-powered desalination system. While wind energy reduces grid dependency, unpredictable wind patterns necessitate backup solutions. For example, in March and April, due to high energy production and lack of need for it, electricity is sold to the grid, namely, 8.61 and 8.43 MWh. In August and September, due to the building’s need for electrical energy and its lack of supply, purchases are made from the electricity grid. In these two months, 4.71 and 3.60 MWh of energy are purchased from the grid.
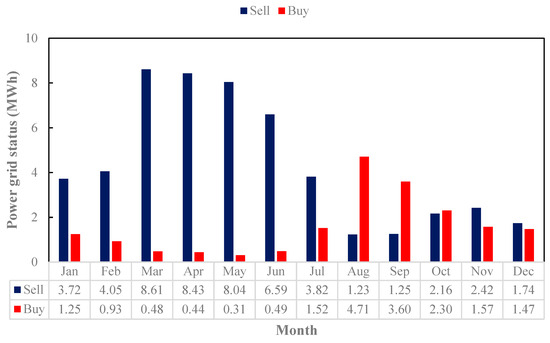
Figure 8.
Grid status in WT scenario.
3.2.3. Hybrid System
Figure 9 shows the hourly (a) and monthly (b) energy production in the hybrid scenario. The combination of PV and WT results in a more balanced energy output, reducing the impact of seasonal and diurnal fluctuations observed in individual systems. This figure demonstrates the key advantage of hybrid systems: their ability to stabilize energy production. By leveraging both solar and wind resources, hybrid systems enhance reliability and reduce the need for grid imports. This stability is crucial for ensuring consistent desalination operations. For example, the energy produced in May and June, when spring winds are higher and radiation is also high, the amounts of energy produced are 8.69 and 8.56 MWh. However, in December and September, the energy produced is at the minimum, with the amounts being 3.04 and 3.18 MWh. In the hybrid scenario, although the energy produced is less than in the wind scenario, the required energy is supplied.
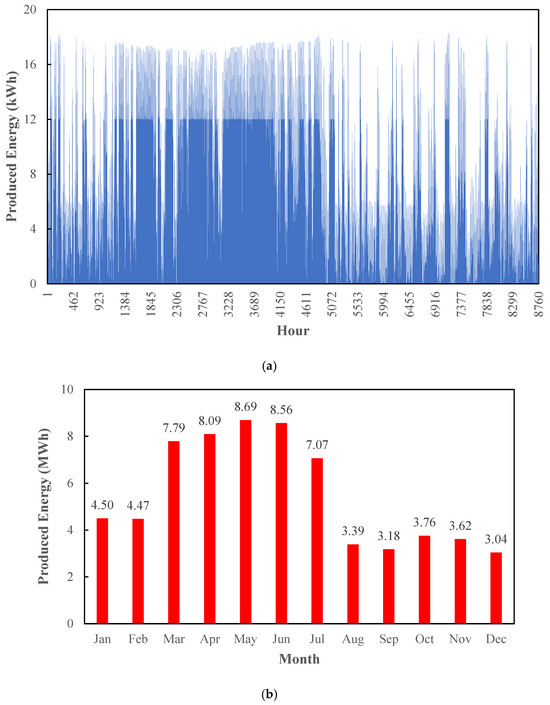
Figure 9.
Produced energy in hybrid scenario; (a) hourly; (b) monthly.
Figure 10 illustrates the electricity (a) and water (b) supplied by the hybrid system. The results show a more stable and higher overall water production compared to single-energy-source scenarios. This figure confirms the effectiveness of hybridization in optimizing desalination performance. The consistent energy supply from the combination of PV and WT systems ensures more reliable desalinated water, making hybrid systems a promising solution for sustainable desalination. For example, the energy supplied in June is 5.26 MWh, while the amount of freshwater supplied in this month is 3.43 m3.
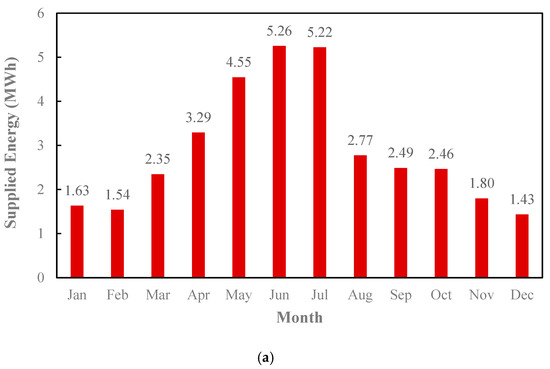
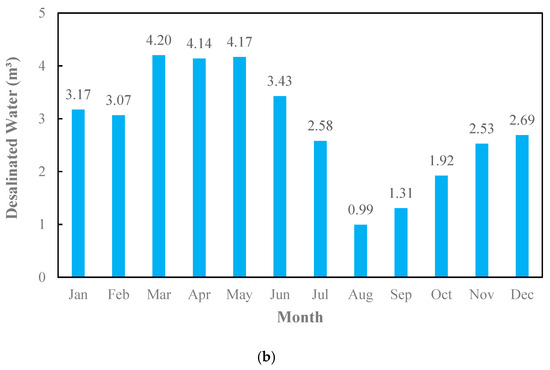
Figure 10.
Supplied energy in hybrid scenario: (a) electricity; (b) water.
Figure 11 presents the energy exchange with the grid in the hybrid system. Compared to single-source scenarios, grid reliance is significantly reduced, with fewer energy purchases and stable surplus energy sales. This figure highlights the economic and energy security benefits of hybrid systems. By reducing dependency on the grid, hybrid systems enhance resilience and lower operational costs, making them an attractive option for renewable-powered desalination. For example, in March, electricity sales to the grid have the highest amount, 5.43 MWh. However, this amount was 8.61 MWh in the wind turbine scenario, which indicates a decrease in the need for the electricity grid. Moreover, the amount of electricity purchased from the electricity grid in August is 4.31 MWh, which is the highest amount.
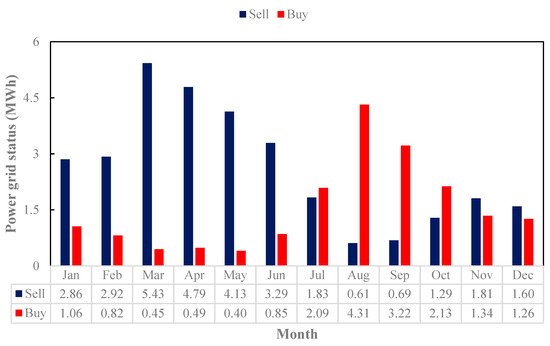
Figure 11.
Grid status in hybrid scenario.
3.3. Compare Result
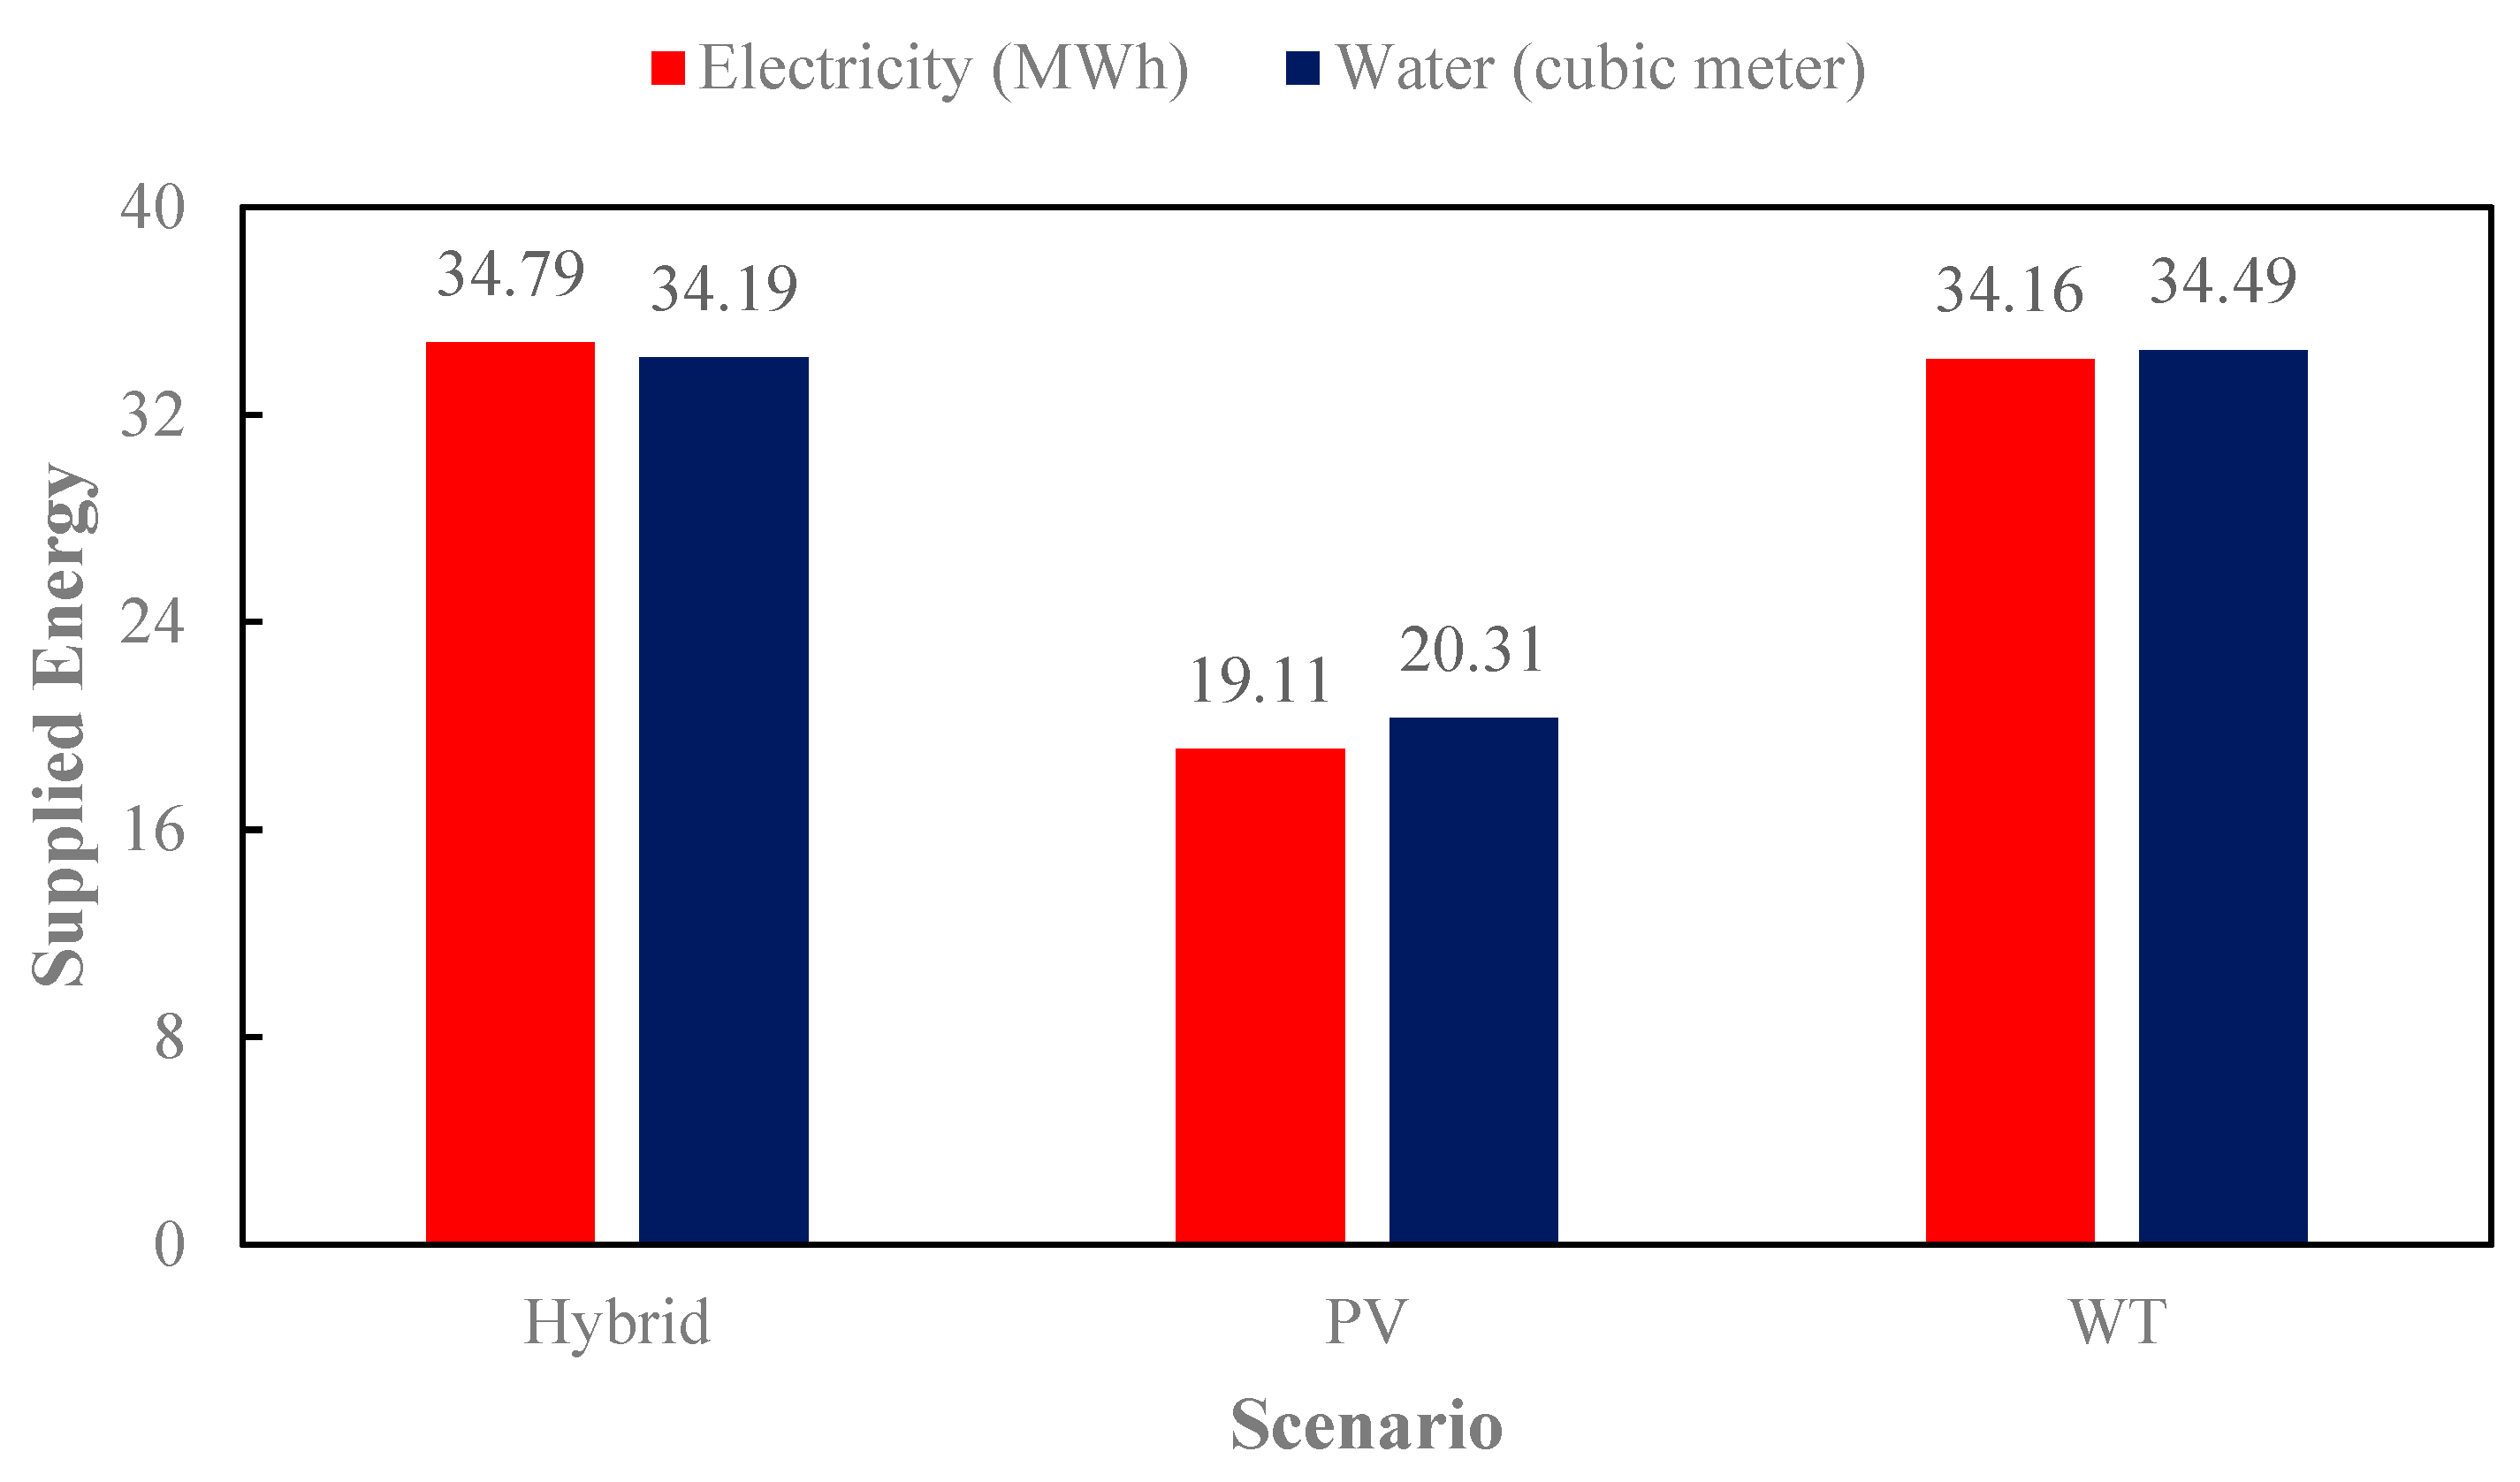
Figure 12 compares the total supplied electricity and water across the three scenarios. The hybrid system demonstrates the highest energy, followed by the PV and WT systems individually. This comparison confirms the superior performance of hybrid renewable energy systems. In the hybrid scenario, the amount of electricity and water supply is 34.79 MWh and 34.19 m3, respectively. Meanwhile, in the PV scenario, these amounts are 19.11 MWh and 20.31 m3. In the WT scenario, these two amounts are 34.16 MWh and 34.49 m3.
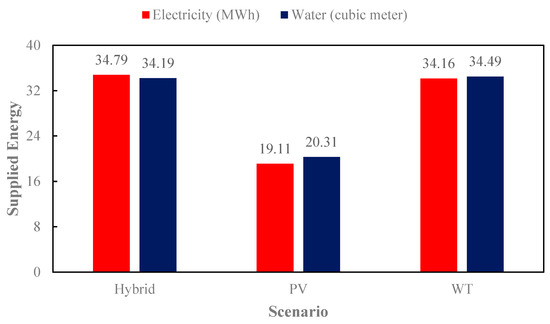
Figure 12.
Supplied energy in different scenarios.
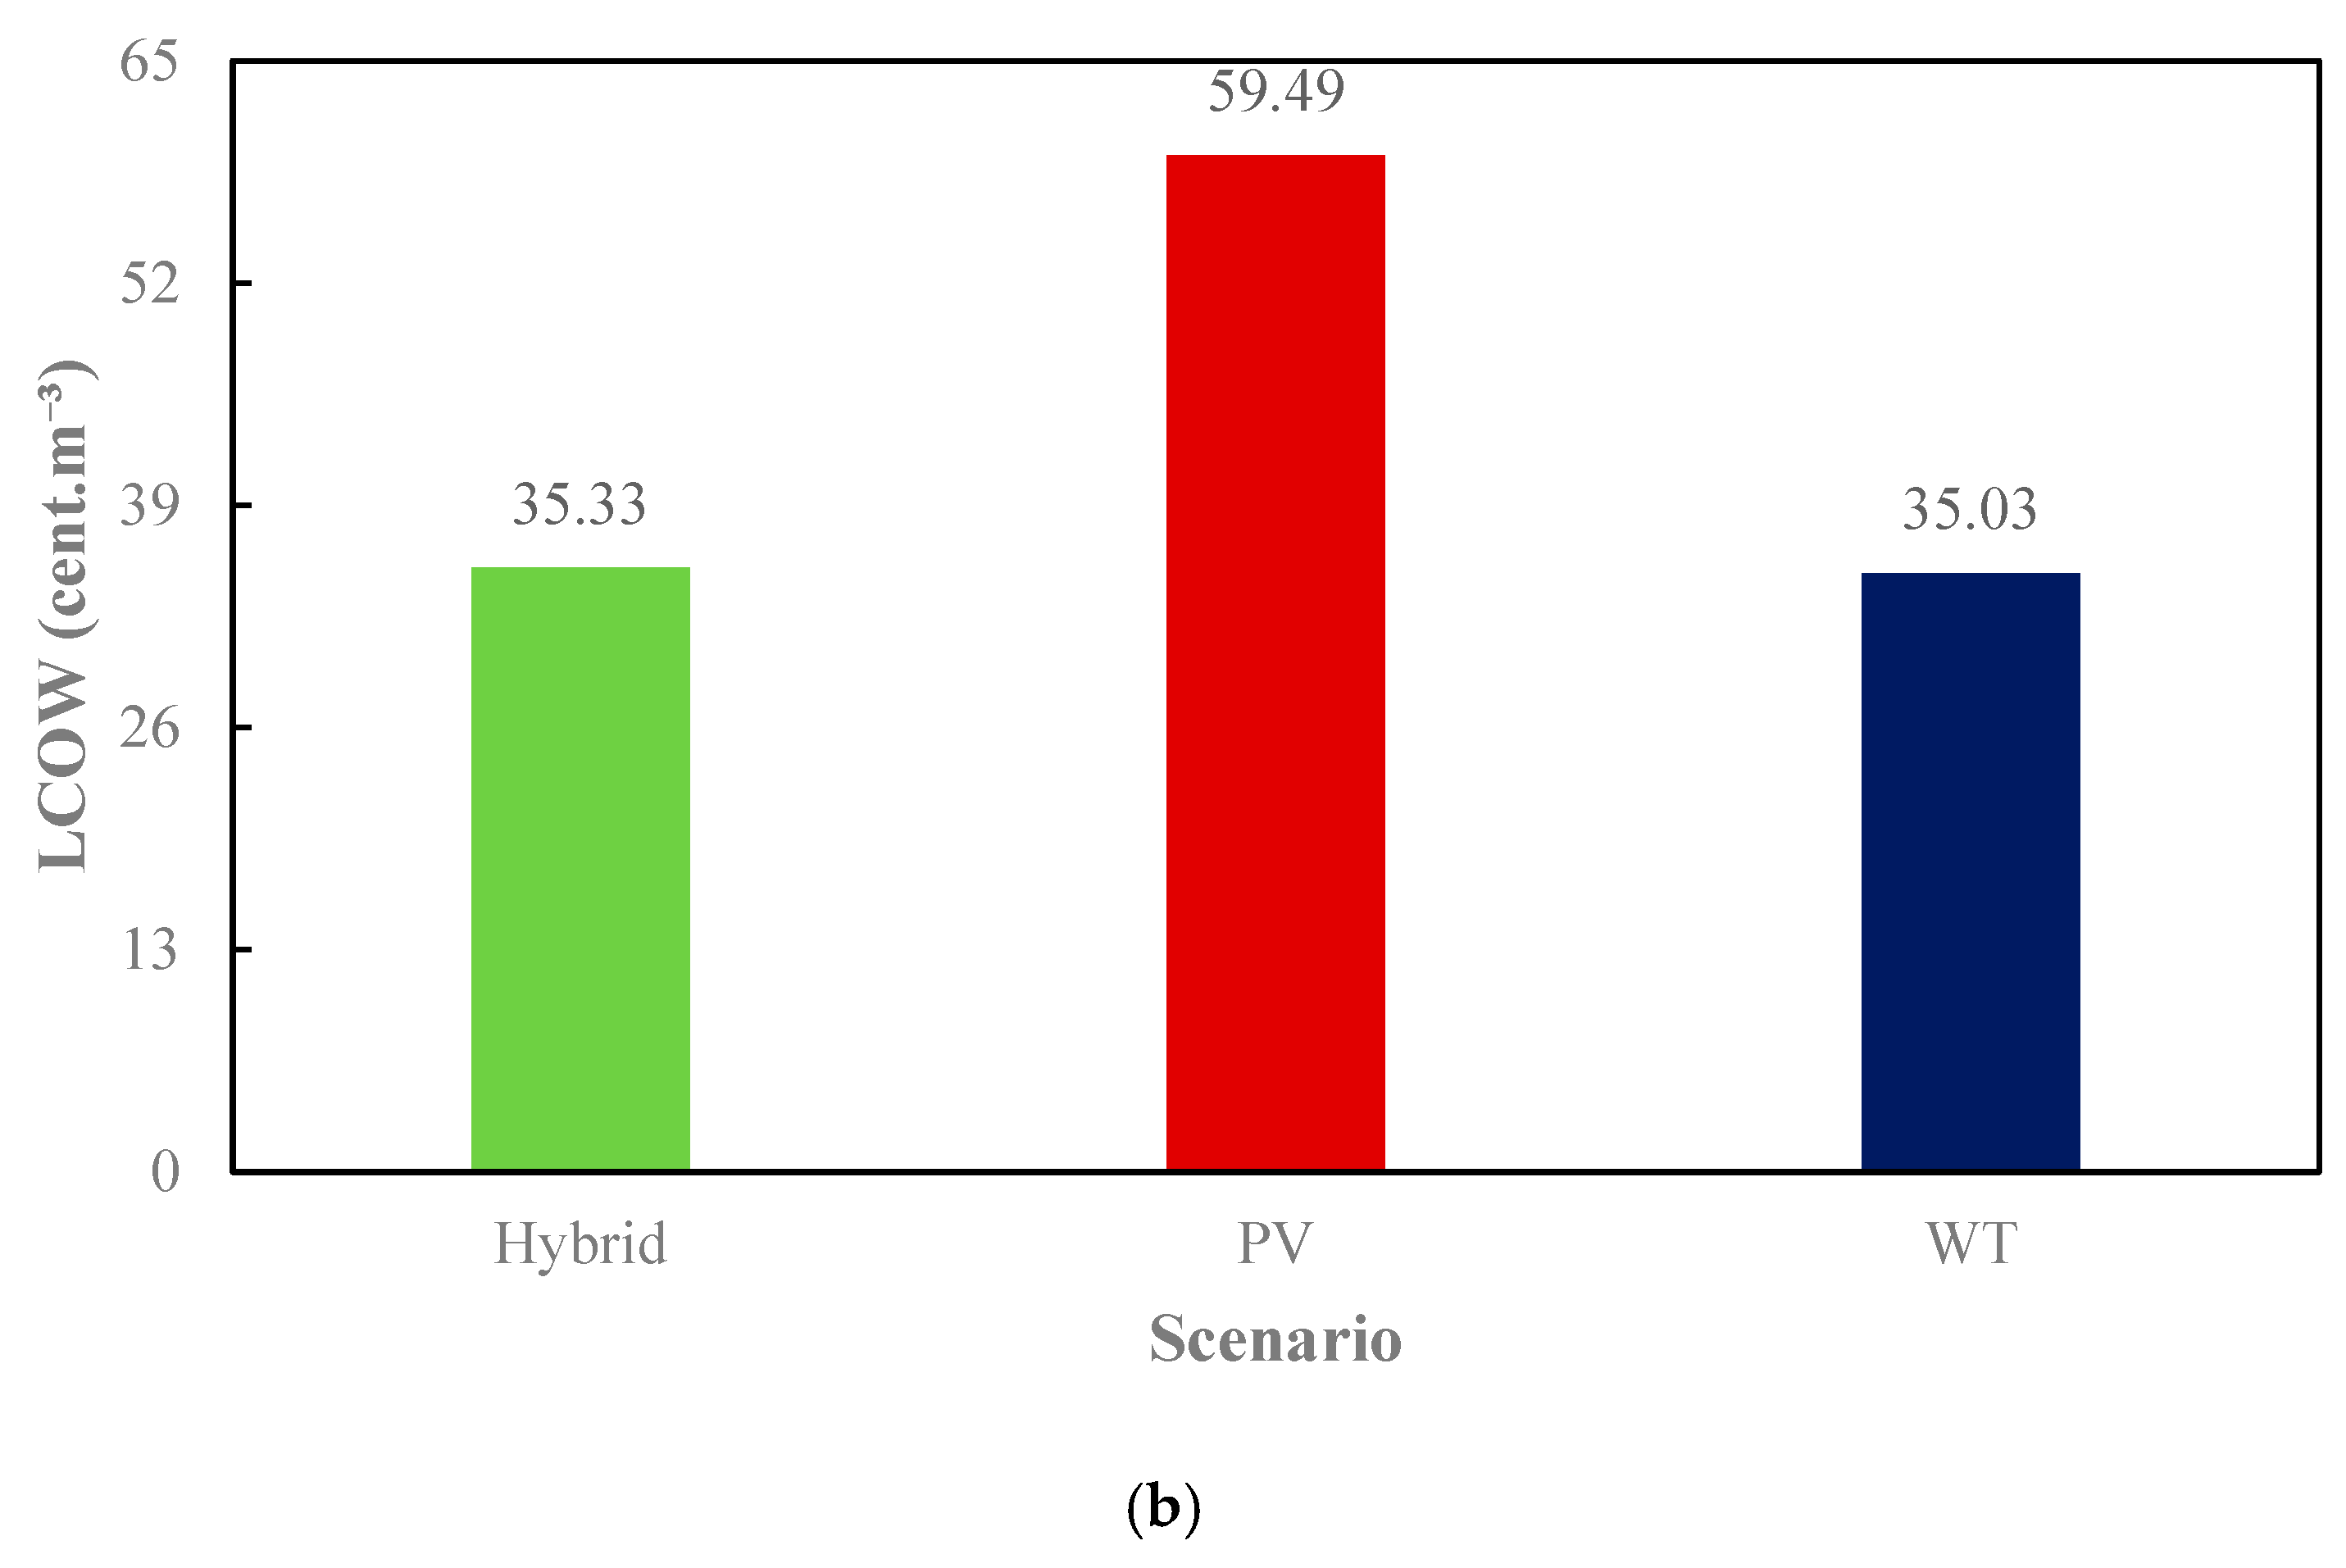
Figure 13 compares the LCOE (a) and LCOW (b) across scenarios. This economic analysis validates the feasibility of hybrid renewable-powered desalination. By optimizing energy costs, hybrid systems provide the most sustainable and financially viable solution for large-scale desalination. In the hybrid scenario, the amounts of LCOE and LCOW are 2.73 cent/kWh−1 and 35.33 cent/m−3, respectively. Meanwhile, in the PV scenario, the amounts are 2.29 cent/kWh−1 and 54.49 cent/m−3. In the WT scenario, these two amounts are 3.79 cent/kWh−1 and 35.03 cent/m−3.
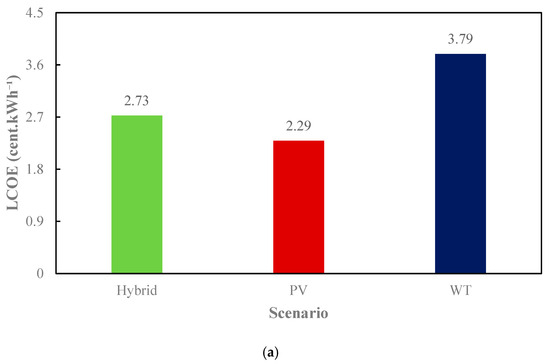

Figure 13.
Economic analysis in different scenario: (a) LCOE; (b) LCOW.
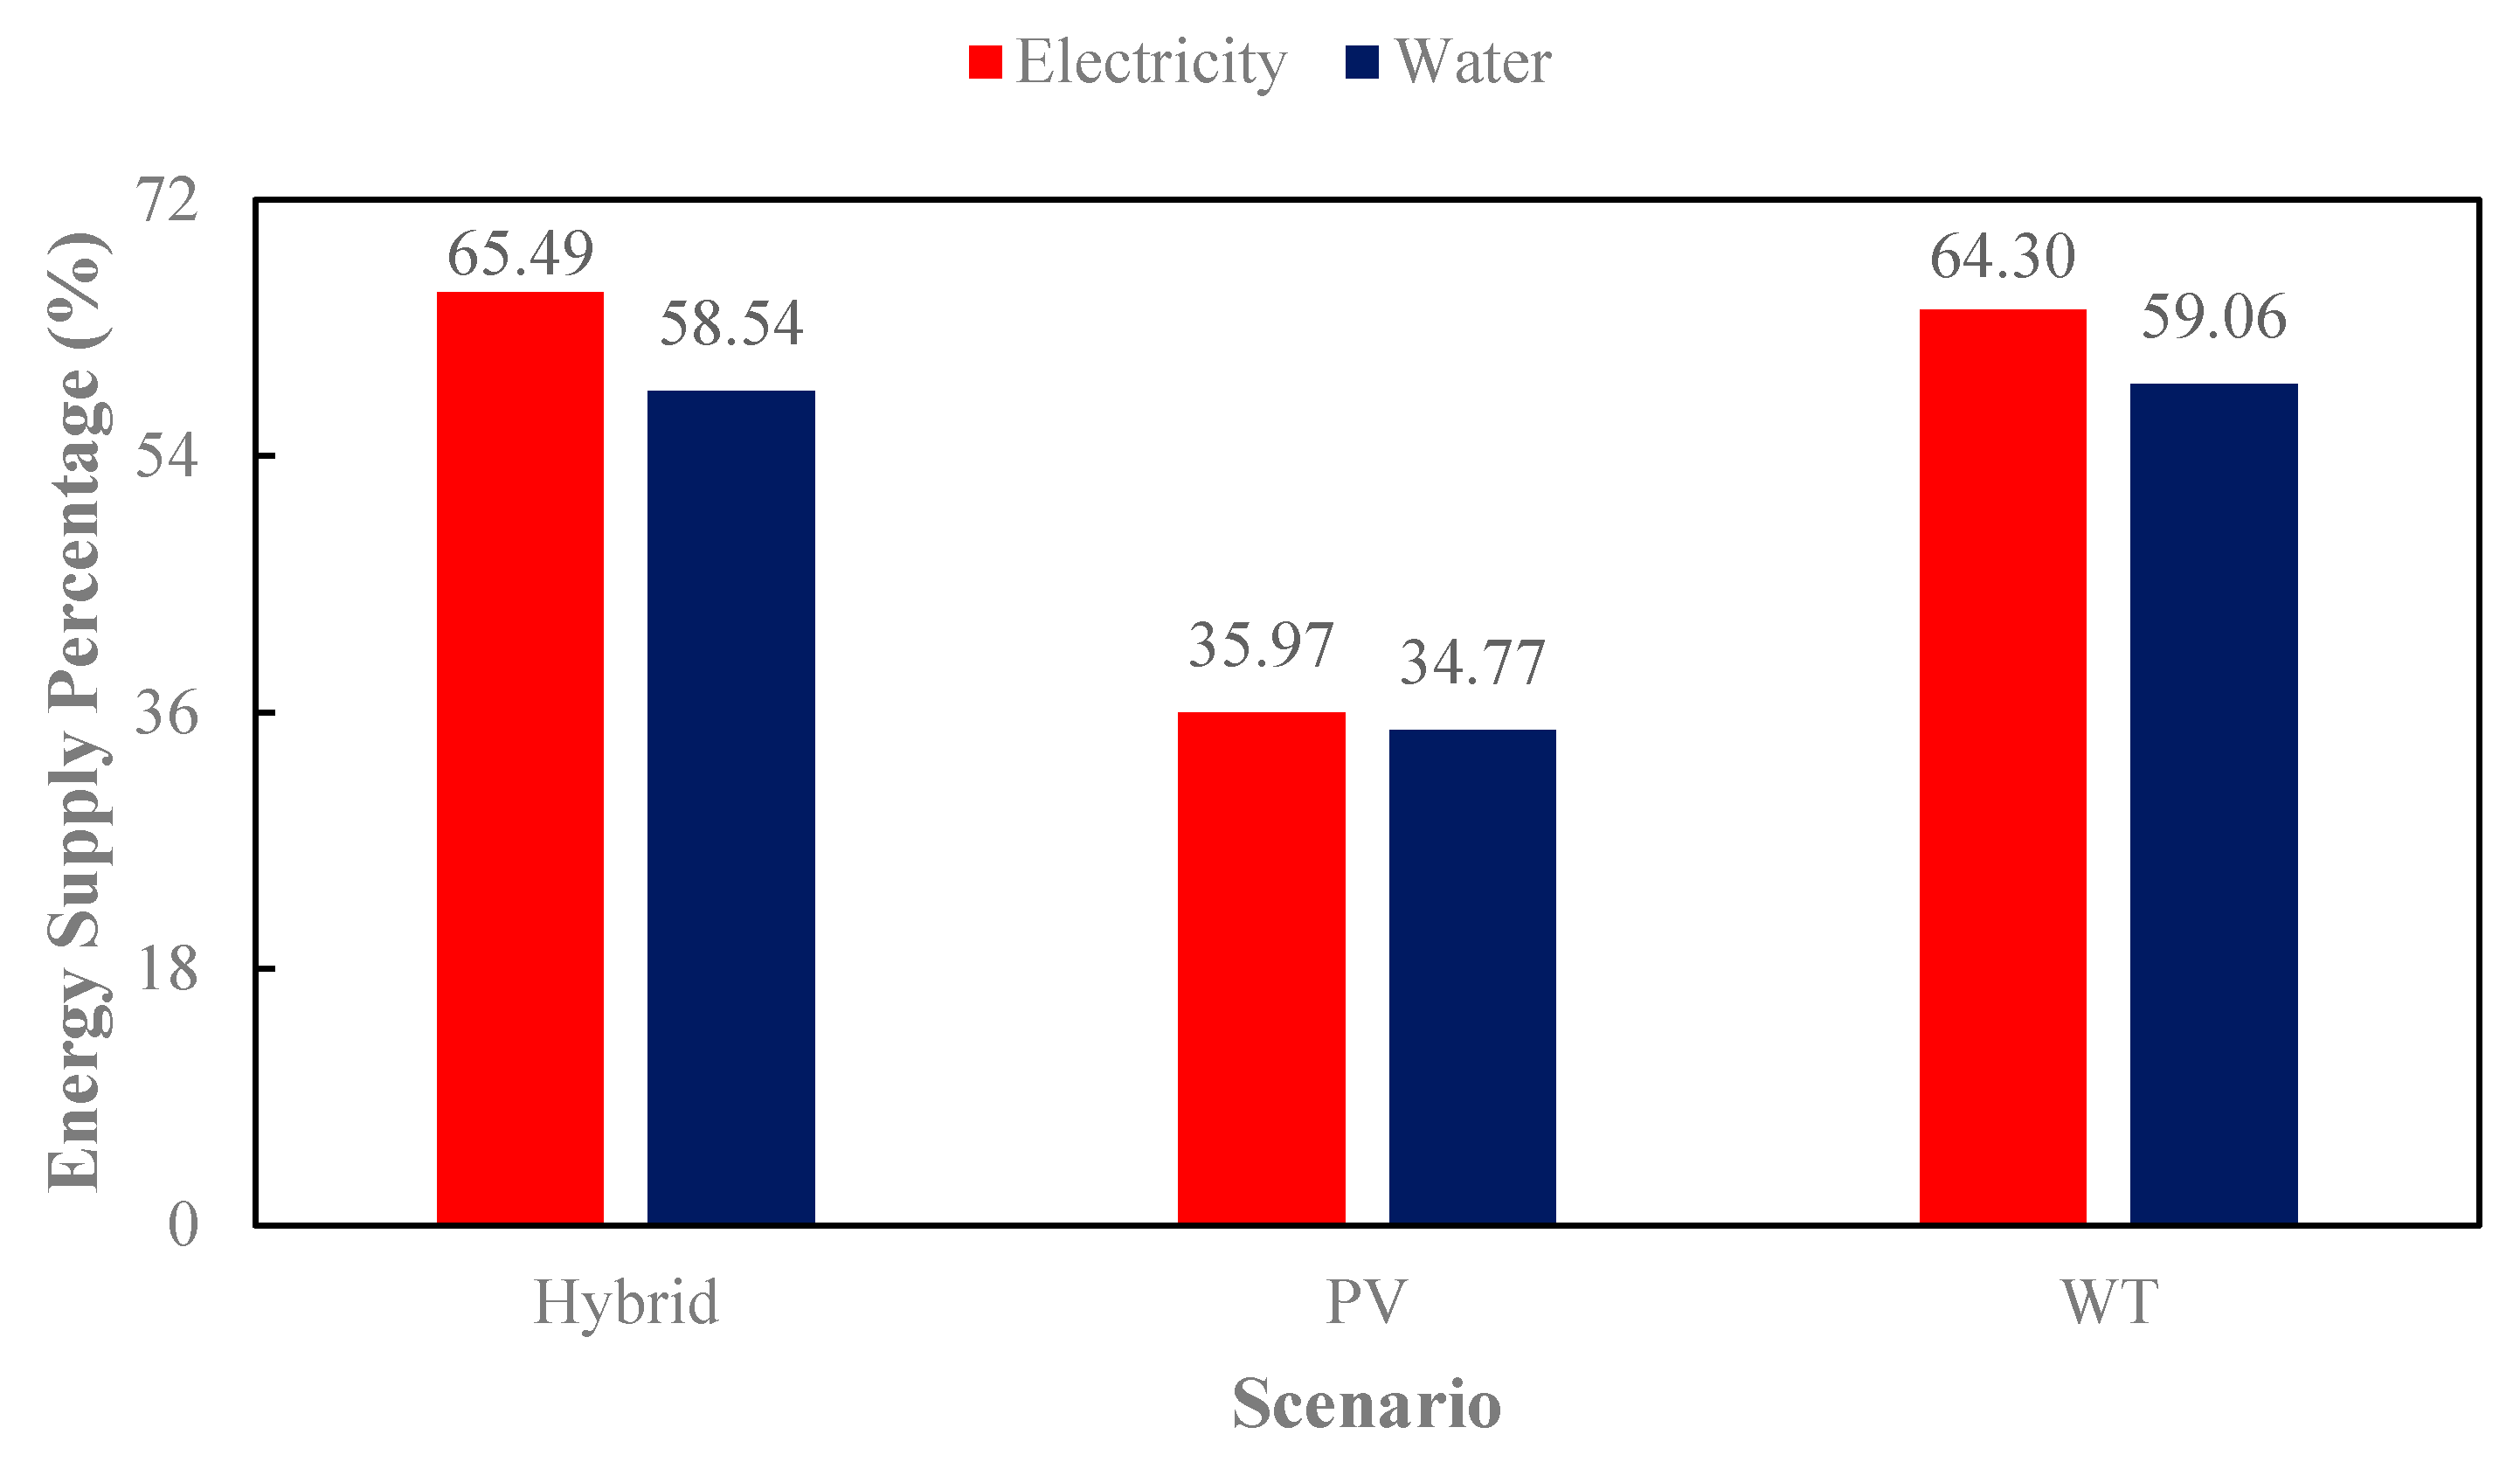
Figure 14 illustrates the percentage of total electricity and water supply from each scenario. The hybrid system exhibits the high efficiency, demonstrating its effectiveness in renewable-powered desalination. In the hybrid scenario, the percentages of electricity and water supply are 65.49 and 58.54%, respectively. Meanwhile, in the PV scenario, the values are 35.97 and 34.77%. In the WT scenario, these two values are 64.30 and 59.09%.

Figure 14.
Energy supply percentage in different scenarios.
The figures reinforce the conclusion that hybrid renewable energy systems offer the most reliable, cost-effective, and sustainable solution for desalination, ensuring continuous energy and freshwater production.
The main objective of this study was to evaluate the performance improvement potential of multi-objective optimization compared to a base case and to demonstrate practical applicability. Consequently, the focus of the results section was placed on the improvement achieved across key indicators during different hours and months of a year. Visualizing the complete Pareto front in a four-objective space would require multiple 2D plots covering all pairwise relationships since complex 3D plots are often difficult to interpret. Therefore, including all possible Pareto-optimal points would have significantly lengthened the manuscript, potentially affecting readability. This approach is also consistent with several existing studies where optimization results are presented without explicitly showing the full Pareto front.
Moreover, is it worth mentioning that no scalarized or weighted-sum approach was used, and NSGA-II was applied in its standard form to ensure the generation of diverse non-dominated solutions. The percentage improvements observed in different metrics—calculated as the relative difference between optimized and baseline scenarios—were not identical across objectives, indicating that the objectives are not trivially or linearly dependent.
4. Conclusions
This study evaluated the feasibility and efficiency of renewable energy-powered RO desalination by analyzing three different scenarios: a PV-powered system, a WT-powered system, and a hybrid PV–WT system. The research aimed to determine the optimal configuration by minimizing the LCOE and the LCOW while maximizing energy generation and desalinated water. A key objective was to reduce reliance on the power grid, ensuring a more sustainable and self-sufficient energy–water system. The results demonstrated that the hybrid PV–WT system provides the most stable energy supply and the highest desalinated water while significantly reducing grid dependency.
The hybrid scenario supplied 34.79 MWh of electricity and 34.19 m3 of desalinated water, outperforming both the PV-only (19.11 MWh, 20.31 m3) and WT-only (34.16 MWh, 34.49 m3) systems. Additionally, the hybrid system achieved the lowest LCOE (2.73 cent/kWh−1) and LCOW (35.33 cent/m−3) compared to the PV (2.29 cent/kWh−1, 59.49 35.33 cent/m−3) and WT (3.79 cent/kWh−1, 35.03 cent/m−3) systems. The energy supply from the hybrid system covered 65.49% of electricity demand and 58.54% of water demand, reducing the need for grid imports. This resulted in significantly lower electricity purchases from the grid, with the hybrid system requiring only 1.06 MWh in the lowest months and 4.31 MWh in the highest months, compared to 4.71 MWh in the WT scenario.
Despite the high potential of the optimized proposed system in regions with high renewable potential such as Zahedan, there are several challenges towards the implementation of that. These include limited socio-cultural acceptance due to unfamiliarity with the technology, attracting investors and policymakers to support the initial financing of such systems, and a possible shortage of local technical expertise needed for system installation and maintenance.
The methodology used—based on hourly data, multi-objective optimization, and techno-economic evaluation—is generalizable and can also be applied to other arid or semi-arid regions with high solar and wind potential and similar water scarcity. Given the considerable renewable energy potential and water challenges in such areas, the results will highlight the strong applicability of the optimized proposed system. However, the specific values of performance criteria will vary depending on case-specific factors, including local economic conditions, climate characteristics, and other influential parameters.
Future research on hybrid PV–WT systems for reverse osmosis desalination should focus on optimizing energy management strategies, integrating advanced control systems, and enhancing storage solutions to improve operational stability. Additionally, investigating the integration of other renewable sources like wave or geothermal energy and developing modular, scalable designs could further enhance sustainability. Policy support and techno-economic feasibility studies tailored to local conditions are also critical areas for future work.
These findings confirm that a hybrid PV–WT system is the most effective solution for renewable-powered desalination, offering lower costs, higher efficiency, and reduced grid dependency.
Author Contributions
Conceptualization, M.N., M.O., M.H.S., and A.S.; methodology, M.N., M.O., M.H.S. and A.S.; software, M.N., M.O., and M.H.S.; validation, M.O., and K.M.S.; formal analysis, H.E. and K.M.S.; investigation, M.N., H.E., and K.M.S.; resources, H.E. and H.S.; data curation, M.N., M.O., H.E., M.H.S., and K.M.S.; writing—original draft preparation, M.N., M.O., and M.H.S.; writing—review and editing, A.S., K.M.S., and H.S.; visualization, M.N., M.O., and H.E.; supervision, H.E., A.S., and H.S.; project administration, M.H.S. and A.S. All authors have read and agreed to the published version of the manuscript.
Funding
This research received no external funding.
Data Availability Statement
Data will be available upon request from the corresponding author.
Acknowledgments
The author sincerely acknowledges the assistance of ChatGPT (GPT-4o) in refining the English language of this manuscript, ensuring clarity and coherence in its presentation. The final version of the manuscript was carefully reviewed by the author to ensure it adheres to the journal’s guidelines and maintains the intended scientific accuracy and originality.
Conflicts of Interest
The authors declare no conflicts of interest.
Abbreviations
| Nomenclature | |
| (m2) | |
| Discount rate () | |
| Radiation () | |
| Height (m) | |
| Lifetime (year) or Number | |
| Power () | |
| Mass flow rate (kg·s−1) | |
| Temperature () | |
| ) | |
| Greek symbols | |
| ) | |
| Efficiency () | |
| Scripts | |
| Ambient | |
| Cut-in | |
| Cut-out | |
| db | Dry bulb |
| Hub | |
| nom | Nominal |
| Reference | |
| w | Water |
| wb | Wet bulb |
| Abbreviation | |
| Bat Algorithm | |
| Generated Electricity | |
| Desalinated water | |
| Humidification–Dehumidification | |
| Initial Cost | |
| Levelized Cost of Electricity | |
| Levelized Cost of Water | |
| Nominal Operating Cell Temperature | |
| Operating and Maintenance | |
| Present Cost | |
| Photovoltaic | |
| Renewable Energy System | |
| Reverse Osmosis | |
| Recovery Rate | |
| Seawater Reverse Osmosis | |
| Total Annual Cost | |
| Total Dissolved Solid | |
| Vertical Axis Wind Turbine | |
| Wind Turbine |
References
- Shahverdian, M.H.; Delfani, F.; Pedram, M.Z.; Hosseini, M.; Sohani, A.; Fazeli, H.; Sayyaadi, H. Fundamentals and mechanism of biological purification and classification. In Sustainable Remediation Technologies for Emerging Pollutants in Aqueous Environment; Elsevier: Amsterdam, The Netherlands, 2024; pp. 13–28. [Google Scholar]
- Kassem, Y.; Gokcekus, H.; Ab Albakoush, I.A.; Abdullah, K.S.B. Solar-powered solutions for the water and energy shortage problem: The case study of Nahr El Bared, Lebanon. Eng. Technol. Appl. Sci. Res. 2023, 13, 10861–10869. [Google Scholar] [CrossRef]
- Kim, Y.; Byun, J.; Park, K.; Park, Y.-G. Comprehensive analysis of energy saving and high-quality permeate production strategies for a large-scale seawater reverse osmosis desalination plant with diverse process configurations and external resource utilization. Desalination 2025, 596, 118292. [Google Scholar] [CrossRef]
- Danoune, M.B.; Ayodele, T.R. Techno-economic design of a renewable energy-based reverse osmosis desalination system for an industrial area in Algeria: The case of Adrar’s oil refinery. Desalination 2025, 601, 118569. [Google Scholar] [CrossRef]
- Kensara, M.; Dayem, A.M.A.; Nasr, A. Reverse Osmosis Desalination Plant Driven by Solar Photovoltaic System-Case Study. Int. J. Heat Technol. 2021, 39, 1153–1163. [Google Scholar] [CrossRef]
- Tourab, A.E.; Blanco-Marigorta, A.M.; Elharidi, A.M.; Suárez-López, M.J. A novel configuration of hybrid reverse osmosis, humidification–dehumidification, and solar photovoltaic systems: Modeling and exergy analysis. J. Mar. Sci. Eng. 2023, 12, 19. [Google Scholar] [CrossRef]
- Ayou, D.S.; Ega, H.M.; Coronas, A. A feasibility study of a small-scale photovoltaic-powered reverse osmosis desalination plant for potable water and salt production in Madura Island: A techno-economic evaluation. Therm. Sci. Eng. Prog. 2022, 35, 101450. [Google Scholar] [CrossRef]
- Hekmatmehr, H.; Esmaeili, A.; Bidi, M. Practical design of a small-scale PVRO desalination unit using longtime measured water quality reports: A case study for Khuzestan, Iran. Sol. Energy 2024, 267, 112255. [Google Scholar] [CrossRef]
- Abdelrahman, M.; Sallam, G.R.; Dawoud, M.A.; Sakr, R.; Emam, M. Improving the performance of a PV-RO brackish water desalination plant in Egypt using solar thermal feed preheating technology. J. Energy Storage 2024, 98, 113115. [Google Scholar] [CrossRef]
- Ravajiri, E.S.; Jalali, A.; Houshfar, E. Multi-objective optimization and 4E analysis of an integrated system based on waste-to-energy, solar PV, power-to-gas, and HDH-RO desalination. Energy Convers. Manag. 2023, 277, 116677. [Google Scholar] [CrossRef]
- Abdelgaied, M.; Abdullah, A.; Kabeel, A.; Abosheiasha, H. Assessment of an innovative hybrid system of PVT-driven RO desalination unit integrated with solar dish concentrator as preheating unit. Energy Convers. Manag. 2022, 258, 115558. [Google Scholar] [CrossRef]
- Dehmas, D.A.; Kherba, N.; Hacene, F.B.; Merzouk, N.K.; Merzouk, M.; Mahmoudi, H.; Goosen, M.F.A. On the use of wind energy to power reverse osmosis desalination plant: A case study from Ténès (Algeria). Renew. Sustain. Energy Rev. 2011, 15, 956–963. [Google Scholar] [CrossRef]
- Alzahrani, K.M.; Hee, J.L.; Elsakka, M.; Ingham, D.; Ma, L.; Pourkashanian, M. Techno-economic assessment of vertical axis wind turbine driven RO desalination with compressed air energy storage for remote communities. Desalination 2024, 592, 118094. [Google Scholar] [CrossRef]
- Ali, E.; Bumazza, M.; Eltamaly, A.; Mulyono, S.; Yasin, M. Optimization of Wind Driven RO Plant for Brackish Water Desalination during Wind Speed Fluctuation with and without Battery. Membranes 2021, 11, 77. [Google Scholar] [CrossRef] [PubMed]
- Hassan, M.K.; Rezk, H.; Youssef, H.; Shehata, A.S.; El-Bary, A.A.; Al-Quraan, A. Optimal Sizing and Management of Hybrid Wind Turbine-Diesel-Battery System for Reverse Osmosis Seawater Desalination in NEOM City. Int. J. Energy Res. 2024, 2024, 2941404. [Google Scholar] [CrossRef]
- Esquivel-Puentes, H.A.; Vacca, A.; Chamorro, L.P.; Garcia-Bravo, J.; Warsinger, D.M.; Castillo, L. Simultaneous electricity generation and low-energy-intensive water desalination using a hydraulic wind turbine. Desalination 2025, 601, 118526. [Google Scholar] [CrossRef]
- Li, F.-F.; Wang, H.-R.; Wu, Z.-G.; Qiu, J. Maximizing both the firm power and power generation of hydropower station considering the ecological requirement in fish spawning season. Energy Strategy Rev. 2020, 30, 100496. [Google Scholar] [CrossRef]
- Li, F.-F.; Wu, Z.-G.; Wei, J.-H.; Qiu, J. Long-term equilibrium operational plan for hydro-PV hybrid power system considering benefits, stability, and tolerance. J. Water Resour. Plan. Manag. 2020, 146, 05020012. [Google Scholar] [CrossRef]
- Ghaithan, A.M.; Mohammed, A.; Al-Hanbali, A.; Attia, A.M.; Saleh, H. Multi-objective optimization of a photovoltaic-wind-grid connected system to power reverse osmosis desalination plant. Energy 2022, 251, 123888. [Google Scholar] [CrossRef]
- Ghanbari, K.; Maleki, A.; Ochbelagh, D.R. Optimal design of solar/wind/energy storage system-powered RO desalination unit: Single and multi-objective optimization. Energy Convers. Manag. 2024, 315, 118768. [Google Scholar] [CrossRef]
- Qudah, A.; Almerbati, A.; Mokheimer, E.M. Techno-economic analysis and optimization of standalone Hybrid Photovoltaic (PV)/Wind Turbine (WT) with water tank storage driven Reverse Osmosis (RO) desalination system. Desalination 2025, 600, 118522. [Google Scholar] [CrossRef]
- Eltamaly, A.M.; Ali, E.; Bumazza, M.; Mulyono, S.; Yasin, M. Optimal design of hybrid renewable energy system for a reverse osmosis desalination system in Arar, Saudi Arabia. Arab. J. Sci. Eng. 2021, 46, 9879–9897. [Google Scholar] [CrossRef]
- Sohani, A.; Pierro, M.; Moser, D.; Cornaro, C. Comparison of physical models for bifacial PV power estimation. Energy Convers. Manag. 2025, 327, 119515. [Google Scholar] [CrossRef]
- Iran Meteorological Organization (IMO). The Sistan and Balochestan Weather. Available online: https://www.irimo.ir/ (accessed on 29 April 2025).
- Javadijam, R.; Shahverdian, M.H.; Sohani, A.; Sayyaadi, H. A 4E Comparative Study between BIPV and BIPVT Systems in Order to Achieve Zero-Energy Building in Cold Climate. Buildings 2023, 13, 28. [Google Scholar] [CrossRef]
- Sohani, A.; Shahverdian, M.H.; Sayyaadi, H.; Nižetić, S.; Doranehgard, M.H. An optimum energy, economic, and environmental design based on DEVAP concept to reach maximum heat recovery in a PV-wind turbine system with hydrogen storage. Energy Convers. Manag. 2023, 288, 117147. [Google Scholar] [CrossRef]
- Notton, G.; Cristofari, C.; Mattei, M.; Poggi, P. Modelling of a double-glass photovoltaic module using finite differences. Appl. Therm. Eng. 2005, 25, 2854–2877. [Google Scholar] [CrossRef]
- Manwell, J.F.; McGowan, J.G.; Rogers, A.L. Wind Energy Explained: Theory, Design and Application; John Wiley & Sons: Hoboken, NJ, USA, 2010. [Google Scholar]
- Chang, T.-P.; Liu, F.-J.; Ko, H.-H.; Cheng, S.-P.; Sun, L.-C.; Kuo, S.-C. Comparative analysis on power curve models of wind turbine generator in estimating capacity factor. Energy 2014, 73, 88–95. [Google Scholar] [CrossRef]
- Bourouni, K.; M’Barek, T.B.; Al Taee, A. Design and optimization of desalination reverse osmosis plants driven by renewable energies using genetic algorithms. Renew. Energy 2011, 36, 936–950. [Google Scholar] [CrossRef]
- Sanaye, S.; Sarrafi, A. Cleaner production of combined cooling, heating, power and water for isolated buildings with an innovative hybrid (solar, wind and LPG fuel) system. J. Clean. Prod. 2021, 279, 123222. [Google Scholar] [CrossRef]
- Song, Q.; Wang, B.; Wang, Z.; Wen, L. Multi-objective capacity configuration optimization of the combined wind-Storage system considering ELCC and LCOE. Energy 2024, 301, 131558. [Google Scholar] [CrossRef]
- Beni, A.N.; Ghofrani, I.; Nouri-Borujerdi, A.; Moosavi, A.; Warsinger, D.M. Membrane properties overview in integrated forward osmosis/osmotically assisted reverse osmosis systems. Desalination 2024, 569, 117008. [Google Scholar] [CrossRef]
- Kouhkord, A.; Hassani, F.; Amirmahani, M.; Golshani, A.; Naserifar, N.; Moghanlou, F.S.; Beris, A.T. Controllable microfluidic system through intelligent framework: Data-driven modeling, machine learning energy analysis, comparative multiobjective optimization, and experimental study. Ind. Eng. Chem. Res. 2024, 63, 13326–13344. [Google Scholar] [CrossRef]
- Ma, H.; Zhang, Y.; Sun, S.; Liu, T.; Shan, Y. A comprehensive survey on NSGA-II for multi-objective optimization and applications. Artif. Intell. Rev. 2023, 56, 15217–15270. [Google Scholar] [CrossRef]
- Shahverdian, M.H.; Sohani, A.; Zamani Pedram, M.; Sayyaadi, H. An optimal strategy for application of photovoltaic-wind turbine with PEMEC-PEMFC hydrogen storage system based on techno-economic, environmental, and availability indicators. J. Clean. Prod. 2023, 384, 135499. [Google Scholar] [CrossRef]
- Sanaye, S.; Sarrafi, A. A novel energy management method based on Deep Q Network algorithm for low operating cost of an integrated hybrid system. Energy Rep. 2021, 7, 2647–2663. [Google Scholar] [CrossRef]


Disclaimer/Publisher’s Note: The statements, opinions and data contained in all publications are solely those of the individual author(s) and contributor(s) and not of MDPI and/or the editor(s). MDPI and/or the editor(s) disclaim responsibility for any injury to people or property resulting from any ideas, methods, instructions or products referred to in the content. |
© 2025 by the authors. Licensee MDPI, Basel, Switzerland. This article is an open access article distributed under the terms and conditions of the Creative Commons Attribution (CC BY) license (https://creativecommons.org/licenses/by/4.0/).