Abstract
Mine water treatment and emissions have become important factors that restrict the comprehensive benefits of coal enterprises and local economic development, and the use of the deep well recharge method can address the specific conditions of mine surge water. This paper takes the actual situation of coal mine water treatment as an example and innovatively carries out dynamic tests for the Ordovician limestone aquifers deep in the mine. Intermittent reinjection test shows that under the same reinjection time, the water level recovery rate during the intermittent period is fast at first and then slow. Moreover, the recovery speed of the water level buried depth slows down with the increase in the reinjection time, which reveals the characteristics of the water level rising rapidly and recovering quickly during the reinjection of the reservoir. The average formation water absorption index is 420.81 m3/h·MPa. The water level buried depth of the long-term reinjection test showed three stages (rapid rise, slow rise, and stable stages), and the water level buried depth was raised to 1.52 m at its highest. Monitoring data from the surrounding 5 km area showed that reinjection did not affect aquifer water levels, verifying the excellent storage capacity of the deep Ordovician fissure-karst aquifer. The variability of well loss under pumping and injection conditions was comparatively analyzed, and the well loss produced by the recharge test was 4.06 times higher than that of the pumping test, which provided theoretical support for the calculation of hydrogeological parameters to eliminate the influence of well loss. This study deepens the understanding of Ordovician limestone aquifers in deep mine water, providing a reference for cheap mine water treatment and sustainable groundwater management in similar mine areas.
1. Introduction
Coal constitutes the dominant energy source for societal and industrial activities. Especially in China, the growing scale of mine exploitation has led to progressively severe mine water management-related challenges [1,2,3,4]. Mine water, a byproduct of coal extraction, accumulates during mining operations. Statistics indicate that approximately 2 tons of mine water are generated per ton of coal extracted in China [5]. While mine water dewatering guarantees operational safety, it escalates expenditures for both water treatment and regulatory-compliant discharge, creating substantial economic pressures for mining companies [6,7,8,9,10]. Building on international advances in deep geological sequestration, deep mine water reinjection has emerged as a novel solution [11]. This method offers cost-effectiveness compared to high-salinity water treatment, operational feasibility, and reduced environmental impacts. It also supports sustainable coal–water resource management by enabling coordinated extraction of both resources. This “relocation-storage” technique involves injecting pretreated mine water into deep aquifers through surface or underground boreholes [5,12].
Numerous countries, including the United States, Australia, Japan, Spain, Germany, Finland, and other European nations, have developed mature groundwater recharge technologies through extensive practical applications. The United States operates approximately 144,000 Class II injection wells, primarily concentrated in Texas, California, Kansas, and Oklahoma. These facilities serve multiple purposes: 80% enhance oil recovery, 20% manage saline wastewater from hydrocarbon production, while others utilize underground salt formations for strategic petroleum reserves [13]. In Western Australia’s Pilbara iron ore region, Fortescue Metals Group employs integrated mine drainage, water treatment, and groundwater recharge systems to prevent saltwater intrusion and regulate brackish water boundaries near mining sites [14]. Researchers led by Baquero implemented a closed-loop pumping-recharge system at the Cobre Las Cruces open-pit copper mine in Seville, Spain, using strategically placed injection and extraction wells to sustainably address local drinking water supply challenges [15]. The groundwater recharge initiatives investigated in these studies predominantly involve metal mines; the German case centers solely on ecological replenishment of shallow groundwater. Studies on deep reservoir recharge utilizing unconventional water resources—including urban stormwater, coal mine drainage, or recycled water—remain comparatively limited. Common research on groundwater recharge mainly focuses on hydrocarbon recovery enhancement, geothermal wastewater reinjection, treated water reuse, land subsidence mitigation, coastal aquifer protection, coalbed methane development, and CO2 sequestration [16,17,18,19,20,21]. This presents a marked contrast to coal mine water recharge practices. Shallow-level recharge initiatives are predominantly implemented to mitigate land subsidence and replenish aquifers [22,23]; whereas deep-level groundwater systems are chiefly employed to optimize the extraction of associated geothermal and hydrocarbon resources [24,25]. China has made significant advancements in several domains, including geothermal system recharge, urban wastewater recycling, and underground reservoir management [26,27,28,29].
Aquifers inherently form a groundwater equilibrium system integrating physical, chemical, and biological processes [30]. The affinity theory concerning artificially recharged water and native groundwater in aquifers was first proposed by the French scientist Élie de Beaumont. This theory holds that recharge water and formation water possess favorable chemical affinity when sharing comparable geochemical compositions and concentrations of soluble salts. Artificial recharge exerts multifaceted influences on the groundwater environment. Beneficial effects encompass: alleviating groundwater overdraft, controlling land subsidence, preventing seawater intrusion, and enhancing groundwater quality. Adverse effects include risks of water quality deterioration, chiefly characterized by microbial contamination, chemical pollution (eutrophication and organic compounds), mineral dissolution/precipitation induced by water–rock interactions (e.g., calcite, gypsum, dolomite), and modifications to redox conditions. Alterations in these parameters commonly pose the latent risk of clogging within the reservoir media [31,32,33]. Injecting coal mine wastewater into aquifers remains uncommon globally. Early Chinese research in this field includes the Wutongzhuang Mine project in Hebei Province, where an underground reservoir system was developed to redirect mine water into Ordovician limestone aquifers [11]. Other studies have explored the feasibility of deep injection and containment in sandstone aquifers within Ordos Basin formations like Baotashan and Liujiagou, though primarily at experimental scales [5,12]. Consequently, practical implementations of mine water injection in coal mining operations remain limited, with particularly scarce documentation on deep-well injection projects targeting Ordovician limestone formations. The distinctive geological composition and geochemical properties of Ordovician limestone aquifers make them particularly significant for subsurface injection studies as their unique hydrogeological behavior under mine water infiltration requires a thorough investigation.
The water storage capacity estimate or groundwater resource evaluation of aquifers is usually based on the pumping test data to determine the hydrogeological parameters of the aquifer, such as permeability coefficient, water conduction coefficient, water storage coefficient, water supply degree, etc. [34,35,36,37]. Whether the hydrogeological parameters are determined reasonably directly affects the credibility of the final result and, thus, affects the scientific nature of a reservoir evaluation. High uncertainties are inherent in information regarding aquifer systems, their geological settings, structures, and subsequent modeling [38]. In a notable real-world case study of an aquifer system in the Province of Lecco, northern Italy, Schiavo employed the Monte Carlo method. This application provided valuable insights into the convergence of Monte Carlo simulations and their impacts on boundary conditions, overall model performance, and local simulated hydraulic heads [39]. Moreover, to ensure optimal groundwater extraction strategies, Bianchi Janetti et al. constructed a comprehensive framework. This framework delved into the influences of model parameter uncertainties and conceptual model uncertainties on the overall probability assessment of system failures resulting from different groundwater extraction strategies [40]. In order to make the calculation results closer to reality in parameter calculations, well loss is a problem that cannot be ignored. Therefore, by combining the observation data of the pumping test and the reinjection test, using the actual results, different methods are used to determine the pumping and reinjection well losses, which can more accurately reflect the dynamic characteristics of the reservoir groundwater, providing an accurate basis for subsequent calculations.
Consequently, this study focuses on employing the Ordovician limestone aquifer in southwest Shandong Province, China, as a reinjection reservoir for mine water, with the objective of systematically investigating the response mechanisms of deep mine water reinjection. Through field experiments comparing intermittent and sustained recharge strategies, we analyze aquifer water level fluctuations, permeability dynamics, and storage capacity under varying operational conditions. The findings identify optimal recharge potential in Ordovician limestone aquifers within North China’s coal mining regions. This research advances the scientific framework for deep mine water reinjection while providing critical insights for sustainable aquifer management, ultimately supporting ecological preservation and long-term water resource security in mining areas.
2. Description of Study Area
2.1. Geographical Location
The study area is situated in northeastern Yuncheng County, Heze City, Shandong Province (Figure 1a). Characterized by a temperate monsoonal continental climate, the region receives an average annual precipitation of 694.7 mm. The coal field features a monoclinal structure trending approximately north–south with an eastward dip. Located at the northern extremity of the Juye Coalfield, this fully concealed deposit is overlain by Quaternary strata and represents a typical North China Carboniferous–Permian coal-bearing sequence. Geological cross-sections (Figure 1b) reveal three target coal seams within the Taiyuan and Shanxi Formations, underlain by Ordovician limestone and overlain by Permian Shihezi Group, Jurassic Zibo Group, Paleogene, Neogene, and Quaternary strata.
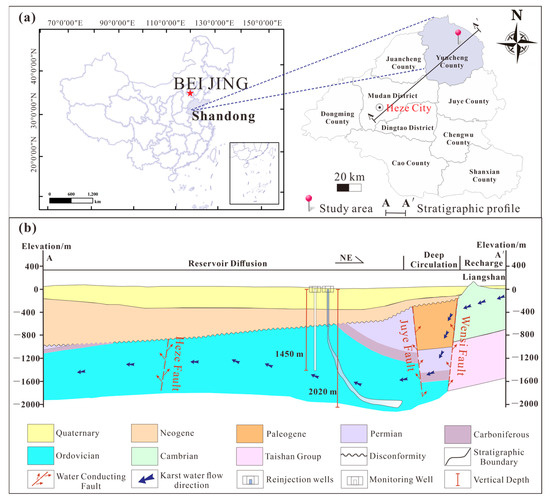
Figure 1.
(a) The location map of the study area; (b) the stratigraphic profile of the study area.
The well completion technology used in the field work is directional drilling (non-radial). The reinjection well was constructed to an actual depth of 2020.11 m, with 437.84 m vertical penetration into the Ordovician limestone aquifer [41]. The drilling process comprised three phases: Primary drilling: A Φ444.5 mm tri-cone bit was employed for initial penetration using a tower-type drill string assembly. The weight indicator was carefully calibrated, and the square drill pipe was realigned every 2–3 m of penetration to ensure vertical alignment of the surface casing. Drilling parameters were maintained at 10–80 kN weight on bit (WOB) to control the well deviation while optimizing the penetration rate. The 567.00 m conductor casing was cemented to the surface using the inner string method, effectively isolating Quaternary and Neogene formations. Secondary drilling: Advanced to 1410.00 m depth, exposing 12.00 m of Ordovician limestone. An 877.6 m technical casing string was installed to secure this section. Tertiary drilling: Conducted directional drilling with a Φ216 mm PDC bit through the target aquifer. The completed screen assembly consisted of a 114.43 m blank casing and 509.48 m filter screen (total 623.91 m production string).
2.2. Characteristics of Mine Water Quality
A large amount of mine water is generated during the production processes of the coal mine, which is also a characteristic of the large amount of water inflow in the North China mining area. These mine waters mainly come from the top and bottom plates of the No. 3 coal seam being mined, including Permian Shihezi sandstone water, Carboniferous sandstone water, and limestone aquifer water. The average annual water inflow is 902 m3/h, the maximum water inflow is 1960 m3/h, and its mineralization degree reaches 2945.55 mg/L. Sulfate in the mine water is as high as 1520.96 mg/L, and the sodium ions can reach 855.54 mg/L. If the mine water with high mineralization is discharged directly into the environment, it will cause problems such as surface water pollution (increased salt content), soil salinization, reduced surface vegetation, shallow groundwater pollution, etc., which will bring certain harm to the ecological environment. In China, under normal circumstances, coal mines will discharge this mine water after meeting the standards, but the desalination treatment cost per ton of water for high-mineralization mines is about CNY 20 to 30, which is relatively high in operating costs [5]. In addition, the investment in the construction of water treatment plants is huge, reaching hundreds of millions of CNY. Therefore, strategic recharge of treated mine water into Ordovician limestone aquifers offers dual benefits: sustainable groundwater replenishment and alignment with integrated coal–water resource management principles, supporting water-preserved coal extraction practices.
2.3. Feasibility Analysis of Reinjection in Ordovician Limestone
The coal-based Ordovician limestone aquifer in the study area is the target layer for this deep reinjection storage. The feasibility of the on-site test is mainly considered from the aspects of water quality and water storage space [11]. In combination with the requirements for water quality before the reinjection of mine water, the primary condition should ensure that the water quality of mine water is generally better than the water quality of the reinjection reservoir and does not introduce pollutants. On the other hand, water storage space screening is usually an important condition for the successful application of mine water back-storage technology. Three essential criteria guide this selection process:
- (i)
- Adequate storage capacity: sufficient thickness, porosity, and permeability to ensure sustainable recharge rates and effective hydraulic connectivity;
- (ii)
- Confining layer integrity: impermeable strata above and below the reservoir to prevent cross-layer contamination and mitigate hydrogeological risks;
- (iii)
- Seismic stability: low probability of natural seismic activity to ensure long-term reservoir integrity.
2.3.1. Water Quality Suitability Analysis
Regional groundwater recharge originates from precipitation infiltration in the Liangshan-Jiaxiang bedrock mountains, circulating deeply through conductive faults to replenish the karst aquifer (Figure 1b). Groundwater flows northeast to southwest, with prolonged rock–water interactions during recharge–transport–discharge cycles, elevating ionic concentrations. Total dissolved solids (TDS) range from 2037.77 to 4112.61 mg/L, reaching 3499.9 mg/L at injection wells. Dominant cations (Ca2+, Na+) and anions (SO42− > Cl− > HCO3−) classify the water as SO4-Cl-Ca-Na type.
To assess hydrogeochemical compatibility for artificial reinjection, a comprehensive hydrochemical survey was conducted, comprising 81 mine water specimens and 26 groundwater samples from Ordovician limestone aquifers within the study domain. Hydrochemical characterization (Table 1) reveals that Ordovician aquifer groundwater exhibits SO42−-Ca2+·Na+ facies, demonstrating mean ionic concentrations of 171.6 mg/L Na+, 178.3 mg/L HCO3−, and total dissolved solids (TDS) of 3323 mg/L. Mine drainage waters are classified as SO42−-Na+ type, characterized by elevated mean concentrations of 822.5 mg/L Na+ and 411.9 mg/L HCO3−, with TDS averaging 2747 mg/L. Comparative analysis shows that the Na+ and HCO3− in the mine water are higher than the Ordovician groundwater quality index and are better than the Ordovician groundwater after proper treatment, meeting the basic standards of sustainable reinjection, and will not cause geochemical incompatible reactions.

Table 1.
Statistical results of mine water and Ordovician groundwater quality.
2.3.2. Analysis of Medium Conditions of Reinjection Reservoir
This study targets the Ordovician fracture-karst aquifer for deep mine water reinjection. Dominated by limestone and dolomite lithology, the reservoir exhibits structurally controlled storage capacity, with enhanced karst-fracture development near fault zones (Figure 1b). Field investigations and drilling data indicate a karst fracture density of 6–14%, karstification depths of 500–1800 m, and cumulative aquifer thicknesses of 18.4–113.0 m, confirming its viability for injection. Permeability shows marked spatial heterogeneity, with single-well yields of 80–402 m3/h and hydraulic conductivities of 0.5–2.5 m/d. The reservoir is capped by a Carboniferous–Permian sandstone-mudstone composite layer, serving as an effective confining unit. These hydrogeological conditions ensure mine water reinjection poses no risk to coal seam stability.
3. Experimental Design and Method
3.1. Hydrogeochemical Assessment of Mine Water Reinjection into Aquifer
In order to assess the hydrogeochemical interactions associated with recharging mine water into the Ordovician limestone aquifer, the PHREEQC software (version 3.7.3) was used to explore mineral dissolution and precipitation in the aquifer system receiving the mine water injection. Five mixing ratios of Ordovician limestone water to mine water were investigated: 9:1, 7:3, 5:5, 3:7, and 1:9. The aquifer temperature was maintained at 50 °C. The saturation index (SI) is the most frequently applied parameter in groundwater hydrogeochemical research. It was calculated using the minteq.dat database in the PHREEQC software. An SI > 0.5 signifies that a specific mineral is supersaturated in the groundwater, leading to its precipitation. Conversely, it indicates dissolution is occurring. An SI value between −0.5 and 0.5 indicates a state of equilibrium with respect to dissolution [42]. Thus, this analysis verifies if the mine water recharge satisfies the “water quality dominance” principle.
3.2. Reinjection Experiment Program
This investigation employs two complementary approaches—gravity-fed intermittent injection and sustained constant-rate injection—to determine optimal cycling intervals and evaluate aquifer storage capacity, ultimately optimizing recharge protocols. Preliminary variable-rate injection tests were conducted to determine optimal flow rates and cycling intervals while ensuring the safe transportation of mine water through the reinjection pipeline. The preliminary testing methodology is detailed in Section 4.1, with full experimental protocols summarized in Table 2.
Table 2.
Design of reinjection test scheme.
The equipment required for the site reinjection test mainly includes a lift pump, pipeline pump, automatic electromagnetic flowmeter, flow meter, pressure gauge, temperature meter, water stop valve, multi-parameter rapid detector, and automatic water level monitor.
3.3. Distribution of Monitoring Wells
Figure 2 illustrates the spatial configuration of recharge and monitoring wells. The monitoring network serves as critical infrastructure for tracking aquifer dynamics, systematically capturing multidimensional responses of groundwater systems to recharge operations [43]. Monitoring wells were strategically positioned within a 5 km radius of the recharge well, accounting for groundwater flow directions to ensure upstream–downstream observational coverage. This approach enabled continuous recording of hydraulic head fluctuations across temporal and spatial domains, revealing aquifer heterogeneity and interlayer hydraulic connectivity during recharge cycles.
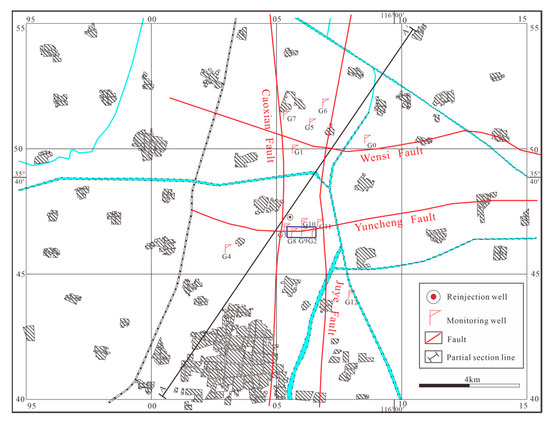
Figure 2.
The distribution of recharge wells and monitoring wells.
4. Results and Discussion
4.1. Characteristics of Mineral Changes After Different Proportions of Mine Water Injection
The PHREEQC simulation results demonstrate that with increasing mine water recharge volume, the total dissolved solids (TDS) decrease, while sodium salts show persistent dissolution behavior. Several minerals that are prone to precipitation were selected, including calcite (CaCO3), dolomite (CaMg(CO3)2), gypsum (CaSO4·2H2O), and anhydrite (CaSO4), and their saturation index after mixing was calculated, as shown in Figure 3. As the mine water recharge volume rises, the saturation indices for all four minerals display a decreasing trend and are consistently below 0.5. This further demonstrates that the reinjection of mine water into the reservoir will not cause mineral precipitation, confirming that the mine water quality meets the “water quality dominance” principle for recharge. Thereby, this prevents potential problems, including aquifer system clogging and deterioration of water quality.
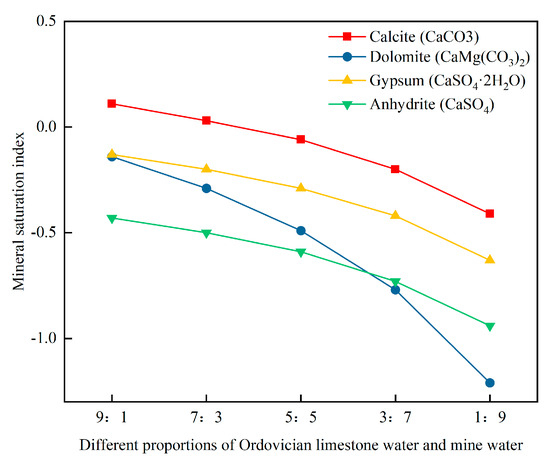
Figure 3.
Variation characteristics of SI in mine water reinjection under different proportions.
4.2. Acquisition of Water Injection Tests and Intervals
Four injection tests were conducted (Figure 4) to assess the Ordovician limestone aquifer’s capacity to store and transfer mine water, measure post-injection water level recovery rates in monitoring wells, and establish optimal flow rates and injection intervals for subsequent controlled reinjection protocols. This preliminary assessment aims to inform sustainable operational parameters for large-scale implementation.
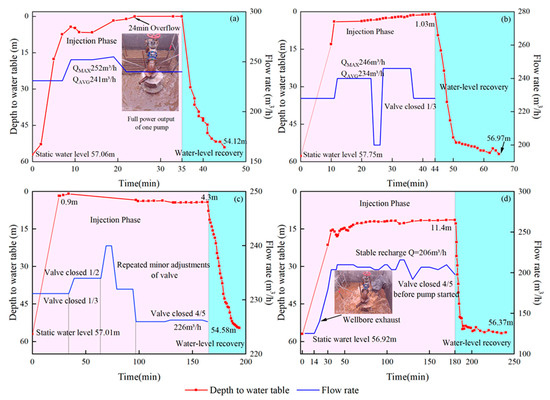
Figure 4.
Relationship between water level burial depth and flow rate with time for 4 water injection tests. (a) First injection; (b) Second injection; (c) Third injection; (d) Fourth injection.
Test 2 began with an initial static water level of 57.75 m, which decreased to 56.65 m after venting. During the first 10 min of injection, water levels rose rapidly at a peak flow of 246 m3/h (an average of 234 m3/h), followed by a gradual stabilization. By partially closing the valve (2/3 open), a controlled injection of 201 m3 over 41 min achieved a final water depth of 1.03 m without overflow (Figure 4b).
Test 3 employed an adaptive control strategy (Figure 4c). Initially, the valve remained fully open for 34 min, injecting 131 m3 and reducing water depth to 0.918 m. Subsequent staged adjustments reduced valve opening to 1/3 (65 m3 over 15 min) and 1/2 (61 m3 over 15 min), during which a gradual water level decline was observed. Maintaining 4/5 closure for 100 min (a total of 381 m3 injected) stabilized the water depth at 4.0 m.
Building on prior tests, Test 4 implemented a fixed 4/5 valve opening for continuous 180-min injection. A stable flow rate of 206 m3/h (electromagnetic flowmeter data) delivered a cumulative injection of 582 m3, during which the water depth rose steadily from 56.92 m to 11.37 m (Figure 4d).
Post-injection monitoring revealed water level recoveries to 54.12 m, 52.44 m, 29.88 m, and 53.78 m after 10 min for Tests 1–4, respectively. While Test 3 exhibited a temporary recovery delay (likely attributable to staged flow adjustments), levels rebounded to 50.75 m within the subsequent 10 min, demonstrating the aquifer’s effective hydraulic conductivity. Analysis of recovery patterns supported implementing 5-, 15-, and 30-min intervals for intermittent recharge protocols.
The water absorption index (N) quantifies formation injectivity, with higher values indicating superior subsurface absorption capacity [44]. Calculated as:
where:
Q = Recharge rate (m3/h)
P1 = Pre-injection bottomhole pressure (MPa)
P2 = Post-injection bottomhole pressure (MPa)
The four injection tests yielded absorption indices ranging from 411.46 to 431.80 m3/h·MPa (mean of 420.81 m3/h·MPa), confirming strong vertical permeability and substantial recharge capacity in the target zone. Based on observed water level responses and pipeline hydraulic constraints, a safe operational flow rate of 200 ± 10 m3/h was established for subsequent trials.
4.3. Reservoir Dynamic Response Characteristics
4.3.1. Unpressurized Constant Flow Interval Reinjection Test
Figure 5 demonstrates the dynamic relationship between water table depth and flow rate (Q) under varied operational parameters (recharge durations: 2/4/6 h; intermittency periods: 5/15/30 min), revealing distinct nonlinear reservoir responses across test conditions. Figure 5a details the 2-h cycle response: Initial static water level at 57.12 m rose rapidly by 15.64 m within 10 min (steady flow: 204 m3/h) following wellbore priming. During phase T2-1, continuous recharge lowered the water table to 12.66 m, with a 39.39 m drawdown observed after 5-min pump cessation (52.05 m). Phase T2-2 recorded recharge-induced elevation to 11.57 m, followed by sequential drawdowns: 33.22 m (44.79 m) at 5 min and an additional 9.29 m (54.08 m) at 15 min post-recharge. Subsequent phases exhibited similar patterns, with T2-3 achieving 11.71 m before 30-min intermittency produced drawdowns of 35.65 m (47.36 m), 42.68 m (54.39 m), and 45.77 m (57.48 m) at 5-, 10-, and 30-min intervals. The 4- and 6-h cycles (Figure 5b,c) exhibited comparable hydraulic behavior, characterized by rapid water table elevation during recharge initiation and swift recovery during intermittency. Notably, prolonged recharge durations correlated with the progressive water table rise and decelerated recovery rates.
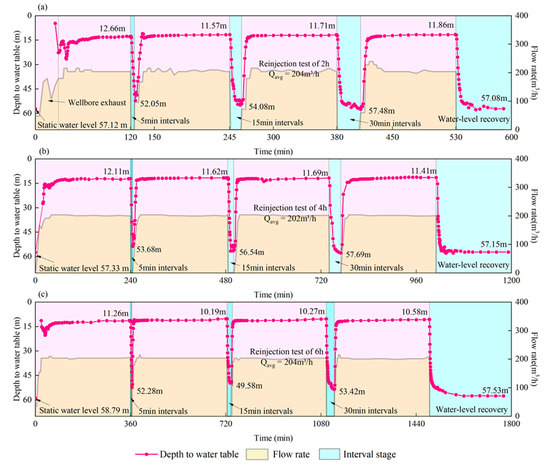
Figure 5.
This figure illustrates the temporal relationships between water table depth and flow rate (Q) under varying recharge duration–intermittency combinations: (a) 2-h cycles, (b) 4-h cycles, and (c) 6-h cycles.
Under equivalent total recharge durations, phases T2-2, T4-1, and T6-1 (4-h mark) showed water table elevation increases of 45.55 m, 45.23 m, and 47.3 m, respectively, indicating minimal recovery impact from 5-min intermittency. Extended 15-min intervals during phases T2-3, T4-2, and T6-1 (6-h mark) yielded increases of 45.41 m, 45.6 m, and 47.53 m, demonstrating enhanced pressure dissipation during recovery periods. Progressive elevation patterns emerged at 8-h (T2-4/T4-2/T6-2: 45.26–47.66 m) and 16-h marks (T4-4/T6-3: 45.92–47.84 m), confirming that 30-min intervals substantially improved aquifer drainage efficiency through sustained pressure dissipation. Three key patterns emerged: (1) biphasic response curves (rapid rise followed by stabilization), with initial 10-min elevations accounting for 62–78% of total stage increases; (2) positive correlation between recharge duration and hydraulic response magnitude (21.3% greater elevation at 6-h vs. 2-h cycles); and (3) inverse relationship between recharge duration and recovery rates (1.42 m/min vs. 0.43 m/min for 2-h and 6-h cycles, respectively). These findings provide critical operational benchmarks for the recharge system optimization. Moreover, as the amount of reinjection of mine water increases, the mineral saturation index continues to decrease (Figure 3), and various minerals exhibit continuous dissolution characteristics. At the same time, combined with this characteristic of rapid recovery of groundwater level when reinjection stops (Figure 5), it can be inferred that the radius of influence of reinjection groundwater has not changed. It would mean that, no matter the underground aquifer structure, the groundwater system being pumped tends to converge, from an energetic viewpoint, to an equilibrium state, as previously stated by Zehe et al. and Schiavo [45,46].
4.3.2. Long Term Reinjection Test Without Pressure and Constant Flow
Figure 6 illustrates the water table dynamics during a 30-day constant-flow reinjection test under unconfined conditions. The initial water table depth was measured at 57.51 m at the reinjection well, with the flow rate was maintained at 200 ± 5 m3/h. Water levels rose rapidly to 12.1 m, 11.57 m, and 11.44 m at 2, 4, and 6 h, respectively, showing declining ascent rates of 22.71 m/h, 11.49 m/h, and 7.68 m/h. This pattern of rapid initial rise followed by gradual deceleration aligns with the hydraulic response observed in the intermittent reinjection phase T6-1. The recharge process exhibited three distinct phases: (1) rapid ascent (Days 1–7): water table rose 8.5 m; (2) gradual ascent (Days 7–12): additional 3.15 m increase; and (3) stable fluctuation (Days 12–30): ±0.25 m oscillations within 2 m range. Despite three brief interruptions (<8 h total) from equipment failures, water levels consistently recovered to pre-interruption levels, indicating delayed water dissipation in the aquifer system.
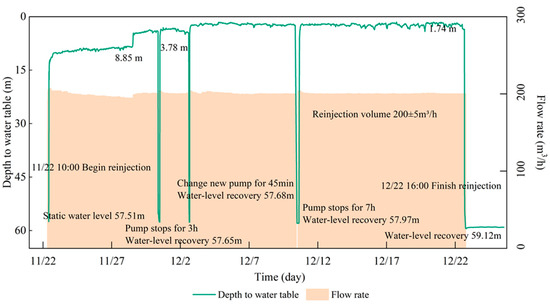
Figure 6.
Variations of the depth of water table burial and flow rate (Q) with time for a 30-day long-term reinjection test.
Post-experiment monitoring revealed significantly lower static water levels after prolonged recharge compared to intermittent operations. This suggests enhanced permeability anisotropy in the Ordovician limestone aquifer from sustained hydraulic loading, potentially enlarging preferential flow paths. Extended reinjection duration progressively fills aquifer storage capacity, reduces permeability, and strengthens hydraulic connections within surrounding strata. These changes prolong water level recovery times and create dissipation delays, demonstrating complex hydrogeological responses to sustained high-volume reinjection.
4.3.3. Changes in Water Table Depth in Monitoring Wells
Monitoring wells quantified the relationship between recharge volumes and aquifer permeability by tracking water level changes across multiple aquifers. Figure 7 details water level variations before and after recharge from 1 November 2024 to 2 February 2025. Key observations within a 5 km radius of the recharge site include the following:
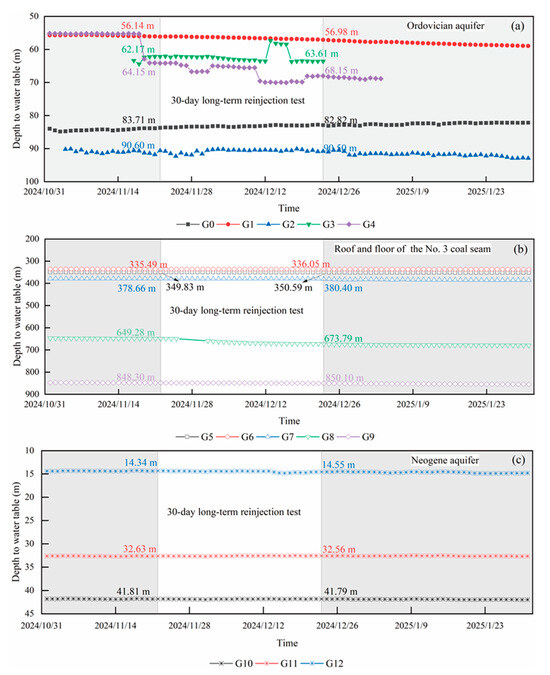
Figure 7.
Long-term observation data from the monitoring well. ((a) Ordovician aquifer; (b) roof and floor of the No. 3 coal seam; (c) Neogene aquifer).
Ordovician aquifer:
- -
- G0: Water levels rose 0.51 m (83.71 m to 82.82 m) with a consistent, gradual rise regardless of recharge.
- -
- G1: 0.84 m decline (56.14 m to 56.98 m).
- -
- G2: Stable levels (90.60 m to 90.50 m), indicating balanced recharge/discharge.
- -
- G3: 1.44 m decline (62.17 m to 63.61 m).
- -
- G4 (Luozhuang geothermal well): Pumping for heating initiated on 19 November caused a 4.00 m decline by December 22 (64.15 m to 68.15 m), with operational fluctuations.
Permian Shihezi Formation (G5–G8):
All monitoring points showed minor fluctuations except G8, which declined. The consistent water balance indicates no recharge impact, with regional discharge exceeding replenishment.
Lower Permian limestone (G9):
Steady 2.1 m decline (848.3 m → 850.4 m), aligned with mine drainage operations. Unchanged depletion rate confirms no recharge influence.
Neogene aquifer (G10–G12):
All three wells maintained equilibrium (±0.25 m fluctuations), demonstrating balanced regional recharge–discharge dynamics with no recharge effects.
Despite the absence of groundwater level variations observed in these monitoring wells, substantiating the effects of the mine water reinjection operation remains necessary. Consequently, we applied Sichardt’s equation [47,48], a standard empirical formulation in hydrogeological practice, to determine the radius of influence, expressed as:
In which R denotes the radius of influence (m); s signifies the drawdown (m); K stands for the hydraulic conductivity (m/s).
Comparative analysis with earlier numerical modeling results is shown in Figure 8, illustrating both the theoretical predictions of the empirical formula and the numerical simulation data [5]. Simulation results reveal the groundwater response to sustained recharge at 200 m3/h, producing influence radii of 145 m after 10 days, 810 m after 6 months, 1020 m after 18 months, and 1480 m after 3.5 years. These measurements exhibit strong concordance with the empirical formula’s computed value of 1464.5 m.
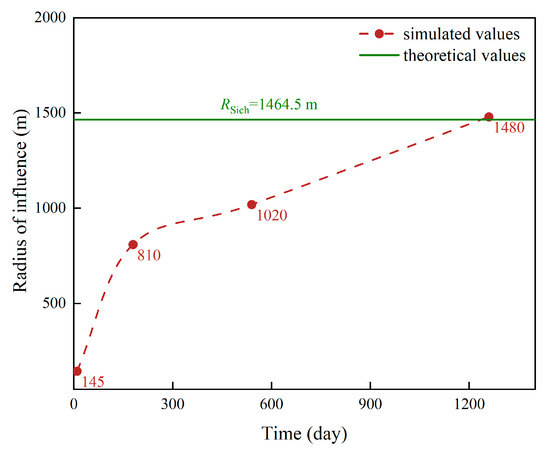
Figure 8.
A comparison of theoretical calculated values and numerical simulation results.
This is based on the observed water level changes across the relevant aquifers, empirical formula computations, and numerical modeling outcomes. These findings collectively demonstrate that the implemented long-term reinjection trial exerted no discernible impact on neighboring aquifers. Nevertheless, we still need to continue to carry out long-term monitoring to ensure the safety of the reinjection project.
4.4. Analysis of Well Loss During Pumping and Reinjection
Well loss is defined as the hydraulic head difference across the well screen resulting from the conversion of horizontal groundwater movement in the aquifer to vertical flow through the filter pipe, combined with frictional resistance at the well–aquifer interface during pumping operations [35]. As an intrinsic characteristic of pumping systems, well loss manifests proportionally with increasing pumping rates or drawdown depths during extraction processes [49,50,51]. Determinants of well loss encompass well diameter, completion design, filter media gradation, well development efficacy (insufficient development amplifies well loss proportion), construction methodology, and substantial random variables.
Artificial recharge through injection wells constitutes the hydraulic reverse of pumping, exhibiting partial penetration flow characteristics: water first establishes vertical flow within the well, subsequently creating composite 3D flow fields (radial–vertical) in the proximal aquifer zone, which progressively evolve into dominant 2D radial flow regimes through spatial attenuation. Well loss phenomena persist throughout this hydraulic transition process [52].
Contemporary approaches for well loss quantification comprise two principal methodologies: one based on pumping test data analysis using observation well spacing and drawdown versus logarithmic time (s-lgr) relationships [49,53,54,55]. While demonstrating superior precision, this approach necessitates extensive observation well networks accompanied by significant resource allocations for implementation. The second methodology applies empirical formulas established through multiple curve analyses of drawdown–discharge (S-Q) relationships from single-well pumping tests, incorporating Jacob’s quadratic well loss model (CwQ2) and Rorabaugh’s turbulent flow theory with exponent m (CwQ^m). The standard empirical formulation appears as follows:
where Sw = AQ denotes the theoretical drawdown adhering to Dupuit–Forchheimer laminar flow assumptions; well loss term: Sw1 = BQ^m, where A and B are calibration coefficients, m represents the discharge exponent, and Q signifies pumping/recharge flow rates.
Through inverse modeling of multi-cycle pumping test data from recharge wells using Equation (3), the optimized parameters were determined as A = 0.03552, B = 1.43 × 10⁻⁶, and m = 3. As tabulated in Table 3, the calculated well loss and radial flow components reveal a systematic augmentation of well loss percentage with escalating flow rates during pumping/recharge operations.
Table 3.
Results of well loss and runoff terms.
The comparative analysis presented in Figure 9 graphically illustrates the variance between simulated results and field measurements. At equivalent flow rates, pumping-induced drawdown demonstrates remarkable asymmetry compared to recharge-caused water table recovery, exhibiting a maximum differential of 51.19 m. Notably, well loss constitutes the principal source of drawdown prediction inaccuracies, particularly during recharge operations, thereby requiring careful isolation of wellbore head loss effects during parameter determination [56]. The proposed approach provides both predictive capabilities for well loss estimation in mining/geothermal recharge projects and a quantitative framework for evaluating injection performance metrics.
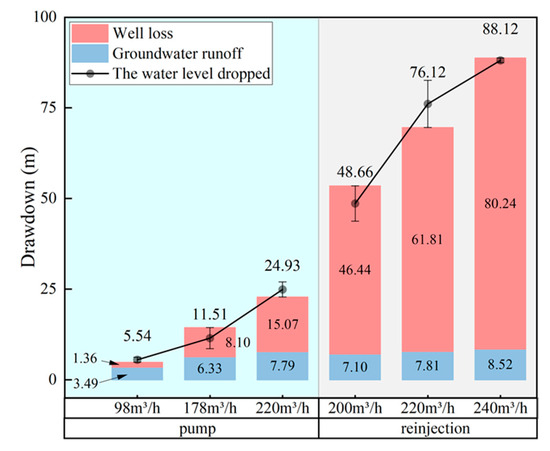
Figure 9.
Well loss comparison under pumping and reinjection conditions.
4.5. Limitations of On-Site Reinjection Tests and the Enlightenment of Future Work
In this study, combined with the on-site reinjection test, we found that deep geological conditions are complex, difficult to investigate, and have high drilling monitoring costs. And we can only work within a limited range approved by the government, which makes it impossible to obtain monitoring data as easily as with shallow groundwater. At the same time, relying solely on numerical simulations and empirical formulas for calculating the radius of influence in the reinjection process ignores the uncertainty of deep aquifer systems, and the actual process should be more complicated. This work is just a preliminary exploration of mine deep well recharge to obtain the dynamic response of the Ordovician limestone aquifer at the test site. However, there are still many key scientific issues that are worth solving. for example, dynamic real-time monitoring and early warning technology for the re-injection process, environmental impact assessment and risk prevention and control of groundwater re-injection in deep mines, and impact assessment of safe mining of coal mines [30].
5. Conclusions
The mine water deep well reinjection approach entails substantially lower costs than alternative water treatment methods, offering considerable economic benefits. Taking the Ordovician limestone aquifer in North China’s mining region as a case study, this research examined aquifer level fluctuation patterns and storage capacity under various recharge scenarios, including intermittent and sustained reinjection operations. The findings indicate a deceleration in water table depth recovery rate proportional to recharge duration, highlighting the aquifer’s dual characteristics of rapid recharge response and efficient recovery capacity as an underground reservoir. Under long-term reinjection conditions, the groundwater level showed three stages of change (rapid rise, slow rise, and stability), proving that the reservoir has good water storage capacity. The actual data of the monitoring hole, theoretical values of empirical formulas, and numerical simulation results all prove that the groundwater impact radius is very small and the refilling project is safe and feasible.
Differential analysis of drawdown patterns from variable-flow pumping and reinjection tests substantiates the occurrence of the well loss phenomenon during artificial recharge operations. Well loss emerges as the predominant error component in practical drawdown assessments, representing a major portion of measured deviations. The well loss coefficient demonstrates a positive correlation with discharge/injection rates. At identical flow rates, the well loss coefficient during recharge operations exceeds pumping conditions by a factor of 4.06, offering essential guidance for proper hydrogeological parameter determination.
The field reinjection test can lay a foundation for the implementation of the recharge project of treating mine water at low cost. Reasonable reinjection flow and later operation intermittent periods in the study area were obtained. It can provide a reference value for eliminating well loss and correctly calculating hydrogeological parameters in the process of mine water or geothermal recharge. In summary, this research will provide guidance for the implementation of subsequent mine water reinjection projects.
Author Contributions
Conceptualization, J.F., W.C., and Q.L.; methodology, W.C., Q.L., and G.C.; data curation, W.C. and Q.L.; software, G.C.; project administration, J.F., X.T., J.S., and Z.X.; formal analysis, W.C. and Q.L.; funding acquisition, J.F., X.T., and Z.X.; investigation, W.C., H.C., F.Z., and Q.L.; supervision, Z.X.; resources, J.F., X.T., and Z.X.; visualization, W.C., Q.L., and G.C.; writing—original draft, W.C.; writing—review and editing, W.C., Q.L., Z.X., and G.C. All authors have read and agreed to the published version of the manuscript.
Funding
This research was funded by the Shandong Energy Group Co., Ltd. Key, Science and Technology Project (Grant SNKJ2022A02-R18), Engineering Research Center of Zero-carbon and Negative-carbon Technology in Depth of Mining Areas, Ministry of Education (China University of Mining and Technology), Ministry of Education (No. 2023-4), and the Key Research and Development Program of Shandong Province in 2023 (Grant 2023CXGC010904).
Data Availability Statement
The original contributions presented in the study are included in the article; further inquiries can be directed to the corresponding author.
Conflicts of Interest
Authors Jianguo Fan and Jiancai Sui were employed by the company Shandong Energy Group Co., Ltd. The authors declare that this study received funding from the Shandong Energy Group Co., Ltd. Key, Science and Technology Project (Grant SNKJ2022A02-R18). The remaining authors declare that the research was conducted in the absence of any commercial or financial relationships that could be construed as a potential conflict of interest.
References
- Ma, D.; Duan, H.; Zhang, J.; Bai, H. A state-of-the-art review on rock seepage mechanism of water inrush disaster in coal mines. Int. J. Coal Sci. Technol. 2022, 9, 50. [Google Scholar] [CrossRef]
- Ma, S.; Qiu, H.; Yang, D.; Wang, J.; Zhu, Y.; Tang, B.; Sun, K.; Cao, M. Surface multi-hazard effect of underground coal mining. Landslides 2023, 20, 39–52. [Google Scholar] [CrossRef]
- Masindi, V.; Foteinis, S.; Renforth, P.; Ndiritu, J.; Maree, J.P.; Tekere, M.; Chatzisymeon, E. Challenges and avenues for acid mine drainage treatment, beneficiation, and valorisation in circular economy: A review. Ecol. Eng. 2022, 183, 106740. [Google Scholar] [CrossRef]
- Qu, S.; Duan, L.; Shi, Z.; Liang, X.; Lv, S.; Wang, G.; Liu, T.; Yu, R. Hydrochemical assessments and driving forces of groundwater quality and potential health risks of sulfate in a coalfield, northern Ordos Basin, China. Sci. Total Environ. 2022, 835, 155519. [Google Scholar] [CrossRef]
- Li, X.; Chen, G.; Wei, W.; Tan, X.; Xu, Z.; Zhang, L.; Zhang, F.; Liu, Q.; Sun, Y. Feasibility of Injecting Pretreated Mine Water into a Deep Ordovician Aquifer in the Lilou Coal Mine, China. Mine Water Environ. 2024, 43, 168–182. [Google Scholar] [CrossRef]
- Zhang, C.; Bai, Q.; Han, P. A review of water rock interaction in underground coal mining: Problems and analysis. Bull. Eng. Geol. Environ. 2023, 82, 157. [Google Scholar] [CrossRef]
- Cao, Z.; Gu, Q.; Huang, Z.; Fu, J. Risk assessment of fault water inrush during deep mining. Int. J. Min. Sci. Technol. 2022, 32, 423–434. [Google Scholar] [CrossRef]
- Wang, W.; Li, Z.; Du, F.; Cao, Z.; Li, G. Study of Roof Water Inrush Control Technology and Water Resources Utilization During Coal Mining in a Karst Area. Mine Water Environ. 2023, 42, 546–559. [Google Scholar] [CrossRef]
- Zhang, J.; Chen, L.; Hou, X.; Li, J.; Ren, X.; Lin, M.; Zhang, M.; Wang, Y.; Tian, Y. Effects of multi-factors on the spatiotemporal variations of deep confined groundwater in coal mining regions, North China. Sci. Total Environ. 2022, 823, 153741. [Google Scholar] [CrossRef]
- Black, K.J.; Weber, J.G. Treating abandoned mine drainage can protect streams cost effectively and benefit vulnerable communities. Commun. Earth Environ. 2024, 5, 508. [Google Scholar] [CrossRef]
- Chen, G.; Xu, Z.; Sun, Y.; Sui, W.; Li, X.; Zhao, X.; Liu, Q. Minewater deep transfer and storage. J. Clean. Prod. 2022, 332, 129848. [Google Scholar] [CrossRef]
- Chen, G.; Sun, Y.; Xu, Z.; Li, X. Hydrogeological feasibility of mine water deep geological storage in Baotashan coarse sandstone: A case study in Ordos Basin. Deep. Undergr. Sci. Eng. 2022, 1, 148–164. [Google Scholar] [CrossRef]
- Clark, J.E.; Bonura, D.K.; Van Voorhees, R.F. An overview of injection well history in the United States of America. In Developments in Water Science; Tsang, C., Apps, J.A., Eds.; Elsevier: Amsterdam, The Netherlands, 2005. [Google Scholar]
- Myers, T. Groundwater management and coal bed methane development in the Powder River Basin of Montana. J. Hydrol. 2009, 368, 178–193. [Google Scholar] [CrossRef]
- Baquero, J.C.; Osé De Los Reyes, M.; Custodio, E.; Scheiber, L.; Vázquez-Suñé, E. Groundwater Management in Mining: The Drainage and Reinjection System in Cobre Las Cruces, Spain. Mod. Environ. Sci. Eng. 2016, 2, 631–646. [Google Scholar] [CrossRef]
- Cienfuegos, P.; Loredo, J. Coalbed methane resources assessment in Asturias (Spain). Int. J. Coal Geol. 2010, 83, 366–376. [Google Scholar] [CrossRef]
- Faunt, C.C.; Sneed, M.; Traum, J.; Brandt, J.T. Water availability and land subsidence in the Central Valley, California, USA. Hydrogeol. J. 2016, 24, 675–684. [Google Scholar] [CrossRef]
- Hebig, K.H.; Ito, N.; Tecklenburg, J.; Machida, I.; Marui, A.; Scheytt, T. Use of single-well push–pull tracer tests to simulate a dynamic saltwater–freshwater interface. Environ. Earth Sci. 2016, 75, 281. [Google Scholar] [CrossRef]
- Khoshnevis, N.; Khosrokhavar, R.; Nick, H.M.; Bruhn, D.F.; Bruining, H. Injection of disposal water from a geothermal reservoir into a gas reservoir. J. Pet. Sci. Eng. 2019, 178, 616–628. [Google Scholar] [CrossRef]
- Liu, X.; Wang, Y.; Li, S.; Jiang, X.; Fu, W. The influence of reinjection and hydrogeological parameters on thermal energy storage in brine aquifer. Appl. Energ. 2020, 278, 115685. [Google Scholar] [CrossRef]
- Mon, M.T.; Tansuchat, R.; Yamaka, W. CCUS Technology and Carbon Emissions: Evidence from the United States. Energies 2024, 17, 1748. [Google Scholar] [CrossRef]
- Wang, X.; Luo, Z.; Li, Z.; Zhao, Q.; Dai, J. The impact of groundwater recharge on land subsidence: A case study from the Cangzhou test area, Hebei Province, China. Hydrogeol. J. 2023, 31, 813–825. [Google Scholar] [CrossRef]
- Shi, X.; Jiang, S.; Xu, H.; Jiang, F.; He, Z.; Wu, J. The effects of artificial recharge of groundwater on controlling land subsidence and its influence on groundwater quality and aquifer energy storage in Shanghai, China. Environ. Earth Sci. 2016, 75, 195. [Google Scholar] [CrossRef]
- Stephens, M.J.; Chang, W.; Shimabukuro, D.H.; Howery, A.; Sowers, T.A.; Gillespie, J.M. A joint Gaussian process model of geochemistry, geophysics, and temperature for groundwater TDS in the San Ardo Oil Field, California, USA. J. Hydrol. 2025, 661, 133540. [Google Scholar] [CrossRef]
- Schilling, O.; Sheldon, H.A.; Reid, L.B.; Corbel, S. Hydrothermal models of the Perth metropolitan area, Western Australia: Implications for geothermal energy. Hydrogeol. J. 2013, 21, 605–621. [Google Scholar] [CrossRef]
- Li, Y.; Yao, Q.; Xia, Z.; Xu, Q.; Yu, L.; Liu, Z.; Chen, S. Stability Evaluation of the Artificial Dam in Underground Reservoirs Under Storage and Drainage Cycles: A method based on concrete performance and case study. In Rock Mechanics and Rock Engineering; Springer: Berlin/Heidelberg, Germany, 2025. [Google Scholar] [CrossRef]
- Liao, Y.; Wang, T.; Ren, Z.; Wang, D.; Sun, W.; Sun, P.; Li, J.; Zou, X. Multi-well combined solution mining for salt cavern energy storages and its displacement optimization. Energy 2024, 288, 129792. [Google Scholar] [CrossRef]
- Sun, Y.; Liu, Z.; Li, Q.; Deng, S.; Guo, W. Controlling groundwater infiltration by gas flooding for oil shale in situ pyrolysis exploitation. J. Pet. Sci. Eng. 2019, 179, 444–454. [Google Scholar] [CrossRef]
- Wang, L.; He, H.; Wu, H.; Luo, Z.; Gao, Z.; Peng, J.; Yin, H.; Lei, H. Experimental Study of Injection–Production Coupling Technique for Enhanced Oil Recovery in Mature Water Flooding Reservoirs. Processes 2025, 13, 457. [Google Scholar] [CrossRef]
- Sloan, S.; Cook, P.G.; Wallis, I. Managed Aquifer Recharge in Mining: A Review. Groundwater 2023, 61, 305–317. [Google Scholar] [CrossRef]
- Shi, M.; Yang, Y.; Wang, D.; Wu, Y.; Zhang, X.; Lu, Y. Iron clogging mechanism around injection wells during groundwater recharge in shallow iron-rich aquifer: Insight from spatiotemporal evolution. Water Res. 2025, 283, 123778. [Google Scholar] [CrossRef]
- Song, W.; Liu, X.; Zheng, T.; Yang, J. A review of recharge and clogging in sandstone aquifer. Geothermics 2020, 87, 101857. [Google Scholar] [CrossRef]
- Ma, Z.Y.; Yan, H.; Zhou, X.; Hou, C. Impact of Carbonate Scaling on the Efficiency of Used Geothermal Water Reinjection from Low-Middle Temperature Geothermal Fluid in Xianyang Porous Geothermal Field, NW China. Adv. Mater. Res. 2012, 614–615, 307–310. [Google Scholar] [CrossRef]
- Houben, G.J.; Kenrick, M.A.P. Step-drawdown tests: Linear and nonlinear head loss components. Hydrogeol. J. 2022, 30, 1315–1326. [Google Scholar] [CrossRef]
- Kawecki, M.W. Meaningful Interpretation of Step-Drawdown Tests. Groundwater 1995, 33, 23–32. [Google Scholar] [CrossRef]
- Groeschke, M.; Bosch, K.; Aboubacar, S.D.; Kroemer, L.; Koeniger, P.; Vassolo, S. Groundwater monitoring in challenging environments: An argument for the construction of observation wells based on data from Niamey, Niger. Hydrogeol. J. 2024, 32, 1817–1831. [Google Scholar] [CrossRef]
- Gebru, H.; Gebreyohannes, T.; Hagos, E.; Perilli, N. Hydrogeological Assessment and Steady-State Groundwater Flow Modeling for Groundwater Management in the Golina River Sub-Basin, Northern Ethiopia, Using MODFLOW 6. Water 2025, 17, 949. [Google Scholar] [CrossRef]
- Kumar, V.; Chaplot, B.; Omar, P.J.; Mishra, S.; Md. Azamathulla, H. Experimental study on infiltration pattern: Opportunities for sustainable management in the Northern region of India. Water Sci. Technol. 2021, 84, 2675–2685. [Google Scholar] [CrossRef]
- Schiavo, M. Numerical impact of variable volumes of Monte Carlo simulations of heterogeneous conductivity fields in groundwater flow models. J. Hydrol. 2024, 634, 131072. [Google Scholar] [CrossRef]
- Bianchi Janetti, E.; Riva, M.; Guadagnini, A. Natural springs protection and probabilistic risk assessment under uncertain conditions. Sci. Total Environ. 2021, 751, 141430. [Google Scholar] [CrossRef]
- Tian, F.; Zhang, J.; Zheng, W.; Zhou, H.; Ma, Q.; Shen, C.; Ma, Q.; Lan, M.; Liu, Y. “Geology-geophysics-data mining” integration to enhance the identification of deep fault-controlled paleokarst reservoirs in the Tarim Basin. Mar. Pet. Geol. 2023, 158, 106498. [Google Scholar] [CrossRef]
- Chen, W.; Liu, P.; Luo, Y.; Li, B.; Peng, J.; Jin, X. Behavior of Sb and As in the hydrogeochemistry of adjacent karst underground river systems and the responses of such systems to mining activities. Sci. Total Environ. 2023, 857, 159411. [Google Scholar] [CrossRef]
- Netzer, L.; Russo, D.; Nachshon, U.; Moreno, Z.; Ben Hur, M.; Katzir, R.; Livshitz, Y.; Kurtzman, D. Drywell Infiltration Performance: Tests, Monitoring, Simple, and Detailed Models. Water Resour. Res. 2025, 61, e2024WR037524. [Google Scholar] [CrossRef]
- Hussain, J.; Zafar, T.; Fu, X.; Ali, N.; Chen, J.; Frontalini, F.; Hussain, J.; Lina, X.; Kontakiotis, G.; Koumoutsakou, O. Petrological controls on the engineering properties of carbonate aggregates through a machine learning approach. Sci. Rep. 2024, 14, 31948. [Google Scholar] [CrossRef]
- Schiavo, M. Entropy, fractality, and thermodynamics of groundwater pathways. J. Hydrol. 2023, 623, 129824. [Google Scholar] [CrossRef]
- Zehe, E.; Loritz, R.; Edery, Y.; Berkowitz, B. Preferential pathways for fluid and solutes in heterogeneous groundwater systems: Self-organization, entropy, work. Hydrol. Earth Syst. Sci. 2021, 25, 5337–5353. [Google Scholar] [CrossRef]
- Zeng, C.; Zheng, G.; Xue, X. Responses of deep soil layers to combined recharge in a leaky aquifer. Eng. Geol. 2019, 260, 105263. [Google Scholar] [CrossRef]
- Desens, A.; Houben, G.J. Jenseits von Sichardt—Empirische Formeln zur Bestimmung der Absenkreichweite eines Brunnens und ein Verbesserungsvorschlag. Grundwasser 2022, 27, 131–141. [Google Scholar] [CrossRef]
- Tiwari, S.; Yadav, B.K.; Polemio, M. Performance Evaluation of Aquifer Storage and Recovery (ASR) System in Saline Groundwater Regions: Impact of Operational Factors and Well Design. J. Hydrol. Eng. 2022, 27, 4022032. [Google Scholar] [CrossRef]
- Sahin, A.U. A new parameter estimation procedure for pumping test analysis using a radial basis function collocation method. Environ. Earth Sci. 2016, 75, 200. [Google Scholar] [CrossRef]
- Raymond, J.; Therrien, R.; Gosselin, L.; Lefebvre, R. A Review of Thermal Response Test Analysis Using Pumping Test Concepts. Groundwater 2011, 49, 932–945. [Google Scholar] [CrossRef]
- Kurtulus, B.; Yaylım, T.N.; Avşar, O.; Kulac, H.F.; Razack, M. The Well Efficiency Criteria Revisited—Development of a General Well Efficiency Criteria (GWEC) Based on Rorabaugh’s Model. Water 2019, 11, 1784. [Google Scholar] [CrossRef]
- Neuman, S.P. Analysis of Pumping Test Data from Anisotropic Unconfined Aquifers Considering Delayed Gravity Response. Water Resour. Res. 1975, 11, 329–342. [Google Scholar] [CrossRef]
- Çiftçi, E.; Sahin, A.U. Interpretation of Step-Drawdown Tests with the Differential Evolution Approach. J. Hydrol. Eng. 2022, 27, 4022013. [Google Scholar] [CrossRef]
- El-Meselhy, A.; Abdelhalim, A.; Nabawy, B.S. Geospatial analysis in groundwater resources management as a tool for reclamation areas of New Valley (El-Oweinat), Egypt. J. Afr. Earth Sci. 2020, 162, 103720. [Google Scholar] [CrossRef]
- Shinde, S.P.; Barai, V.N.; Al-Ansari, N.; Gavit, B.K.; Kadam, S.A.; Atre, A.A.; Bansod, R.D.; Elbeltagi, A. Characterization of basaltic rock aquifer parameters using hydraulic parameters, Theis’s method and aquifer test software in the hard rock area of Buchakewadi watershed Maharashtra, India. Appl. Water Sci. 2022, 12, 206. [Google Scholar] [CrossRef]
Disclaimer/Publisher’s Note: The statements, opinions and data contained in all publications are solely those of the individual author(s) and contributor(s) and not of MDPI and/or the editor(s). MDPI and/or the editor(s) disclaim responsibility for any injury to people or property resulting from any ideas, methods, instructions or products referred to in the content. |
© 2025 by the authors. Licensee MDPI, Basel, Switzerland. This article is an open access article distributed under the terms and conditions of the Creative Commons Attribution (CC BY) license (https://creativecommons.org/licenses/by/4.0/).