Article

Correction of Pump Characteristic Curves Integrating Representative Operating Condition Recognition and Affine Transformation

1
College of Hydrology and Water Resources, Hohai University, Nanjing 210098, China
2
Jiangsu Province Hydrology and Water Resources Investigation Bureau, Nanjing 210029, China
*
Author to whom correspondence should be addressed.
Water 2025, 17(13), 1977; https://doi.org/10.3390/w17131977
Submission received: 26 May 2025 / Revised: 26 June 2025 / Accepted: 26 June 2025 / Published: 30 June 2025

Abstract

To address the need for intelligent scheduling and model integration under spatiotemporal variability and uncertainty in water systems, this study proposes a hybrid correction method for pump characteristic curves that integrates data-driven techniques with an affine modeling framework. Steady-state data are extracted through adaptive filtering and statistical testing, and representative operating conditions are identified via unsupervised clustering. An affine transformation is then applied to the factory-provided characteristic equation, followed by parameter optimization using the clustered dataset. Using the Hongze Pump Station along the eastern route of the South-to-North Water Diversion Project as a case study, the method reduced the mean blade angle prediction error from 1.73° to 0.51°, and the efficiency prediction error from 7.32% to 1.30%. The results demonstrate improved model accuracy under real-world conditions and highlight the method’s potential to support more robust and adaptive hydrodynamic scheduling models, contributing to the advancement of sustainable and smart water resource management.

1. Introduction

Pumps, as the core components of pumping stations, are widely employed in agricultural and industrial production, as well as in flood control and associated disaster mitigation by reducing waterlogging and urban inundation risks [1,2,3]. At present, it remains infeasible to accurately predict pump performance purely through theoretical approaches, such as Bernoulli-based energy analysis, CFD simulations, and momentum equations, as these methods often rely on ideal conditions and fail to fully reflect pump behavior under complex working situations. Instead, performance curves [4,5] derived from model tests and conversions are commonly used to assess pump characteristics. A set of performance curves plotted in the same Cartesian coordinate system, corresponding to a single pump operating under different rotational speeds or blade angles, is referred to as the comprehensive characteristic curve of the pump unit [6]. These curves serve as critical references for pump selection [7], operational condition adjustment [8], and optimization of pumping station operations [9,10,11,12]. However, due to influences such as installation conditions [13] and equipment degradation [14], discrepancies often exist between the factory-provided curves and the actual performance in the field. These discrepancies hinder accurate estimation of in situ pump performance and compromise the reliability of operation strategies developed based on such curves. Therefore, developing cost-effective methods for correcting the comprehensive characteristic curves of pump units has become a key research focus.
To address pump performance degradation and characteristic curve variation over prolonged operation, Eaton [15] investigated the causes and rates of pump performance decline over time and emphasized the need for performance tracking, while also noting the practical challenges of doing so in field conditions. Wu Rujun et al. [16] used Fluent software to simulate how surface roughness influences the head and efficiency of mixed-flow pumps. Shen Xiaobo et al. [17] examined the impact of progressive blade wear on the performance of double-suction centrifugal pumps. Zhu Jiayu [18] preliminarily derived characteristic curve equations for worn impellers under ideal conditions based on head and power similarity ratios, noting that head–flow curves tend to shift downward while power–flow curves flatten in slope when impeller wear occurs.
Recent studies have increasingly focused on enhancing the reliability and adaptability of pump performance modeling under practical and uncertain operational conditions. Bing et al. [19] analyzed the influence of blade angle deviations on hydraulic performance using model tests and numerical simulations, enabling updates to characteristic curves under such deviations. Yan Jing et al. [20] transformed pump performance curves into suction device curves and introduced a composite correction factor, achieving satisfactory fitting results under common operating conditions. Mao Jiansheng et al. [21] utilized actual operating data, applying a static “exponential decay” correction method and a dynamic training method using an extension neural network, yielding accurate flow–power performance curves. Le Marre et al. [22] experimentally investigated the performance prediction of pumps-as-turbines (PATs), emphasizing the importance of accurate characteristic curve fitting for energy recovery in water systems. Feng et al. [23] conducted a numerical analysis of transient processes in centrifugal pumps during power failures, revealing critical parameters affecting system safety and reliability. Meanwhile, Briceño-León et al. [24] evaluated the operational efficiency of fixed- and variable-speed pumps within water distribution networks, demonstrating that control strategies significantly influence energy consumption and hydraulic stability. Complementarily, Huang et al. [25] proposed a prediction approach for full characteristic curves of pumps, analyzing its impact on numerical simulations and underscoring the need for precise model calibration.
In recent years, the widespread deployment of Supervisory Control and Data Acquisition (SCADA) systems (an industrial platform enabling real-time monitoring and automatic data acquisition of hydraulic and electrical parameters) has significantly supported data-driven pump performance analysis and curve correction. Liu Yong [26] proposed a least-squares fitting method using SCADA-monitored data to derive characteristic curves for single pumps, though this method is limited to common local operating conditions and prone to overfitting. Zhu Jiayu [18] evaluated and updated characteristic curves using BP and RBF neural networks as well as a real-coded genetic algorithm, comparing their advantages and disadvantages. However, these methods used simulated data points from factory curves combined with white noise rather than real-time monitoring data. Elad Salomons et al. [27] proposed a method for reconstructing pump curves from partial SCADA data to obtain flow–efficiency curves for individual pumps, although it could not provide corresponding power or efficiency curves.
In response to enhance the intelligent management of pumping station operations and improve the scientific accuracy of scheduling, this study proposes a practical and reliable method for correcting pump comprehensive characteristic curves using real operational monitoring data. First, representative operational datasets are constructed through steady-state data filtering and clustering analysis. Then, affine transformation and parameter optimization are applied to the original factory curve equations to perform curve correction, enabling accurate performance computation across the feasible operational range. Finally, the method is applied to the Hongze Pump Station of the Eastern Route of the South-to-North Water Diversion Project for validation and case study analysis.

2. Methodology

2.1. Representative Data Selection

With the rapid advancement of big data and artificial intelligence technologies, data-driven methods for system modeling, process identification, and state prediction have seen widespread adoption across engineering applications [28]. In the context of pumping stations, the measured values of parameters such as flow rate, head, and input power are inevitably contaminated by substantial noise and non-steady-state data due to variations in monitoring strategies, operational environments, and control logic [29]. These non-steady-state data fail to accurately represent the underlying system characteristics, thereby compromising the reliability of pump characteristic curve correction. Consequently, it is necessary to perform effective steady-state filtering of monitoring data [30] and to construct a representative operating dataset through clustering analysis of the filtered steady-state data.

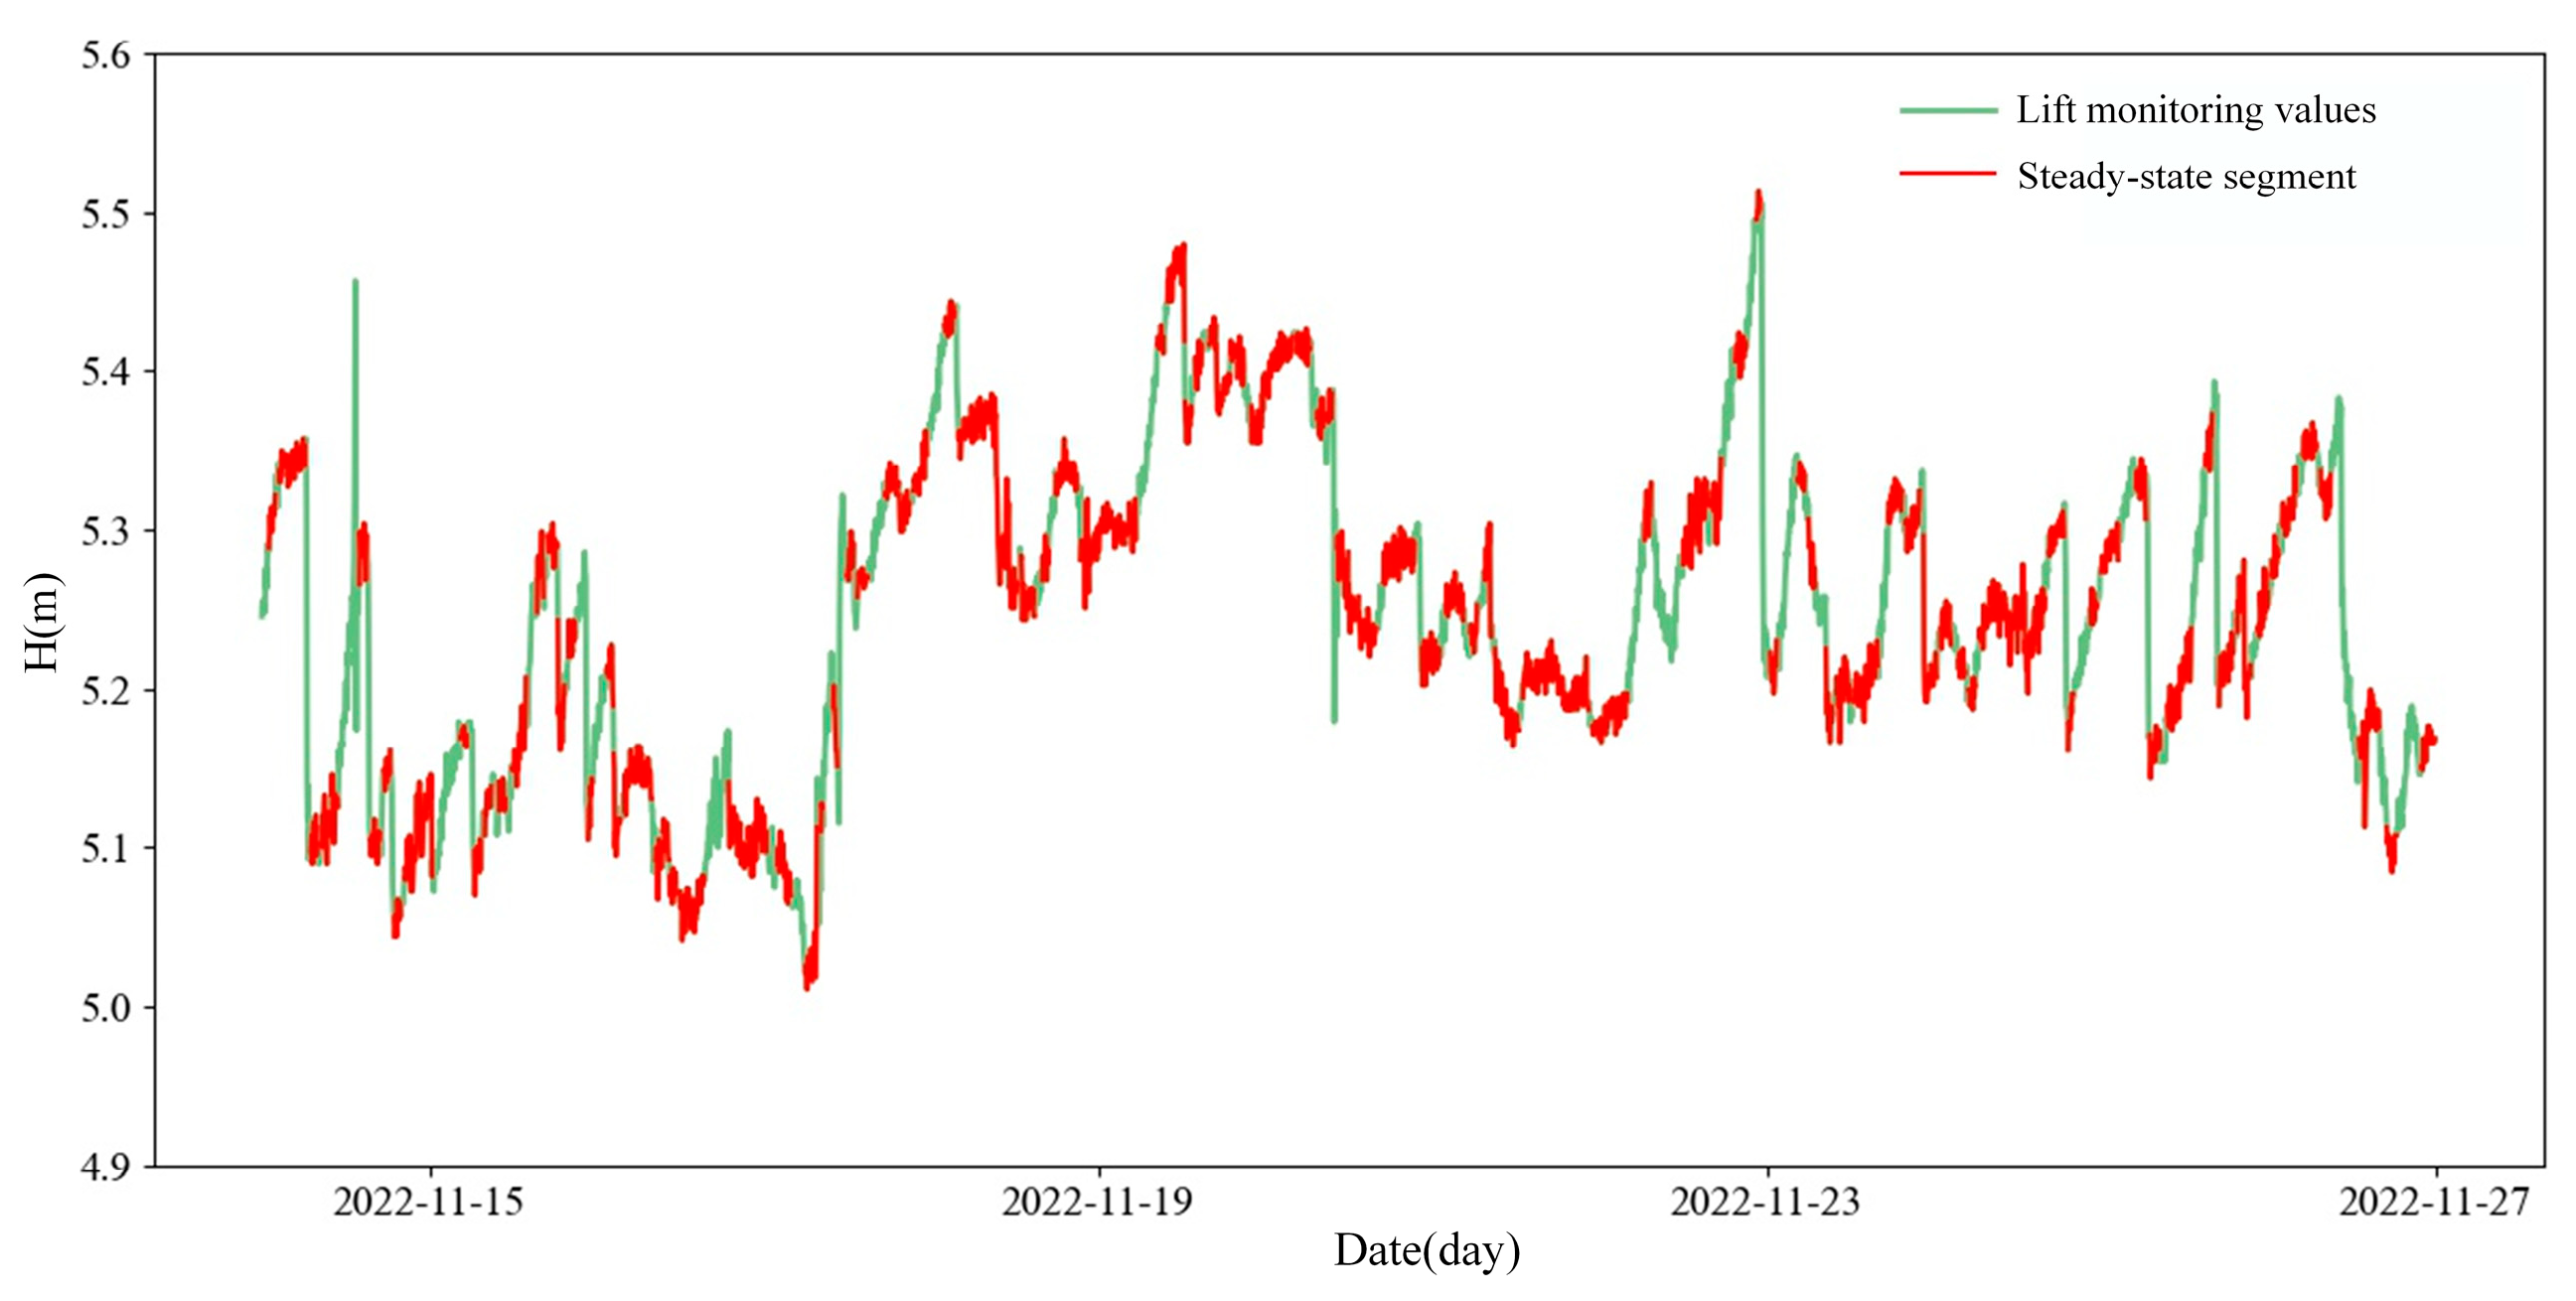
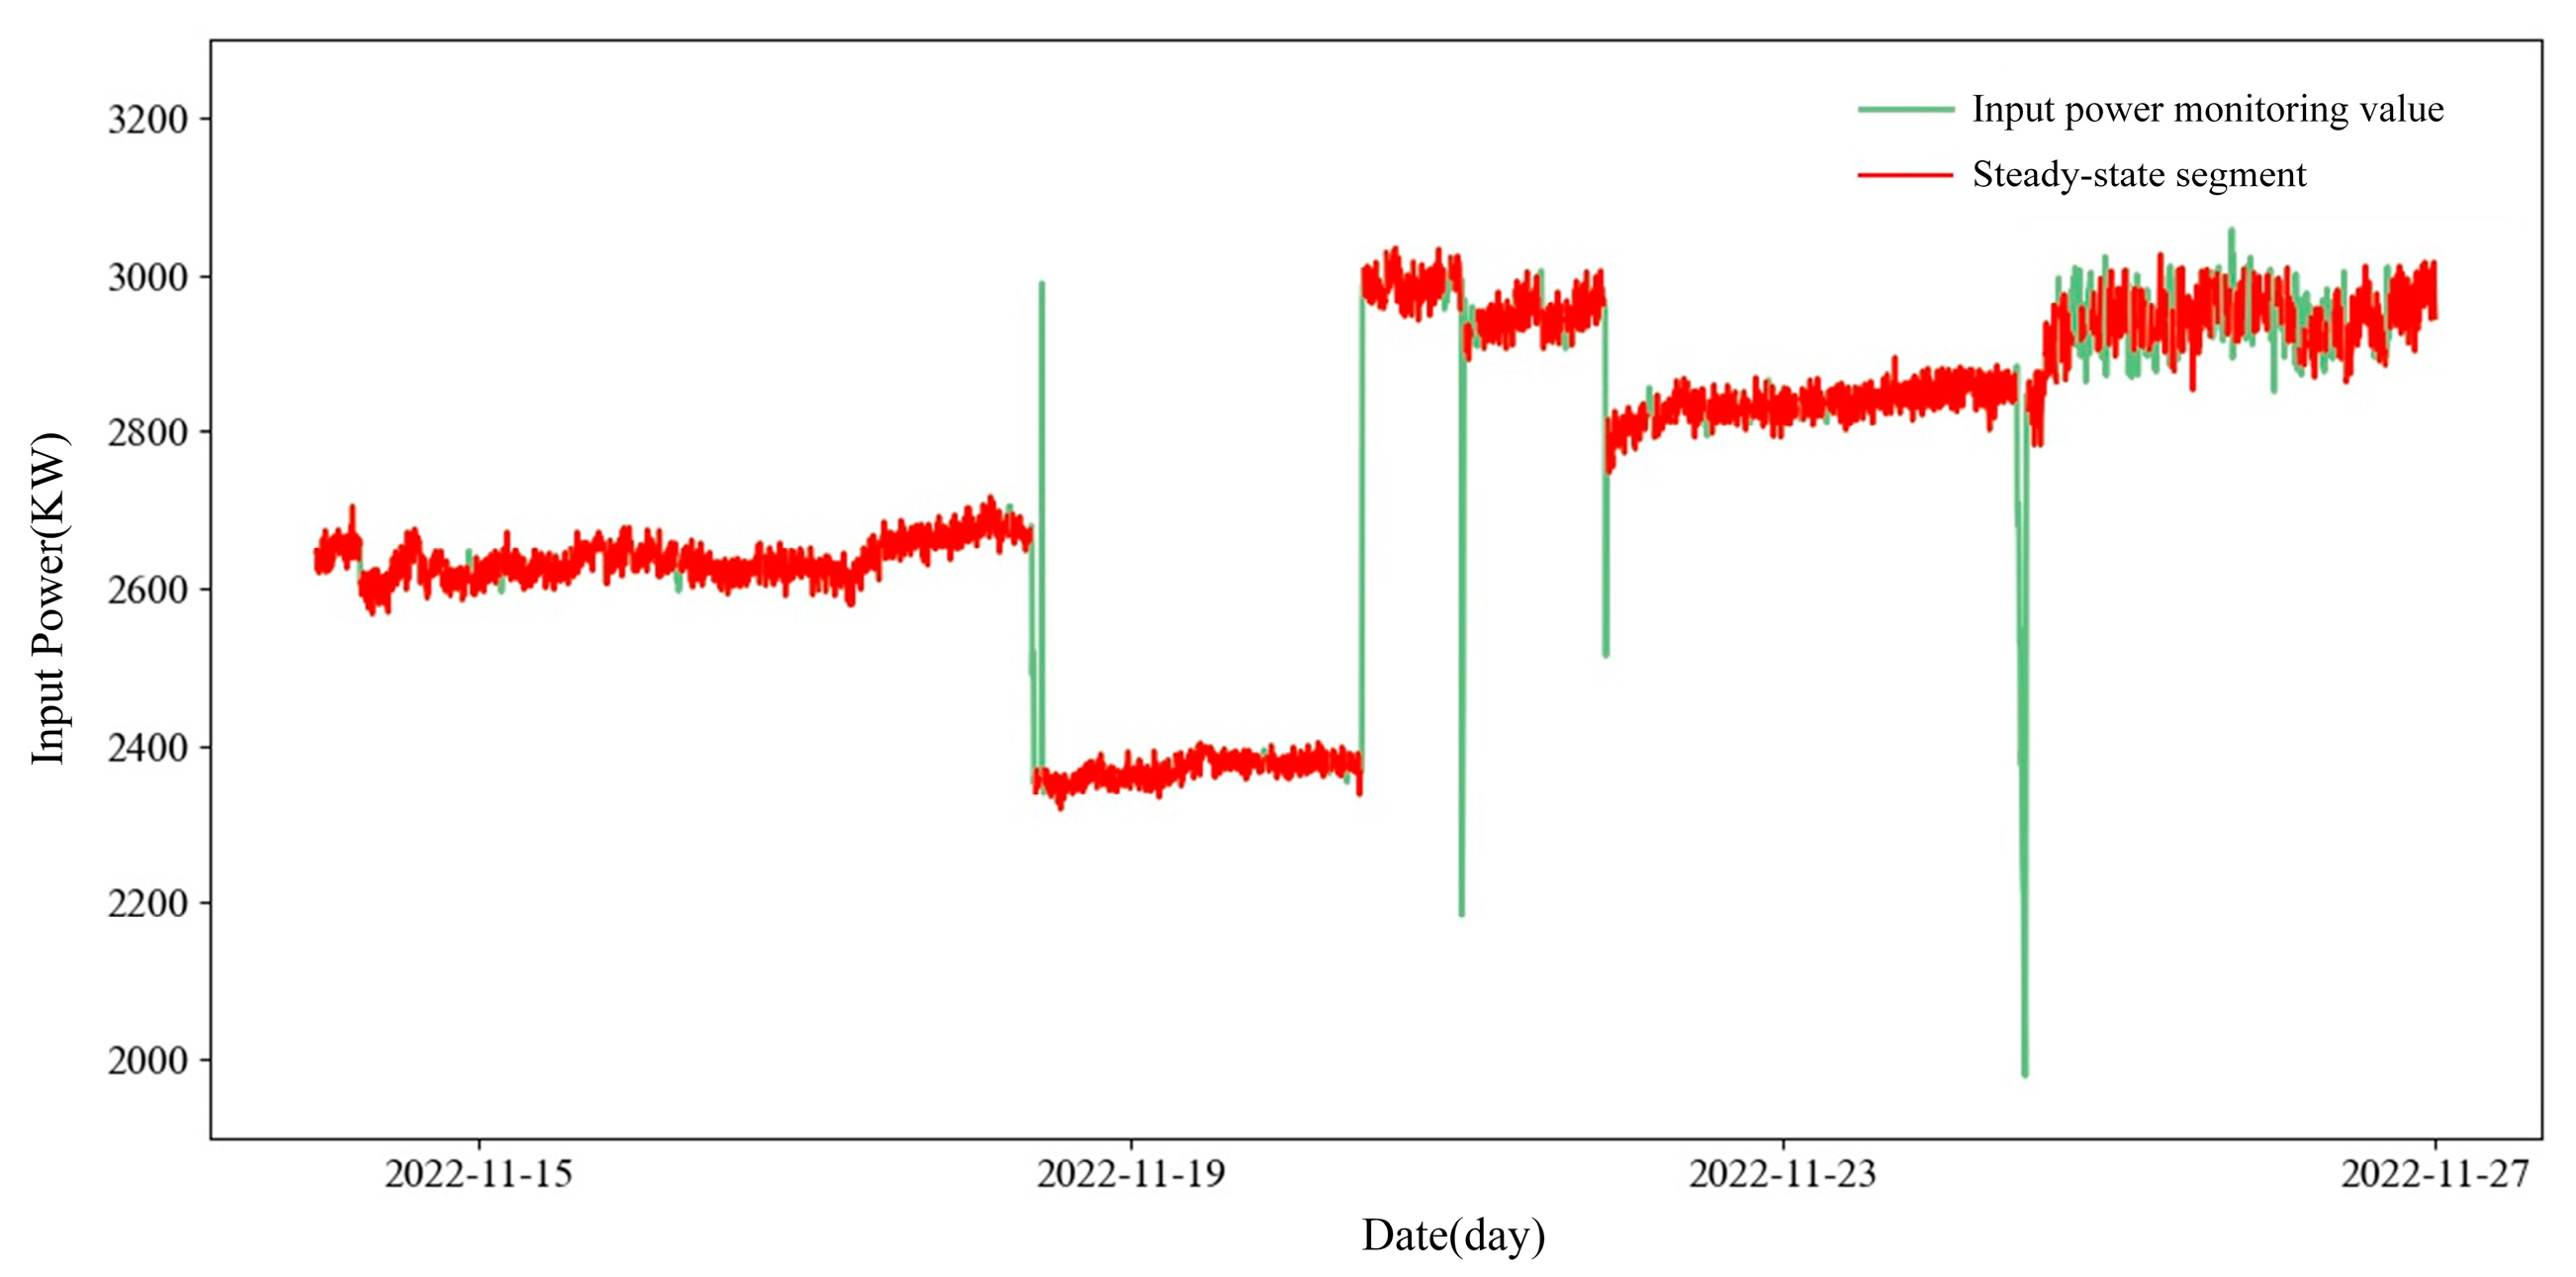
2.1.1. Steady-State Operating Condition Filtering

The process of identifying steady-state operating conditions comprises two stages. First, noise is removed from the raw data to mitigate its interference with the steady-state filtering and improve the robustness of the selection process. Second, a composite statistical testing method is employed, in which a T-distribution statistic is constructed from the mean and variance of adjacent time windows, and steady-state conditions are judged based on confidence intervals.
(1)
Noise Reduction of Raw Data:
Given the cumulative effects of sensor inaccuracies and environmental noise in pump monitoring systems, it is reasonable to assume that measurement errors in flow rate (Q), water level (H), and input power (P) tend toward a Gaussian distribution under long-term and large-sample observations. In this study, an adaptive Kalman filter is employed to denoise the monitoring data. Based on the classical Kalman filter, the algorithm updates the state estimation in real time using the observation residual and dynamically adjusts the observation noise covariance according to the innovation magnitude. Compared to simple low-pass filtering, this approach provides superior denoising performance while preserving essential signal variation characteristics.
(2)
Composite Statistical Test:
This test determines whether the system is in a steady state by comparing local statistical features (mean and variance) of adjacent time series segments. The procedure is as follows:
The monitoring data are segmented into intervals, each containing N data points. The mean μ i and variance σ i 2 of each segment are calculated. A T-distribution test statistic is then constructed based on the means and variances of two adjacent intervals, as expressed in Equation (1).
T stat = μ i μ i + 1 σ i 2 N + σ i + 1 2 N
Referring to the T-distribution table and a predefined significance level α (typically 0.01 or 0.05), the critical value T α is obtained, and the confidence interval is defined as T α , T α . If the test statistic T stat falls within this interval, the system is considered to be in a steady state; otherwise, it is classified as dynamic.
If the monitoring data pass both the noise reduction (step 1) and the statistical testing (step 2), the corresponding segment is deemed to represent steady-state behavior. When all monitored indicators meet the steady-state criteria, the associated operating condition is defined as a steady-state operating point [31]. Finally, the dataset of steady-state operating points is compiled to form the steady-state data pool.

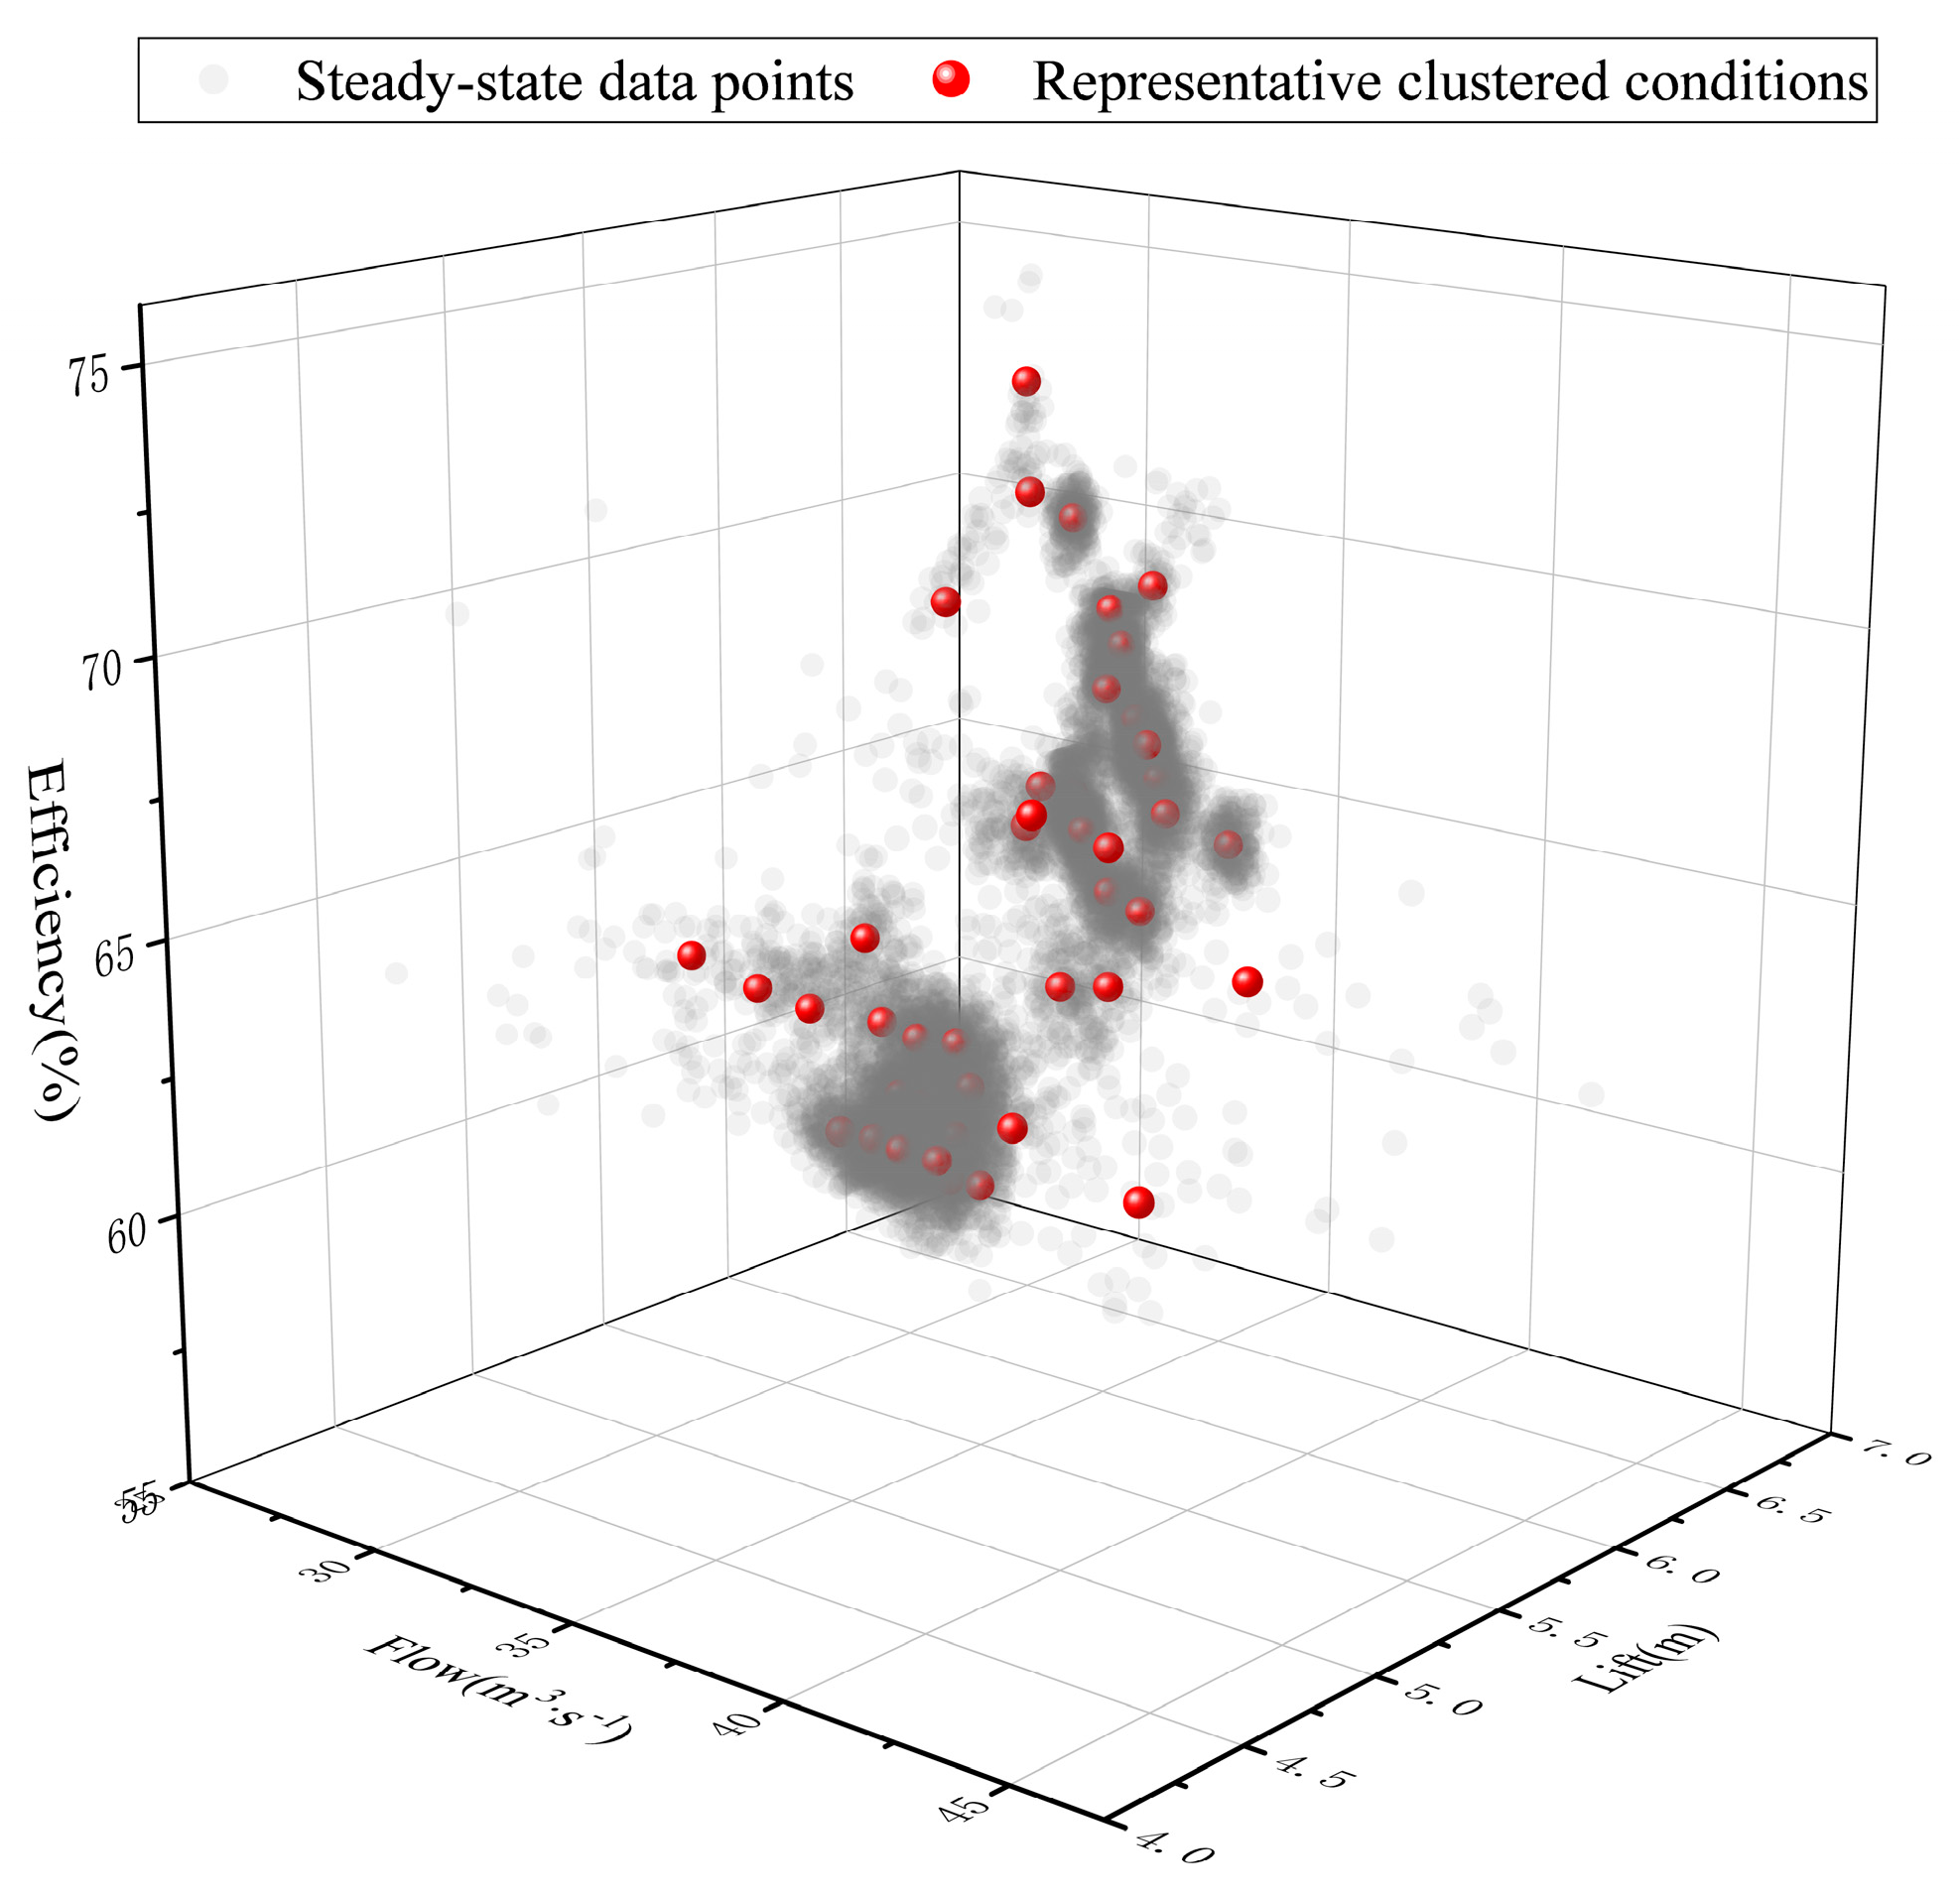
2.1.2. Construction of Representative Operating Datasets

During the operation of a pump station, the measured data from the same pump unit often exhibit high similarity and density within certain commonly encountered operating regions. In contrast, some operating points appear sparsely distributed or are underrepresented. During the characteristic curve correction process, this imbalance may lead to overfitting or underfitting phenomena, ultimately compromising correction performance. Therefore, this study employs the K-means clustering algorithm to classify steady-state data and construct representative datasets.
(1)
To eliminate the impact of differing value magnitudes across features and ensure clustering performance, the steady-state data are first standardized. The standardization process is defined by Equation (2):
z i j = x i j μ j σ j
where x i j is the value of the j th feature in the i th sample, n is the total number of samples, μ j is the mean of the j th feature, and σ j is its standard deviation. z i j represents the standardized value of the j th feature in the i th sample.
(2)
The standardized steady-state data are then clustered using the K-means algorithm according to the following steps:
Initialize K cluster centers: Randomly select k initial points from the steady-state data as the initial cluster centroids.
Assign samples to the nearest cluster: Compute the distance between each sample and the cluster centers, and assign each sample to the nearest cluster center.
Update cluster centers: For each cluster, recalculate its centroid based on the newly assigned members.
Repeat iteration: Repeat steps ② and ③ until convergence criteria are met.
Cluster validity check: Evaluate the clustering performance using silhouette coefficients. If the clustering result is unsatisfactory, repeat steps ①–④.
Through this iterative procedure, a set of representative and well-separated cluster centers can be obtained. These centers are ultimately used as the representative operating dataset, which provides reliable support for the subsequent performance curve correction process, especially for generating consistent and physically meaningful training data under varying operating conditions.

2.1.3. Modification of Characteristic Curve Equations

Given a fixed blade outlet angle, the relationship between flow rate and head can be expressed as follows:
H = p 0 + p 1 × Q + p 2 × Q 2
where p 0 , p 1 , and p 2 are constants, Q is the flow rate (m3/s), and H is the head (m).
Over extended periods of operation, mixed-flow pumps inevitably experience gradual wear in their flow-passage components, leading to performance degradation. Among various forms of wear, the change in impeller diameter is a dominant factor affecting the hydraulic performance of pumps, resulting in deviations in the head–flow (H-Q) characteristic curve. According to similarity theory (assuming both geometric and dynamic similarity), the modified characteristic equation due to wear can be expressed as:
H = p 0 + p 1 × D D × Q + p 2 × D D 2 × Q 2
where D denotes the impeller diameter before wear (mm), and D denotes the impeller diameter after wear (mm). Letting k = D D , the equation simplifies to:
H = p 0 + p 1 × k × Q + p 2 × k 2 × Q 2
As wear progresses and the degree of erosion increases, the value of k continues to decrease, resulting in a consistent decline in pump head.
In practical applications, impeller wear leads to reduced impeller diameter, increased clearance gaps, and greater surface roughness—conditions that deviate from the assumptions of geometric and dynamic similarity. Consequently, the original H-Q relationship no longer holds. The cumulative effect of these changes manifests as degraded overall pump performance, typically characterized by a downward shift in the head–flow curve, reduced efficiency, and increased power consumption.
Extensive experimental studies, both domestic and international, have shown that wear-induced degradation of mixed-flow pumps leads to a gradual deterioration in hydraulic characteristics. In mild wear scenarios, the overall trend of the characteristic curve remains consistent despite localized deviations and curve distortion near specific operating points, indicating that the original mathematical form of the characteristic equation is still generally preserved.
As illustrated in Figure 1, the measured flow–head values at multiple blade angles for Pump Unit #3 exhibit noticeable deviations from the characteristic curves calculated using factory-provided data. These deviations indicate that, even at typical operating points, discrepancies exist between the monitored and theoretical characteristic curves.
For pump equipment, the flow–head–angle characteristic surface must be numerically reconstructed to correct such deviations. A polynomial regression approach based on a quadratic multivariate function is employed to describe the “flow–head–blade angle” relationship. The coefficients of this model are determined via physical model testing and curve fitting. The equation is expressed as:
θ = k 00 + k 10 × Q + k 01 × H + k 20 × Q 2 + k 11 × Q H + k 02 × H 2
where Q is the flow rate (m3/s), H is the head (m), θ is the blade angle (°), and k 00 , k 10 , k 01 , k 20 , k 11 , and k 02 are empirical coefficients.
Let ( Q p ,   H p ,   θ p ) denote an arbitrary representative operating point. To enable three-dimensional affine transformation of the flow–head–angle surface and correct the deviations, a rotation factor r and translation coefficients a , b , and c are introduced. The transformed variables and associated parameter relationships are defined as follows:
θ p = k 00 + k 10 × Q + k 01 × H + k 20 × Q 2 + k 11 × Q × H + k 02 × H 2 Q = c o s r × Q p s i n r × H p + a H = s i n r × Q p + c o s r × H p + b θ = θ p + c
Q , H , and θ are defined as the corrected flow rate, head, and blade angle, respectively, after applying the affine transformation.
The objective function is formulated to minimize the sum of absolute differences between the transformed blade angle values θ and the measured angles θ p across all representative operating points. The optimization principle is expressed as follows:
m i n i = 1 n θ θ p
Once the optimal values of a, b, and c are obtained, the corrected flow–head–blade angle surface can be reconstructed via inverse transformation.
To construct the flow–head–efficiency characteristic surface of a pump unit, a numerical representation of the characteristic data is also required.
A third-order polynomial regression model is commonly employed to describe the “flow–head–efficiency” relationship, as expressed in Equation (9):
η p u m p = p 00 + p 10 × Q + p 01 × H + p 20 × Q 2 + p 11 × Q × H + p 02 × H 2 + p 30 × Q 3 + p 21 × Q 2 × H + p 12 × Q × H 2 + p 03 × H 3
where Q is the flow rate (m3/s), H is the head (m), and η p u m p is the pump efficiency (%). The coefficients p i j re regression constants.
Because measured efficiency usually refers to the overall efficiency of the water extraction system, the characteristic curve of the pump device must be corrected based on system-level efficiency.
Taking into account motor and transmission efficiency, the conversion from pump efficiency to water extraction efficiency is computed as:
η s e t = η p u m p × η t r a n s × η motor
where η s e t is the overall water extraction efficiency, η p u m p is the pump efficiency, η trans is the transmission efficiency (approximated as 1), and η motor is the motor efficiency.
The selected motor is a vertical synchronous motor manufactured by Hongze, and its efficiency characteristic curve [32] is shown in Figure 2.
The parameter β represents the load factor, and η denotes motor efficiency. Under typical operating conditions, the rated motor efficiency is taken as 94.5%.
Let ( Q p ,   H p ,   η s e t ) denote any representative operating point. To correct the three-dimensional surface, rotational and translational coefficients ϕ , m , n , l are introduced to transform the original flow rate, head, and efficiency. The parameter relationships are then defined by Equation (11).
η s e t = p 00 + p 10 × Q + p 01 × H + + p 03 × H 3 Q = c o s ϕ × Q p s i n ϕ × H p + m H = s i n ϕ × Q p + c o s ϕ × H p + n η s e t = η s e t + l
Q , H , and η s e t represent the corrected flow rate, head, and water extraction efficiency after affine transformation.
The objective function aims to minimize the sum of the absolute differences between the transformed efficiency values η and the measured values η s e t across all representative operating points. The optimization principle is given in Equation (12):
m i n i = 1 n η s e t η s e t
Once the optimal values of ϕ , m , n , and l are determined, the corrected flow–head–extraction efficiency characteristic surface can be reconstructed via inverse transformation.

3. Results and Discussion

3.1. Study Area

The Hongze Pump Station is located on the shores of Hongze Lake in Hongze District, Huai’an City, Jiangsu Province. It serves as the third-tier pumping station of the Jiangsu section of the South-to-North Water Diversion Project, with its primary function being to lift water into Hongze Lake. The station is designed for a flow capacity of 150 m3/s, with a maximum lifting head of 6.5 m, a minimum head of 3.8 m, and a design head of 6.00 m. It is equipped with five pumping units, each employing a 3150HQ37.5-6 vertical fully-adjustable mixed-flow pump. Its pump house cross-sectional view is shown in Figure 3, and the characteristic curves of the pumps are illustrated in Figure 4. The station’s total installed capacity is 17,500 kW, with each pump driven by a TL3550-48 vertical synchronous motor via a direct-drive transmission system.
Hongze Station also serves as a pilot project for the integration of domestically developed engineering monitoring hardware and software within the 14 pumping stations of the Jiangsu segment of the South-to-North Water Diversion Project. Each of the five main units is equipped with more than 40 types of sensors, providing comprehensive real-time monitoring of operational parameters such as head, flow rate, and input power.
As the South-to-North Water Diversion Project constitutes a vital “artery” of China’s national water network, there is an urgent need to enhance its intelligent regulation and control capabilities, especially under the current national agenda to advance the planning and construction of major water infrastructure projects [33,34,35]. Commissioned in 2013, the Hongze Pump Station has undertaken annual water transfer and drought relief tasks, resulting in a relatively long operational runtime. After prolonged service, some pump units have exhibited significant deviations in their characteristic curves compared to the factory-provided specifications. This has led to a strong reliance on operator experience for on-site dispatching decisions, posing a major challenge to the realization of intelligent pump station operation.
As a demonstration site for the digital twin system of the Jiangsu segment of the Eastern Route of the South-to-North Water Diversion Project, Hongze Station offers a well-established information infrastructure. This study aims to utilize its comprehensive monitoring capabilities to recalibrate and update the integrated characteristic curves of the pump units. Such corrections can provide more accurate support for operational decision-making and are of great significance for enhancing the intelligence level of pump station management.
Unit #3 of the Hongze Pump Station was selected as the research object. Since its overhaul in 2019, it has been frequently deployed in both annual water transfer and emergency drought relief operations, featuring extended operating hours and a relatively broad coverage of working conditions.

3.2. Results of Representative Data Selection

Taking Unit #3 as the research subject, the input power monitoring data were used as an example. An adaptive Kalman filtering algorithm was applied to denoise measurements. Subsequently, a composite statistical testing method was employed to preliminarily identify steady-state data intervals, as illustrated in Figure 5, Figure 6, Figure 7 and Figure 8. A given operating point is classified as a steady-state condition when all key indicators are determined to be in a steady state.
Two groups of features were selected for clustering: (1) flow rate, head, and efficiency, and (2) flow rate, head, and blade angle. For a monitoring dataset containing 24,861 records with a 5 min sampling interval, steady-state filtering yielded 17,455 steady-state operating points. Based on these, clustering analysis was performed to obtain a representative dataset consisting of 50 operating conditions. The clustering results using the feature group composed of flow rate, head, and efficiency are shown in Figure 9.
During most periods of stable pump station operation, the instantaneous flow rate exhibits relatively minor fluctuations. However, during transitions between pump unit operating conditions, the flow rate undergoes abrupt, short-term oscillations, posing challenges to steady-state identification. The Composite statistical testing method proves effective in identifying continuous steady-state intervals. For example, from 15 to 18 November and 21 to 27 November, the system operated stably, and composite statistical testing successfully detected densely distributed steady-state segments without significant false negatives or positives. In transitional periods (e.g., around 19 November), abrupt changes caused significant variance fluctuations, with T values exceeding the confidence interval, thereby allowing accurate identification of non-steady-state segments.
Head, which is determined by the difference in water levels between the inlet and outlet basins, is influenced by multiple factors, including upstream and downstream hydraulic conditions and the switching of pump units. As a result, the head variable exhibits significantly greater volatility than the flow rate, making its steady-state identification more challenging. Nevertheless, composite statistical testing demonstrates good applicability to head data. For instance, despite the presence of frequent high-frequency disturbances between 16 and 23 November, composite statistical testing was able to accurately extract relatively stable fragments within the fluctuating intervals.
The blade angle, as a structural adjustment parameter, typically changes in a stepwise fashion. Within each steady-state interval, the blade angle remains essentially constant. Composite statistical testing clearly delineates steady-state segments before and after each adjustment. For instance, in the transition periods on 14, 19, and 23 November, all non-steady-state segments were effectively excluded, indicating the method’s strong responsiveness to low-frequency abrupt changes.
The input power variable displays clear piecewise behavior during multiple operational transitions. Although short-term anomalies (e.g., sudden drops on 19 and 22 November) occasionally occur, composite statistical testing can still identify stable operation states during most time periods. The resulting steady-state segments are reasonably distributed and offer high coverage, further confirming the applicability of the method to high-dimensional, multi-source interference variables.
In summary, the steady-state identification method based on composite statistical testing can efficiently and accurately detect steady-state intervals within pump station monitoring data. The steady-state fragments identified for each key variable exhibit coherent temporal distribution and logical consistency, providing a reliable data foundation for the subsequent correction of pump characteristic curves.
Figure 9 illustrates the three-dimensional distribution of steady-state data points (in gray) and the representative clustered conditions (in red) obtained through clustering analysis. It is evident that the selected representative points effectively capture the main distribution patterns of the original steady-state data across flow rate, head, and efficiency dimensions. This clustering-based data reduction preserves structural diversity while minimizing redundancy, thereby improving modeling efficiency and ensuring reliable generalization. The resulting dataset provides a robust and representative basis for subsequent characteristic curve correction.

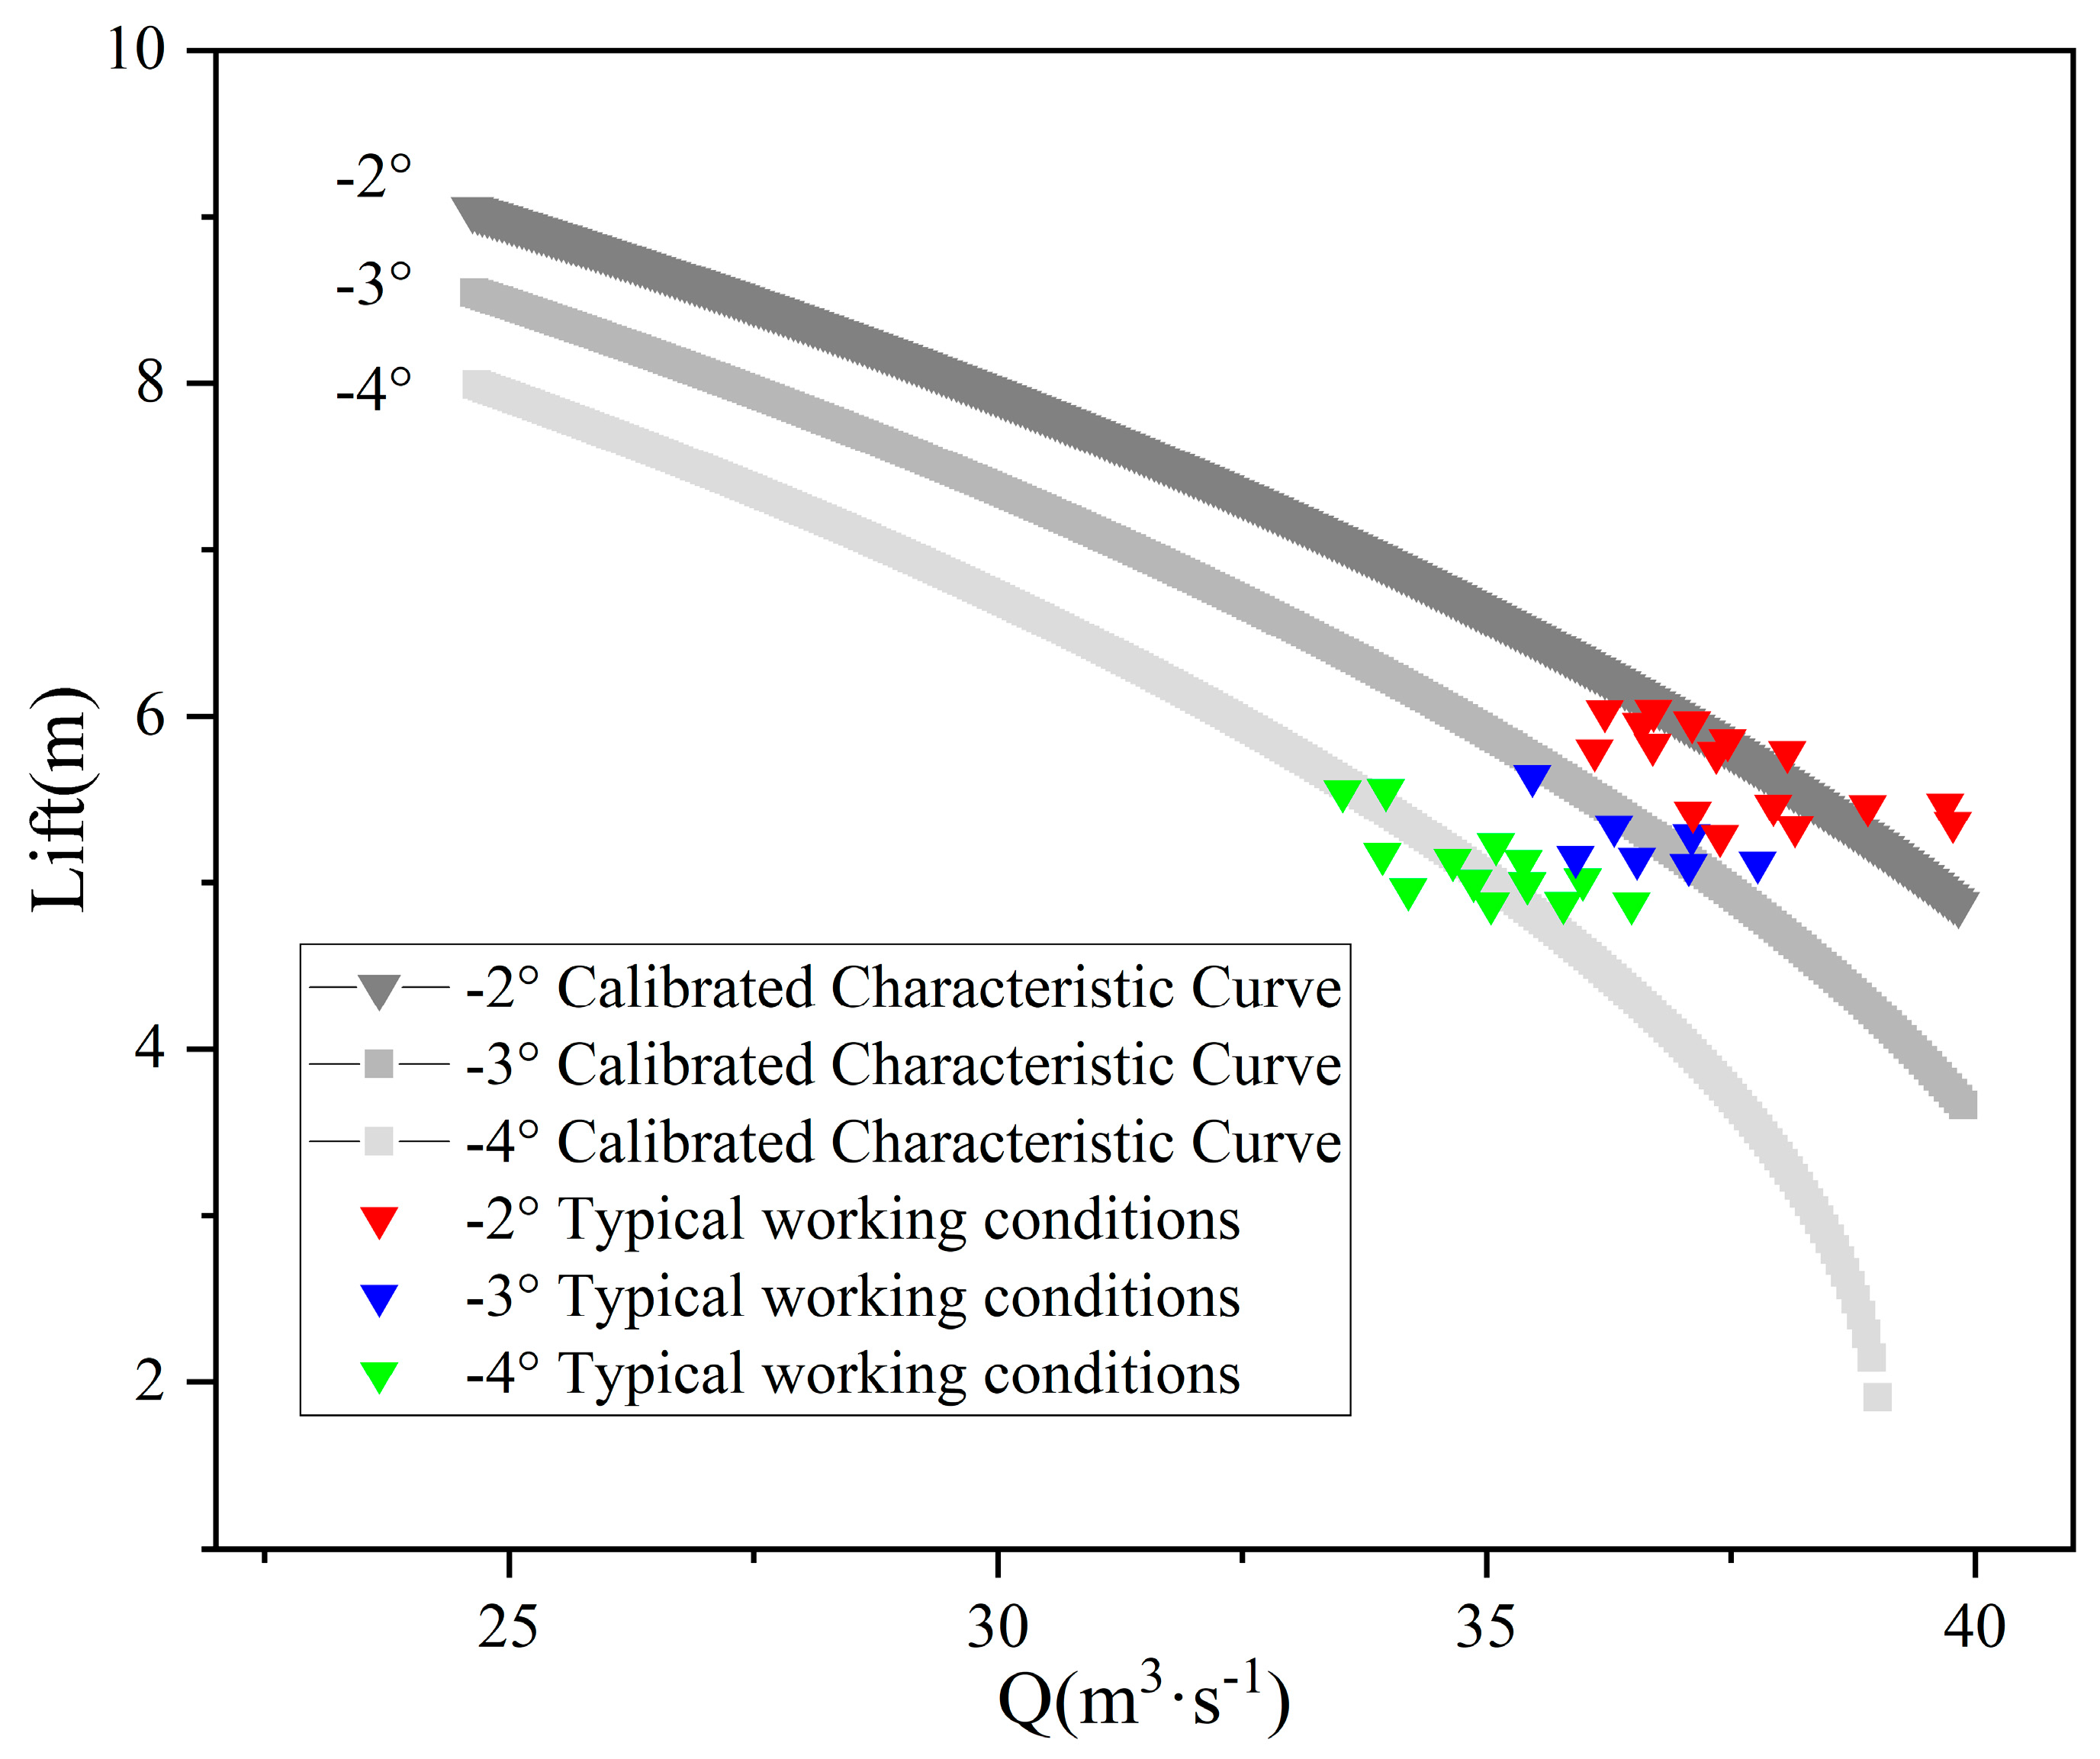
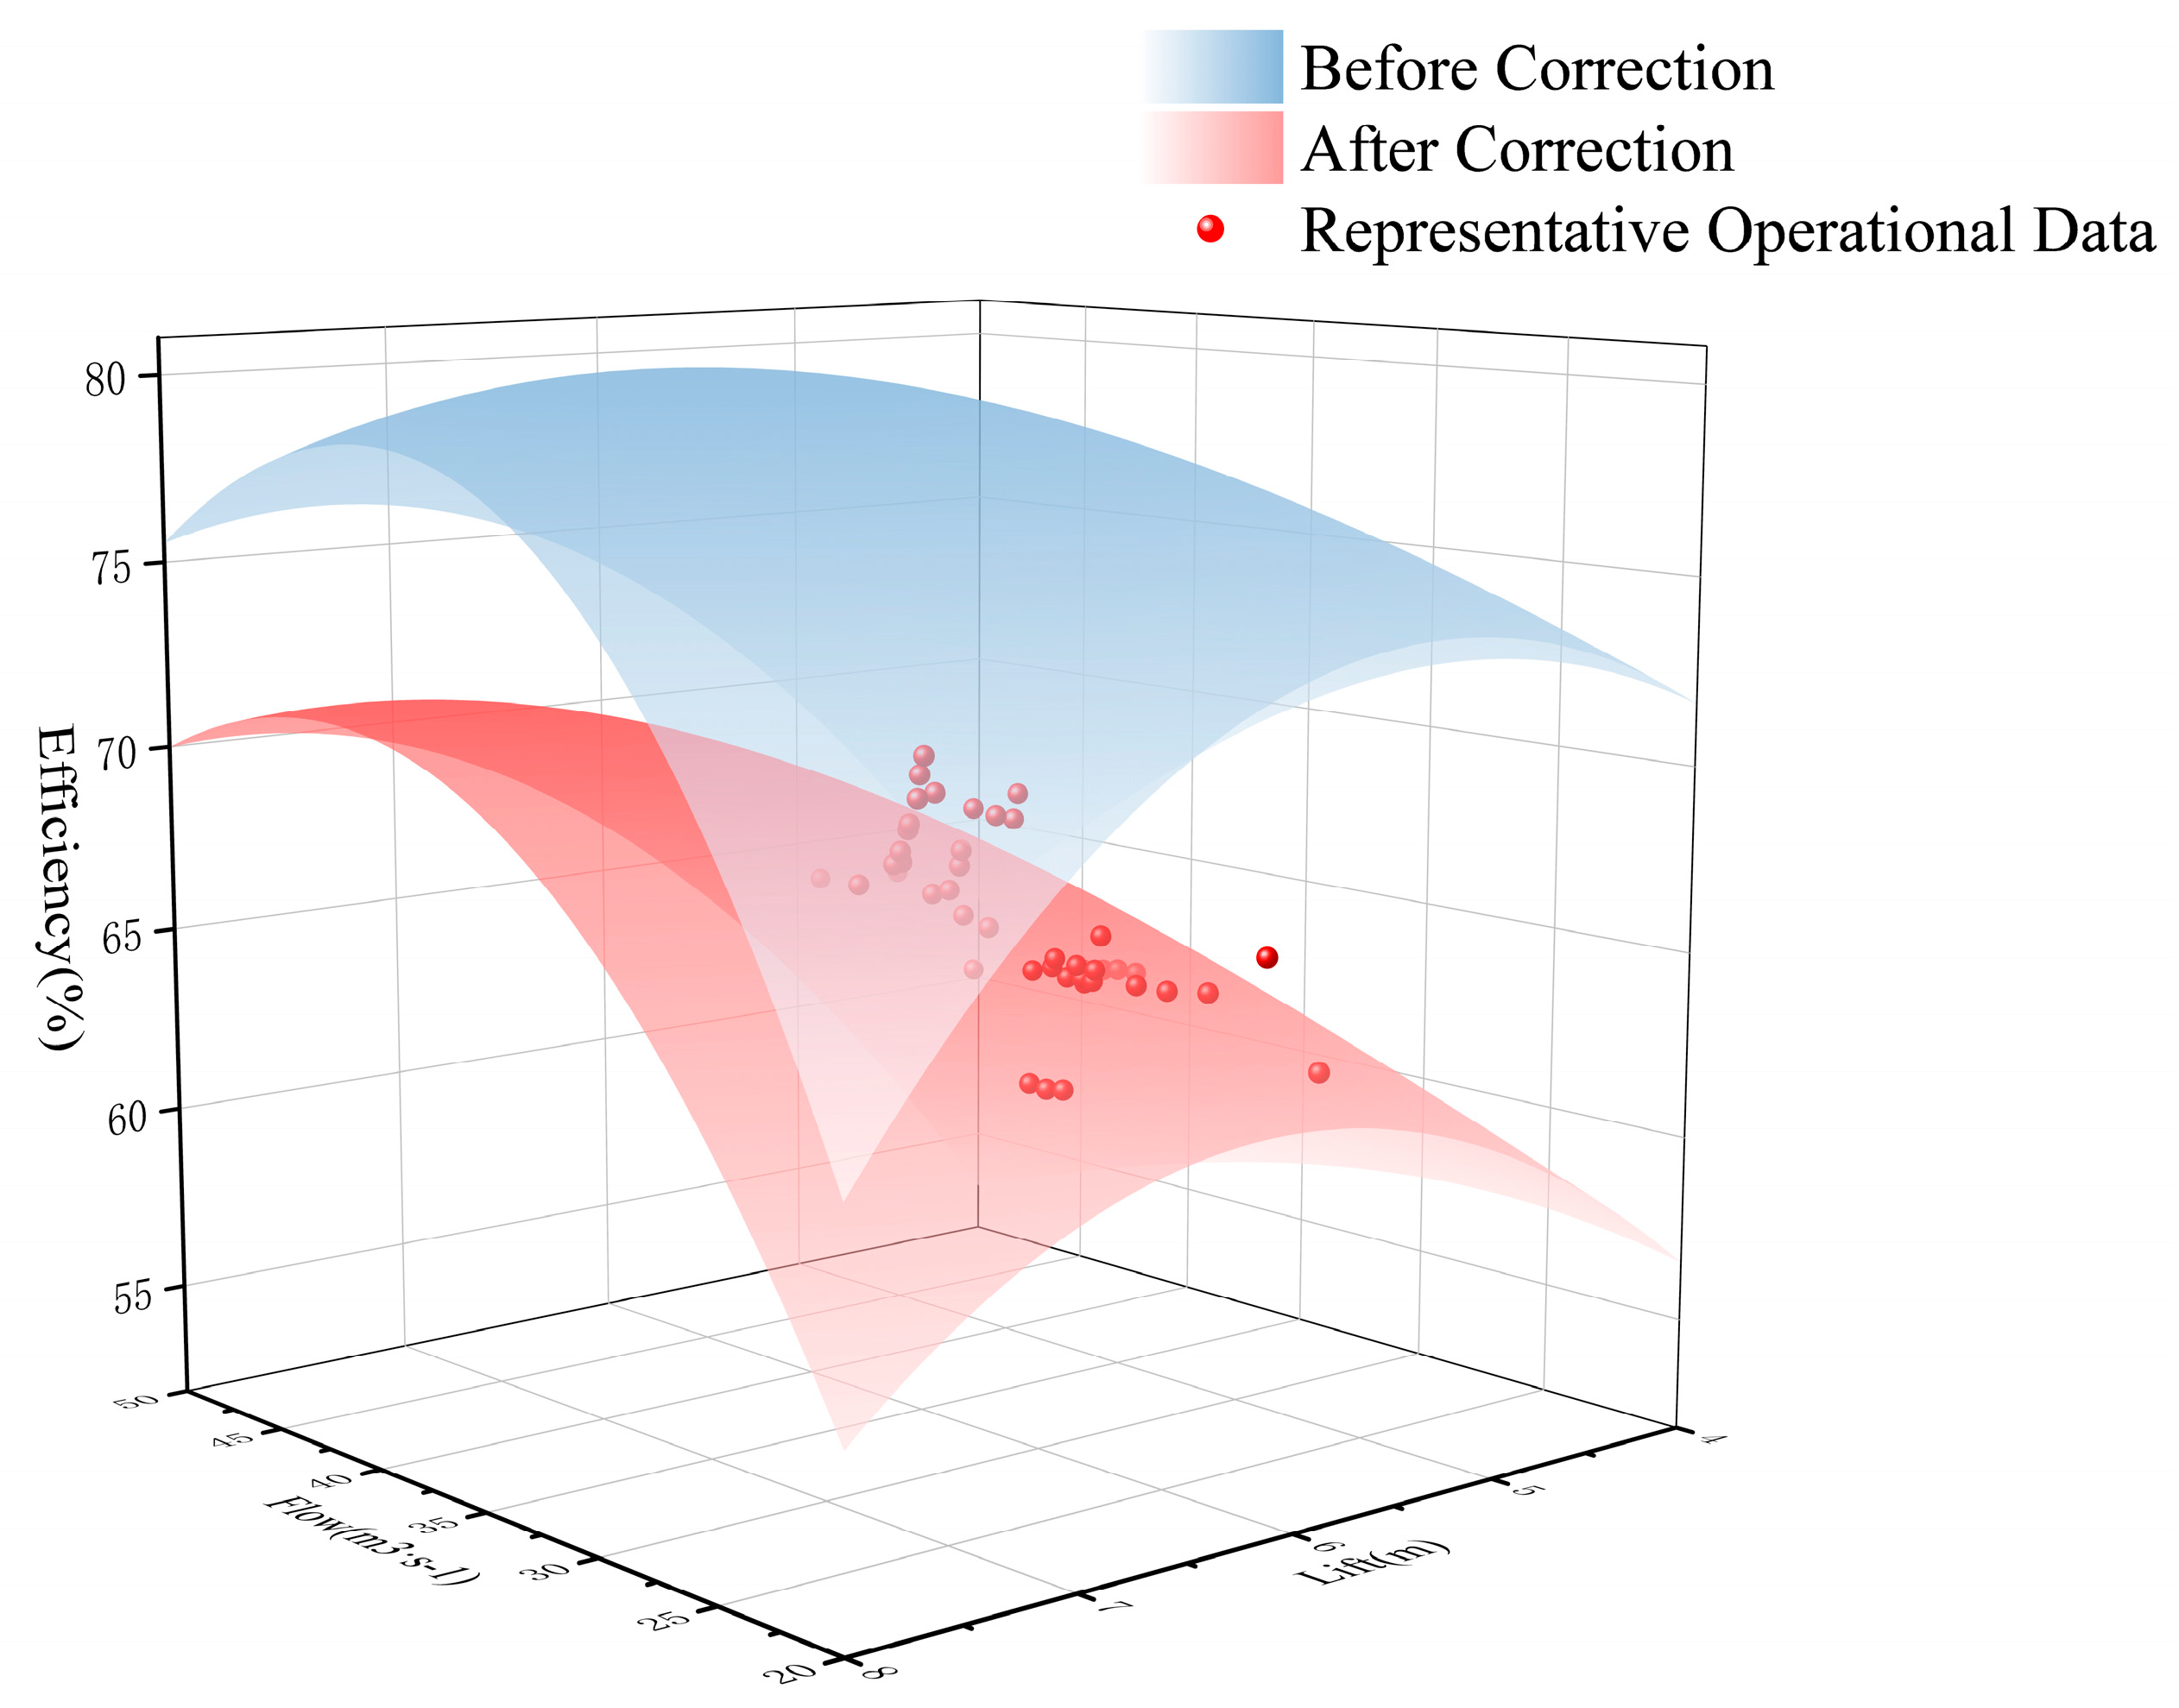
3.3. Results of Characteristic Curve Correction

Taking Unit #3 of the Hongze Pump Station along the Eastern Route of the South-to-North Water Diversion Project as a case study, the flow–head–blade angle characteristic surface was corrected using the method proposed in Section 2.1.3. As the correction involves a high-dimensional nonlinear optimization problem, a trust-region algorithm was employed to identify the optimal fitting parameters by minimizing the sum of squared residuals. The optimization results are presented in Table 1.
Following the correction, a test dataset was constructed, and the correction accuracy was evaluated using multiple error metrics, including mean absolute error (MAE), root mean square error (RMSE), and the coefficient of determination (R2). The evaluation results are shown in Table 2. A comparison of the flow–head characteristic curves before and after correction for Unit #3 is illustrated in Figure 10.
Figure 1 presents the factory-provided flow–head–blade angle characteristic curves alongside typical working condition data points under three blade angles (−2°, −3°, and −4°). It is evident that there exist notable discrepancies between the measured data points and the original characteristic curves, particularly in the mid-to-high flow range. The deviations vary across different blade angles, suggesting that the original characteristic model lacks sufficient accuracy in representing in situ performance under typical operational conditions.
In contrast, Figure 10 illustrates the calibrated characteristic curves after applying the affine transformation-based correction method. The adjusted curves demonstrate a significantly improved fit to the measured data points. Across all three blade angles, the data points are closely aligned with the corresponding calibrated curves, indicating a marked enhancement in curve fidelity and overall predictive capability.
Quantitative error evaluation results are summarized in Table 2. The mean absolute error (MAE) for the representative operating points was reduced from 1.89 m to 0.31 m after calibration. Similarly, the MAE for all working points decreased from 1.73 m to 0.51 m. The coefficient of determination (R2) improved dramatically from −2.83 to 0.67. These results collectively demonstrate that the calibrated characteristic curves not only enhance fitting accuracy but also exhibit stronger explanatory power for the hydraulic behavior of the pump unit.
In summary, the proposed correction method significantly reduces the deviation between the measured and predicted lift values, particularly in the operational range where deviations were previously substantial. The calibrated model achieves high consistency with observed data, thereby providing a reliable basis for subsequent performance analysis and intelligent operational decision-making.
Similarly, the flow–head–efficiency characteristic surface of Unit #3 was corrected by incorporating motor efficiency and modifying the original characteristic equation with appropriate parameters. The fitting parameters were determined using an optimization algorithm, and the optimization results are summarized in Table 3.
After completing the correction, a test dataset was established, and the correction performance was evaluated using multiple error metrics, including mean absolute error (MAE), root mean square error (RMSE), and the coefficient of determination (R2). The evaluation results are presented in Table 4. A comparison of the flow–head–efficiency characteristic surfaces before and after correction is shown in Figure 11.
Table 5 presents a comparison between the calculated and measured values under typical operating conditions. The results demonstrate that the corrected flow–head–efficiency characteristic surface of the pump unit achieves high predictive accuracy under representative working scenarios.
Table 4 shows the distribution of flow–head–efficiency characteristic surfaces before and after calibration, along with representative operational data. The factory-provided (pre-correction) surface in blue demonstrates notable deviations from the observed efficiency values, while the calibrated surface in red exhibits substantially improved agreement with measured data, reflecting enhanced fitting accuracy and overall model realism.
Table 5 summarizes the comparison of error metrics before and after correction. The mean absolute error (MAE) for representative working conditions decreased from 6.99% to 1.71%, and the overall MAE decreased from 7.32% to 1.30%. More significantly, the coefficient of determination (R2) improved dramatically from −5.78 to 0.76, indicating substantial enhancement in model reliability and predictive capability after calibration.
Figure 11 further validates the model’s performance under typical operating conditions. For 10 representative scenarios, the absolute errors between predicted and measured efficiencies mostly fall within 1%, with an average error of just 1.20%. This indicates that the calibrated model not only improves global accuracy but also maintains good generalization performance across varying operational regimes.
In conclusion, the proposed correction method for pump efficiency characteristic curves significantly enhances the model’s ability to represent real-world pump behavior, thereby providing a robust foundation for future optimization and energy performance assessment.

4. Conclusions

This study proposes a data-driven correction method for pump characteristic curves by integrating representative data selection, unsupervised clustering analysis, and affine transformation modeling. By identifying typical operating conditions and performing parameter optimization, the method effectively compensates for deviations in operational performance.
(1)
This study proposes a representative operating condition data selection method that combines adaptive Kalman filtering for noise reduction with a composite statistical testing approach to identify steady-state data. The resulting steady-state dataset is then clustered to construct a representative operating condition dataset, providing a reliable data foundation for subsequent pump characteristic curve correction.
(2)
A comprehensive pump characteristic curve correction method based on affine transformation is developed. By introducing appropriate parameters to modify the original characteristic equations, a three-dimensional affine transformation is implemented. Parameter optimization is subsequently performed based on the representative steady-state dataset. Validation results confirm that the corrected characteristic curves maintain high computational accuracy under typical operating conditions.
(3)
The proposed correction and optimization framework, though specifically developed and validated based on the mixed-flow pump system of the Hongze Pump Station, exhibits a degree of universality in its methodological design. In principle, the steady-state identification, characteristic curve correction via affine transformation, and multi-objective scheduling approach can be extended to other types of pumping units, including axial-flow and centrifugal pumps, provided that sufficient operational monitoring data are available. These pumps, despite structural differences, also exhibit performance deviations under long-term operation and deteriorating conditions. Therefore, the presented framework holds potential for broader application in performance calibration and energy-efficient dispatching across various pumping systems. Future work may focus on validating the generalizability of this method in multi-type or composite pump stations to further enhance its engineering value and practical applicability.

Author Contributions

Conceptualization, Y.C. and L.R.; methodology, Y.C.; formal analysis, Y.C., L.R., Y.Z., X.L. and C.W.; writing—original draft preparation, Y.C., Y.Z., C.W. and J.Z.; writing—review and editing, Y.C., L.R., Y.Z., X.L. and C.W. All authors have read and agreed to the published version of the manuscript.

Funding

This research received no external funding.

Data Availability Statement

All data and model codes for the study area used in this paper can be obtained by contacting the first author (chenyichao@hhu.edu.cn).

Conflicts of Interest

The authors declare no conflicts of interest.

References

  1. Fan, C.; Hou, J.; Li, X.; Song, G.; Yang, Y.; Liang, X.; Zhou, Q.; Imran, M.; Chen, G.; Wang, Z.; et al. Efficient urban flood control and drainage management framework based on digital twin technology and optimization scheduling algorithm. Water Res. 2025, 282, 123711. [Google Scholar] [CrossRef] [PubMed]
  2. Hunt, J.D.; Silva, C.V.; Fonseca, E.; de Freitas, M.A.V.; Brandão, R.; Wada, Y. Role of pumped hydro storage plants for flood control. J. Energy Storage 2024, 104, 114496. [Google Scholar] [CrossRef]
  3. Wu, Y.; She, D.; Xia, J.; Song, J.; Xiao, T.; Zhou, Y. The quantitative assessment of impact of pumping capacity and LID on urban flood susceptibility based on machine learning. J. Hydrol. 2023, 617, 129116. [Google Scholar] [CrossRef]
  4. Zuo, Z.; Tan, L.; Shi, W.; Chen, C.; Ye, J.; Francis, E.M. Transient Characteristic Analysis of Variable Frequency Speed Regulation of Axial Flow Pump. Sustainability 2022, 14, 11143. [Google Scholar] [CrossRef]
  5. Reeh, N.; Manthei, G.; Klar, P.J. Physical Modelling of the Set of Performance Curves for Radial Centrifugal Pumps to Determine the Flow Rate. Appl. Syst. Innov. 2023, 6, 111. [Google Scholar] [CrossRef]
  6. Wang, Z. Flow Channel Optimization and Hydraulic Characteristics on Pump Sets of Xifei Pumping Station. Master’s Thesis, Yangzhou University, Yangzhou, China, 2016. [Google Scholar] [CrossRef]
  7. Kandi, A.; Moghimi, M.; Tahani, M.; Derakhshan, S. Optimization of pump selection for running as turbine and performance analysis within the regulation schemes. J. Braz. Soc. Mech. Sci. Eng. 2023, 45, 560. [Google Scholar] [CrossRef]
  8. Zhang, J. Study on Optimal Operation Methods of Hongze pumping Station in Eastern First-Stage Route of South-to-North Water Transfer Project. Master’s Thesis, Yangzhou University, Yangzhou, China, 2014. [Google Scholar] [CrossRef]
  9. He, B.; Fu, Z.; Wu, W.; Zhao, Z.; Zhou, B.; Wang, G. Daily Optimal Scheduling of Pump Station Based on Improved Genetic Algorithm and Dynamic Programming. Water Resour. Power 2023, 41, 128–132. [Google Scholar] [CrossRef]
  10. Sun, T.; Wang, Z.; Zhu, B. Optimization study on the operation of No. Five Pumping Station in the Yanhuan Dingyang Yellow River irrigation district. J. China Inst. Water Resour. Hydropower Res. 2024, 22, 97–107. [Google Scholar] [CrossRef]
  11. Zhao, Y.; Zhang, P.; Pu, Y.; Lei, H.; Zheng, X. Unit Operation Combination and Flow Distribution Scheme of Water Pump Station System Based on Genetic Algorithm. Appl. Sci. 2023, 13, 11869. [Google Scholar] [CrossRef]
  12. Wang, S.; Cheng, J.; Zhu, B. Optimal operation of a single unit in a pumping station based on a combination of orthogonal experiment and 0-1 integer programming algorithm. Water Supply 2022, 22, 7905–7915. [Google Scholar] [CrossRef]
  13. Zhang, B.; Cheng, L.; Xu, C.; Wang, M. The Influence of Geometric Parameters of Pump Installation on the Hydraulic Performance of a Prefabricated Pumping Station. Energies 2021, 14, 1039. [Google Scholar] [CrossRef]
  14. Zhang, Z.; Zeng, Y.; Kusiak, A. Minimizing pump energy in a wastewater processing plant. Energy 2012, 47, 505–514. [Google Scholar] [CrossRef]
  15. Eaton, A.; D’Alessandro, F.; Ahmed, W.; Hassan, H. On the performance degradation of centrifugal pumps. In Proceedings of the International Conference on Fluid Flow, Heat and Mass Transfer, Niagara Falls, ON, Canada, 7–9 June 2018; pp. 7–9. [Google Scholar] [CrossRef]
  16. Wu, R.; Zhang, Y.; Chen, T. Analysis of Hydrodynamic Performance of Mixed-flow Pump Based on Fluent Numercial Simulation. Mach. Tool Hydraul. 2018, 46, 139–142. [Google Scholar] [CrossRef]
  17. Shen, X.; Li, R.; Han, W.; Chen, D.; Sun, J.; Tian, Y. Progressive Erosion and Pump Performance Prediction of Double Suction Centrifugal Pump Vane Based on Dynamic Boundary. Trans. Chin. Soc. Agric. Mach. 2024, 55, 212–220. [Google Scholar] [CrossRef]
  18. Zhu, J. Optimal Scheduling of Water Supply Pump Station Based on Calibration and Renewal of Pumps’ Characteristic Curves. Master’s Thesis, Shanghai Jiao Tong University, Shanghai, China, 2017. [Google Scholar] [CrossRef]
  19. Bing, H.; Cao, S.L. Effects of blade rotation angle deviations on mixed-flow pump hydraulic performance. Sci. China Technol. Sci. 2014, 57, 1372–1382. [Google Scholar] [CrossRef]
  20. Yan, J.; Zhang, Z.; Wei, W.; Si, Q.; Li, Y.; Xue, P.; Gao, Z.; Du, M. Optimization and regulation control of pump units based on differential characteristics. J. Drain. Irrig. Mach. Eng. 2024, 42, 256–264. [Google Scholar]
  21. Mao, J.; Zhang, R.; Wang, W.; Cheng, X. Extension correction method for dynamic characteristics of large and medium-sized irrigation pumps. J. Hydroelectr. Eng. 2015, 34, 98–105. [Google Scholar] [CrossRef]
  22. Le Marre, M.; Mandin, P.; Lanoisellé, J.-L.; Bezuglov, R. Experimental study on performance predictions of pumps as turbine. Energy Convers. Manag. 2023, 292, 117235. [Google Scholar] [CrossRef]
  23. Feng, J.; Ge, Z.; Zhang, Y.; Zhu, G.; Wu, G.; Lu, J.; Luo, X. Numerical investigation on characteristics of transient process in centrifugal pumps during power failure. Renew. Energy 2021, 170, 267–276. [Google Scholar] [CrossRef]
  24. Briceño-León, C.X.; Iglesias-Rey, P.L.; Martinez-Solano, F.J.; Mora-Melia, D.; Fuertes-Miquel, V.S. Use of fixed and variable speed pumps in water distribution networks with different control strategies. Water 2021, 13, 479. [Google Scholar] [CrossRef]
  25. Huang, Y.; Zhou, J. Prediction of pump’s complete characteristic curves and its influence on further numerical analysis. J. Drain. Irrig. Mach. Eng. 2021, 39, 777–783. [Google Scholar] [CrossRef]
  26. Liu, Y.; Wang, Y.M.; Yu, G.P.; Hou, J.X. Modeling Characteristic Curves of Pump Station Using SCADA Operational Data. China Water Wastewater 2011, 27, 75–77. [Google Scholar] [CrossRef]
  27. Salomons, E.; Shamir, U.; Housh, M. Optimization Methodology for Estimating Pump Curves Using SCADA Data. Water 2021, 13, 586. [Google Scholar] [CrossRef]
  28. Zeng, Y.; Zhang, Z.; Kusiak, A.; Tang, F.; Wei, X. Optimizing wastewater pumping system with data-driven models and a greedy electromagnetism-like algorithm. Stoch. Environ. Res. Risk Assess. 2016, 30, 1263–1275. [Google Scholar] [CrossRef]
  29. Ha, S.; Xu, H.; Tang, Z.; Zhu, C. Eigenvalue Extraction Method for Engine Steady-state Data Based on Gaussian Mixture Model. Aeroengine 2022, 48, 173–179. [Google Scholar] [CrossRef]
  30. Gao, M. Research on the Pretreatment Methods of Power Station Historical Data. Master’s Thesis, School of Control and Computer Engineering, North China Electric Power University, Beijing, China, 2014. [Google Scholar] [CrossRef]
  31. del Pilar Moreno, R. Steady State Detection, Data Reconciliation, and Gross Error Detection: Development for Industrial Processes. Master’s Thesis, University of New Brunswick, Department of Computer and Electrical Engineering, Fredericton, Canada, 2010. [Google Scholar]
  32. Tang, Y. Electric Machinery, 5th ed.; China Mechine Press: Beijing, China, 2014. [Google Scholar]
  33. Zhou, X. Research on National Water Resource Shortage Assessment Considering Inter-Basin Water Transfer. Master’s Thesis, Dalian University of Technology, Dalian, China, 2022. [Google Scholar] [CrossRef]
  34. Liu, Y.; Xin, Z.; Sun, S.; Zhang, C.; Fu, G. Assessing environmental, economic, and social impacts of inter-basin water transfer in China. J. Hydrol. 2023, 625, 130008. [Google Scholar] [CrossRef]
  35. Chen, X.; Jin, Y.; Xu, X.; He, W. Reflections on Intelligent Water Transfer Scheduling of the Middle Route of the South-to-North Water Transfer Project. J. Hohai Univ. (Nat. Sci.) 2023, 51, 46–55. [Google Scholar] [CrossRef]
Figure 1. Deviation in the Q-H Curve of Pumping Equipment.
Water 17 01977 g001
Figure 2. Efficiency characteristic curve of synchronous motors.
Water 17 01977 g002
Figure 3. Comprehensive Characteristic Curve of 3150HLQ37.5-6 Vertical Fully Adjustable Mixed-Flow Pump Unit.
Water 17 01977 g003
Figure 4. Sectional View of the Pump House at Hongze Pump Station. (Elevations in the figure are measured in meters based on the abandoned Yellow River datum; dimensions are in centimeters.)
Water 17 01977 g004
Figure 5. Steady-state identification results of the instantaneous flow rate.
Water 17 01977 g005
Figure 6. Steady-state identification results of lift.
Water 17 01977 g006
Figure 7. Steady-state identification results of the blade setting angle.
Water 17 01977 g007
Figure 8. Steady-state identification results of input power.
Water 17 01977 g008
Figure 9. Effect of steady-state data clustering.
Water 17 01977 g009
Figure 10. Calculated Performance of the Corrected Flow-Head Curve.
Water 17 01977 g010
Figure 11. Comparison of characteristic curves before and after correction.
Water 17 01977 g011
Table 1. Optimization results of each parameter.
a b c r
Value−0.371.581.99−0.044
Table 2. Comparison of computational accuracy metrics before and after correction.
IndicatorBefore CorrectionAfter CorrectionStandard
Mean Absolute Error of Cluster Points (MAE)1.89°0.31°Closer to 0 is better
Mean Absolute Error of All Points
(MAE)
1.73°0.51°Closer to 0 is better
Coefficient of Determination
(R-squared)
−2.830.67Closer to 1 is better
Table 3. Results of each parameter after correction.
m n l ϕ
Value−4.63−1.99−4.170.03
Table 4. Comparison of calculation accuracy indicators before and after correction.
IndicatorBefore CorrectionAfter CorrectionStandard
Mean Absolute Error of Cluster Points (MAE)6.99%1.71%Closer to 0 is better
Mean Absolute Error of All Points
(MAE)
7.32%1.30%Closer to 0 is better
Coefficient of Determination
(R-squared)
−5.780.76Closer to 1 is better
Table 5. Comparison table of calculated results and measured results.
Flow
(m3/s)
Lift
(m)
Measured
Efficiency
(%)
Predicted
Efficiency
(%)
Absolute
Efficiency Error (%)
Mean Efficiency
Error
(%)
25.645.1562.0363.351.311.20
27.355.2064.9164.000.91
29.575.2263.6564.530.88
31.405.2063.4164.711.30
33.715.2664.6765.190.52
34.565.9370.5368.172.36
36.284.9962.7863.680.90
37.535.5865.7066.841.14
38.704.7562.5461.880.66
39.805.2067.4364.632.80
42.275.3165.3964.920.47
Disclaimer/Publisher’s Note: The statements, opinions and data contained in all publications are solely those of the individual author(s) and contributor(s) and not of MDPI and/or the editor(s). MDPI and/or the editor(s) disclaim responsibility for any injury to people or property resulting from any ideas, methods, instructions or products referred to in the content.

