Abstract
In response to the increasing frequency of urban rainstorms, this study focuses on investigating the friction coefficient related to pedestrian instability under urban road flooding conditions. The objective is to conduct an in-depth analysis of the friction coefficient between pedestrians and the ground in actual flood scenarios and its variations, providing practical data to support future pedestrian safety assessments under flood conditions. Wet friction coefficient experiments were conducted under waterlogged conditions, with real human subjects tested across various operational scenarios. A buoyancy calculation formula was introduced to explore the impact of pressure changes caused by buoyancy on the human body in water, influencing the friction coefficient. An exponential relationship between pressure and the friction coefficient was established. Furthermore, by considering factors such as outsole hardness, ground type, and pressure variations with water depth, a dynamic method for selecting the friction coefficient was proposed, offering a scientific basis for determining friction coefficient thresholds associated with pedestrian instability risks. Experimental results indicate that, in the combination of hydrophilic materials with experimental asphalt and cement pavements, the friction coefficient under waterlogged conditions is generally higher than under dry conditions. However, as pressure increases, the friction coefficient of rubber materials decreases. This study concludes that the selection of the friction coefficient in pedestrian instability analysis should be treated as a dynamic process, and relying on a fixed friction coefficient for force analysis of pedestrian instability may lead to significant inaccuracies.
1. Introduction
In recent years, urban flood disasters caused by extreme rainstorms have become increasingly frequent. Typical events include the 2012 Beijing “7·21” rainstorm [1], the 2021 Zhengzhou “7·20” rainstorm [2], and the 2023 Beijing “23·7” rainstorm, among others, all of which resulted in significant casualties and property damage. Urban flooding has become one of the most critical natural disasters threatening the safety of urban operations and public life and property. As a result, flood risk assessment and response capabilities are drawing increasing attention from both the academic community and administrative authorities [3,4]. These events are further intensified under climate change, where anthropogenic aerosols alter convective precipitation efficiency [5], and by urban spatial heterogeneity where high population density and social vulnerability concentrate flood impacts [6]. In the face of such extreme rainfall, roads often serve as important drainage facilities [7], with pedestrians on these roads becoming the primary victims of these disasters. Therefore, to better assess the physical vulnerability of pedestrians in flood situations, it is essential to clearly describe the complex interaction between the spatial and temporal distribution of flood elements and the dynamics of human instability. This will help quantify the pedestrian risk index within the context of flooding risks [8,9,10].
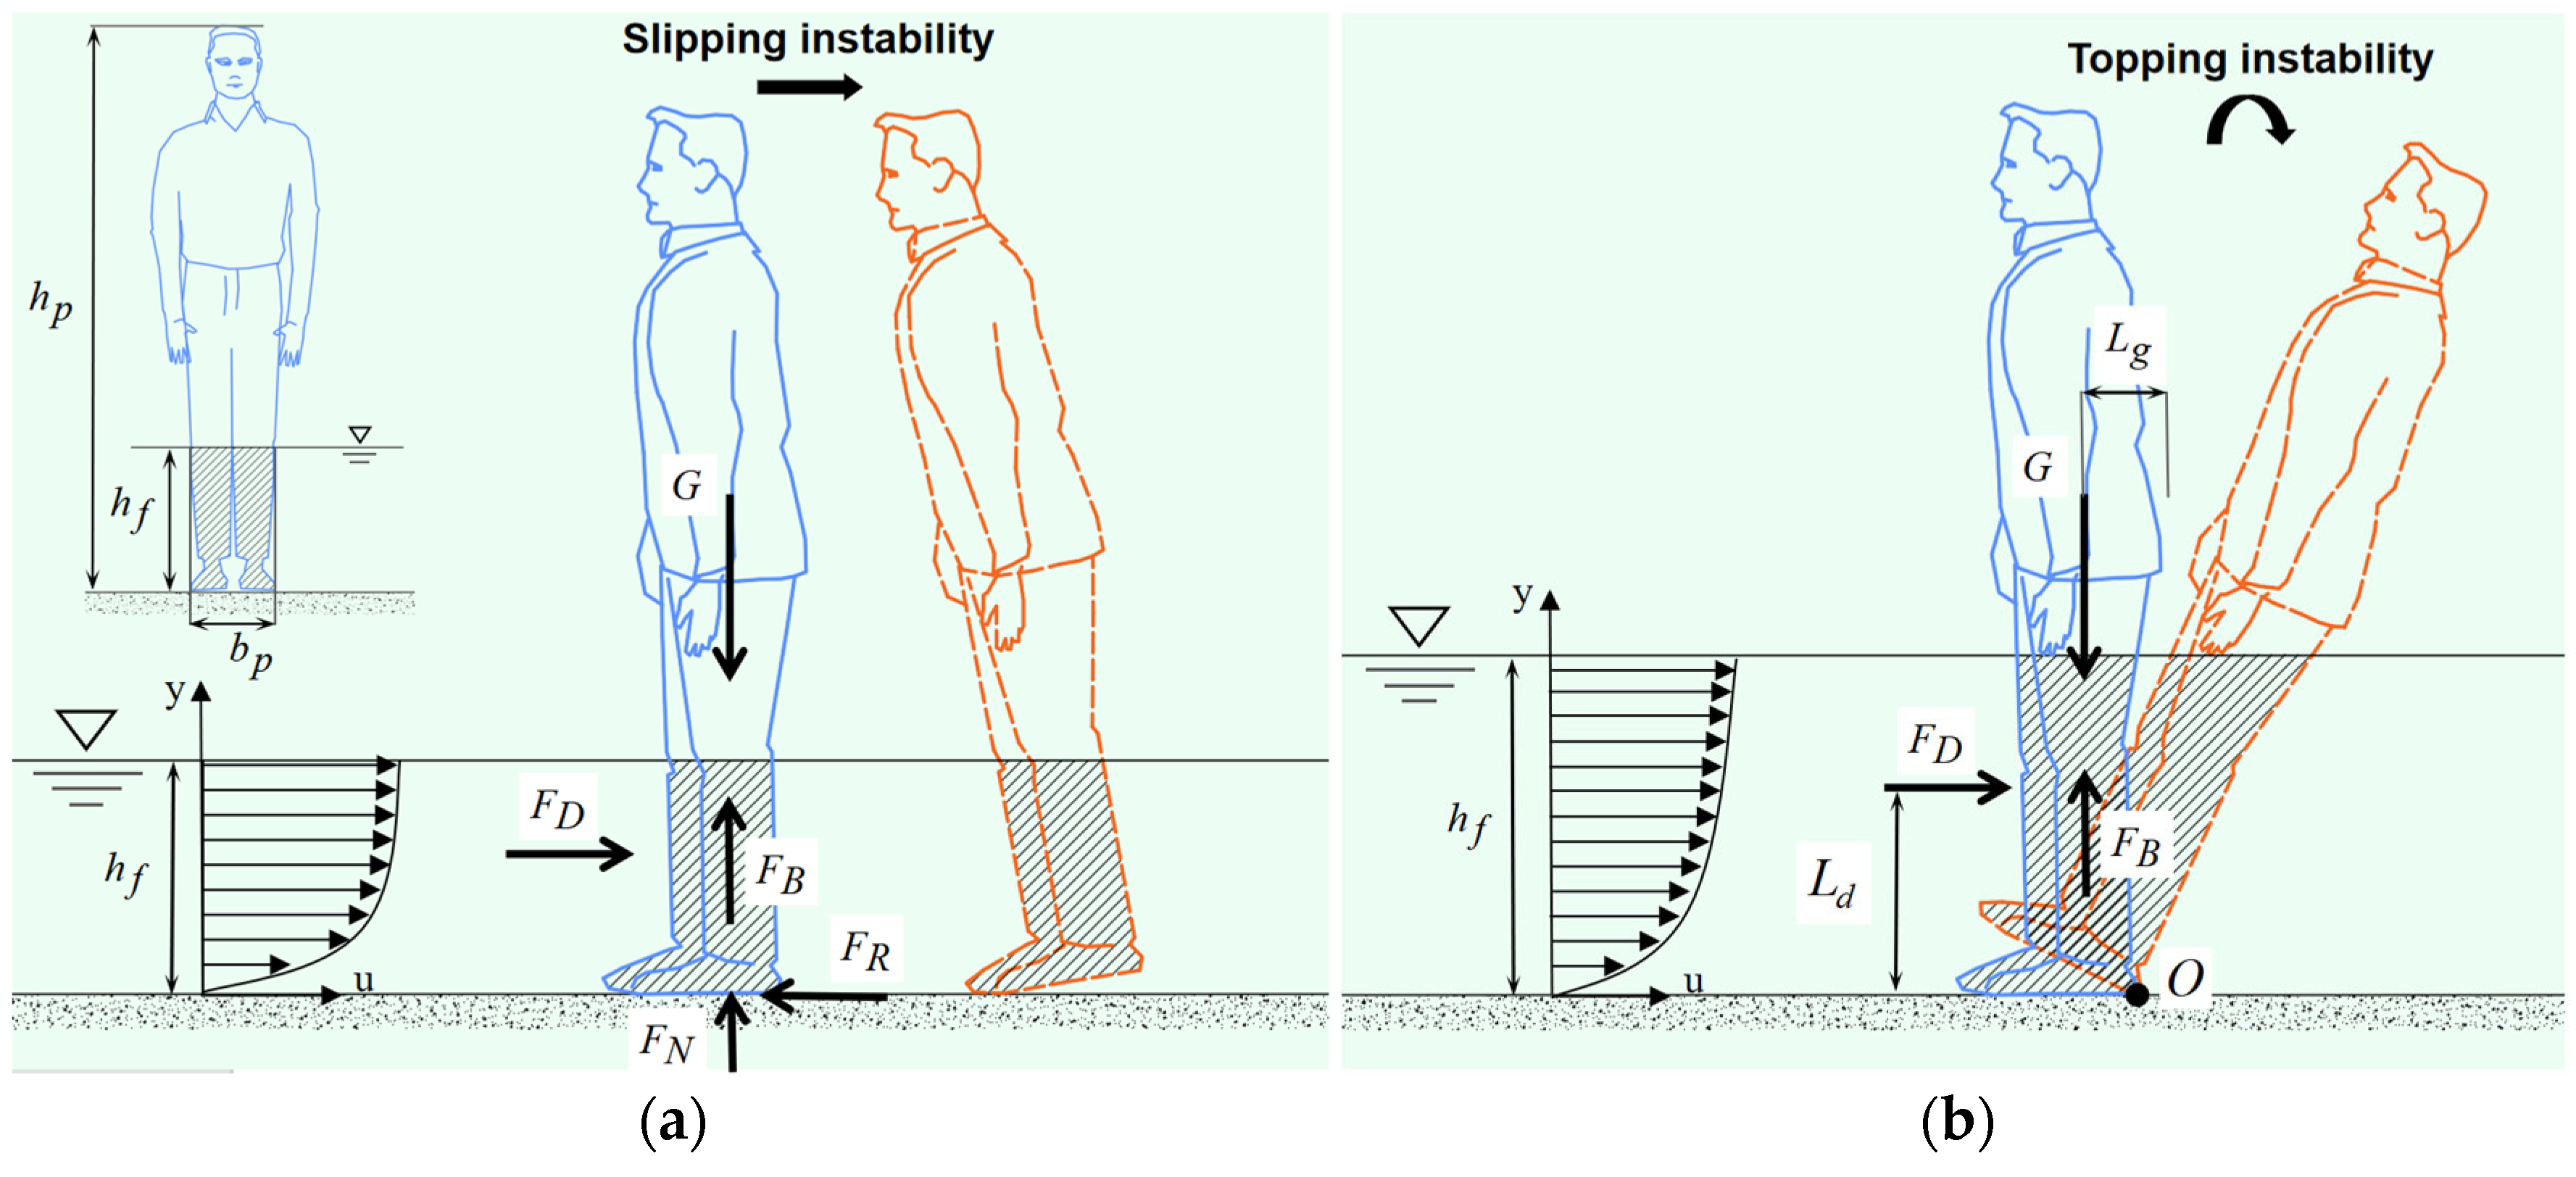
Over the past few decades, scholars have systematically studied the human biomechanics response and stability thresholds during floods. Through theoretical modeling and flume experiments, they have revealed two major dominant mechanisms of instability: slip instability and overturn instability [11]. Slip instability occurs when the drag force of the water flow exceeds the maximum static friction force at the foot, causing the pedestrian to slide along the direction of the flow. On the other hand, overturn instability occurs when the torque from the water flow exceeds the body’s resistance to overturning, causing the body to rotate and fall around the support point. The diagram of pedestrian instability mechanisms in Figure 1 is drawn with reference to the study by Xia et al. [11], illustrating the force analysis for two types of mechanisms. Friction is one of the key indicators. Based on mechanics, the forces that the human body may experience in water are analyzed individually, and combined with flume experiments and numerical simulations, the key water depths and flow speeds under flooding conditions are restored. The relationship between flow speed and water depth is derived. Jonkman et al. [12] conducted stability experiments in flood diversion roads, primarily investigating pedestrian stability under various water-depth–flow-velocity combinations. It was found that slip instability dominates under conditions of low water depth and high flow velocity. Therefore, in the analysis of slip instability, the measurement of the friction coefficient becomes particularly crucial.
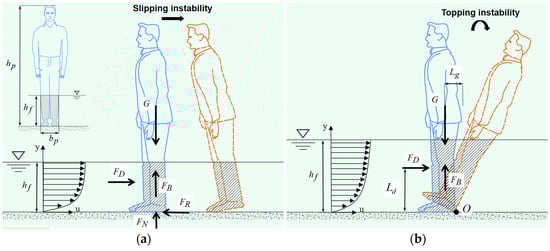
Figure 1.
(a) Slip instability mechanism: hydrodynamic drag force exceeds static friction at the foot-ground interface, causing sliding along flow direction; (b) Tipping instability mechanism: fluid-induced torque overcomes body resistance, inducing rotational failure around the support point.
In existing research, studies on the instability mechanisms caused by friction coefficients have mainly focused on slip instability. However, both slip instability and overturn instability essentially stem from insufficient friction force at the interface between the ground and the pedestrian. Even under high-water-depth conditions, overturn instability is closely related to the friction force at the foot. When the friction force is insufficient to maintain the stability of the foot, the body’s center of gravity shifts, significantly lowering the critical value of the anti-overturning moment. Additionally, the attenuation of friction force can lead to uneven pressure distribution at the contact surface, further weakening the effective contact area between the foot and the ground, thereby increasing the risk of moment imbalance. Therefore, the friction coefficient is not only a core parameter for slip instability but also a potential precondition for overturn instability. However, existing research has not given enough attention to the friction coefficient, often analyzing these two types of instability separately and neglecting the systemic impact of friction force on overall stability. Moreover, in typical studies by Jonkman et al. [12], Yee et al. [13], and Keller et al. [14], there is heavy reliance on the empirical selection of friction coefficients. The real friction coefficient under flood conditions is influenced by multiple factors, and relying solely on friction coefficient selection for instability experiments may lead to certain errors. Therefore, accurately quantifying the dynamic changes of the friction coefficient under flood conditions becomes a necessary prerequisite for scientifically evaluating the comprehensive instability risk of pedestrians.
In order to better reflect real flood scenarios, some scholars have used simplified devices to measure the friction coefficient. Takahashi et al. [15] conducted experiments with different types of shoes on surfaces covered with algae, including smooth and rough concrete, obtaining the friction coefficient under wet conditions. However, there is still a lack of friction coefficient data for asphalt pavements or flood diversion roads covered with grass. Additionally, Martínez et al. [16], Zhu [17], and others obtained friction coefficients through experiments in which a force meter was used to pull shoes. Guo [18] measured the wet friction coefficient of several common shoes and the frictional properties of different clothing materials on wet surfaces using pulleys. In real flood scenarios, pedestrians consciously lower their center of gravity and adjust their walking posture when facing inundation. These conscious counteracting behaviors inevitably affect friction coefficient measurements to some extent. However, current studies directly measure the friction coefficient of test materials while overlooking this factor. Additionally, existing research inadequately quantifies test surface conditions, and wet friction experiments are conducted under wetted conditions. Since friction coefficients in this field serve pedestrian instability studies on flood diversion roads—where scenarios involve inundated states—this discrepancy may lead to application deviations. In addition, research in other fields has shown that the friction coefficient of shoes is closely related to the applied gravitational force [19,20]; Derler [21] pointed out that the friction coefficient of skin changes with pressure variations. Therefore, whether pressure affects the friction coefficient of pedestrian shoe soles in flood scenarios has become a crucial scientific issue that needs to be explored. In summary, although existing research on pedestrian instability risk in flood conditions has discussed pedestrian safety, there is still insufficient in-depth study of the friction coefficient in real flood scenarios. The selection of the friction coefficient is a critical step in the analysis of pedestrian instability risk thresholds, and its variation directly influences the critical conditions for pedestrian instability.
Building upon the identified research gaps, this study conducts in-depth investigations from two aspects: friction coefficient measurement and friction coefficient application. In friction coefficient measurement, experiments were performed with real human subjects wearing test materials to restore authentic friction coefficients under pedestrians’ counteracting behaviors in flood scenarios; modeling clay dams were used to create water accumulation on road surfaces, obtaining friction coefficients under realistic flood diversion conditions; an AMES laser texture scanner quantified surface texture parameters of two pavement types (e.g., MPD and ETD) to participate in friction coefficient selection. In application, parameters including water depth and sole hardness were quantified; the impact of pressure changes induced by buoyancy on friction coefficients was incorporated; variations in friction coefficients across water depths were explicitly defined, demonstrating that using a single fixed friction coefficient for force analysis throughout pedestrian instability experiments introduces significant errors.
2. Materials and Methods
2.1. Experimental Setup
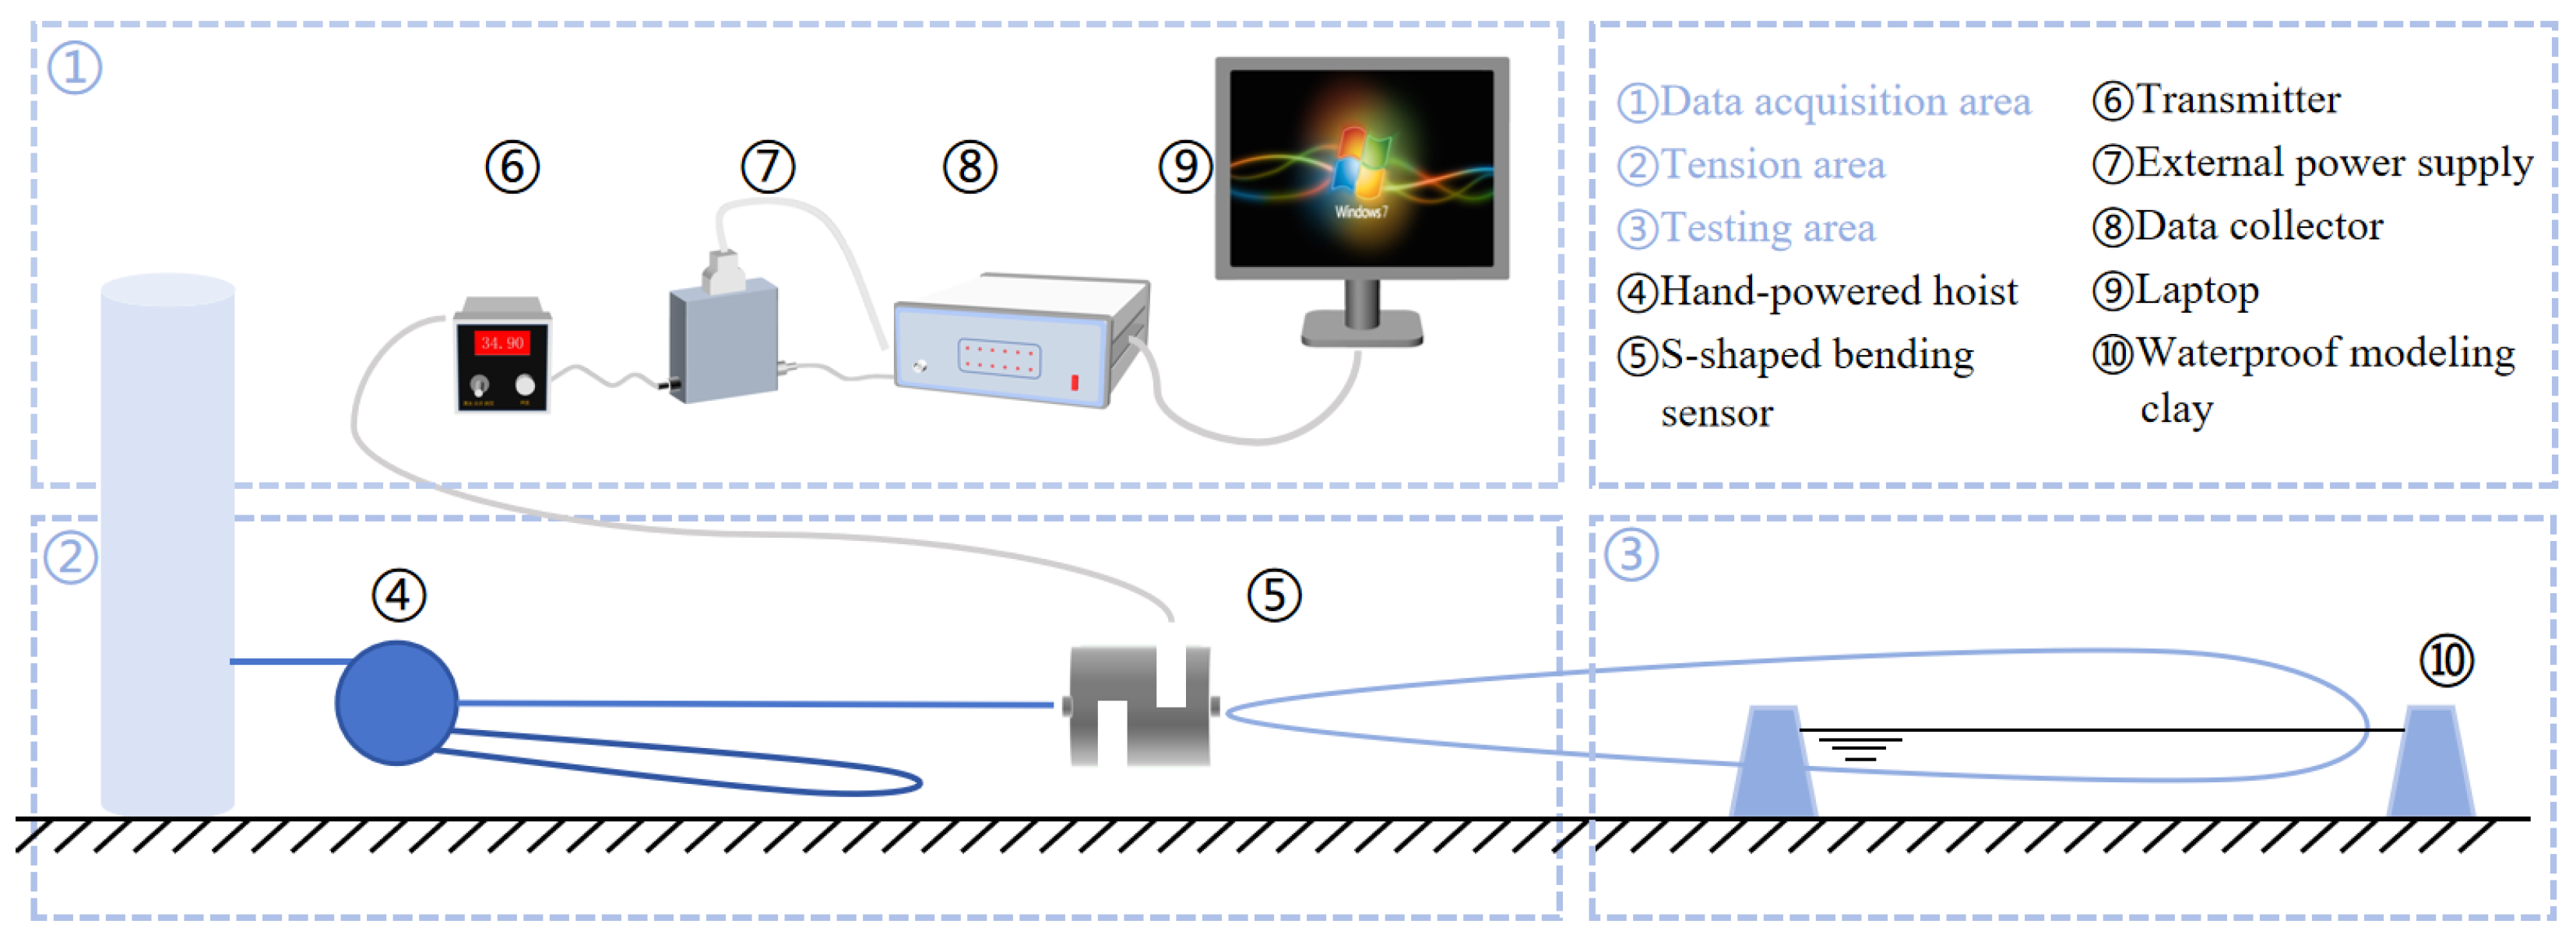
The experimental setup in this study is mainly divided into three areas: the data collection area, the tension area, and the testing area, as shown in Figure 2.
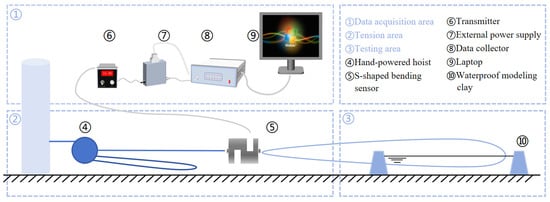
Figure 2.
Test device for pedestrian instability friction coefficient under multiple conditions.
In the tensile force zone, a constant pulling force was applied by uniformly operating a hand hoist to simulate the force experienced by pedestrians during slipping. The top hook of the hand hoist was secured to a roadside stump using a nylon strap, while the end hook was connected to an S-shaped load cell (Bengbu Dayang Sensor System Engineering Co., Ltd., Bengbu, China) with a measurement range of 100 kg, a maximum output voltage of 5 V, and a sensitivity of 3‰. The other end of the sensor is connected to the tension belt, which extends into the testing area. During the test, as the pulling force increases, the S-shaped bending sensor deforms, outputting an electrical signal proportional to the change in force. The primary function of the data collection area is to receive the signals from the S-shaped bending sensor. After amplification and conversion by the transmitter, the sensor’s signal is transformed into a standard electrical signal (such as 4–20 mA or 0–10 V) for subsequent processing. The signal from the transmitter is then sent to the data collector (Beijing, China), which converts the analog signal into a digital signal using its built-in analog-to-digital converter (ADC) and transmits it to the computer. As the pulling force gradually increases, the electrical signal output by the sensor generates a corresponding signal line in the computer, reflecting in real-time the change in force and its effect on the sensor. The testing area is designed to simulate real road conditions, particularly areas with surface water. By using modeling clay to form appropriately sized dams, it effectively simulates a flooded environment. This setup ensures that the experiment not only achieves a good water accumulation effect but also maintains uniformity in the test surface.
2.2. Subjects and Other Materials
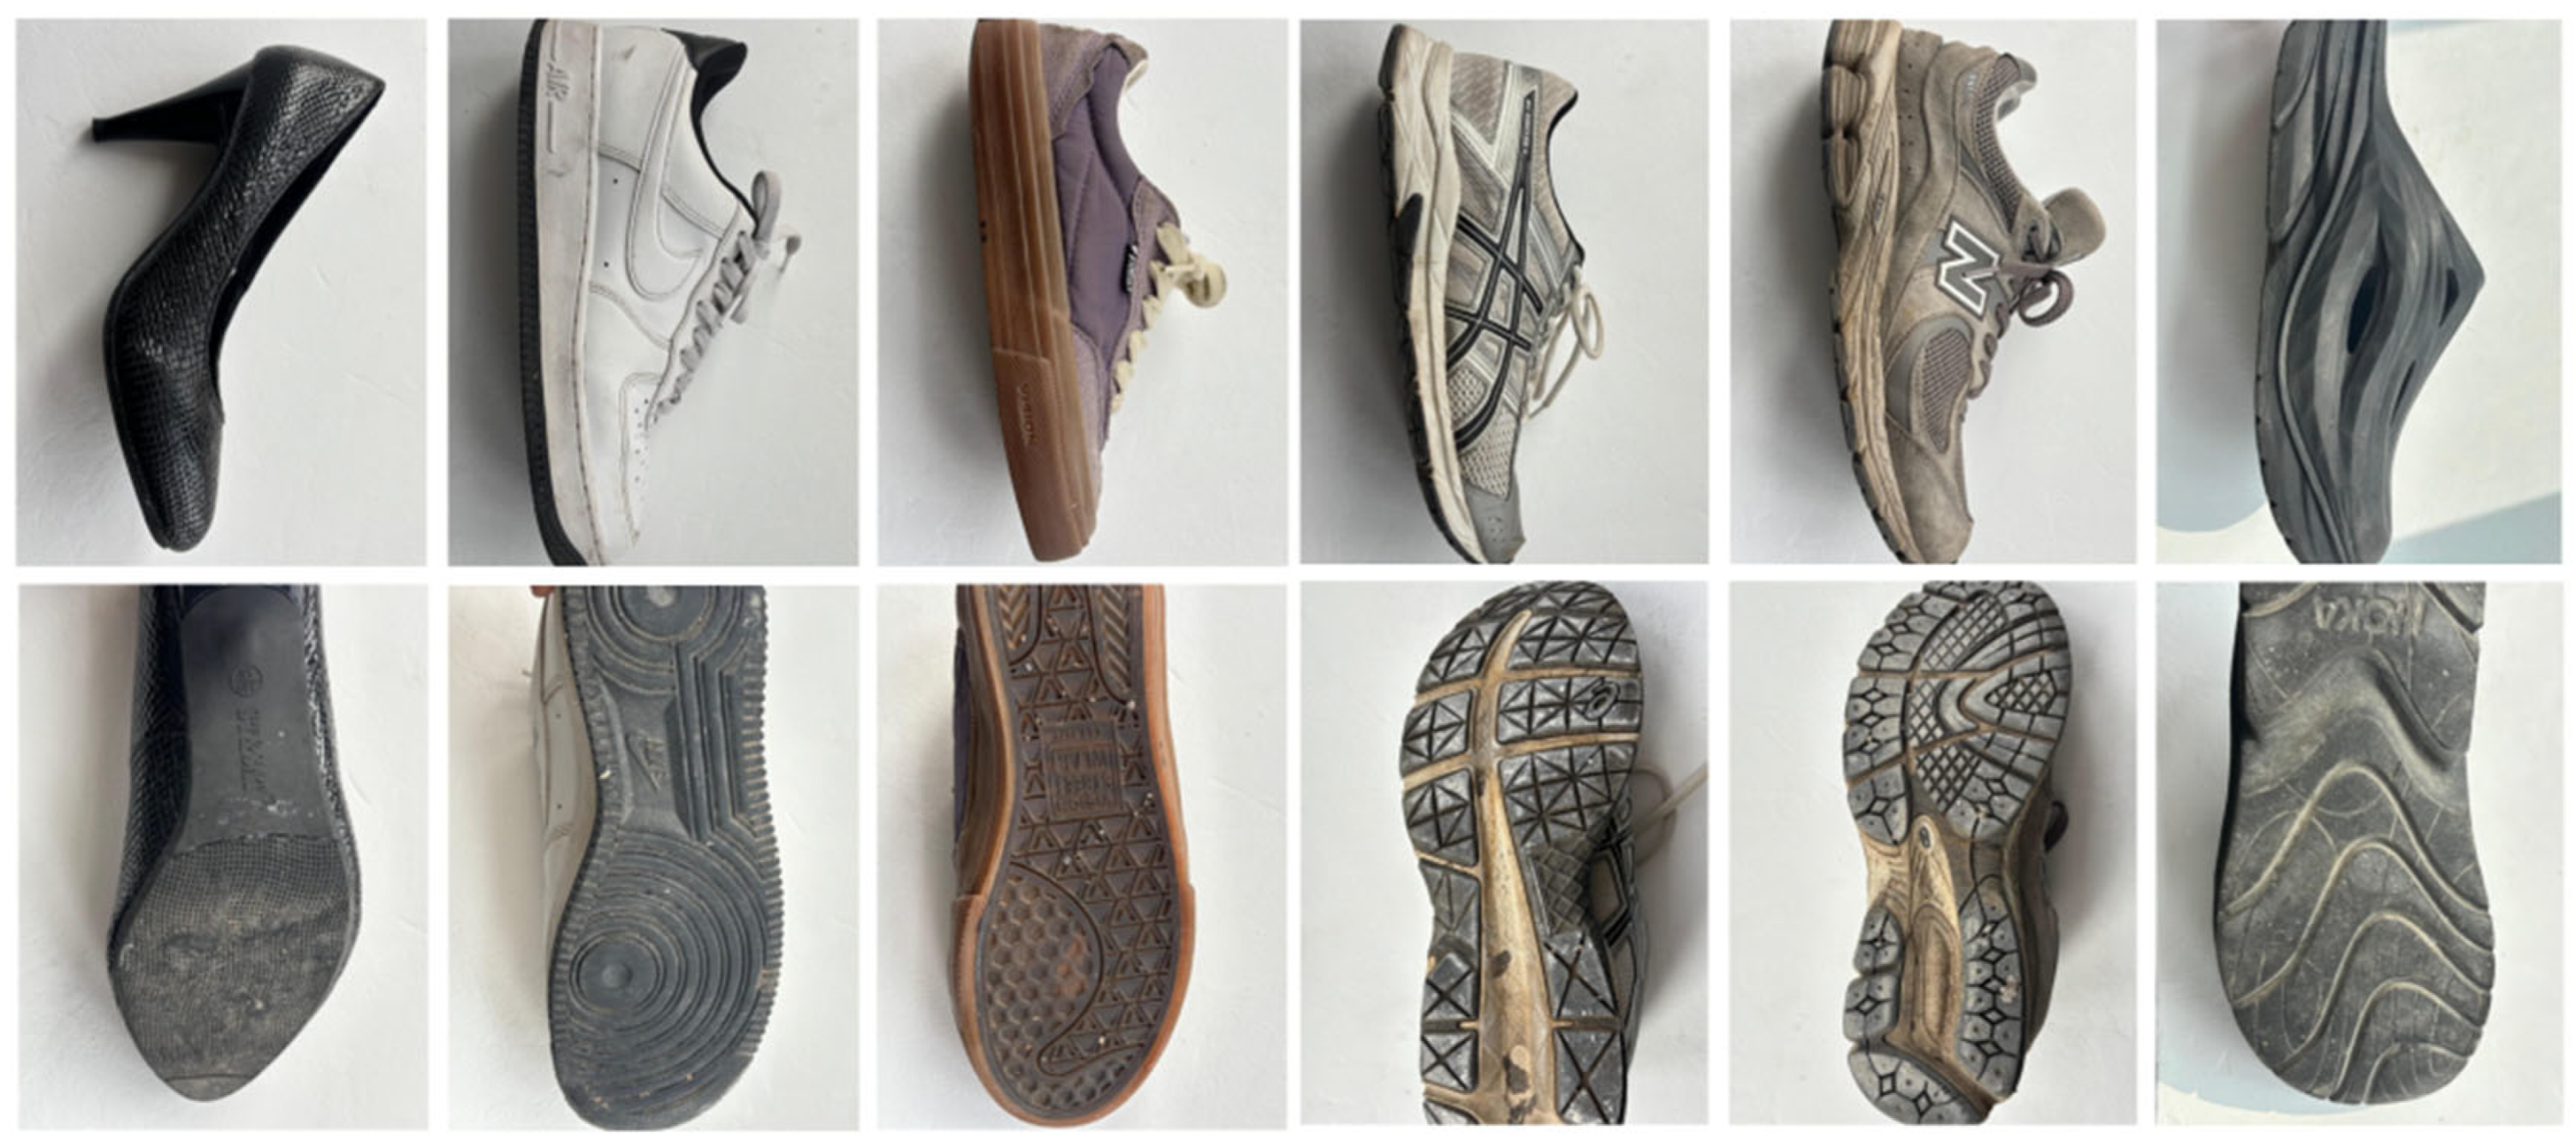
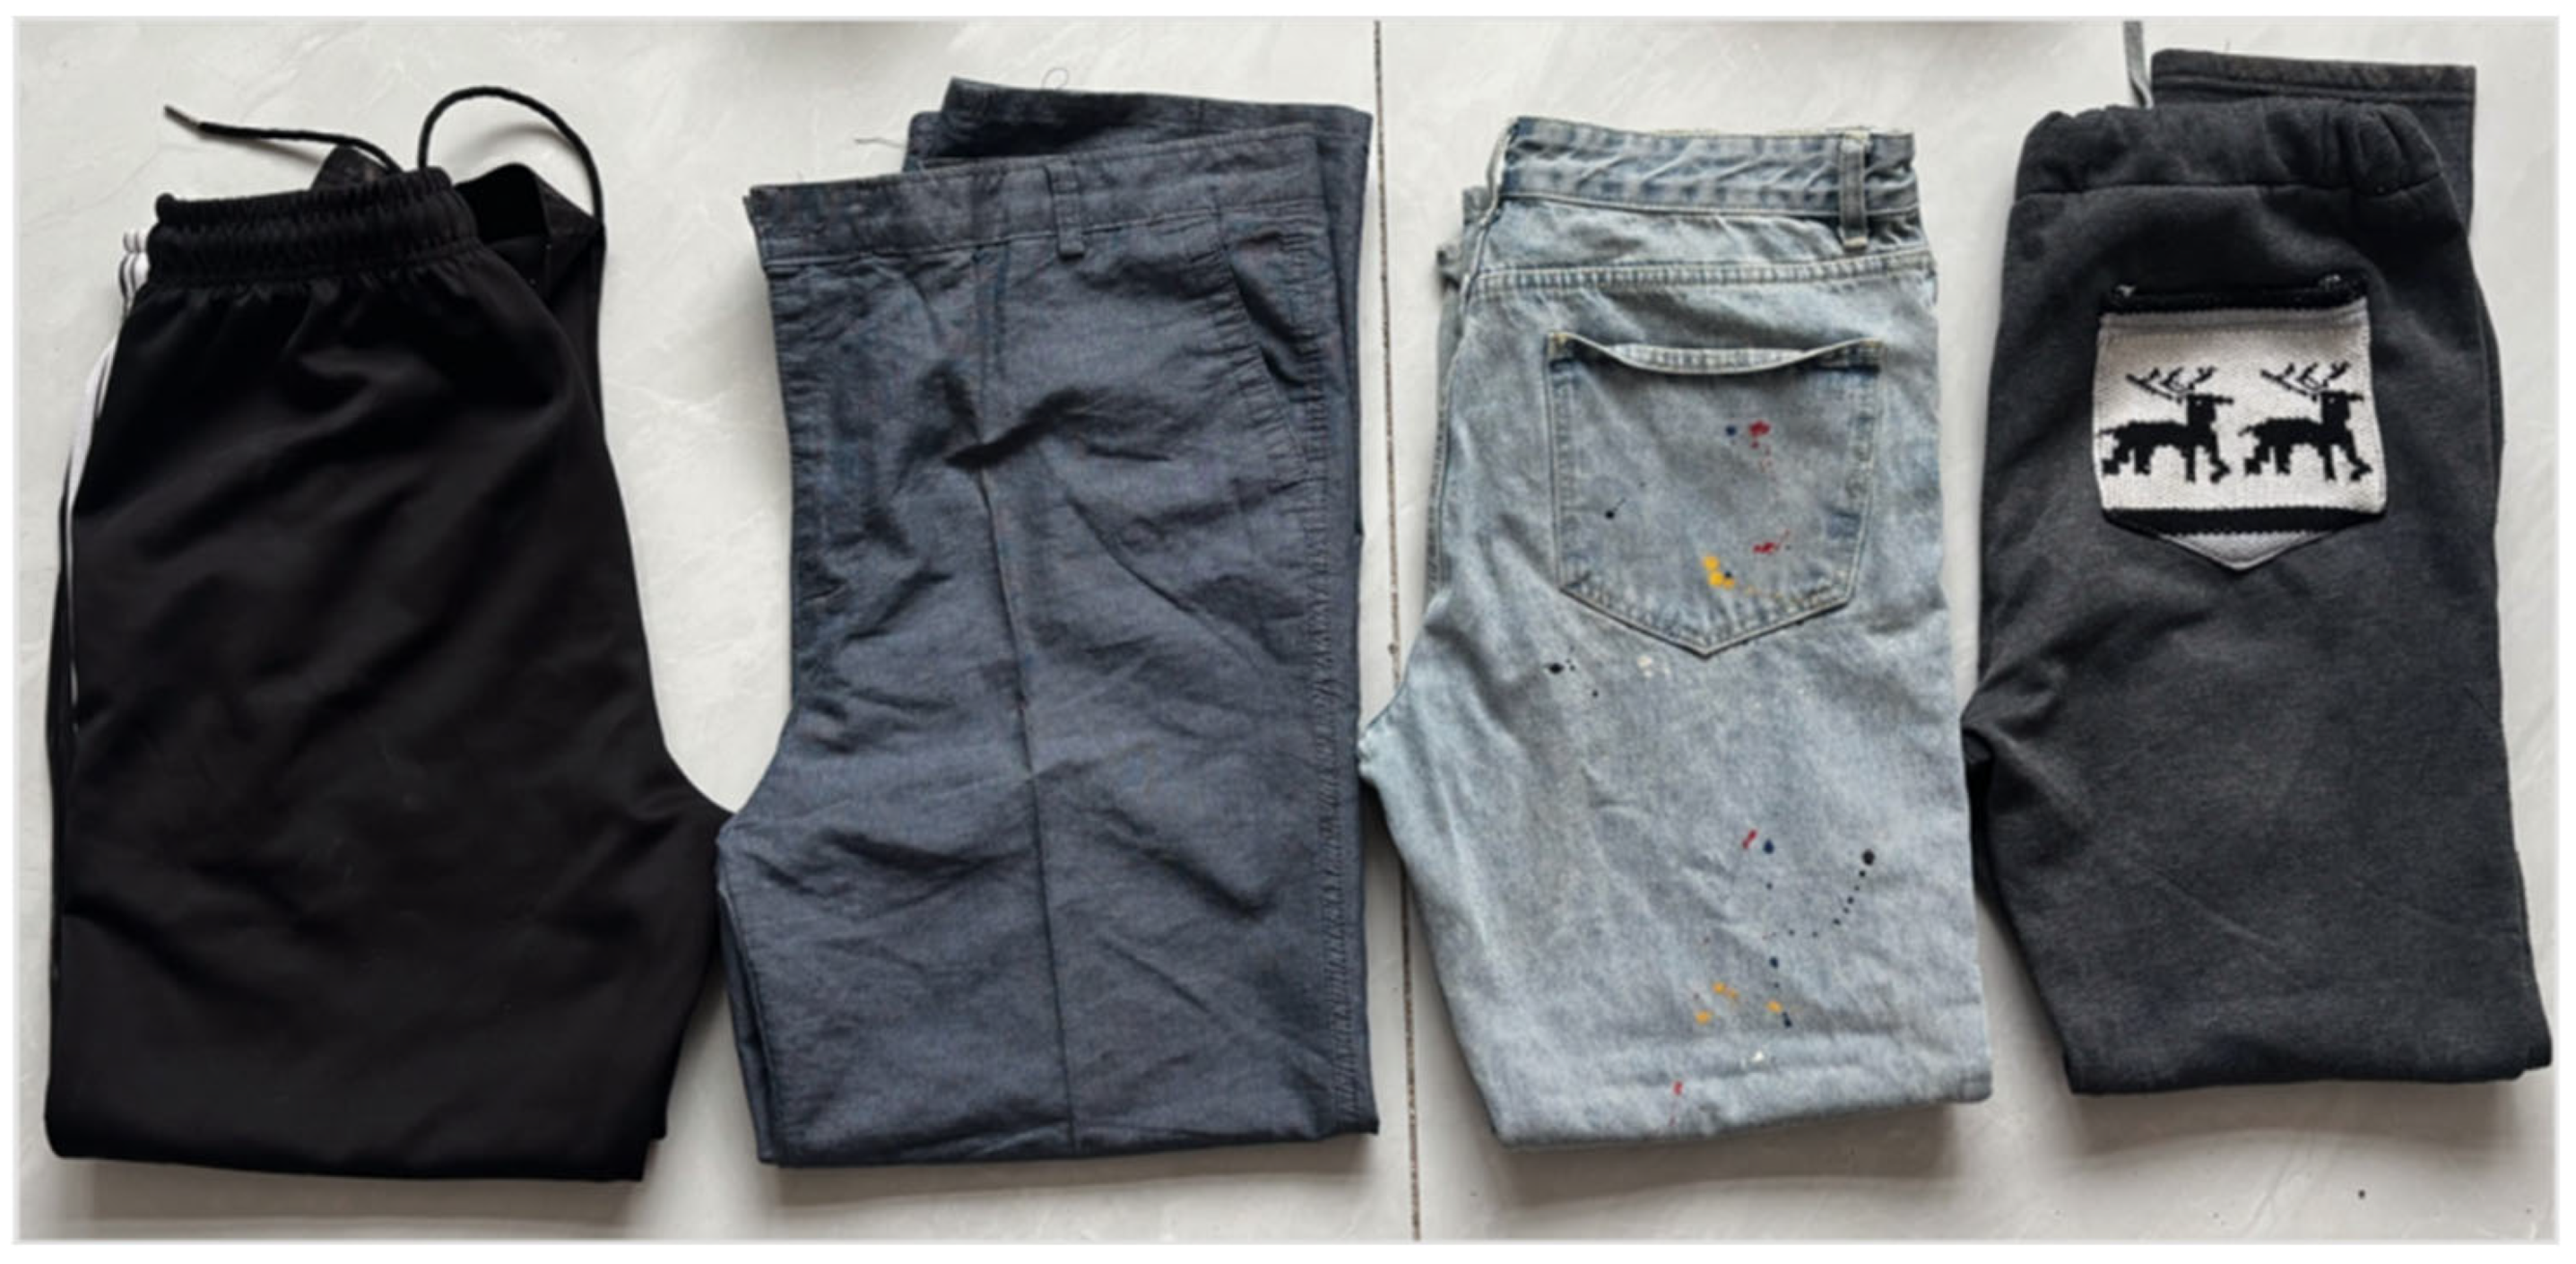
This study incorporates real human subjects to simulate the frictional conditions in real-life scenarios. The friction experiments were conducted with subjects wearing different types of shoes and clothing. The selected shoe types include those that are commonly worn by the subjects in daily life, as well as crocs, which are more frequently worn in summer. A total of seven different shoe types were tested, as shown in Figure 3. Additionally, four common types of pants were selected (school uniform pants, casual pants, jeans, and sports pants) to analyze the friction coefficient when the legs of pedestrians come into contact with two typical pavement types (asphalt pavement from a region in Shandong and cement pavement) after pedestrian instability occurs under flood conditions, as shown in Figure 4.
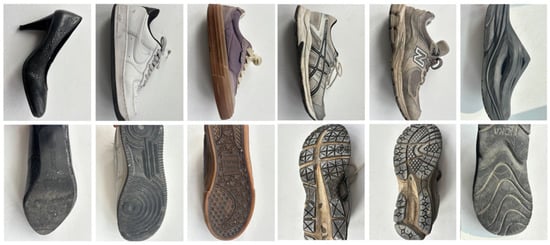
Figure 3.
Styles of shoes to be tested and their sole designs.
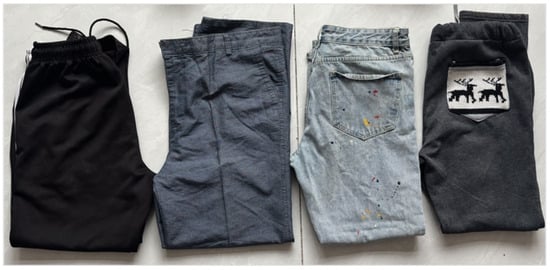
Figure 4.
Four types of pants to be tested (from left to right: school pants, casual pants, jeans, and sports pants).
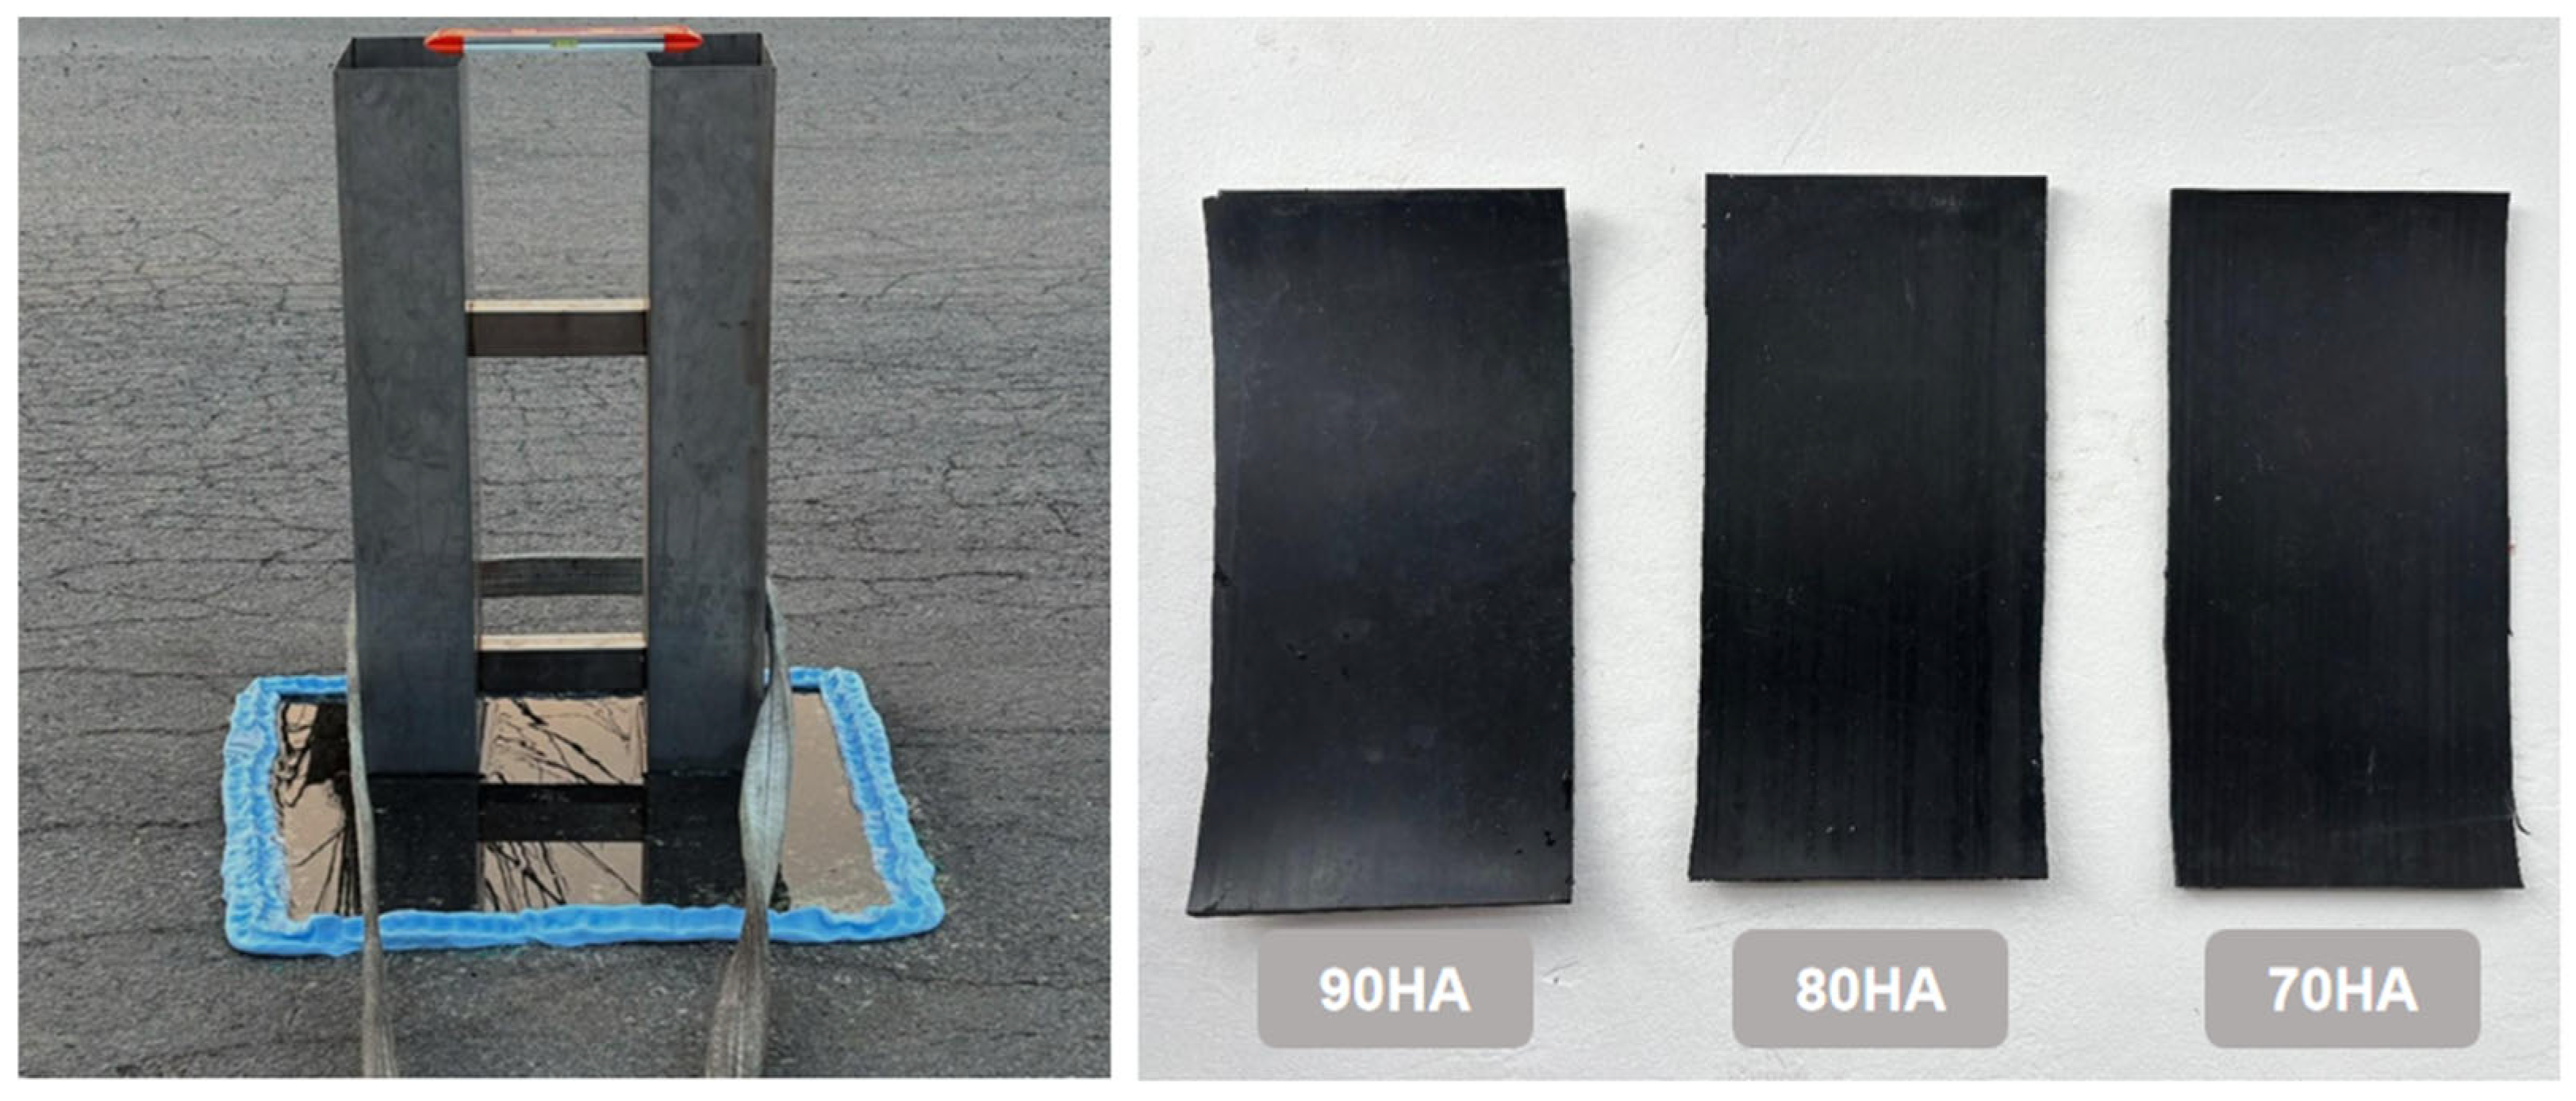
For the pressure and friction coefficient experiments, a load-bearing steel trough was designed to simulate the human leg, with three rubber sheets of different hardness levels (each 3 mm thick) affixed to the bottom of the trough, as shown in Figure 5. The hardness of the rubber sheets was measured using a Shore hardness tester, with values of 70, 80, and 90 HA, respectively. Iron blocks with identical mass were used as weights and were precisely calibrated using standard masses to ensure accuracy during the experiments. The area of the bottom plate of the steel trough was 0.02 m2 × 2, and its flatness was verified with a spirit level before testing. The experiments were conducted on two typical types of road surfaces. The surface roughness of each surface was measured using an AMES 9400 HD laser texture scanner (vertical resolution: 0.003 mm; measurement range: 30 mm) to provide additional reference data for subsequent friction coefficient analysis.
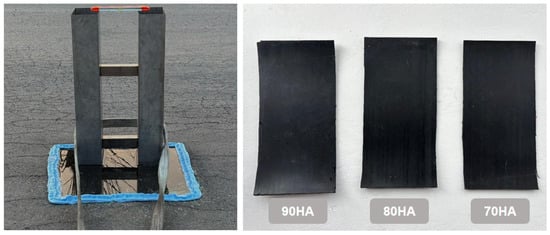
Figure 5.
Load-bearing steel trough and three rubber base plates.
Additionally, to ensure the safety of the experiment, the friction coefficient measurement tests were conducted on open road sections, and safety facilities such as road warning signs and safety helmets were provided to ensure the safety of the experimental process.
2.3. Experimental Methods
The method used to measure friction in this study differs from conventional friction testing methods. For example, the testing methods mentioned in “General Testing Methods for Footwear Anti-Slip Performance” [22] and GB/T 28287-2012 [23] “Testing Methods for Anti-slip Properties of Foot Protection Footwear” focus on the measurement of sliding friction, whereas this study focuses on maximum static friction. Generally, the maximum static friction value is greater than the sliding friction value.
The frictional force acts on the contact area between the material and the road surface. The testing is based on the following formula:
In the formula
—Normal force;
—Traction force;
—Friction coefficient.
The following experiments were all calculated using this formula.
2.3.1. Friction Coefficient of Different Footwear
In the experiment measuring the friction coefficient of different footwear, the subjects wore the shoes to be tested and entered the testing area. The tension belt was fixed to the heel, and the pulling force was applied at a constant speed via a hand-powered hoist while data collection was simultaneously initiated. Data collection was stopped when the subject experienced slippage. The peak value of the electrical signal in the software corresponded to the moment when slip occurred, representing the static friction point. The friction coefficient of each footwear type was measured on two typical road surfaces—asphalt and cement—under different wet conditions (dry surface and flooded surface). During the testing, the subjects were instructed to maintain a posture with a lowered center of gravity, simulating pedestrian behavior in flood scenarios, to obtain realistic friction data. After the test, the subject’s body weight was recorded.
2.3.2. Friction Coefficient of Different Clothing
In the friction experiment for different pants, a kneeling posture was considered, as it is one of the most common postures after pedestrian instability. Three volunteers of varying heights and weights wore four different types of pants and knelt on the testing surface. The experiment was conducted as described above, with asphalt and cement surfaces used as the testing substrates, including both dry and flooded conditions. During the test, the subjects maintained a stable posture to ensure the accuracy of the data. After the test, the body weight of the subjects was recorded.
2.3.3. Relationship Between Pressure and Friction Coefficient
Existing experiments often rely on empirical parameters or directly apply a pulling force to the footwear to obtain the friction coefficient, using a fixed coefficient value throughout the experiment. However, in pedestrian instability experiments or real flood scenarios, as the water depth increases, buoyancy also increases, leading to a reduction in the pressure acting on the shoes, which in turn affects the friction coefficient. To address this issue, this study referred to the static body size percentiles outlined in the “Chinese Adult Body Dimensions” GB/T 10000-2023 [24], selecting the P50 and P10 standard data for both men and women. Additionally, based on the age standards for kindergarten and first-grade elementary students in the “Chinese Children’s Body Dimensions” GB/T 26158-2010 [25], one child was selected from each category, resulting in six body parameter standards. These standards were combined with buoyancy calculations to determine the applied load range. To better simulate real flood scenarios, the water depth range was set between 15 cm and 115 cm, based on the height of the curb and the dimensions of the human lower limbs [24]. The effective gravity at different water depths was calculated using the human buoyancy calculation formula from Xia et al. [26], as shown below:
In the formula
g—Gravitational acceleration;
—Water density;
—Ratio of water depth to body height, i.e., .
Based on the average physical characteristics of Chinese people, the following can be calibrated: = 0.633; = 0.367. Statistical data indicates that there is a certain linear relationship between body volume () and body weight (), which is generally expressed as , with is typically taken as = 1.015 × 10⁻³, and = −4.937 × 10⁻³.
According to the buoyancy formula, the effective weight of the six individuals at different water depths is calculated in detail, thereby determining the increased load capacity, and the following Table 1 is drawn.

Table 1.
Pressure table for typical height and weight of subjects under different submersion levels.
During the testing phase, the object-carrying steel trough with the rubber base adhered to it is placed in the test area. According to the table above, weights are sequentially added to the steel trough to match the corresponding weight. The hand-cranked hoist is operated, and data is recorded. The water status of the cement and asphalt road surfaces is measured in turn, and then the experiment is repeated with other hardness rubber.
In terms of control conditions, the study by Barquins et al. [27] mentioned that temperature has a significant effect on the friction coefficient. Therefore, each experiment is conducted within the same time period, with the temperature recorded and the temperature difference controlled within a reasonable range. The two different road surface wetting conditions are dry and water-logged states. The dry state ensures a clean test environment, while the water-logged state is controlled with a water depth of 10 mm, with water replenished as needed during the experiment. The hoist is always operated at a slow and steady speed, pulling from the far end of the test area to the starting point repeatedly for a complete test cycle. The peak values obtained from these tests are averaged and then converted.
The three friction experiments are repeated four times, and after recording the electrical signal data, the average value is taken. The electrical signal is then converted into pulling force using the following formula:
In the formula
—Pulling force;
—Output peak signal;
—Output voltage;
—Maximum range.
3. Discussion and Analysis
To investigate the friction coefficients and their variation patterns of pedestrians under different conditions on urban roads during flooding, a multidimensional quantitative characterization analysis was conducted on two typical pavement types. In the experiment, an AMES laser texture scanner was used to scan asphalt and concrete pavements. According to the experimental requirements, the pavements were scanned under P3 mode to obtain surface micro-roughness data for both asphalt and concrete pavements. The data were analyzed using the Ames Texture Scanner professional software (https://www.amesengineering.com/products/laser-texture-scanner-model-9400, accessed on 28 June 2025), resulting in three-dimensional graphs of the pavement protrusion length ratio and surface texture maps, as shown in Figure 6.
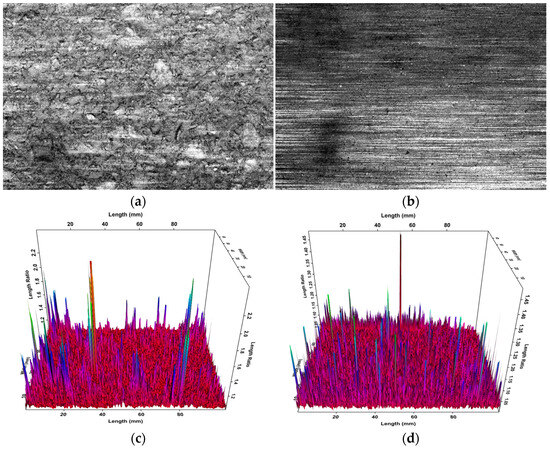
Figure 6.
(a) Micro-texture characteristics of the asphalt test pavement under P3 setting using the AMES laser texture scanner; (b) micro-texture characteristics of the cement test pavement under P3 setting using the AMES laser texture scanner; (c) characteristic peak length distribution of the asphalt pavement surface under P3 setting using the AMES laser texture scanner; (d) characteristic peak length distribution of the cement pavement surface under P3 setting using the AMES laser texture scanner.
Experimental results indicate that the Mean Profile Depth (MPD) of the concrete pavement is 0.107 mm, and the Estimated Texture Depth (ETD) is 0.285 mm; whereas the MPD of the asphalt pavement is 0.450 mm, and the ETD is 0.560 mm. In Figure 6, (a) and (b) display the micro-texture characteristics of the asphalt and concrete test pavements. In these images, the roughness of the asphalt pavement is clearly visible, with pronounced peaks and valleys, corresponding to its higher MPD and ETD values. In contrast, the concrete pavement shows a more uniform texture, with less prominent protrusions, reflecting its lower surface roughness. (c) and (d) show the characteristic peak length distribution of the asphalt and concrete pavements. These graphs highlight the variation in protrusion lengths on each surface. The asphalt pavement (Figure 6c) shows a wider peak length distribution, indicating a more uneven surface with greater texture variation. On the other hand, the concrete pavement (Figure 6d) has a narrower peak length distribution, suggesting a more uniform surface texture with fewer significant protrusions. The significantly higher texture indices of the asphalt pavement originate from its skeletal interlocking structure: coarse aggregates protrude during compaction to form macroscopic protrusions, and rolling processes enhance anisotropic texture; conversely, the concrete pavement forms a smooth surface due to its mortar coating mechanism and troweling process. It is evident that the concrete pavement surface texture is relatively uniform with moderate roughness; in contrast, the asphalt pavement demonstrates higher surface roughness, deeper texture, and greater undulations compared to the concrete pavement.
3.1. Friction Coefficients of Different Shoe Models
Takahashi et al. [15] measured the friction coefficients of various shoe types on different types of concrete pavements, revealing a considerable range from 0.2 to 1.5. However, their study lacked friction coefficient tests on more commonly encountered asphalt pavements and did not quantify ground surface parameters during measurements. Consequently, the determination of friction coefficient values should be based on multi-condition experiments reflecting actual scenarios, and efforts should be made to continually refine and expand the friction coefficient database. In the present study, friction coefficient experiments were performed on seven common shoe types under flood conditions, yielding coefficients for both dry and waterlogged states, as detailed in Table 2 and Table 3.
Table 2.
Friction coefficients of various common shoe types under dry conditions.
Table 3.
Friction coefficients of various common shoe types under waterlogged conditions.
Per the table data, shoe sole materials were categorized. In test combinations involving real human subjects wearing hydrophilic sole materials (rubber-soled sports shoes; skate shoes) and experimental pavements, the friction coefficient under waterlogged conditions was overall greater than under dry conditions; conversely, hydrophobic materials such as Crocs exhibited the opposite behavior. This outcome confirms that the traditional perspective—that the lubricating effect of water under wet conditions reduces the friction coefficient—is not absolute. Under water accumulation conditions, a thin water film forms between the two contact surfaces, reducing direct contact and thereby decreasing the surface roughness between them. However, when the water film is extremely thin, it does not fully fill the surface roughness between the contact interfaces, and the film may generate surface tension or adhesive forces, which, to a certain extent, increase the coefficient of friction. In addition, under dry conditions, fine dust and impurities on the ground fill the asperities between the contact surfaces, while under water accumulation, fine particles are washed away, effectively increasing surface roughness.
Research on pedestrian slip risk thresholds typically adopts experiments under water accumulation conditions, and thus, the measurement of the coefficient of friction should focus more on the actual frictional state under water accumulation. The results show that the coefficient of friction corresponding to water accumulation in flood scenarios ranges from 0.59 to 0.80, whereas existing pedestrian slip experiments often select 0.3 or 0.4 as the coefficient of friction, resulting in certain deviations.
3.2. Friction Coefficients of Different Types of Clothing
Unlike instability studies in a standing posture, Takahashi et al. [15] found that in a seated posture, the unit-width discharge (water depth × flow velocity) required for instability is lower than that for standing, which is consistent with Foster et al. [28], who concluded that among standing, walking, turning, and sitting behaviors, seated posture is the least stable. In reality, many casualties occur when pedestrians attempt to walk through water and accidentally lose balance due to other factors. However, past research has often overlooked the real-world scenario in which the human body must move and attempt self-rescue after instability.
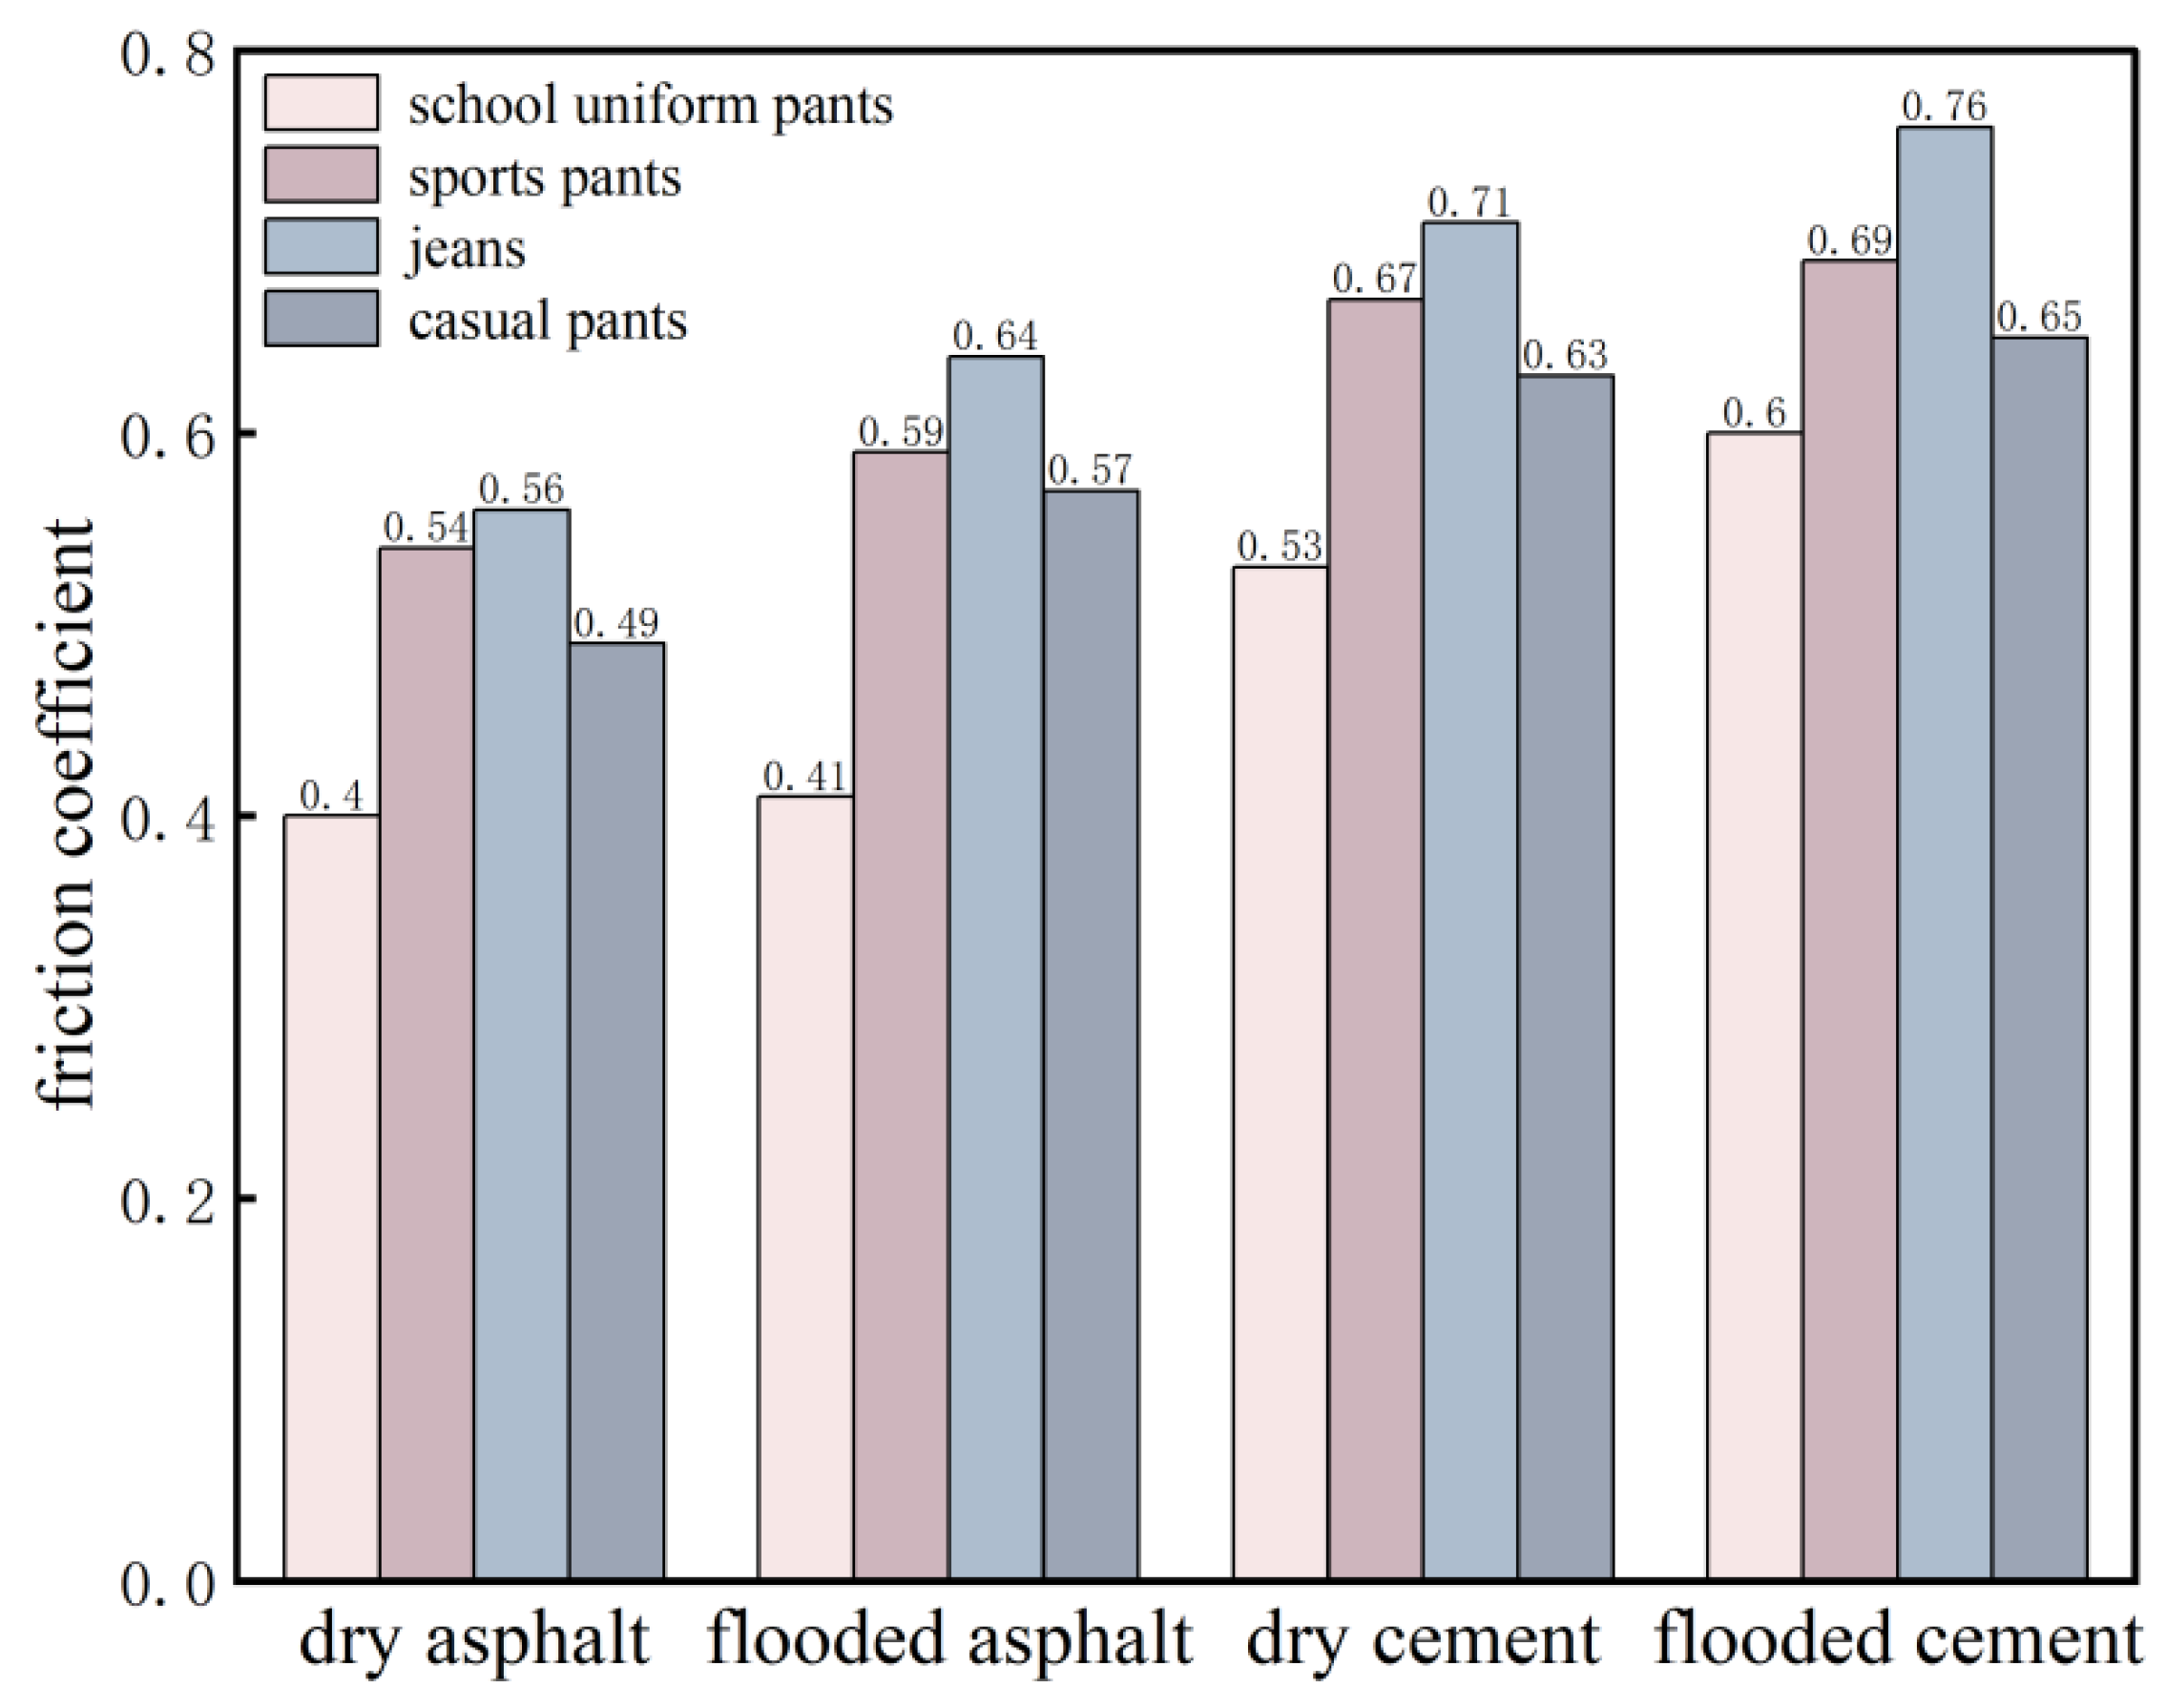
Guo et al. [29] defined the self-rescue process in pedestrian instability experiments as the action of returning to a standing posture after falling. Simulation experiments were conducted for four states—sitting, kneeling, squatting, and standing—and friction coefficients were obtained by dragging wet pants using a pulley system. To acquire more accurate friction coefficients post-instability, this study performed real-person experiments in water-logged conditions focusing on the kneeling posture from the postural decomposition. Test subjects wore specific pants during experimentation; after collecting friction data, average values were calculated as shown in Figure 7.
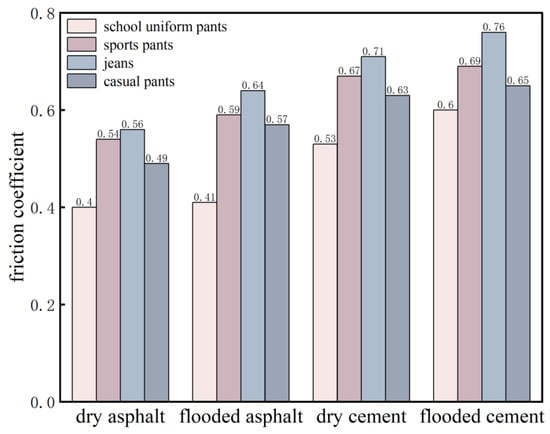
Figure 7.
Friction coefficients of four common types of pants under different road conditions.
After pedestrian instability occurs, the increase in the submerged body volume leads to a rise in buoyancy. Since the legs of pedestrians are in direct contact with the ground, the magnitude of the frictional force has a direct impact on their safety. Figure 7 shows that for all pant types, the friction coefficient under waterlogged conditions is greater than under dry conditions; in terms of pedestrian safety, glossy school uniform pants exhibit the lowest safety in flooded environments, while jeans show higher safety. Simultaneously, asphalt pavement safety under waterlogged conditions is significantly lower than cement pavement safety. Hydrophilic materials enhance friction performance in waterlogged environments through fiber swelling (increasing contact area) and synergistic effects of capillary adhesive forces and water-film tension, creating an anomalous “friction enhancement in water” effect; conversely, hydrophobic smooth materials experience instability traps dominated by hydrodynamic lubrication due to continuous water films isolating solid–solid contact. Pavement types regulate water films through microscopic morphology—cement’s uniform micro-protrusions promote water-film rupture, maintaining effective friction; asphalt’s deep-texture water retention exacerbates lubrication hazards. Table 4 lists the friction coefficients of four pant types measured under waterlogged conditions on asphalt and cement road surfaces, providing scientific data for subsequent pedestrian instability risk assessments and related studies.
Table 4.
Friction coefficients of four types of pants under waterlogged conditions on asphalt and cement road surfaces.
3.3. Relationship Between Pressure and Friction Coefficient
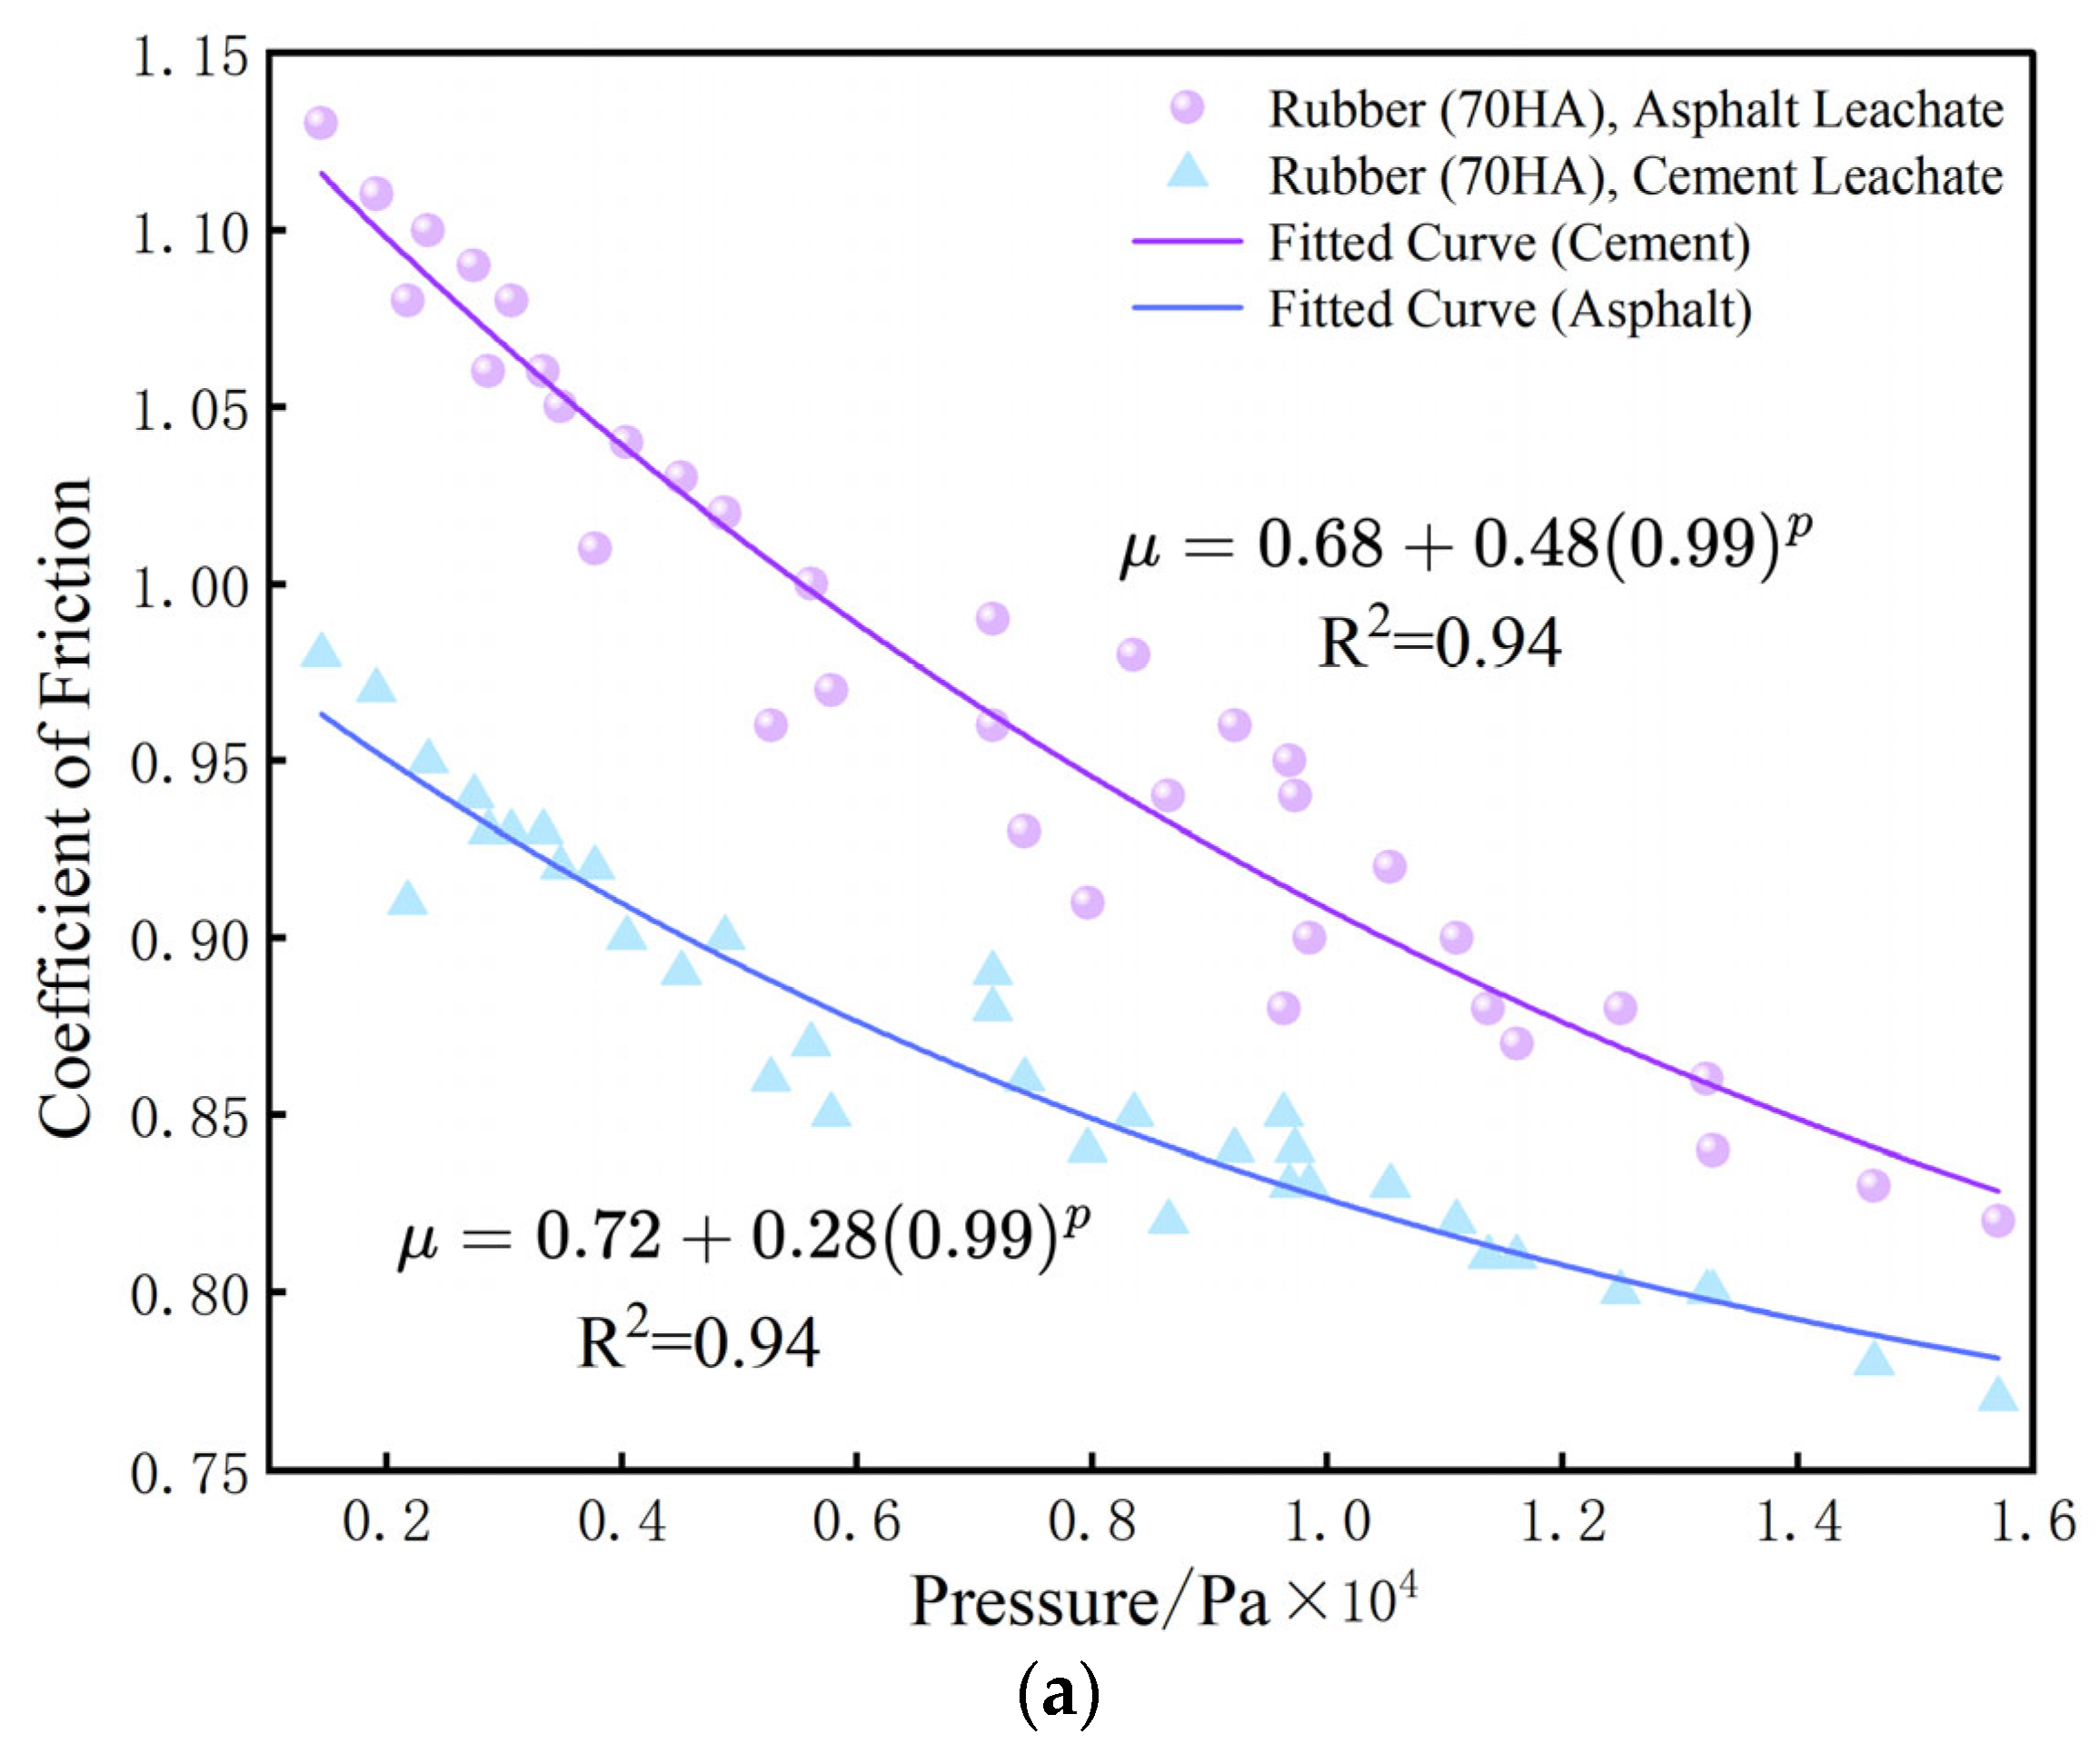
As water depth increases, buoyancy increases and gravity decreases, resulting in a reduction in the pressure exerted on the shoe contact surface. This pressure exhibits a certain relationship with the friction coefficient between rubber and asphalt or cement surfaces. This study conducted experimental research using a load-bearing steel trough with a human leg model to gather extensive data; the analysis and fitting are shown in Figure 8 below (Version 10.8.0.132, OriginLab Corporation, Northampton, MA, USA; https://www.originlab.com).

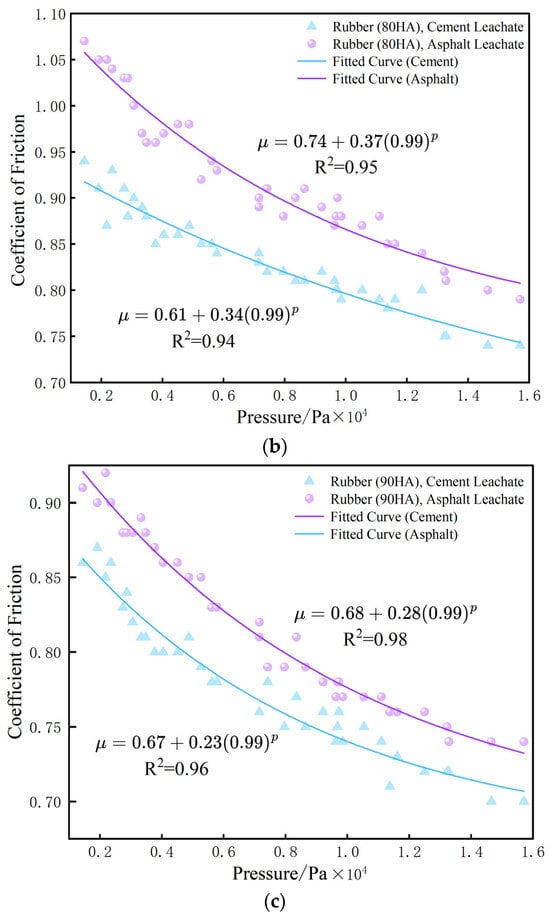
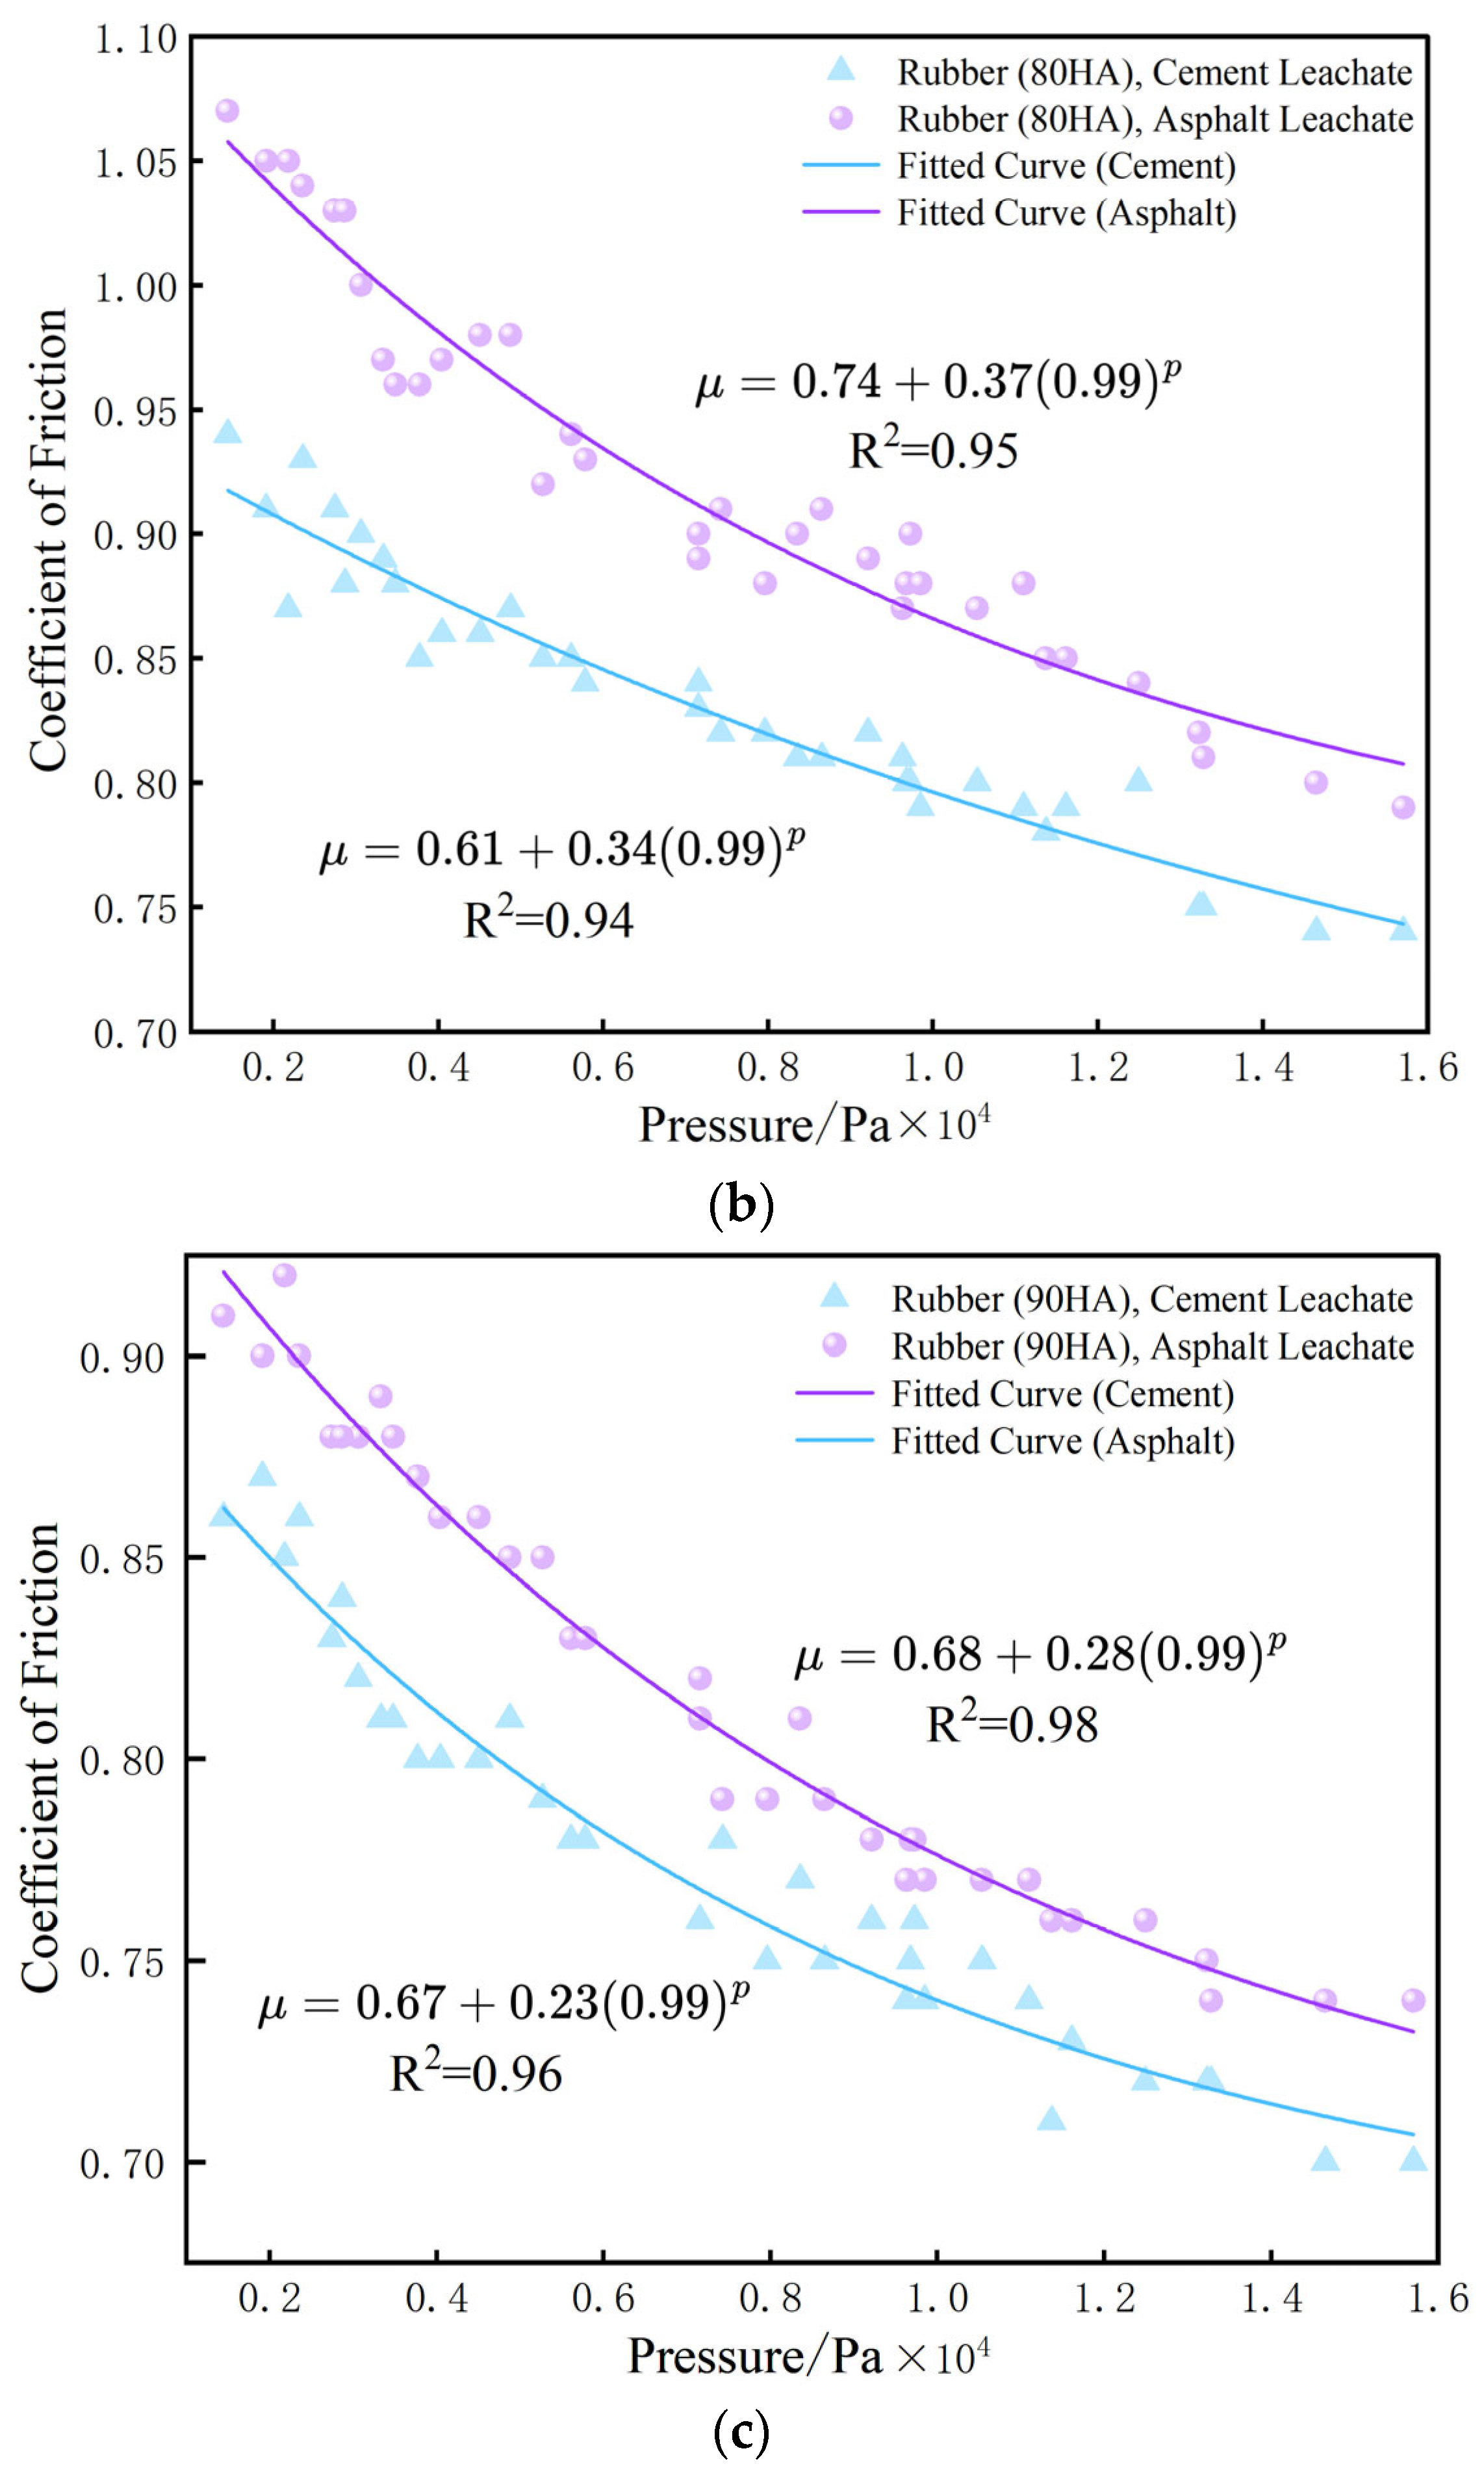
Figure 8.
(a) Fitting curves of the friction coefficient and pressure relationship for rubber hardness (70 HA) on asphalt and cement road surfaces. (b) Fitting curves of the friction coefficient and pressure relationship for rubber hardness (80 HA) on asphalt and cement road surfaces. (c) Fitting curves of the friction coefficient and pressure relationship for rubber hardness (90 HA) on asphalt and cement road surfaces.
Based on the analysis of the three figures above, as shown in Figure 8, each figure illustrates the variation of the friction coefficient of rubber with different hardness (70 HA, 80 HA, and 90 HA) under different pressures on cement and asphalt road surfaces. These curves all exhibit a nonlinear decline, indicating that the friction coefficient does not change in a simple linear fashion. The fitted curves all exhibit an exponential relationship, and the goodness of fit (R2 ≥ 0.94) is relatively high, suggesting that the data fit well. Regardless of whether the surface is asphalt or cement, the friction coefficient decreases with the increase in contact stress for all three hardness types of rubber. Grönqvist et al. [30] explained the phenomenon of friction coefficient reduction caused by increased walking pressure, suggesting that boundary lubrication effects may reduce the friction coefficient.
From the perspective of contact mechanics, the friction between a rubber shoe sole and a rough ground surface primarily originates from elastic deformation and adhesive forces at microscopic contact points. As vertical pressure increases, the rubber surface structure gradually becomes compacted; partial microscopic concave–convex morphologies are flattened or deformed, reducing the number of effective contact points per unit area. Although the overall contact area may slightly increase, its marginal increase amplitude declines, causing a reduction in friction force per unit pressure. Consequently, the friction coefficient exhibits a nonlinear decreasing trend. Secondly, rubber—as a typical viscoelastic material—exhibits frictional behavior containing energy dissipation components. Under larger pressure, the material’s recovery capacity weakens, hysteretic deformation decreases, and the viscoelastic energy-dissipation friction component diminishes, further reducing the friction coefficient. Additionally, water films impact frictional behavior: under low pressure, water films may be locally distributed, minimally affecting friction; under high pressure, water films become uniform, enhancing liquid lubrication, reducing solid–solid direct contact areas and suppressing friction force increase. This process accelerates the decline rate of the friction coefficient with pressure.
Integrating the above mechanisms, the relationship between friction coefficient and pressure demonstrates an exponential decay trend. This trend results not from a single variable but from the combined effects of rubber compaction effects, viscoelastic energy-dissipation mechanisms, and water-film redistribution. Although this exponential fitting model is empirical, it possesses physical foundations and can be regarded as a simplified empirical model for the “human—footwear—ground” friction system in urban waterlogged environments.
Among all three hardness types of rubber, the friction coefficient on the cement surface is generally higher than that on the asphalt surface, especially under lower pressures. Zhu et al. [31] suggested that the thickness of the water film significantly impacts the friction coefficient, and a thicker water film leads to a significant decrease in the friction coefficient. It can be seen that although the roughness of the asphalt surface is clearly higher than that of the cement surface, in a waterlogged condition, the asphalt surface has a higher roughness ratio. Excessively deep textures result in a thicker water film, which reduces friction, while the smoothness and uniform texture of the cement surface help to reduce the impact of the water film and maintain better friction. As pressure increases, the friction coefficient of both surfaces decreases, but the friction coefficient on the asphalt surface decreases more slowly under high pressure, whereas the friction coefficient on the cement surface decreases more rapidly. As the rubber hardness increases, the decline trend of both surfaces becomes similar. This phenomenon occurs because the asphalt surface is rougher and can provide more contact points, allowing the rubber to better adapt to the surface texture even under higher pressures, thereby maintaining higher friction. On the other hand, the cement surface is smoother, and the rubber cannot fully adapt to the surface’s microstructure under high pressure, resulting in a faster decrease in the friction coefficient.
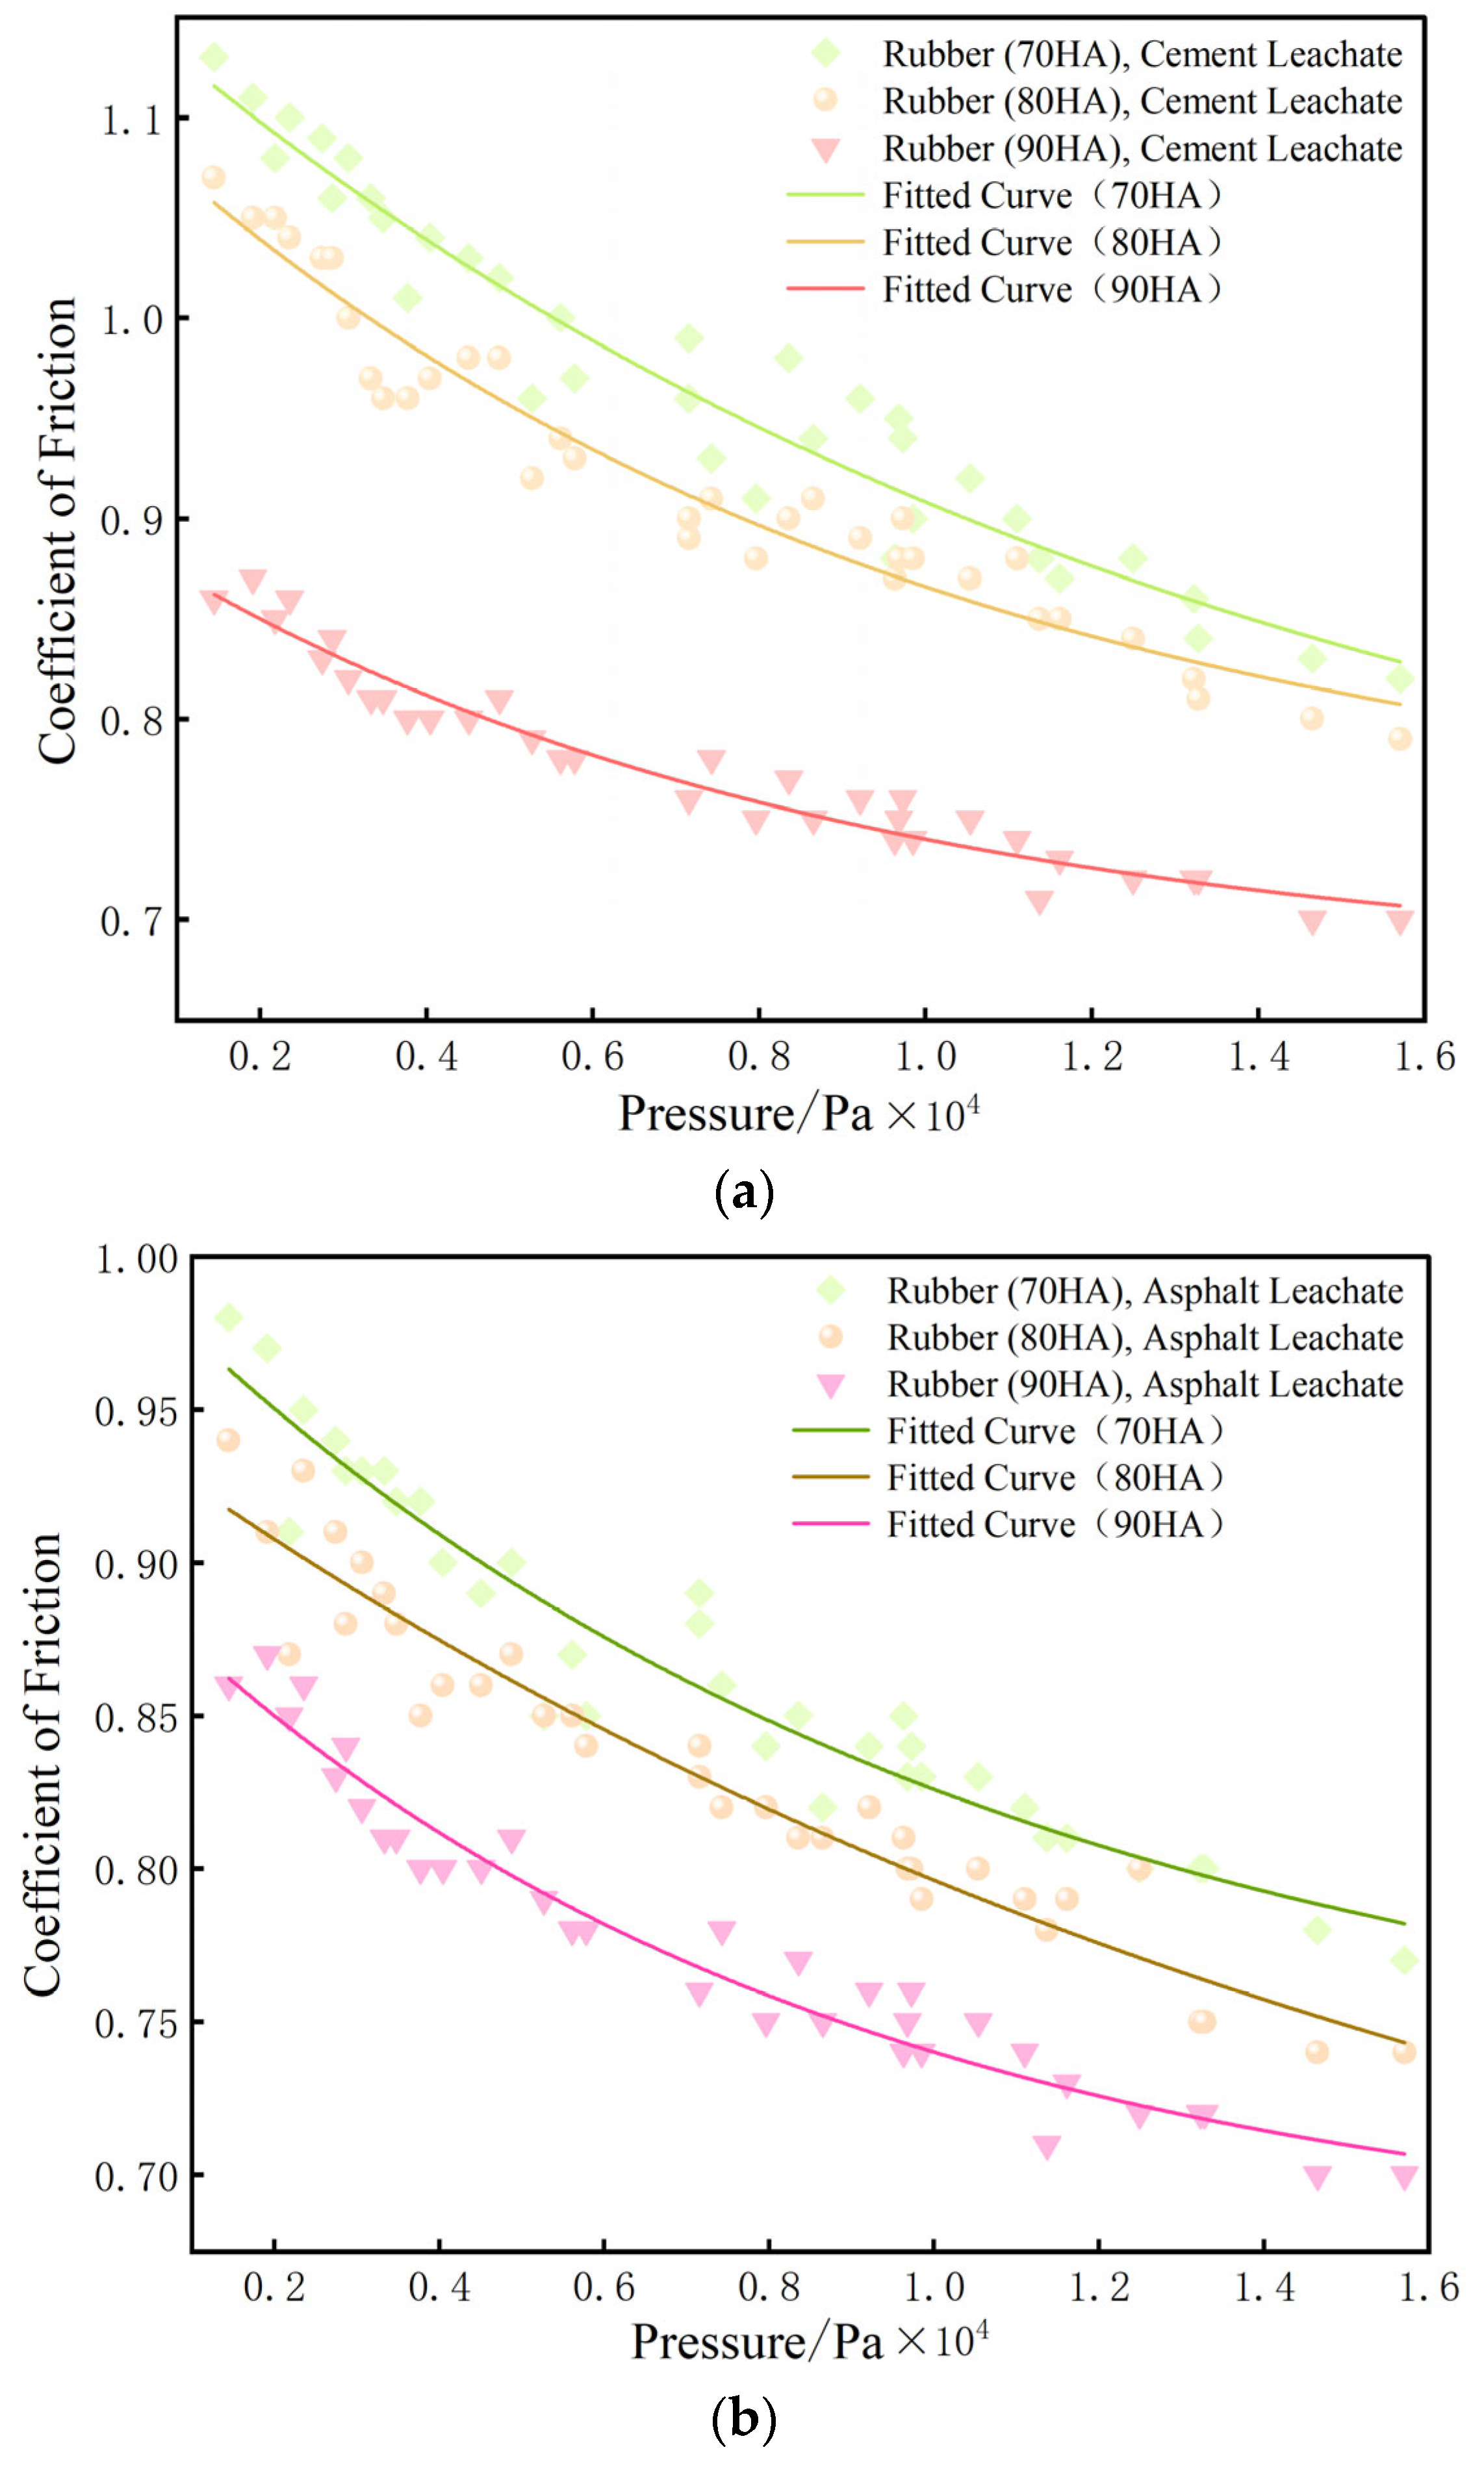
Integrating each rubber hardness on cement and asphalt surfaces as shown in Figure 9, it can be seen that both surfaces exhibit a relationship where the friction coefficient increases as the rubber hardness decreases. The negative correlation between rubber hardness and the friction coefficient originates from the synergistic effects of material mechanical properties and interfacial behavior. Lower-hardness rubber possesses stronger elastic deformation capacity, enabling full adaptation to pavement microscopic morphology and an increasing effective contact area; the high mobility of its polymer chain segments enhances viscoelastic energy dissipation, elevating the hysteretic friction component; in waterlogged environments, soft rubber’s localized stress concentration effects more readily disrupt interfacial water films, promoting solid–solid direct contact. These three factors collectively form an “contact–dissipation–penetration” enhancement chain, systematically improving friction performance as the hardness decreases. This provides a theoretical basis for the material design of flood pedestrian protective equipment.
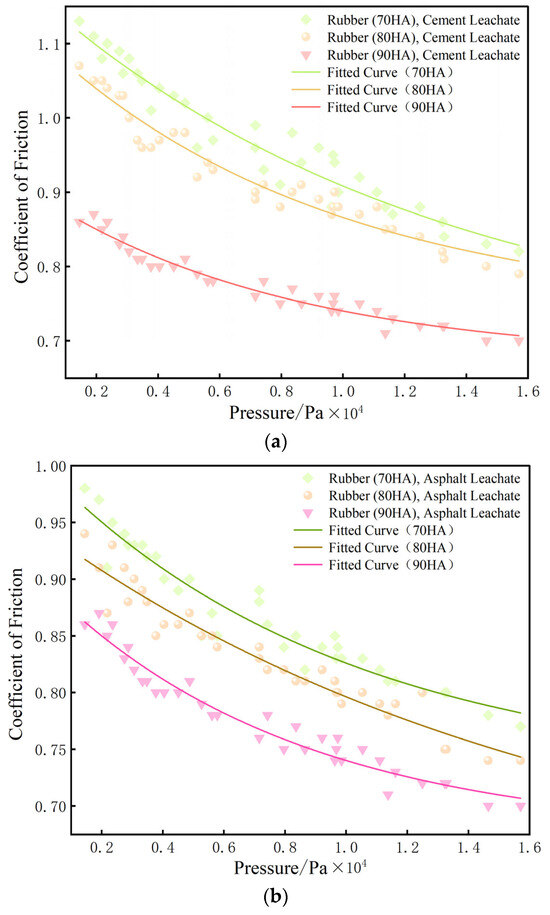
Figure 9.
(a) Fitting curves of friction coefficients for rubbers with different hardness on cement surfaces. (b) Fitting curves of friction coefficients for rubbers with different hardness on asphalt surfaces.
A deeper understanding of this relationship facilitates obtaining more scientifically accurate water-depth–flow-velocity data for pedestrian instability experiments; in pedestrian instability risk studies, water depth and flow velocity are primary research indicators; existing research commonly increases water depth and flow velocity until instability occurs, making the determination of the instability moment a critical step; historically, instability was typically recorded based on subjects’ perceived instability and visual observation of instability to document hydraulic conditions at the instability moment, but operational practice revealed significant errors; conversely, analyzing hydraulic forces—such as drag force and vertical force on pedestrians in water—to determine the instability moment is a more scientific approach; by combining force sensors and flow velocity/water depth sensors to acquire real-time data at instability, the friction coefficient becomes a key indicator; establishing the linkage variation relationship among buoyancy, pressure, and friction coefficient across water depths proves that friction coefficient measurement and selection require greater emphasis, while using a fixed friction coefficient for force analysis throughout the experiment introduces errors.
Incorporating the buoyancy–pressure relationship into empirical models of pedestrian instability risk aids in developing more scientific prediction tools, providing a theoretical basis for designing safer public spaces under flood and other waterlogged conditions; this creates prerequisites for dynamically adjusting friction coefficient estimates using real-time pressure monitoring data in the future, enabling more precise risk warnings and management measures; this methodology significantly enhances the scientific rigor and practical utility of pedestrian safety assurance, offering new technical support for urban flood disaster response. Table 5 summarizes the fitted relationships between the friction coefficient and pressure, offering a more scientific and accurate reference for selecting friction coefficients in the subsequent study of pedestrian instability risk thresholds. Through this fitted curve, it becomes possible to accurately capture the relationship between the friction coefficient and external pressure by considering both ground surface conditions and sole hardness under variable environmental circumstances, thus providing theoretical support for practical applications in predicting pedestrian instability risks.
Table 5.
Summary of the relationship between friction coefficients and pressure for rubber of different hardness (70 HA, 80 HA, and 90 HA) on cement and asphalt road surfaces.
4. Conclusions and Future Research Directions
4.1. Conclusions
This study focuses on experimental thresholds for pedestrian instability under urban flood conditions, with an in-depth investigation into one of the critical influencing factors—the friction coefficient. The following key conclusions have been drawn:
- (1)
- Friction Coefficient Measurement: Experiments determined that under waterlogged conditions, the friction coefficients for various shoe types and pants ranged from 0.59 to 0.80 and 0.53 to 0.76, respectively. In combinations of real-human testing, hydrophilic sole materials, and experimental pavement, the friction coefficient under waterlogged conditions was generally higher than under dry conditions. This result confirms that the traditional view—that the lubricating effect of water under wet conditions reduces the friction coefficient—is not absolute. Furthermore, this study innovatively measured the friction coefficient using resistance postures during floods, demonstrating that previous selections of friction coefficients at 0.3 or 0.4 yielded underestimated values.
- (2)
- Friction Coefficient Variation: In contrast to previous studies that adopted a fixed friction coefficient for the entire pedestrian instability analysis, this research experimentally analyzed the effects of rubber hardness and load. Results indicate a clear trend: the greater the rubber hardness, the lower the friction coefficient. A dynamic process was observed where the friction coefficient decreases as the applied load increases. Consequently, we propose that future pedestrian instability risk assessments should dynamically select the friction coefficient by accounting for multiple influencing factors such as pressure and water depth, rather than relying on a single static value.
- (3)
- Friction Coefficient Selection Method: For the first time, buoyancy was incorporated into the friction coefficient selection framework. By referencing national human body standards to determine pressure ranges and analyzing the relationships between rubber hardness, two typical urban pavement types, and pressure levels, this study established exponential equations expressing the correlation between pressure and the friction coefficients for three types of rubber (70 HA, 80 HA, and 90 HA) on both asphalt and cement surfaces. These equations allow future researchers to consider key parameters—pavement type, sole hardness, and pressure at varying water depths—to dynamically select an appropriate friction coefficient. This advancement is expected to significantly improve the accuracy and reliability of pedestrian instability risk analysis.
4.2. Safety Protection Recommendations Based on Research Findings
The pedestrian instability mechanisms revealed by this study propose a three-tiered protection strategy for urban disaster prevention systems:
- (1)
- Innovation in Personal Protective Equipment: During rainstorms, the public should select hydrophilic-material footwear and clothing (e.g., cotton jeans and rubber-soled anti-slip shoes). The capillary adhesion force generated upon water contact significantly enhances ground stability. Shoe soles should prioritize medium-hardness rubber (tactile flexibility), which optimally maintains friction performance under varying water pressure. Avoid daily wear of hydrophobic smooth materials (e.g., synthetic fiber school pants and plastic clogs), as these materials readily induce fluid lubrication leading to slippage.
- (2)
- Proactive Modification of High-Risk Environments: Municipal departments should prioritize modifying flood diversion channels: permeable pavements (e.g., porous asphalt) accelerate surface-water recession, shortening the duration of buoyancy hazards; texture optimization (e.g., micro-grooving on cement surfaces) disrupts continuous water film formation, maintaining effective interfacial friction. Renovation projects should focus on accident-prone areas (e.g., underpasses and sunken bridge zones) to establish “sponge-type disaster prevention corridors”.
- (3)
- Upgraded Intelligent Emergency Response: Establish a buoyancy-aware early warning system that dynamically assesses slip risk through real-time calculation of pedestrians’ effective plantar pressure (offsetting buoyancy effects). When the monitored water depth exceeds critical thresholds, issue tiered alerts to the public:“Yellow Alert” (recommend detouring low-lying sections) → ”Red Alert” (prohibit wading through water).
This system can integrate with urban flood monitoring platforms to achieve coordinated “human-water-ground triaxial risk management”.
4.3. Future Research Directions
While the present study offers a systematic exploration of how basic materials such as rubber influence the friction coefficient and provides a quantitative analysis centered on asphalt and cement surfaces, there remain several limitations and promising directions for further research:
- (1)
- Future research requires in-depth coupling analysis of surface roughness and wear state for identical road materials: Prepare multi-level roughness specimens through differential processes (e.g., asphalt embossing/exposed aggregate cement), establishing a macro-meso morphological parameter system; simulate wheel rolling compaction and natural aging to quantify roughness attenuation caused by wear and its effect on thickening interfacial water films; develop a “initial roughness-wear progression-water film dynamics-friction coefficient” decay prediction model. Subsequently, propose the minimum roughness threshold ensuring pedestrian safety and critical pore clogging rate for permeable pavements, providing specifications for road design and maintenance in flood-prone areas.
- (2)
- Research on Multi-Control Parameter Collaborative Optimization: While existing experiments have addressed the impact of sole hardness, systematic investigations into sole tread design (e.g., groove depth, density, and orientation), material diversity (e.g., polyurethane, EVA foam, and TPU composites), and wear state remain insufficient. Subsequent studies should design orthogonal experiments to quantify the influence of geometric tread parameters (e.g., aspect ratio and curvature radius) on water film rupture capacity and contact area, employing high-speed imaging technology to capture microscopic contact behavior between soles and pavement under dynamic loading. Concurrently, measurements of water film thickness and contact angle will yield data with enhanced applicability.
- (3)
- Dynamic Load and Multi-Physics Coupling Mechanism Analysis: The current pressure testing is based on a static model and does not account for the spatiotemporal variation of plantar pressure during the gait cycle (e.g., differences between heel strike and toe-off phases). Future work should combine biomechanical simulation with pressure sensor arrays to develop a dynamic model linking gait, pressure, and friction coefficients. In addition, the coupling effects between hydrodynamic forces—such as water flow impact and vortex-induced disturbances—and frictional forces should be examined to better capture the transient instability processes experienced by pedestrians during urban flooding.
Author Contributions
Conceptualization, J.G.; Data curation, J.G.; Formal analysis, J.G. and H.W.; Funding acquisition, J.L.; Methodology, J.G. and X.L.; Project administration, X.L.; Software, J.G.; Supervision, J.L., X.L., D.L. and H.W.; Validation, J.G.; Visualization, J.G.; Writing—original draft, J.G.; Writing—review and editing, J.G., Y.W. and Q.S. All authors have read and agreed to the published version of the manuscript.
Funding
This work was supported by the National Natural Science Foundation of China (52370093).
Data Availability Statement
The original contributions presented in this study are included in the article. Further inquiries can be directed to the corresponding author.
Conflicts of Interest
The authors declare no conflicts of interest.
References
- Lu, T.; Cui, X. Comparative Observation of Two Severe Rainstorms in Beijing. Atmos. Sci. 2022, 46, 111–132. [Google Scholar]
- Liu, J.; Liu, J.; Pei, Y.; Mei, C. Causes and Disaster Prevention of “7·20” Heavy Rainstorm and Waterlogging in Zhengzhou. J. Zhengzhou Univ. (Eng. Ed.) 2023, 44, 38–45. [Google Scholar]
- Tascón-González, L.; Ferrer-Julià, M.; Ruiz, M.; García-Meléndez, E. Social Vulnerability Assessment for Flood Risk Analysis. Water 2020, 12, 558. [Google Scholar] [CrossRef]
- Salazar-Briones, C.; Ruiz-Gibert, J.M.; Lomelí-Banda, M.A.; Mungaray-Moctezuma, A. An Integrated Urban Flood Vulnerability Index for Sustainable Planning in Arid Zones of Developing Countries. Water 2020, 12, 608. [Google Scholar] [CrossRef]
- Metangley, S.; Middey, A.; Kadaverugu, R. Modern methods to explore the dynamics between aerosols and convective precipitation: A critical review. Dyn. Atmos. Oceans 2024, 106, 101465. [Google Scholar] [CrossRef]
- Zhu, J.; Zhou, W.; Wang, W. Block-level spatial integration of population density, social vulnerability, and heavy precipitation reveals intensified urban flooding risk. Sustain. Cities Soc. 2024, 117, 105984. [Google Scholar] [CrossRef]
- Pickering, N.; Nassiri, S. Stormwater management and roadways. In Oxford Research Encyclopedia of Environmental Science; Oxford Research Encyclopedias: Oxford, UK, 2021. [Google Scholar]
- Bernardini, G.; Romano, G.; Soldini, L.; Quagliarini, E. How Urban Layout and Pedestrian Evacuation Behaviours Can Influence Flood Risk Assessment in Riverine Historic Built Environments. Sustain. Cities Soc. 2021, 70, 102906. [Google Scholar] [CrossRef]
- Zhu, Z.; Gou, L.; Liu, S.; Peng, D. Effect of Urban Neighbourhood Layout on the Flood Intrusion Rate of Residential Buildings and Associated Risk for Pedestrians. Sustain. Cities Soc. 2023, 92, 104485. [Google Scholar] [CrossRef]
- Wang, W.; Li, Y.; Zhang, Y.; Wu, Z. Pedestrian Evacuation Planning under Dam-Break Flood Disaster Considering Road Risk and Road Pedestrian Demand. Int. J. Disaster Risk Reduct. 2024, 104, 104355. [Google Scholar] [CrossRef]
- Xia, J.; Falconer, R.A.; Wang, Y.; Xiao, X. New Criterion for the Stability of a Human Body in Floodwaters. J. Hydraul. Res. 2014, 52, 93–104. [Google Scholar] [CrossRef]
- Jonkman, S.N.; Penning-Rowsell, E. Human Instability in Flood Flows. JAWRA J. Am. Water Resour. Assoc. 2008, 44, 1208–1218. [Google Scholar] [CrossRef]
- Yee, M. Human Stability in Floodways. Ph.D. Thesis, University of New South Wales, Sydney, Australia, 2003. [Google Scholar]
- Keller, R.J.; Mitsch, B. Safety Aspects of Design Roadways as Floodways; Research Report, No. 69; Urban Water Research Association of Australia: Melbourne, Australia, 1993; p. 51. [Google Scholar]
- Takahashi, S.; Endoh, K.; Muro, Z.I. Experimental Study on People’s Safety Against Overtopping Waves on Breakwaters. Port Harb. Inst. Rep. 1992, 34, 4–31. [Google Scholar]
- Martínez-Gomariz, E.; Gómez, M.; Russo, B. Experimental Study of the Stability of Pedestrians Exposed to Urban Pluvial Flooding. Nat. Hazards 2016, 82, 1259–1278. [Google Scholar] [CrossRef]
- Zhu, Z.; Zhang, Y.; Gou, L.; Peng, D.; Pang, B. On the Physical Vulnerability of Pedestrians in Urban Flooding: Experimental Study of the Hydrodynamic Instability of a Human Body Model in Floodwater. Urban Clim. 2023, 48, 101420. [Google Scholar] [CrossRef]
- Guo, X.; Wang, W.; Fang, X.; Gong, Y.; Li, J.; Wang, M.; Li, X. Analysis of Self-Rescue Possibilities for Pedestrians in the Aftermath of Destabilization during a Flood Event. Water 2024, 16, 1218. [Google Scholar] [CrossRef]
- He, X.; Wang, Y. Preliminary Measurement and Discussion on the Friction Coefficient of Anti-Slip Shoes. Qual. World 2002, 6, 49. [Google Scholar]
- Liu, L.; Li, K.W.; Lee, Y.H.; Chen, C.C.; Chen, C.Y. Friction Measurements on “Anti-Slip” Floors under Shoe Sole, Contamination, and Inclination Conditions. Saf. Sci. 2010, 48, 1321–1326. [Google Scholar] [CrossRef]
- Derler, S.; Gerhardt, L.C. Tribology of Skin: Review and Analysis of Experimental Results for the Friction Coefficient of Human Skin. Tribol. Lett. 2012, 45, 1–27. [Google Scholar] [CrossRef]
- Ye, Z. Study on Experimental Methods for Slip Resistance Performance of Footwear. Chin. Pers. Prot. Equip. 2013, 4, 35–38. [Google Scholar]
- China Steel Group Wuhan Safety and Environmental Protection Research Institute Co., Ltd.; National Labor Protection Products Quality Supervision and Testing Center (Wuhan); Dongguan Xinhuhui Industrial Co., Ltd.; Hunan Valin Xiangtan Iron and Steel Co., Ltd.; Yangzhou Jianbu Footwear Co., Ltd.; Intertek (Guangzhou) Quality Technology Service Co., Ltd.; Qingdao Shanfang Instrument Co., Ltd. Test Method for Slip Resistance of Foot Protection Shoes; General Administration of Quality Supervision: Beijing, China; Inspection and Quarantine of the People’s Republic of China: Beijing, China; Standardization Administration of China: Beijing, China, 2012; p. 20.
- GB/T 10000-2023; Chinese Adult Anthropometric Dimensions. China National Institute of Standardization (CNIS): Beijing, China, 2023.
- GB/T 26158-2010; Chinese Minor Anthropometric Dimensions. China National Institute of Standardization (CNIS): Beijing, China, 2010.
- Xia, J.Q.; Gu, A.C.; Shu, C.W.; Guo, P. Theoretical Analysis and Experimental Study on Human Stability Conditions in Floods. Disaster Sci. 2014, 29, 4–11. [Google Scholar]
- Barquins, M.; Roberts, A.D. Rubber Friction Variation with Rate and Temperature: Some New Observations. J. Phys. D Appl. Phys. 1986, 19, 547. [Google Scholar] [CrossRef]
- Foster, D.N.; Cox, R.J. Stability of Children on Roads Used as Floodways; University of New South Wales, Water Research Laboratory: Beijing, China, 1973; Volume 73, p. 12. [Google Scholar]
- Guo, X. Study on Human Stability under Urban Road Flooding Conditions and Development of Risk Early Warning Equipment. Master’s Thesis, Beijing University of Civil Engineering and Architecture, Beijing, China, 2024. [Google Scholar]
- Grönqvist, R. Mechanisms of Friction and Assessment of Slip Resistance of New and Used Footwear Soles on Contaminated Floors. Ergonomics 1995, 38, 224–241. [Google Scholar] [CrossRef] [PubMed]
- Zhu, X.; Yang, Y.; Zhao, H.; Jelagin, D.; Chen, F.; Gilabert, F.A.; Guarin, A. Effects of Surface Texture Deterioration and Wet Surface Conditions on Asphalt Runway Skid Resistance. Tribol. Int. 2021, 153, 106589. [Google Scholar] [CrossRef]

Disclaimer/Publisher’s Note: The statements, opinions and data contained in all publications are solely those of the individual author(s) and contributor(s) and not of MDPI and/or the editor(s). MDPI and/or the editor(s) disclaim responsibility for any injury to people or property resulting from any ideas, methods, instructions or products referred to in the content. |
© 2025 by the authors. Licensee MDPI, Basel, Switzerland. This article is an open access article distributed under the terms and conditions of the Creative Commons Attribution (CC BY) license (https://creativecommons.org/licenses/by/4.0/).