Article

Formation and Toxicity of Chlorine Species During Zeolite Regeneration by NaCl-NaClO After Stormwater Adsorption

Department of Environmental Science and Engineering, Fudan University, Shanghai 200433, China
*
Author to whom correspondence should be addressed.
Water 2025, 17(13), 1955; https://doi.org/10.3390/w17131955
Submission received: 17 April 2025 / Revised: 20 June 2025 / Accepted: 23 June 2025 / Published: 30 June 2025

Abstract

Zeolite adsorption followed by NaCl-NaClO regeneration is an effective method for the on-site treatment of ammonia in initial stormwater. However, the formation and toxicity of chlorine species during the zeolite regeneration process need to be investigated. In this study, under intermittent and continuous operations, zeolites adsorbed NH4Cl + HA (humic acid) and actual stormwater, then regenerated with NaCl-NaClO (0.5 g/L NaCl, ClO:N molar ratio of 1.8, pH = 10). This technology was assessed from the following three aspects: adsorption and regeneration, chlorine species formation, and toxicity. The results showed that zeolites exhibited a greater adsorption capacity for HA in stormwater compared to that in an NH4Cl + HA solution, and the presence of ammonia had a minimal impact on this process. During zeolite regeneration, ammonia had a competitive advantage over HA for ClO. ClO3 was inevitably formed in regeneration. The formation of chlorinated organic compounds (COPs) increased over time. The order of chlorine species toxicity in zeolite regeneration solution was free chlorine > COPs > ClO3. Controlled regeneration time was required to minimize the formation and toxicity of chlorine species. During the 10 cycles of regeneration, chlorine species continued to form and caused high toxicity hazards.

1. Introduction

Climate change and the acceleration of urbanization have increased the proportion of impervious surface area, leading to a gradual increase in surface stormwater runoff [1]. The initial stormwater runoff is an important contributor to quality degradation in the receiving water, which flushes pollutants off the surface and shows relatively high contaminant levels [2,3]. Typical water quality parameters of initial stormwater runoff are as follows: suspended solids (SS) ranging from 36 mg/L to 968 mg/L, chemical oxygen demand (COD) from 45 mg/L to 1178 mg/L, and ammonia content ranging from 1.1 mg/L to 15.95 mg-N/L [4,5,6]. These parameters significantly surpass the limits of Grade IV in the Environmental Quality Standards for Surface Water of China (COD ≤ 30 mg/L, ammonia ≤ 1.5 mg-N/L) [7], which have been adopted as a pollution discharge standard for many receiving waters. Due to the high flow rate and short duration of stormwater runoff, it is essential to explore efficient and safe on-site treatments as opposed to large-scale centralized biological treatments, so as to protect the receiving water and enhance the reuse of the stormwater resource.
Coagulation–precipitation is the most widely adopted treatment process for initial stormwater runoff [8]. This process usually achieves removal efficiencies of over 90% for SS and 40–90% for COD [9,10], but the removal efficiency of total nitrogen (TN), especially soluble ammonia, is less satisfactory, with removal efficiencies ranging from only 5 to 30% for TN and 5 to 20% for ammonia [11]. Stormwater denitrification is a research focus [12,13,14], with bioretention systems such as rain gardens, biofiltration systems, and green roofs applied as on-site stormwater treatments in some areas. Due to the specific adsorption capacity of zeolites for ammonia, they can remove ammonia from stormwater effectively. NaCl-NaClO is capable of converting ammonia to N2 and regenerating zeolites more successfully than NaClO, making zeolite adsorption followed by regeneration with NaCl-NaClO a suitable method for the on-site removal of ammonia in initial stormwater runoff [15,16]. Although the adsorption capacity of zeolite for organic matter is not as good as that for other materials like activated carbon, it is still capable of adsorbing a significant portion of natural organic matter (NOM) from wastewater through mechanisms such as hydrogen bonding, hydrophobic interaction, and partitioning mechanism [17,18,19]. Consequently, NOM is engaged in subsequent treatment processes. It has been confirmed that the reaction between organic matter and NaClO results in the formation of chlorinated organic compounds (COPs) [20,21], which are known for their carcinogenic, teratogenic, and mutagenic effects, posing irreversible risks to human health [22]. During the regeneration process, various active inorganic chlorine species (AICS) such as ClO, chlorite (ClO2), chlorate (ClO3), and perchlorate (ClO4) may undergo transformations. It has been reported that ClO3 can inhibit the absorption of iodine, leading to thyroid diseases and causing chromosomal and DNA damage in humans, plants, and animals [23]. Because of the high toxicity of chlorine species, the World Health Organization (WHO) and the United States Environmental Protection Agency (U.S. EPA) have established strict limits for several of them. However, some nitrogen-containing chlorine species, such as haloacetonitriles (HANs), haloacetamides (HAMs), and halonitromethanes (HNMs), pose a greater toxicity hazard and have yet to be regulated [24]. These substances account for 94% of the nitrogenous organic by-products in chlorination disinfection and pose non-negligible environmental risks [25,26].
Initial stormwater runoff is a complex mixture. While zeolites remove ammonia in stormwater, they also adsorb some of the organics and carry them into the regeneration process. Current research on the regeneration of zeolites using NaCl-NaClO is limited, primarily focusing on factors that affect regeneration efficiency, such as solution concentration ratio, pH, and time [27,28]. There have been relatively few studies on the application of stormwater for continuous operation. The disposal methods for the reclaimed solution after use mainly include direct discharge, recycling [29], or simply neutralizing to control the chlorine concentration [30]. However, few studies have focused on the zeolite adsorption of organic matter in stormwater and the formation and toxicity of chlorine species in the regeneration process. Chlorine species cause damage to aquatic ecosystems and affect biodiversity and human health. They are important determinants of whether stormwater can be safely reused as an alternative water source [31]. Therefore, this technology should consider biosafety under long-term operation and seek optimized ways to minimize the impacts of toxicity, in addition to focusing on extending the service life of zeolite.
In this study, zeolites were used to adsorb NH4Cl + HA solution and stormwater, followed by NaCl-NaClO regeneration treatment. Concerning the adsorption process, the zeolite absorption capacity for ammonia and HA was investigated using NH4Cl + HA solution and stormwater in both intermittent and continuous operations. Combined with the chlorination reaction, the competition of ammonia and HA for ClO in the zeolite regeneration process was explored. Adsorbed zeolites were subsequently regenerated using NaCl-NaClO solution, consisting of 0.5 g/L of NaCl combined with ClO: N (adsorbed N in zeolite) in a molar ratio of 1.8 (pH = 10). This study quantified the levels of AICS and COPs in the four sets. Subsequently, the algal acute toxicity test and acute toxicity calculation were performed to evaluate the toxicity of regeneration solutions. The contribution of each chlorine species to the toxicity was investigated. Finally, changes in the adsorption and regeneration performance, chlorine species, and toxicity during 10 cycles were investigated. This study provides a data reference for the technology selection and optimization of on-site stormwater treatment, which enhances the sustainable development of stormwater treatment.

2. Materials and Methods

2.1. Materials

Zeolite was a natural clinoptilolite from Chengde, Hebei, China, with a particle size of 1–3 mm. It was a commercial-grade product supplied by the GTSS Group (Beijing, China). Its main components were 68.30% SiO2, 13.39% Al2O3, 3.42% CaO, 0.71% MgO, 2.92% K2O, and 1.25% Na2O. Before use, zeolites were washed three times with deionized water and then dried in an oven at 105 °C [11]. Sodium hypochlorite solution was purchased from Sinopharm (Shanghai, China), which was chemically pure, and its available chlorine content was 5.0%. Humic acid was purchased from Aladdin (Shanghai, China). Laboratory analytical water was deionized water obtained from a Milli-Q pure water system. Other chemicals were purchased from Sinopharm (Shanghai, China), and the purity was analytical grade or HPLC grade.

2.2. Experimental Water

2.2.1. Solution

Humic acid (HA) is a typical organic matter in initial stormwater [32]. Figure S1 shows the three-dimensional excitation–emission matrix (3D-EEM) spectra of actual initial stormwater before and after coagulation–precipitation. Humic substances (Ex/Em = 320/445 nm) were detected in the treated stormwater. Therefore, HA was selected as a representative organic compound of stormwater. Based on the water quality parameters of actual stormwater after coagulation–precipitation, as shown in Table 1, the following solutions were prepared: NH4Cl solution (10 mg-N/L), HA solution (DOC = 10 mg/L), and NH4Cl + HA solution (10 mg-N/L, DOC = 10 mg/L, as simulated stormwater), with a pH of 7.5.

2.2.2. Stormwater

The raw initial stormwater was collected from the sump of a stormwater pumping station located in the center of Shanghai, China. Sampling was conducted during a significant rainfall event in June 2023 (rainfall intensity ≥ 15 mm/h), with the pumping station collecting surface runoff from the first 30 min of the initial stormwater using an automatic sampler. After coagulation–precipitation, the supernatant was used as the stormwater in this study. The coagulation–precipitation conditions were based on the optimal scheme recommended in previous reports [16,33], as detailed in Text S1. The parameters of stormwater are shown in Table 1. The concentrations of primary pollutants are within the typical range for initial stormwater, demonstrating the representativeness of the sampling results.

2.3. Zeolite Adsorption and Regeneration

2.3.1. Intermittent Operation

In each of four 5 L conical flasks, 120 g of zeolites was combined with 3 L of one of the following solutions: NH4Cl solution, HA solution, NH4Cl + HA solution, or stormwater. These flasks were placed on magnetic stirrers at 150 rpm for 24 h to reach adsorption equilibrium. Subsequently, the zeolites were separated and washed three times with distilled water to eliminate residual solutes [27,34], ensuring minimal interference in subsequent regeneration efficiency calculations and byproduct analysis during regeneration. The regeneration solution was determined to be NaCl-NaClO (0.5 g/L NaCl, ClO:N molar ratio of 1.8, pH = 10), which was selected based on previously reported optimal conditions and to avoid influence on the analysis of organic matter [28]. Each batch of washed zeolites was transferred into a conical flask containing 3 L of regeneration solution and stirred at 150 rpm for 1 h. After regeneration, the zeolites were separated and immersed in 300 mL of HCl solution (pH = 0.5) for 2 h under stirring. Zeolite regeneration efficiency (ZRE) and nitrogen removal efficiency (NRE) were calculated according to Text S2.
All experiments were conducted at 20–25 °C. In the preliminary test phase, stirring a blank sample (NaClO only) at 150 rpm for 1 h reduced the effective chlorine concentration to below 0.5%. Therefore, the influence of environmental temperature and stirring intensity on zeolite regeneration performance could be ignored.

2.3.2. Continuous Operation

The adsorption column with an inner diameter of 1.1 cm, a length of 30 cm, and a filling height of 15 cm was prepared. The NH4Cl + HA solution and stormwater were pumped into the column from the bottom to the top at a rate of 4 mL/min, respectively. The breakthrough point was defined as 1.5 mg-N/L, according to the limit of Grade IV (GB3838-2002), while Ct/C0 = 90% was regarded as the adsorption endpoint. Upon reaching the endpoint, the flow was halted, and the remaining liquid in the column was emptied. Then, the column was connected to a bottle containing 500 mL of regeneration solution. Using a peristaltic pump, the regeneration solution was circulated through the column at a rate of 100 mL/min in a closed-loop system, with the effluent continuously returning to the reservoir. The continuous adsorption capacity of zeolite for ammonia and DOC was calculated by the following Equation (1):
q e = Q m t = 0 t = t e C 0     C t d t
where Q is the inlet flow rate (L/h); m is the mass of the filled zeolites (g); t is the adsorption time (h); te is the time of the adsorption endpoint (h); Ct is ammonia or DOC concentration in column inlet and outlet at t (mg/L).

2.4. Acute Toxicity Analysis Methods

2.4.1. Algal Acute Toxicity Test

The algal acute toxicity test was conducted according to the Organization for Economic Co-operation and Development (OECD) Guideline 201 [35]. Microcystis aeruginosa FACHB 905 (FACHB-Collection, Wuhan, China) was selected as the test organism. The experimental method referred to Li and Cui et al. [36,37]. The percent inhibition of specific growth rate (Ir%) was used as an indicator to evaluate the relative toxicity of samples, calculated by Equations (2) and (3). Detailed procedures are provided in Text S3. The equations are shown as follows:
μ = ln X 2 ln X 1 t 2   -   t 1
I r = μ c   -   μ T μ c     ×   100 %
where X1 and X2 are the optical densities of the algal culture at times t1 and t2, respectively. μc and μT represent the algal specific growth rates of the control and experimental sets, respectively (d−1).

2.4.2. Acute Toxic Calculation Analysis

In the toxicity assessment, the median effect concentration (EC50) and median lethal concentration (LC50) are key indicators of chemical toxicity. The toxic contribution of individual chlorine species is quantified as their concentration divided by the corresponding toxicological threshold (EC50 or LC50). The total toxic equivalent of AICS or COPs is calculated by summing the contribution values of all chlorinated species present, as shown in Equation (4) [38]. Considering the comprehensiveness and accuracy of the toxicity data, measured EC50 (72 h) for green algae (Cyanophyta) and LC50 (96 h) for fish (Oncorhynchus mykiss) from the ECOTOX toxicity database published by the U.S. EPA were used for the toxicity calculation of AICS. The LC50 (72 h) for Chinese hamster ovary (CHO) cell that had been reported [39], EC50 (72 h) for green algae, and LC50 (48 h) for daphnia predicted by the Ecological Structure Activity Relationship (ECOSAR) model and LC50 (96 h) for fish from ECOTOX were used for COP evaluation. The complete data are provided in Table S1. Equation (4) is shown as follows:
Toxicity   equivalent   = i = 1 n (   c i LC 50 i or   EC 50 i   )  
where c i (mg/L) and LC 50 i or   EC 50 i (mg/L) represent an individual chlorine species concentration and its corresponding LC50 or EC50 for given test organisms.

2.5. Analytical Methods

All the water samples were filtered through a 0.45 μm polyethersulfone membrane. DOC and TN were measured by a DOC analyzer (DOC-l, Shimadzu Corporation, Kyoto, Japan). pH was measured using a pH meter (Sartorius PB-10, Niedersachsen, Germany). Protein and humic acid were determined with the Lowry method [40]. Polysaccharide was measured using the anthrone colorimetric method [41]. COD, SCOD, ammonia, NO2, and SS were assessed according to the standard methods of the American Public Health Association (APHA) [42]. Cl and NO3 were analyzed by ion chromatography (ICS900, AS16 column, Thermo Fisher Scientific, Waltham, MA, USA). Alkalinity was determined by titration. Turbidity was measured with a portable turbidimeter (2100Q, Hach, Loveland, CO, USA).
AICS analysis: AICS included free chlorine, ClO2, ClO3, and ClO4. A 10 mL sample was filtered through a 0.45 μm membrane, and the free chlorine and chloramine were measured by N, N-diethyl-p-phenylene diamine (DPD) colorimetry. The rest of the sample was filtered through a 0.22 μm membrane and then analyzed for ClO2, ClO3, and ClO4 using ion chromatography (ICS900, AS16 column, Thermo Fisher Scientific, Waltham, MA, USA).
COPs analysis: The eight typical COPs included dichloromethane (DCM), trichloromethane (TCM), CCl4, monochloroacetic acid (MCAA), dichloroacetic acid (DCAA), trichloroacetic acid (TCAA), dichloroacetonitrile (DCAN), and trichloroacetic acid (TCAN). These were analyzed using a gas chromatograph equipped with an electron capture detector (GC/ECD) (Agilent 7890a, Santa Clara, CA, USA). The chromatographic column was HP-5 5% Phenyl Methyl Siloxane (30 m × 320 μm × 0.25 μm). Detailed pretreatment and quantitative analysis methods, warming procedures, and detection limits for water quality parameters are provided in Text S4 and Text S5.

3. Results and Discussion

3.1. Zeolite Adsorption

3.1.1. Adsorption Isotherm

Zeolites were used to adsorb NH4Cl solutions (5–100 mg-N/L) and HA solutions (DOC concentration: 5–100 mg/L), respectively, with a constant dosage of 40 g/L. Langmuir and Freundlich are representative adsorption isotherm models that characterize zeolite adsorption mechanisms for ammonia and HA [43]. As shown in Table 2, the modeling results revealed distinct adsorption behaviors for different contaminants. Ammonia adsorption exhibited excellent agreement with the Langmuir model, indicating that monolayer adsorption occurs at homogeneous active sites through chemical interactions. In contrast, HA adsorption exhibited a better fit to the Freundlich model (R2 = 0.997), suggesting multilayer adsorption or interactions with heterogeneous surface processes [44]. The maximum zeolite adsorption capacities were determined to be 1.69 mg-N/g for ammonia and 0.11 mg/g for HA (DOC).

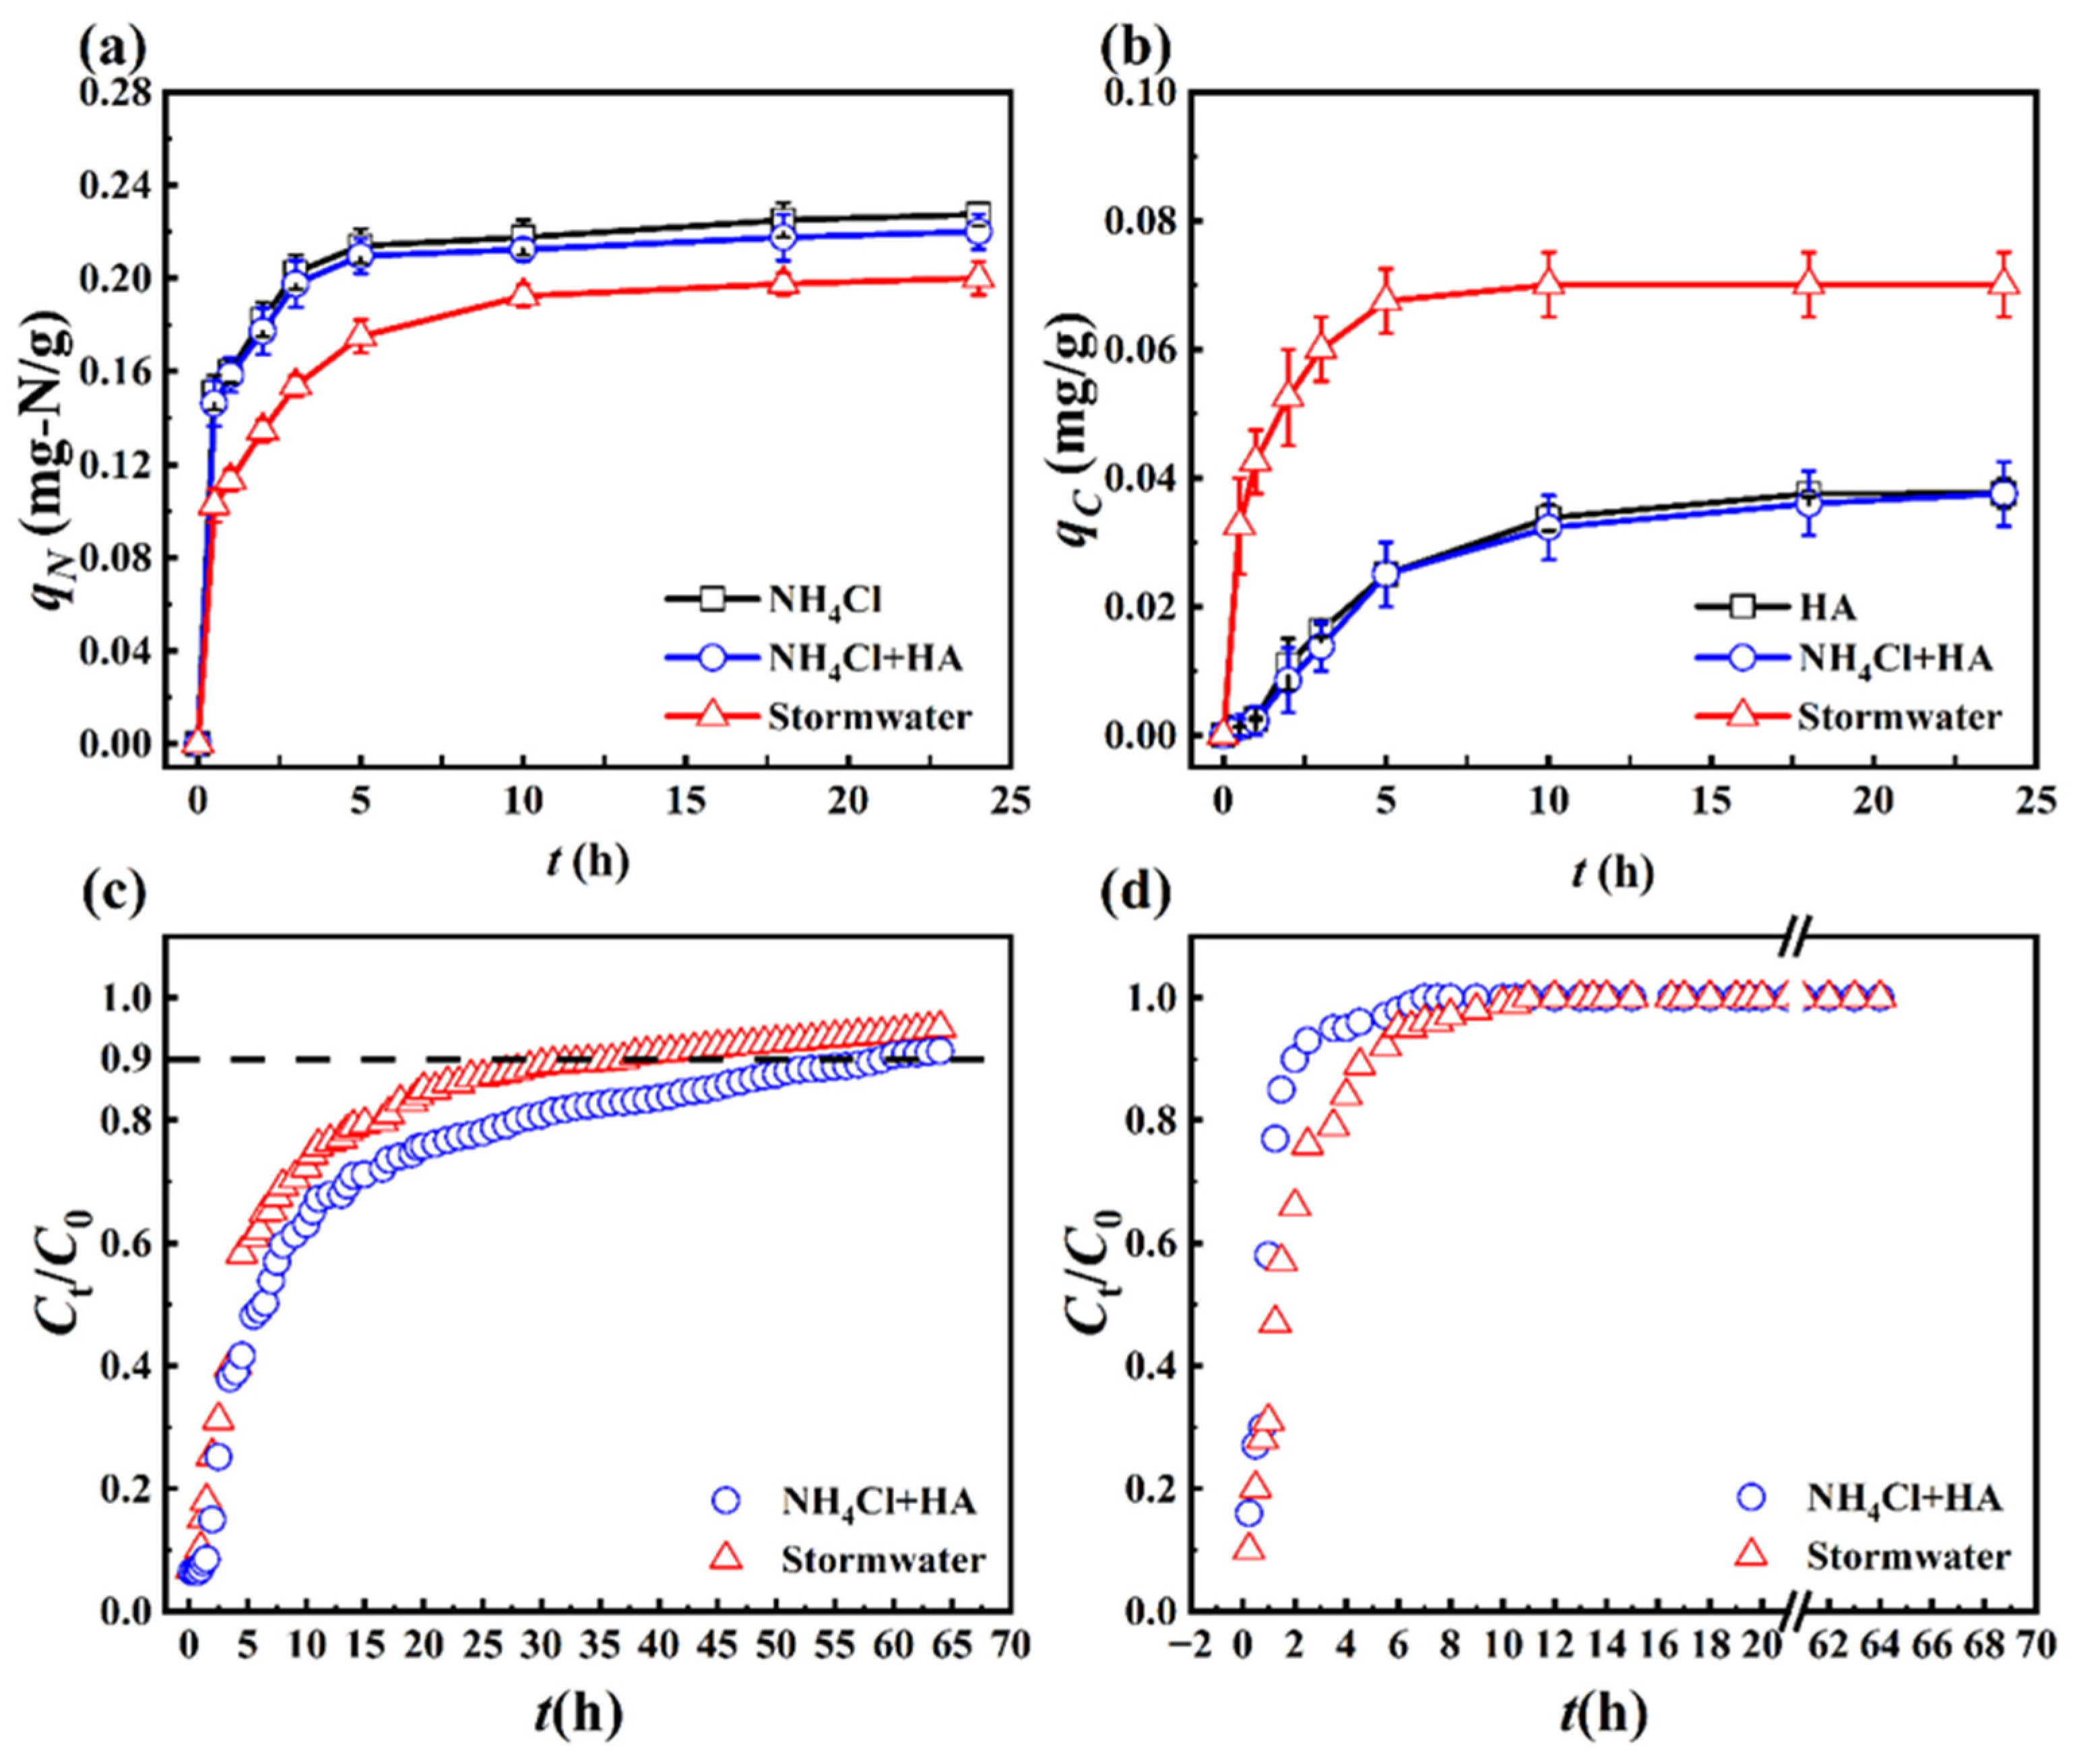
3.1.2. Intermittent Adsorption

As shown in Figure 1a, the equilibrium ammonia adsorption capacities of zeolites in the NH4Cl solution and NH4Cl + HA solution were 0.23 mg-N/g and 0.22 mg-N/g, respectively, implying that the presence of HA produced a minimal effect on the ammonia adsorption. Because of the intricacies of the composition and the competition with ions such as Mg2+ and Ca2+ in stormwater [45], the equilibrium ammonia adsorption capacity of zeolites slightly decreased to 0.20 mg-N/g. Text S6 shows the conditions of the adsorption kinetics experiment [46]. Kinetic analysis (Table S2) revealed that ammonia adsorption in all three systems followed pseudo-second-order kinetics. The observation kp1 > kp2 suggested that the intraparticle diffusion stage was the primary rate-limiting step in adsorption. Compared to the NH4Cl solution, the presence of HA in the NH4Cl + HA solution and stormwater reduced the kp2.
The adsorption processes of zeolites on HA (represented by DOC) in both the HA solution and the NH4Cl + HA solution were quite similar (Figure 1b), with equilibrium capacities of 0.039 mg/g and 0.038 mg/g, respectively. This minimal difference suggests that ammonium ions had a limited effect on HA adsorption. Electrostatic adsorption was considered the primary mechanism for HA removal by zeolites [47]. The addition of NH4Cl increased the ionic strength of the solution and weakened the electrostatic attraction between HA and zeolite, reducing the adsorption capacity for HA. Notably, the zeolites exhibited a more pronounced adsorption for HA in stormwater (0.070 mg/g), indicating a rapid adsorption rate during the initial 2 h. This phenomenon can be attributed to the coagulation–precipitation process, which removed more than 75% of the high-molecular-weight hydrophobic compounds, such as polysaccharides and proteins, from stormwater, while the removal of low-molecular-weight NOM was less effective. The treated stormwater was enriched with hydrophilic HA (<1 kDa), which was more easily adsorbed [10,18,48]. Shi et al. [49] also concluded that coagulation–precipitation can effectively remove NOM (>5 kDa) from wastewater, resulting in treated wastewater that is mainly composed of low-molecular-weight hydrophobic and hydrophilic organic matter. Table S3 indicated that the adsorption of HA by zeolite followed pseudo-second-order kinetics. The biphasic adsorption pattern showed that stormwater’s kp₁ values exceeded those in other solutions, indicating faster surface adsorption kinetics that contributed to its superior DOC removal capacity.

3.1.3. Continuous Adsorption

Based on the batch adsorption characteristics of zeolite for ammonia and HA, continuous adsorption processes were further investigated. Breakthrough curves for ammonia and HA (represented by DOC) adsorption from both solutions were plotted using averaged data from three parallel experiments (Figure 1c,d). To accurately interpret and predict adsorption behavior, three established continuous-flow models—Modified Dose–Response (MDR), Thomas, and Adams–Bohart—were fitted to the breakthrough curves under identical conditions. As shown in Table S4, the MRD model demonstrated superior fitting performance for both ammonia and DOC adsorption, consistent with the findings reported by Qin et al. [11]. Thus, the MDR model-fitted curves provide accurate predictions of zeolite adsorption capacity for ammonia and HA, and they suggest potential heterogeneity in the adsorption process. Figure 1c,d shows that the ammonia in the effluent reached the breakthrough point at 2 h and 1.25 h and the endpoint at 60 h and 38 h in the continuous adsorption with the NH4Cl + HA solution and stormwater, respectively. The DOC in the effluent reached the endpoint more rapidly than ammonia, matching the influent concentration at 7 h and 11 h, respectively. The ammonia adsorption capacities of zeolites in the NH4Cl + HA solution and stormwater were 1.68 mg-N/g and 1.34 mg-N/g, and the DOC adsorption capacities were 0.095 mg/g and 0.155 mg/g. The adsorption patterns of continuous and intermittent operations were consistent.

3.2. NaCl-NaClO Chlorination Reaction and Zeolite Regeneration

3.2.1. NaCl-NaClO Chlorination Reaction

The competitive mechanisms between ammonia and organic matter in the presence of ClO remain controversial. It is necessary to perform a NaCl-NaClO chlorination reaction to elucidate the zeolite regeneration process further. Text S5 shows the NaCl-NaClO chlorination reaction of NH4Cl, HA, and NH4Cl + HA. The experimental conditions are shown in Text S7. During the chlorination reaction, ammonia existed in the form of NH3 and gradually reacted with active chlorine to produce NH2Cl, NHCl2, and N2, while NCl3 formation was negligible at pH > 9, as shown in Equations (S7)–(S15) in Text S8 [50,51,52]. The chlorination reaction of NH4Cl + HA achieved 89.3% ammonia removal and 11.0% DOC removal, whereas the chlorination of individual NH4Cl and HA solutions resulted in 100% and 14.3% removal efficiencies (Figure S2). Notably, both the concentration changes and removal efficiencies of ammonia were observably higher than those of DOC. The reaction between ClO and ammonia was rapid, with a reported rate constant k = 4.2 × 10⁶ M−1s−1 [53], while the mineralization of HA was less apparent. This indicated that ammonia competed more effectively for ClO than HA. Stefan et al. [54] also noted that ammonia tends to react preferentially over organic matter during the chlorination of drinking water. While HA was recalcitrant to degrade, with minimal changes in DOC, significant alterations in parameters such as UV254 absorbance were observed [55,56]. This indicated that certain functional groups or structures in HA reacted with free chlorine, promoting the formation of COPs and making it challenging to reduce DOC concentration.

3.2.2. Zeolite Regeneration

Operations using the NH4Cl + HA solution and stormwater were conducted in accordance with the procedures outlined in Section 2.3. Results for all four experimental sets are presented in Table S3. The high concentration of Na+ in the regeneration solution exchanged the NH4+ adsorbed on the zeolite, as shown in Text S8. In alkaline conditions, NH4+ was converted to NH3, which reacted rapidly with ammonia to form N2 and NO3-N. NaCl-NaClO exhibited stable zeolite regeneration performance, achieving a ZRE of 65.0–68.8% and an NRE of 62.8–65.5%. By the end of the regeneration, 59.7–66.7% of the DOC adsorbed by the zeolites was released back into the solution. This indicated that a large proportion of the adsorbed HA was removed from zeolites through ion exchange as well as oxidation; only a minor fraction was retained within the zeolite micropores or on the surface. Huang et al. [27] also observed that 5–10 mg/L of DOC was transferred into the regeneration process during NaClO regeneration.
Figure 2 illustrates the zeolite regeneration processes following intermittent adsorption with NH4Cl + HA solution and stormwater. Free chlorine concentration decreased apparently in 0–10 min and declined gradually in 10–60 min. This trend might be attributed to the rapid reaction between ClO and ammonia to form N2, with the reaction rate diminishing as ammonia levels in the zeolites decreased significantly in the later process. This observation aligns with Zhang et al. [28], who found that high zeolite regeneration efficiencies are achieved with NaClO treatment for 2–5 min. The concentrations of NH4+ and chloramine in the solution were below the detection limits. The TN existed in the form of NO3-N, with 3.3% and 2.2% of the adsorbed ammonia converted to NO3-N, respectively. The specific reaction equations during the regeneration process are shown in Text S8. The concentration of DOC increased rapidly after 10 min of regeneration, reaching 1.6 mg/L by the end of regeneration (Figure 2b). This increase may be attributed to the greater DOC absorption capacity from stormwater, leading to a more extensive exchange or oxidation. Du et al. [57] suggested that residual free chlorine, after reacting with ammonia, contributes to the formation of halogenated organic by-products and significantly increases toxicity. Consequently, the observed rises in DOC concentration were associated with the formation of COPs.
By combining the NaCl-NaClO chlorination reaction and regeneration process, it could be concluded that, during the initial 10 min, ClO⁻ predominantly reacted with ammonia exchanged from the zeolite to form N₂. This occurred due to enhanced Na⁺ ion exchange capacity and the competitive advantage of ammonia over HA for ClO⁻. After that, the exchange of HA and oxidative decomposition became more significant. However, the continuous generation of COPs impeded the mineralization of HA.

3.3. Chlorine Species Formation
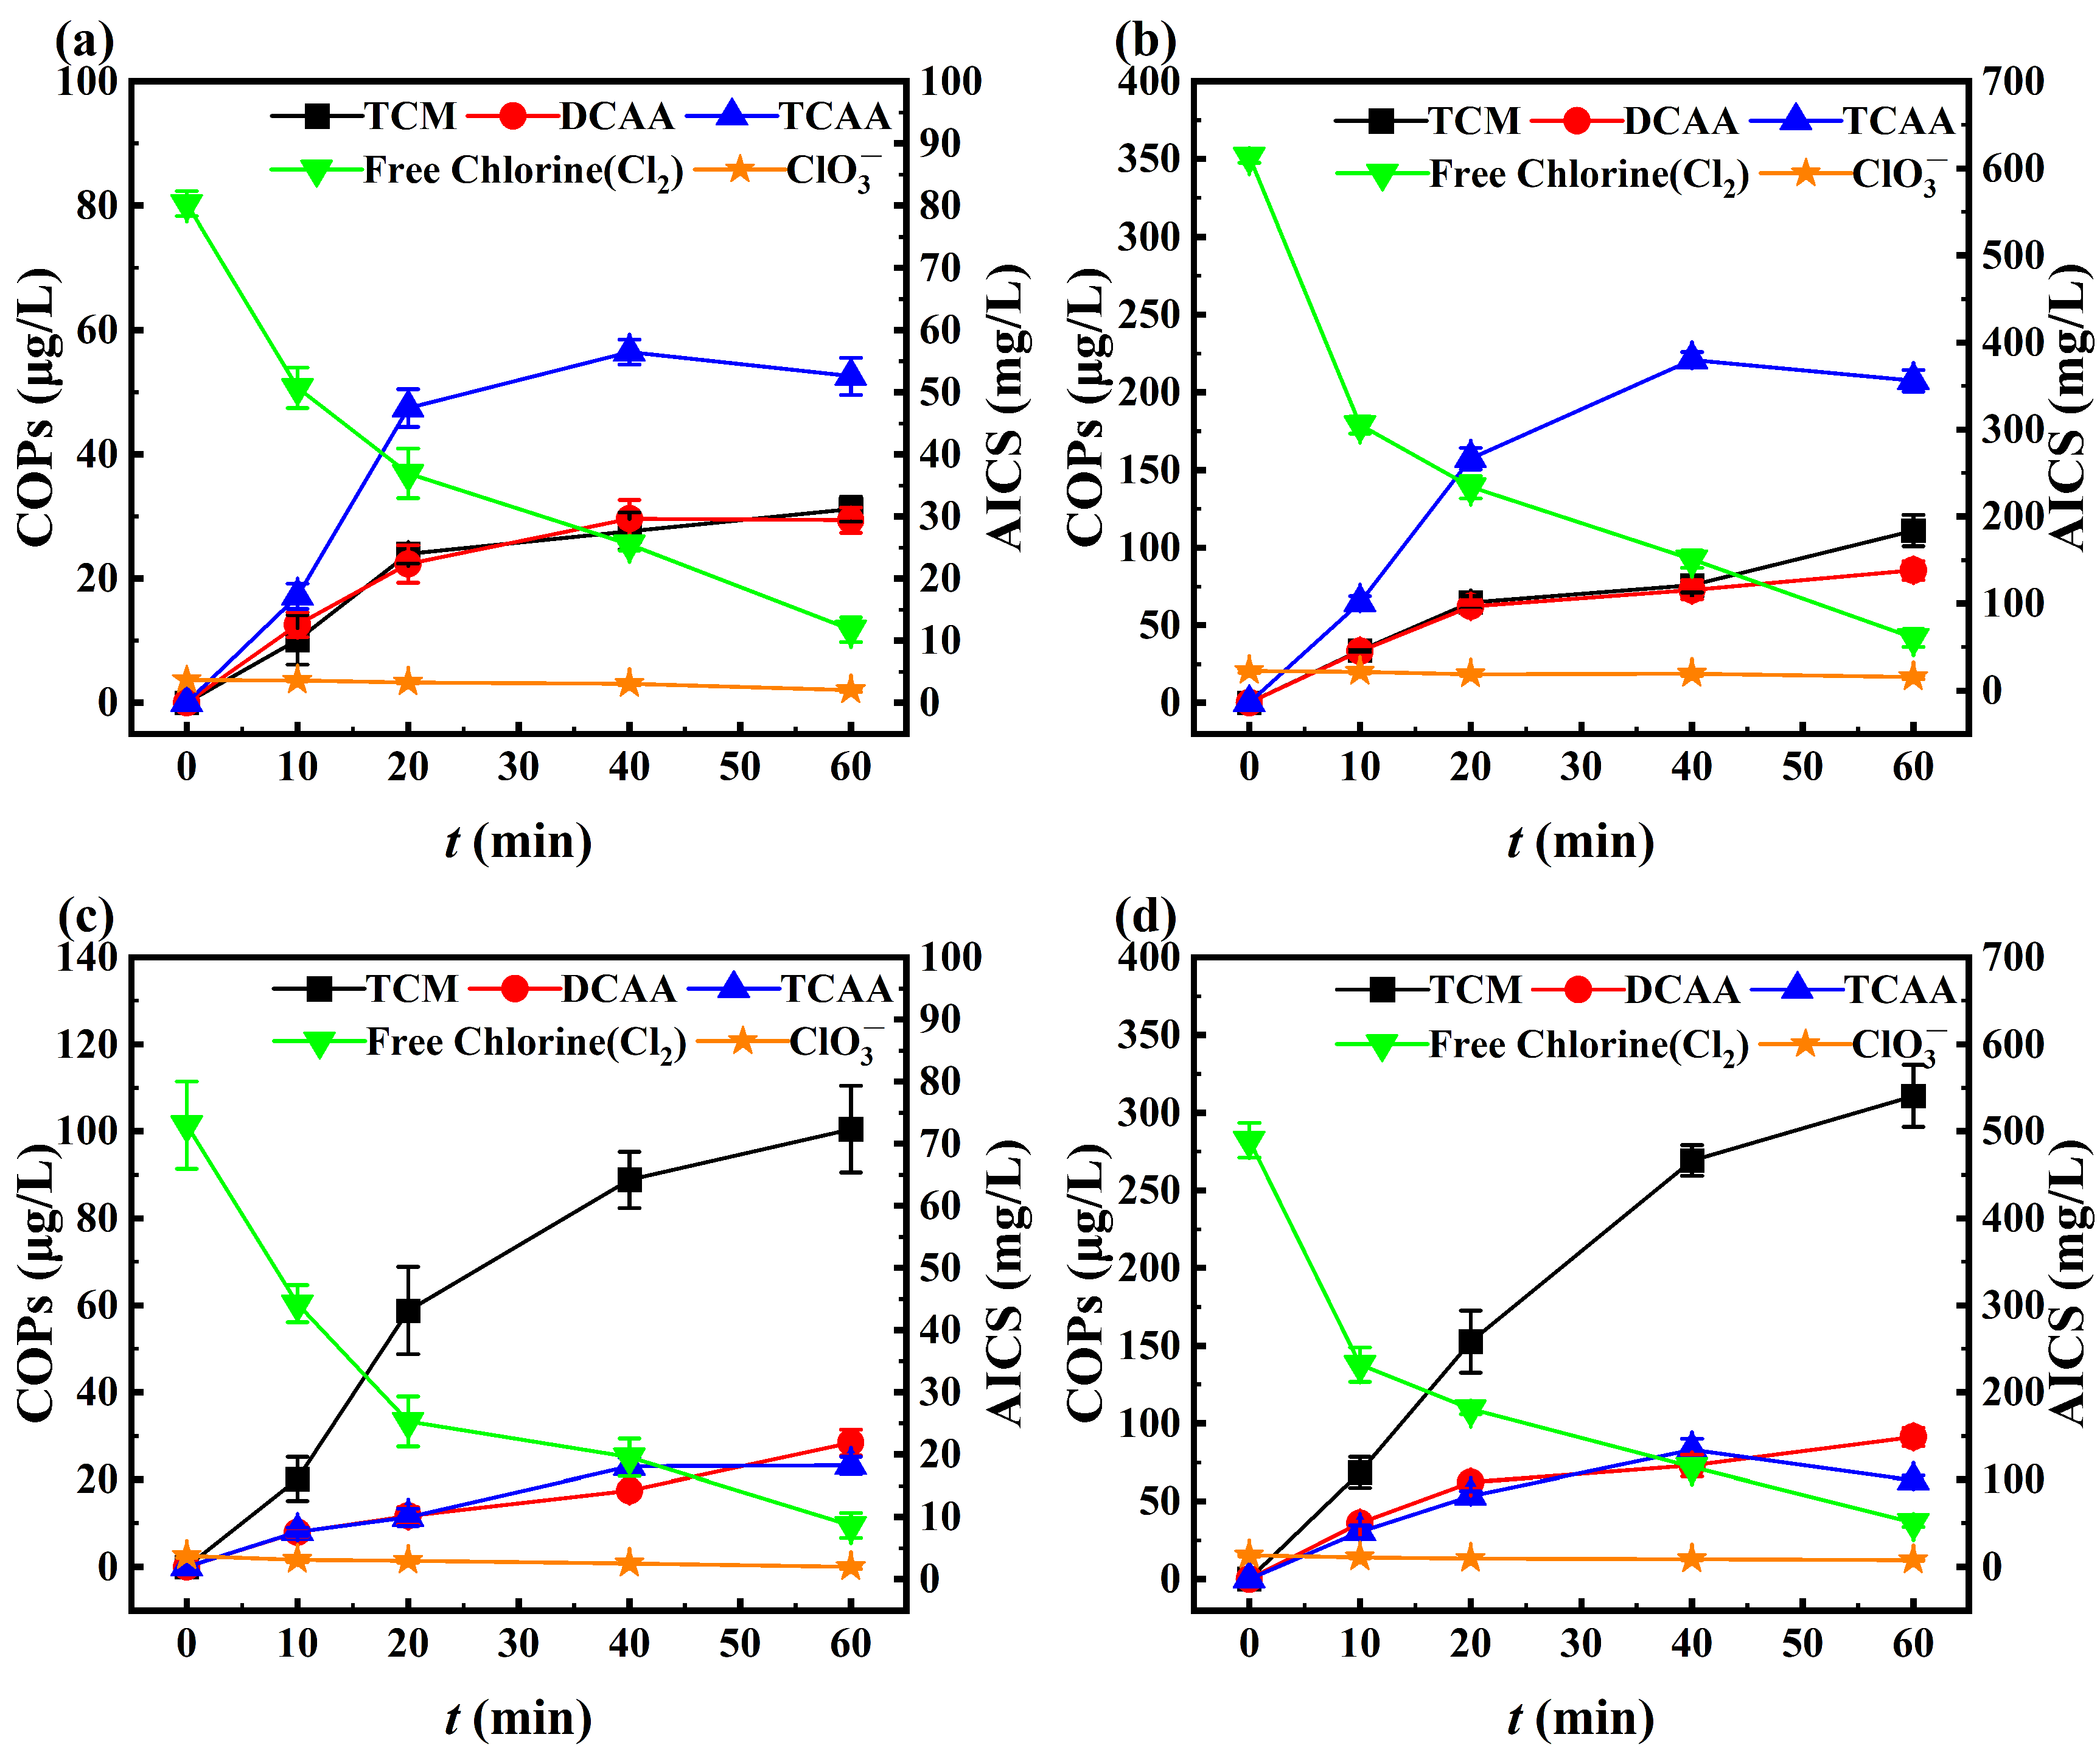
3.3.1. AICS

The analysis of the newly purchased sodium hypochlorite solution showed that, in addition to the main component, ClO2 (4.38 g/L) and ClO3 (4.54 g/L) were also present. ClO4 was below the detection limit (0.18 mg/L). Due to the influence of temperature, light, and storage time during transportation and storage, ClO was prone to decomposition and transformation into Cl, ClO2, and ClO3, as shown in Equations (5)–(8). This decomposition reduces the concentration of effective components. Asami et al. [58] detected ClO3 in both commercially purchased and on-site-prepared NaClO solutions, with concentrations even exceeding those of ClO. Specifically, ClO3 in the purchased NaClO solution reached 260 g/L after two years of storage. Consequently, ClO3 is an unavoidable inorganic by-product of NaClO regeneration. For engineering applications, a NaClO solution should be stored in a cold, light-protected environment to minimize degradation of the active ingredient, and its concentration should be checked periodically.
Free chlorine and ClO₃⁻ were present in four regeneration sets (Figure 3). As the regeneration proceeded, free chlorine was progressively consumed by its reaction with ammonia and HA, leading to a significant decrease within the first 10 min. The residual free chlorine amounts at the end of intermittent operations with the NH4Cl + HA solution and stormwater were 11.78 mg-Cl2/L and 8.64 mg-Cl2/L (Figure 3a,c), while in continuous operations, the levels were 60.9 mg- Cl2/L and 50.76 mg- Cl2/L (Figure 3b,d). The concentration of ClO3 presented downward trends across all four sets. In intermittent operations, initial ClO3 levels were 3.71 mg/L (NH4Cl + HA) and 3.59 mg/L (stormwater), declining to 2.08 mg/L and 1.95 mg/L after 1 h (Figure 3a,c), respectively. In continuous operations, final ClO₃⁻ concentrations were 15.18 mg/L(NH4Cl + HA) and 7.62 mg/L (stormwater) (Figure 3b,d). Notably, all measured ClO₃⁻ concentrations exceeded the recommended limits of U.S. EPA (210 μg/L) and WHO (0.7 mg/L). It has been reported that ClO2 and ClO3 did not reacted with organic matter to form COPs in alkaline conditions [59,60], nor did they react with ammonia and NO3 [61]. Furthermore, the addition of NaCl has been identified as an effective way to promote ClO3 decomposition in the chlor-alkali industry [62]. Therefore, the decrease of ClO3 in the regeneration process could be attributed to the high concentration of Cl, which promoted the reaction of Equation (6). ClO2 and ClO4 were far below the detection limits in the regeneration solution because ClO4 formation was restricted to acidic conditions, while ClO₂⁻ exhibits high instability in the presence of substantial ClO⁻, as shown in Equation (7). Busch et al. [63] determined that the activation potential energy required for the conversion of ClO2 to ClO3 in alkaline conditions was very low, so that ClO2 could easily be converted to ClO3. The rate constant k = 2.1 × 10³ M−2s−1 was reported [60], as shown in Equation (8). The sustained alkaline pH throughout regeneration (initial pH = 10, final pH = 9.2) supports this mechanism and aligns with findings by Narbaitz et al. [29]. Therefore, in addition to free chlorine, ClO3 was mainly due to the addition of the NaClO solution and degraded slowly within 1 h.
2NaClO ↔ 2NaCl + O2
3ClO ↔ Cl + ClO3
2ClO ↔ Cl + ClO2
ClO2 + ClO ↔ ClO3 + Cl

3.3.2. COPs

Free chlorine can interact with C-H, C-O, C=O, and C=C bonds, causing cracking or the ring opening of aliphatic and aromatic organic compounds to form CO2 and COPs [64,65]. During zeolite regeneration, HA adsorbed on the zeolite resides on its surface or within its pores, with a portion exchanging into the solution. Active chlorine initially combined with HA to form chlorinated intermediates, which subsequently underwent further reactions to form COPs, as shown in Equation (9). Electrophilic substitution was regarded as the predominant pathway for COP formation, where active chlorine attacked electron-rich sites in organic molecules to form new C-Cl bonds, while the additional reaction accounted for only a small proportion due to the slow oxidation rate [66]. Nguyen et al. [67] proposed that low-molecular-weight HA with high aromatic carbon content and low nitrogen content primarily forms THMs and HAAs through stepwise substitution with active chlorine, further inhibiting DOC removal. High concentrations of TCM, DCAA, and TCAA were detected in regeneration processes of all sets, while the other five COPs were below their respective detection limits (Text S5). The concentration of COPs increased gradually over time, exhibiting a rapid rise between 10 min and 20 min. COP formation correlated positively with active chlorine consumption. The gradual depletion of free chlorine in the solution consequently slowed the COP formation rate in the later stages of the reaction [68].
R (HA) + ClO → R-Cl → COPs + CO2 + Cl + H2O
At the end of zeolite regeneration in the continuous operation with the NH4Cl + HA solution, concentrations of TCM, DCAA, and TCAA reached 110.88 μg/L, 85.26 μg/L, and 207.42 μg/L, respectively, which were 3.56, 2.90, and 3.94 times as much as those observed in the intermittent operation. The COP formation patterns were consistent between intermittent and continuous operations with the NH₄Cl + HA solution. TCM and DCAA exhibited similar trends, while TCAA was produced at the fastest rate and achieved the highest concentration (Figure 3a,b). This was attributed to the high aromatic content of HA, which was known to form high levels of HAA, particularly TCAA, during reactions with free chlorine [67]. Zhang et al. [65] similarly reported substantial HAA formation during HA chlorination. At the end of zeolite regeneration in continuous operation with stormwater, the concentrations of TCM, DCAA, and TCAA were 310.76 μg/L, 91.25 μg/L, and 63.43 μg/L, respectively, which were 3.10, 3.22, and 2.73 times as much as those in intermittent operation. In the zeolite regeneration process with stormwater (Figure 3c,d), TCM was formed at the fastest rate and reached the highest concentration. TCM was recognized as the predominant component of halomethanes formed during the chlorination of surface water [69]. Hong et al. [20] also found that TCM accounted for 90% of the total disinfection by-products during stormwater disinfection.
Overall, TCM and HAA in the four sets surpassed U.S. EPA regulatory limits (80 μg/L and 60 μg/L). In these sets, less than 2% of the zeolite-adsorbed DOC was converted to COPs. COPs accounted for 2.5% of the DOC in the regeneration solution, which meant the majority of DOC existed in the form of other organic compounds. The percentage of COPs formed in continuous operations relative to the adsorbed DOC was 1.4 times that of the intermittent operation. This suggested that, in practical operations, due to the greater absorption capacity of zeolite for organic matter in stormwater, a higher proportion of COPs would form, which posed a greater threat and needed to be treated.

3.4. Toxicity Analysis

3.4.1. Algal Acute Toxicity Test

Figure 4 illustrates the processes of the algae-specific growth inhibition rates exposed to regeneration solutions of the four sets. Since the concentration of free chlorine was significantly higher than ClO3 and COPs, a portion of the regeneration solution was treated with sodium sulfite to quench the free chlorine [70]. A comparative analysis of the algal-specific growth inhibition rates with and without free chlorine quenching was conducted to assess the toxicity of AICS and COPs. These experiments allowed for a comprehensive assessment of the inhibitory effects of regeneration solutions on algal growth.
Figure 4 shows the fluctuations in algal specific growth inhibition during the regeneration of the four sets. It was observed that the inhibition rates decreased rapidly during 0–10 min, which was attributable to substantial free chlorine consumption by ammonia. Initial inhibition rates of 300.0% and 294.0% in intermittent operations declined to 140.2% and 130.9% by regeneration completion (Figure 4a). During the zeolite regeneration in continuous operations, the initial inhibition rates were remarkably high, reaching 650.5% and 600%, respectively, and they dropped to 350.0% and 310.5% at the end of the regeneration (Figure 4c), which were 2.50 and 2.37 times as much as those observed in intermittent operations. Although the remaining free chlorine mainly caused the high inhibition rates, due to its instability and easy spontaneous decomposition and quenching, the toxic effects of other substances present in the regeneration solution should be taken into more consideration [71].
In quenched solutions (Figure 4b,d), inhibition was attributed to ClO₃⁻ and COPs. Although ClO3 was initially present in the regeneration solution of the four sets, the inhibitions at 0 min were less than 3%. These minimal inhibitions were due to the low concentration of ClO3 in the solution and the insensitivity of the green algae to ClO3. It was reported that the observed effect concentration (NOEC) for green algae was 0.93 mM [61]. During intermittent regeneration with the NH₄Cl+HA solution and stormwater, the inhibition rates at 10 min were 10.3% and 8.9%, respectively. Subsequently, as the concentrations of COPs gradually increased, so did the inhibition rates, culminating in final rates of 63.9% and 54.6%. This demonstrated that the overall toxicity of COPs was greater than ClO3. The inhibition rates also showed a consistent upward trend in continuous operations (Figure 4d), which were 2.83 and 2.95 times as much as those in intermittent operations at 1 h. The inhibition rates in operations using the NH4Cl + HA solution were slightly higher than those using stormwater. This was due to the difference in the concentration of COPs caused by water quality; both intermittent and continuous operations revealed that TCAA dominated in the regeneration processes using the NH4Cl + HA solution, while TCM prevailed in the regeneration processes using stormwater. It has been reported that phytoplankton was more sensitive to HAA; thus, TCAA exerted stronger toxicity than TCM [72].
Consequently, the residual free chlorine in the unquenched regeneration solution exhibited greater toxic impacts [73]. In contrast, COPs and ClO3 resulted in comparatively lower toxic impacts on algal growth, with the inhibition rates of the four sets showing a consistent decline. The toxicity attributed to ClO3 in the quenched regeneration solution was insignificant, and the overall inhibition rates increased progressively, aligning with the formation trend of COPs.

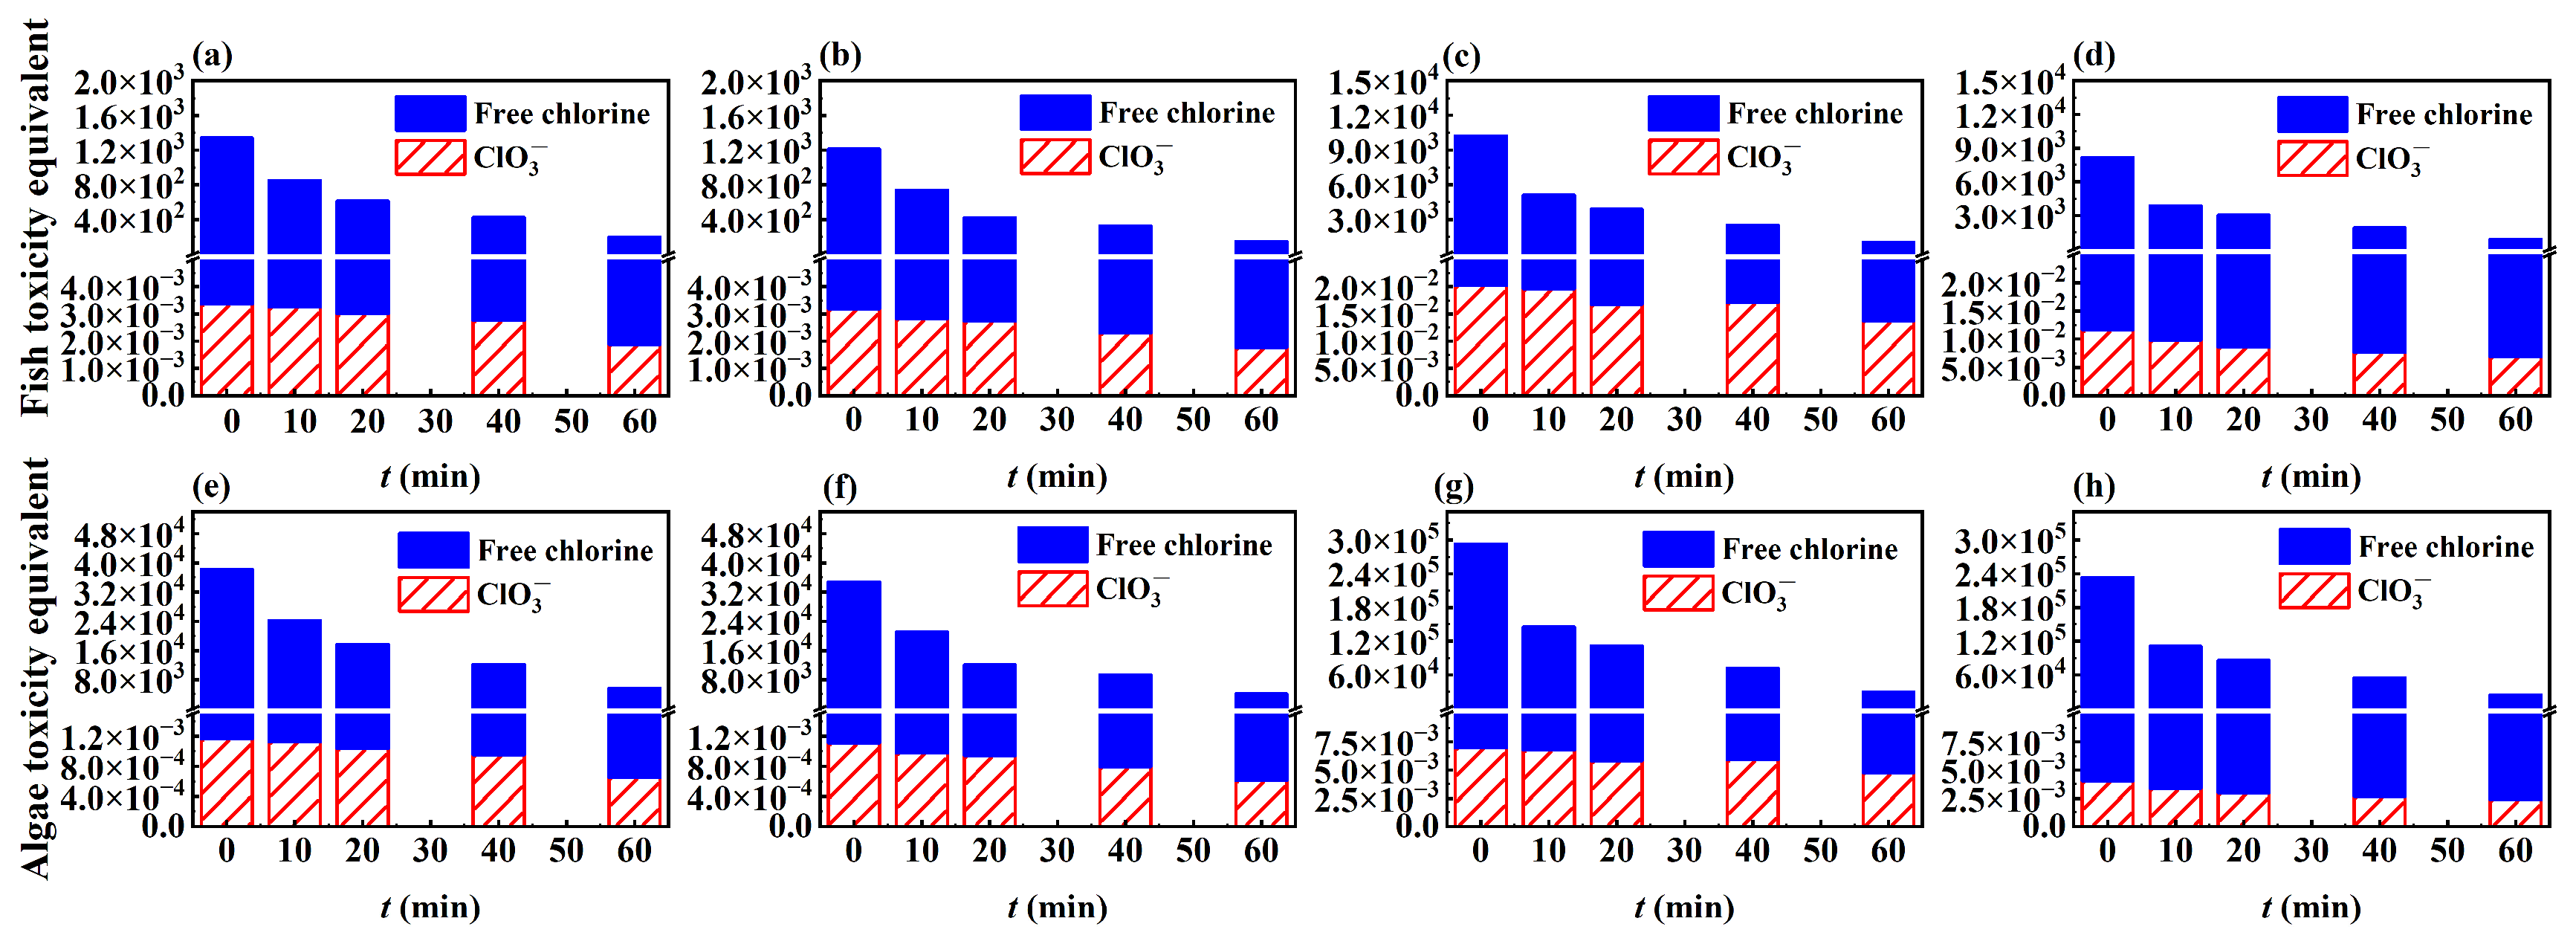
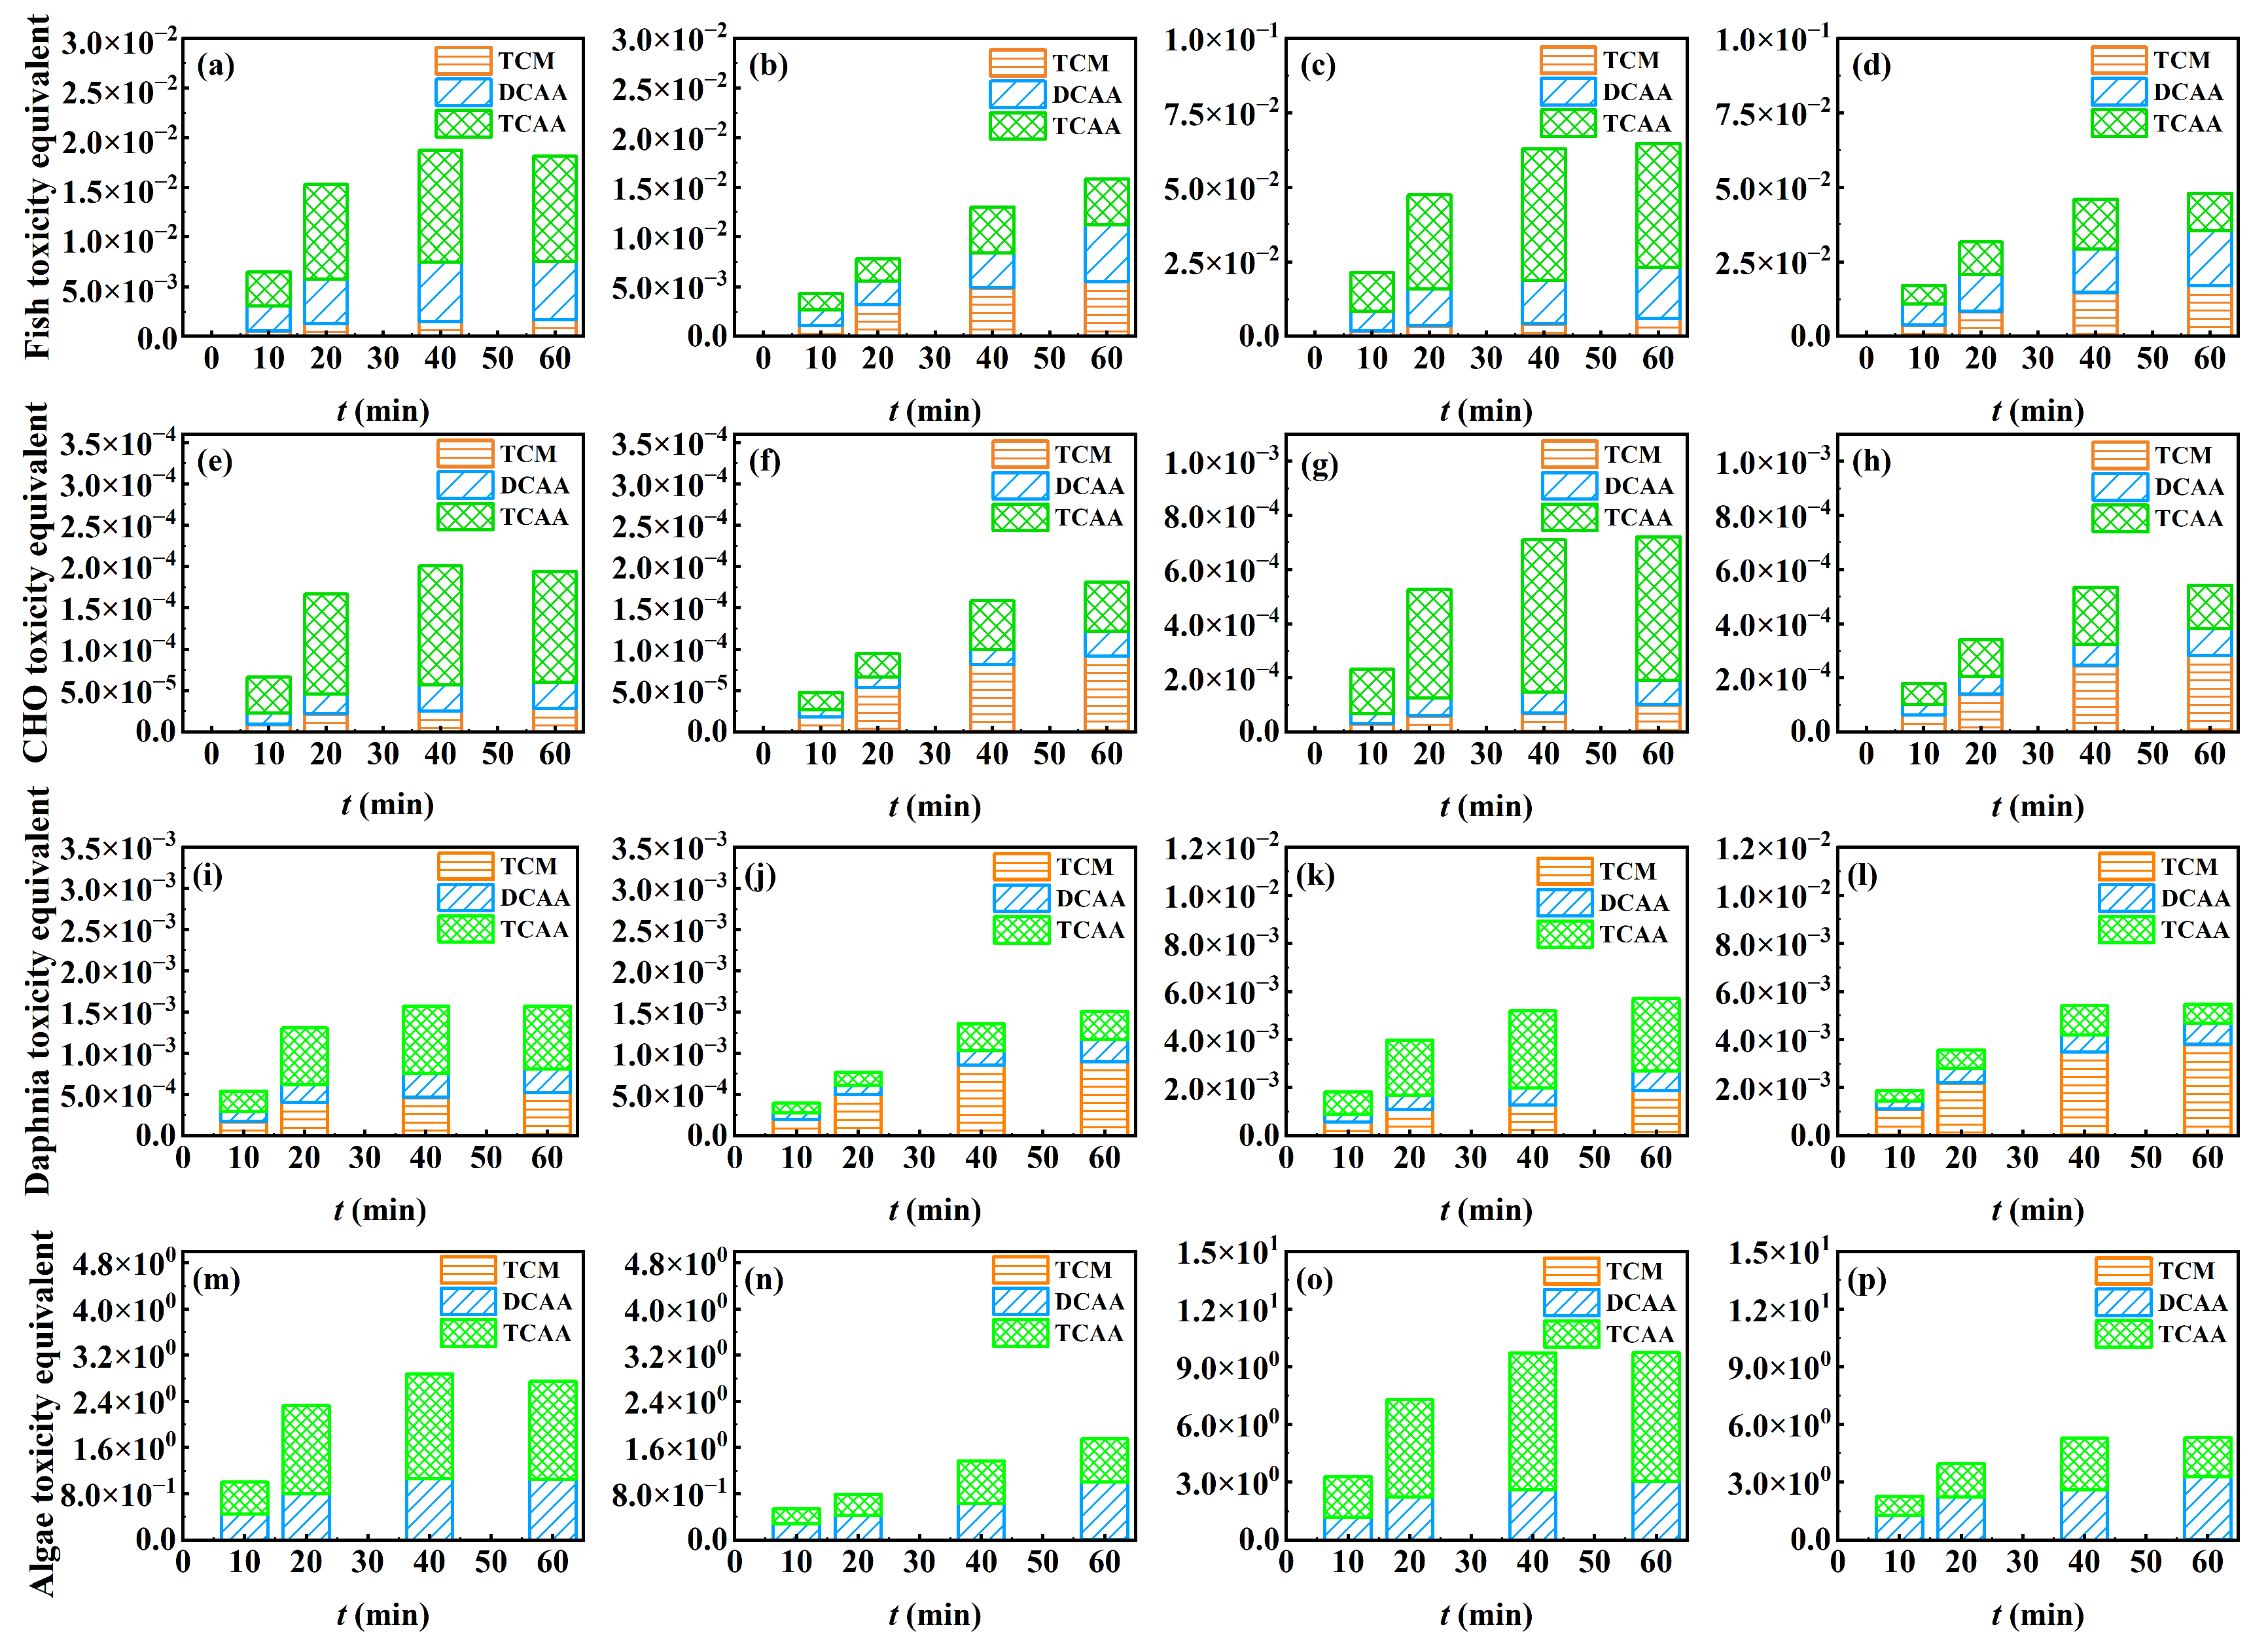
3.4.2. Toxicity Calculation

The toxic interaction between AICS and COPs is synergistic rather than additive [74]. Consequently, toxicity calculations and discussions should be conducted separately for each category. Figure 5 shows the toxicity analysis of AICS across the four sets using fish and algae data sourced from ECOTOX. Figure 6 shows the toxicity analysis of COPs for the same sets, incorporating fish and CHO cell data from the toxicity database, as well as daphnia and algae data derived from ECOSAR.
As shown in Figure 5, free chlorine exhibited toxic equivalents that were 5–7 orders of magnitude higher than ClO3. Both free chlorine and ClO3 exhibited downward trends of fish and algae toxic equivalents in the regeneration processes. In intermittent operation with the NH4Cl + HA solution, the fish and algae toxic equivalents formed by the residual free chlorine were 2.0 × 10² and 5.6 × 10³, respectively, which were 1.43 and 1.37 times as much as those of stormwater. Similarly, the fish and algal toxic equivalents of ClO3 were 1.9 × 10⁻³ and 6.6 × 10⁻⁴, respectively, which were close to those in intermittent operation with stormwater. In the continuous operation using the NH4Cl + HA solution, algae toxic equivalents attributed to free chlorine were 1.0 × 10³ and 2.9 × 10⁴, respectively, which were 1.18 and 1.21 times as much as those using the stormwater. ClO3 brought out toxic equivalents of 1.4 × 10⁻² and 4.8 × 10⁻³ for fish and algae, which were 2.03 and 2.00 times as much as those using stormwater. The total AICS toxicity in continuous operations was approximately four times higher than that in intermittent operations. This was mainly due to the enhanced zeolite adsorption of ammonia in continuous operations, which required a higher dosage of NaClO for regeneration. The resulting higher residual free chlorine concentration consequently exacerbated the toxicity, consistent with the findings of the algal acute toxicity tests. This confirmed the dominant role of free chlorine in the regeneration solution toxicity. It has been reported that the acute toxicity and genotoxicity effects caused by AICS components are synergistic [23,71], indicating that the actual AICS toxicity in the regeneration solution was likely to exceed the sum of individual ClO₃⁻ and free chlorine contributions.
The toxicity of the components of COPs has been reported to be additive [38]. Figure 6 shows that the total toxic equivalents of COPs of the regeneration solution increased over time across four sets, which was consistent with the concentration changes. Notably, COPs exhibited the highest toxic equivalents for algae, surpassing those for fish, CHO cells, and daphnia by 2, 4, and 3 orders of magnitude, respectively. This finding aligns with the results of Li et al. [36]. For the four test organisms of fish, CHO cells, fleas, and algae, the toxic equivalents observed during intermittent operation with the NH4Cl + HA solution were 1.18, 1.07, 1.04, and 1.52 times as much as those observed with stormwater, respectively. Following continuous operation with the NH4Cl + HA solution, the toxic equivalents were 1.34, 1.33, 1.04, and 1.83 times as much as those with stormwater, respectively. There was a positive correlation among organic matter absorption, COPs concentration, and toxicity. The total toxicity equivalents in continuous operations, whether with the NH4Cl + HA solution or stormwater, were twice as high as those in intermittent operations. Additionally, Figure 5 and Figure 6 show that, for the same organisms, the total toxic equivalents of COPs were greater than those of ClO3. Although the toxicity of operations with the NH4Cl + HA solution was marginally higher than that with stormwater, this trend was primarily due to the differences in organic matter composition. As actual stormwater composition and organic matter concentration vary significantly depending on region and rainfall, this study provides a valuable reference for assessing COP toxicity during zeolite regeneration. Future research could comprehensively explore with other organic substances or a variety of stormwater samples.
The order of chlorine species toxicity in the regeneration solution was free chlorine > COPs > ClO3, in terms of their toxic effects and dosages. Algal acute toxicity tests proved crucial for assessing overall toxicity changes during regeneration processes, yielding precise outcomes. Although the toxicity calculations cannot replace the experimental results, they can significantly reduce or avoid the length of animal experiments during the toxicity assessment [75]. These calculations could indicate the relative contribution of individual chlorine species to overall toxicity and offer substantial insights for ecotoxicity assessments. Consequently, a comprehensive toxicity analysis of the regeneration solution requires combining multiple methods.

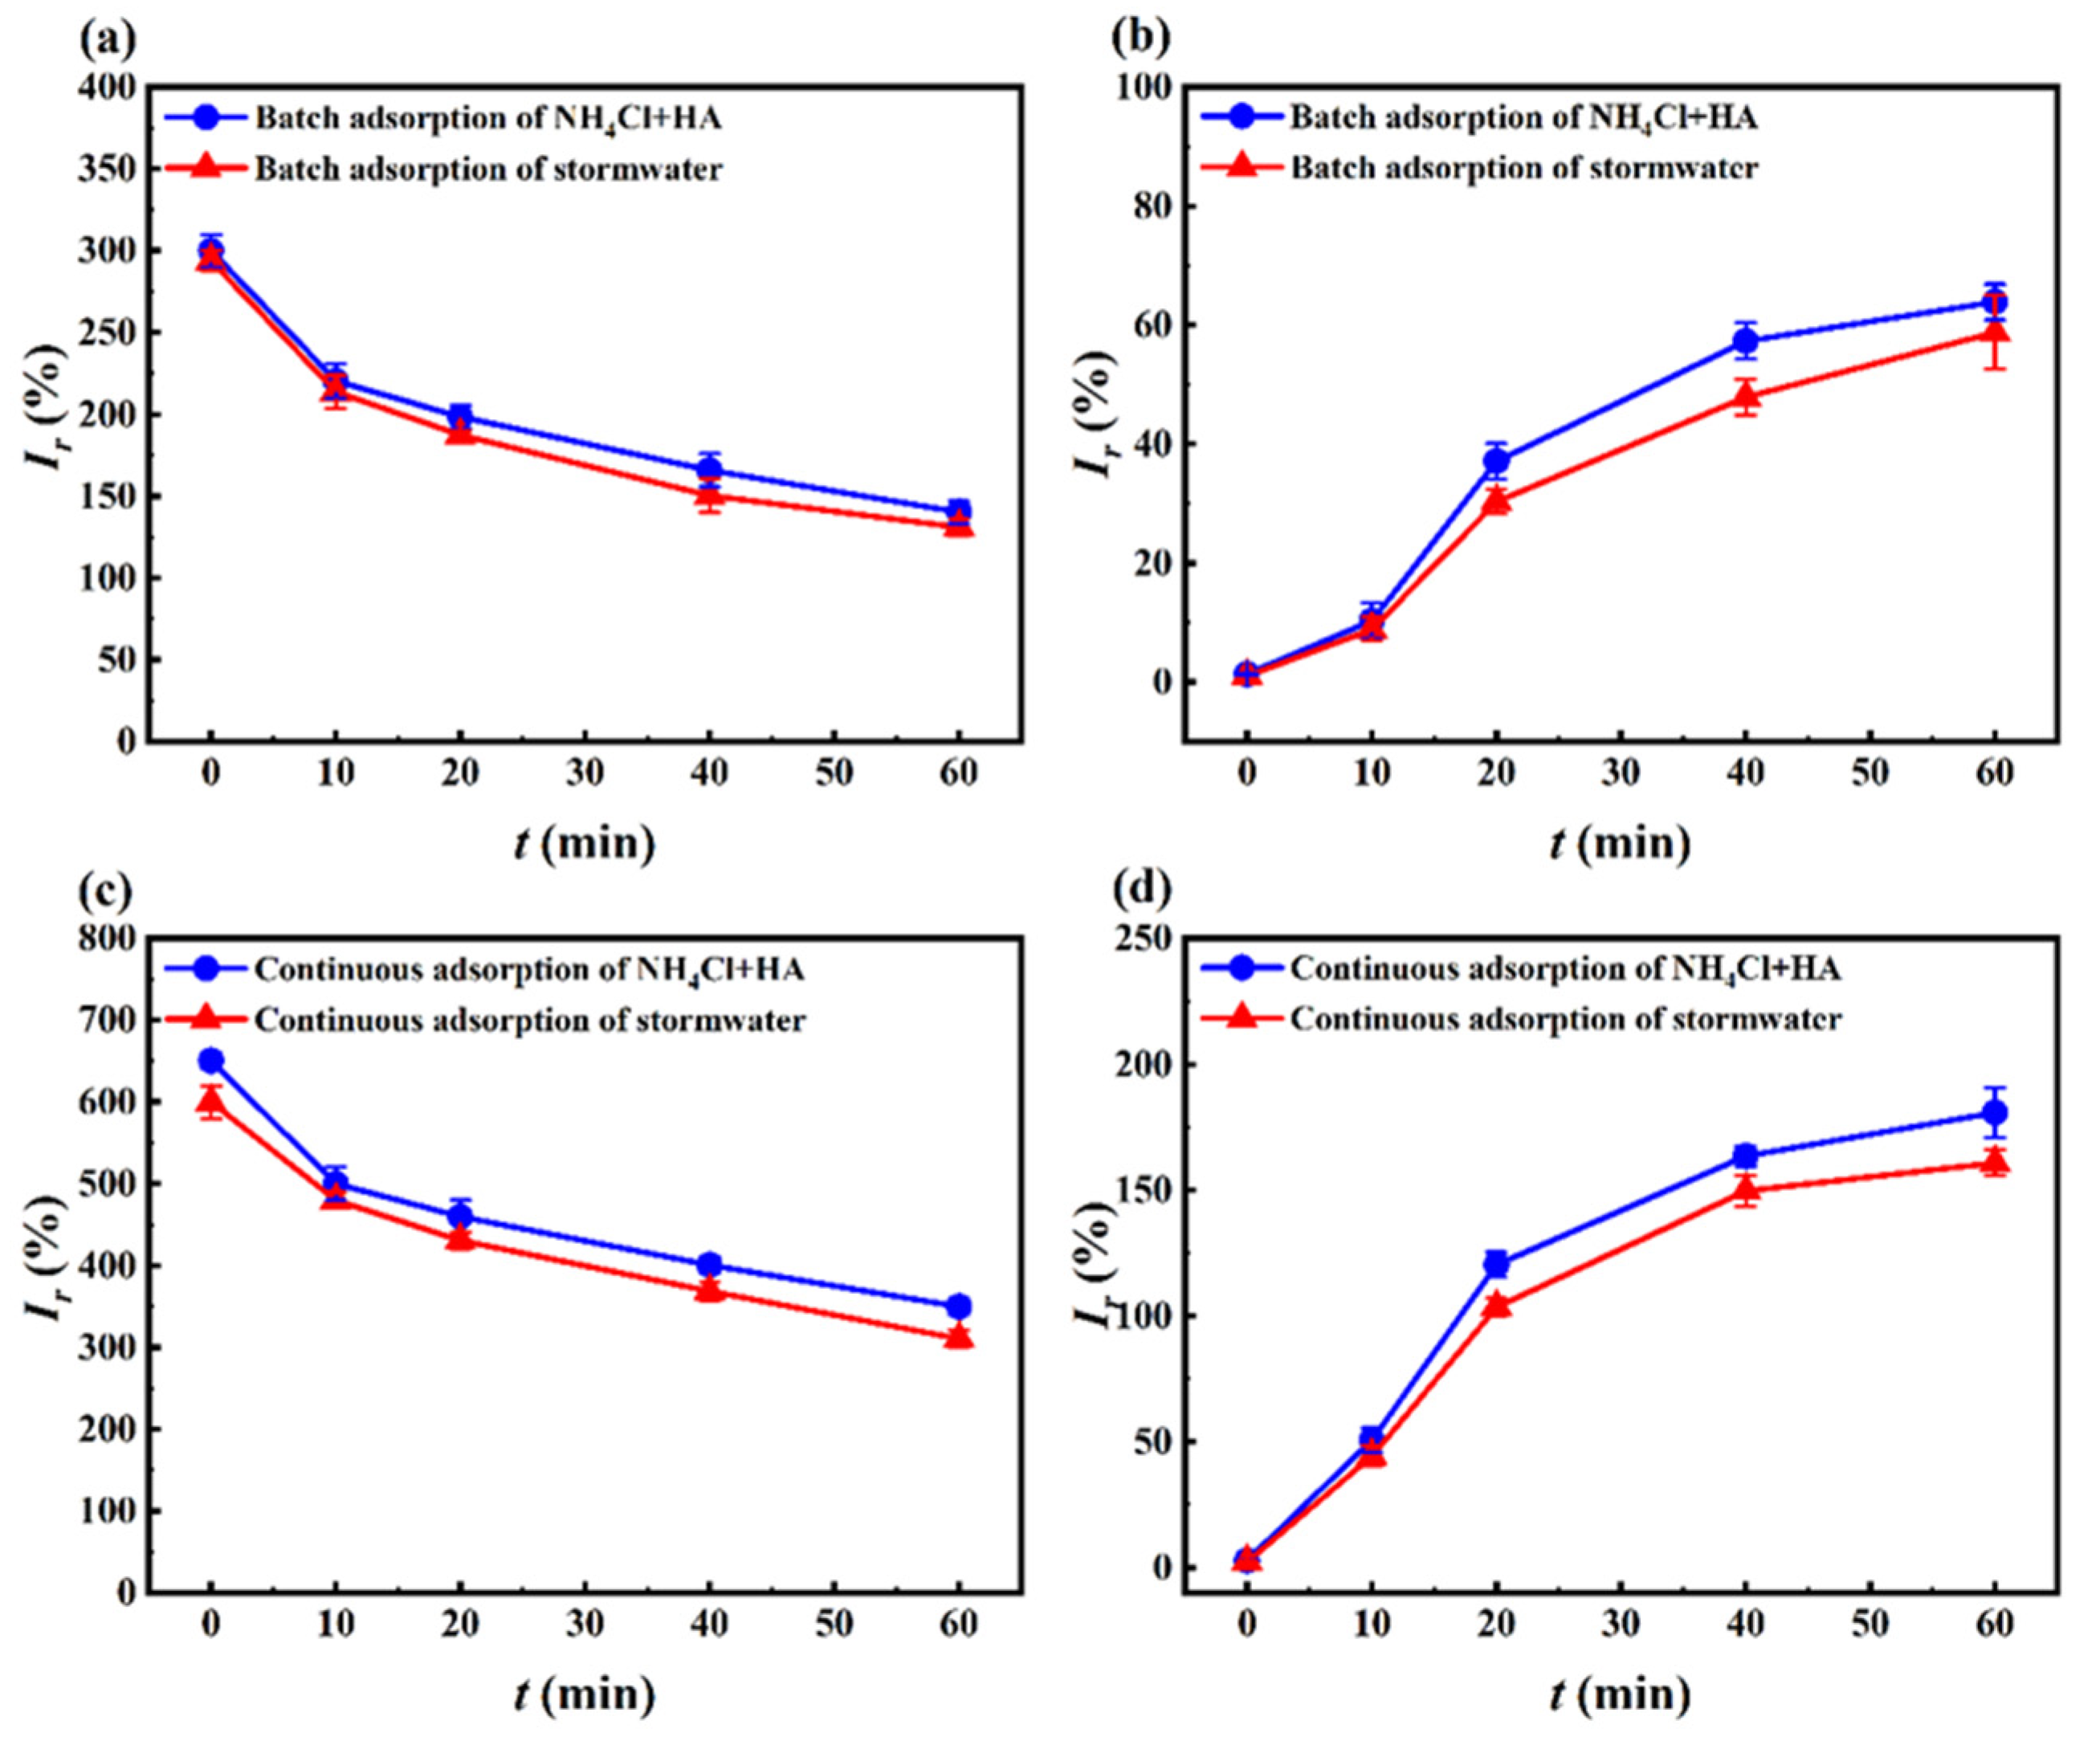
3.5. Changes in Multiple Cycles

Figure 7 shows the changes of zeolite adsorption and regeneration, chlorine species, and toxicity during 10 cycles of intermittent operations with the NH4Cl + HA solution and stormwater. In each cycle, a new NaCl-NaClO solution (0.5 g/L NaCl, ClO: N molar ratio of 1.8, pH = 10) was prepared for zeolite regeneration.

3.5.1. Adsorption and Regeneration

The ammonia and organic matter adsorption capacity of zeolites showed decreasing trends with cycle time (Figure 7a). The ammonia adsorption capacities of zeolites for the NH4Cl + HA solution and stormwater diminished to 0.19 mg-N/g and 0.18 mg-N/g in the 10th cycle, respectively. On one hand, some of the ammonia became tightly bound within the zeolite micropores, making it challenging to be removed during the short regeneration process. On the other hand, the presence of other metal cations in stormwater and the increased Na+ content within the zeolites through regeneration processes enhanced the competitive adsorption with NH4+ [28]. Additionally, stormwater possessed moderate alkalinity, and the presence of Ca2+ interfered with the ammonia adsorption process. As shown in Figure 7b, ZRE and NRE at the 10th cycle were significantly improved compared to the initial, exhibiting 85.2% and 82.5% with the NH4Cl + HA solution and 80.0% and 78.4% with stormwater, respectively. Moreover, less than 3% of ammonia was converted to NO3-N. These results were consistent with the previous reports suggesting that the increased regeneration efficiencies were due to the zeolite’s modification by Na+ attachment, which activated new sites and expanded the specific surface area [28,30]. Narbaitz et al. [29] also observed that the binding sites of K+ and Ca2+ in zeolites gradually decreased after Na+ exchange and zeolite regeneration, which was more conducive to the adsorption and removal of ammonia by zeolites. The zeolite adsorption capacity for DOC also decreased, with capacities of only 0.008 mg/g (NH₄Cl + HA) and 0.006 mg/g (stormwater) by the 10th adsorption cycle. While 33.3% of DOC initially remained in zeolites, HA accumulation increased in subsequent cycles due to incomplete removal during short oxidation periods. Xu et al. [76] similarly reported 16.5% residual DOC left in the zeolite after NaCl regeneration, indicating that the DOC accumulation affected the sustainable operation of the adsorption column. In addition, it had been reported that the chlorine content of zeolite increases after the adsorption of chloride by XRD analysis; the TCM and HAA presented in the regeneration solution could also be partially adsorbed, resulting in a decrease in the HA adsorption capacity of zeolite [77,78].

3.5.2. Chlorine Species

ClO3 remained at low levels at the end of the regeneration in multiple cycles, ranging from 1.90 mg/L to 2.08 mg/L (NH₄Cl + HA solution) and from 1.33 mg/L to 1.96 mg/L (stormwater), respectively (Figure 7c). Figure 7d–f shows that the concentration of TCAA was the highest in operations with NH4Cl + HA solution, while the concentrations of TCM were the highest in those with stormwater. This pattern aligns with the COP trends shown in Figure 3. TCAA concentrations decreased significantly over cycles in operations with the NH4Cl + HA solution, which were 41.92 μg/L, 35.20 μg/L, and 11.70 μg/L in the 2nd, 5th, and 10th regenerations, respectively. In contrast, the TCM levels in operations with stormwater in the 2nd, 5th, and 10th cycles were 92.89 μg/L, 73.18 μg/L, and 45.55 μg/L, respectively. In the 10th cycle, the DCAA dropped to undetectable levels. The formation of COPs was related to their respective generation rates. It was reported that the rate constants for the reaction between NOM and active chlorine to form THM and TCAA were equivalent, about three orders of magnitude higher than the DCAA formation [79]. The attenuation of the COPs was correlated with the decrease in the zeolite adsorption capacity for DOC as the cycle time increased. This was because the adsorbed HA on the zeolites’ surface could be easily exchanged and oxidized, while HA that had penetrated into the zeolites’ pores was challenging to eliminate.

3.5.3. Toxicity

Due to the consistency between the algal acute toxicity tests and the toxicity calculation, the toxicity changes over multiple cycles were represented exclusively through the algal acute toxicity tests. Figure 7g shows that free chlorine continued to be the predominant contributor to the regeneration solutions. After quenching free chlorine, the inhibition rates of operations with the NH4Cl + HA solution in the 2nd, 5th, and 10th regeneration cycles were 50.1%, 45.1%, and 21.3%. Corresponding values for stormwater operations were 45.9%, 28.0%, and 22.5%. These changes were correlated with the progressive reduction in COP formation (Figure 7h). Notably, even after 10 cycles of regeneration, solutions retained a significant capacity to inhibit aquatic plant growth, showing the necessity for the separate collection and treatment of the regeneration solution.

4. Conclusions

This study investigated the zeolite NaCl-NaClO regeneration after adsorption with a NH4Cl + HA solution and stormwater, focusing on the following three aspects: adsorption and regeneration, chlorine species, and toxicity. The main conclusions are as follows:
(1)
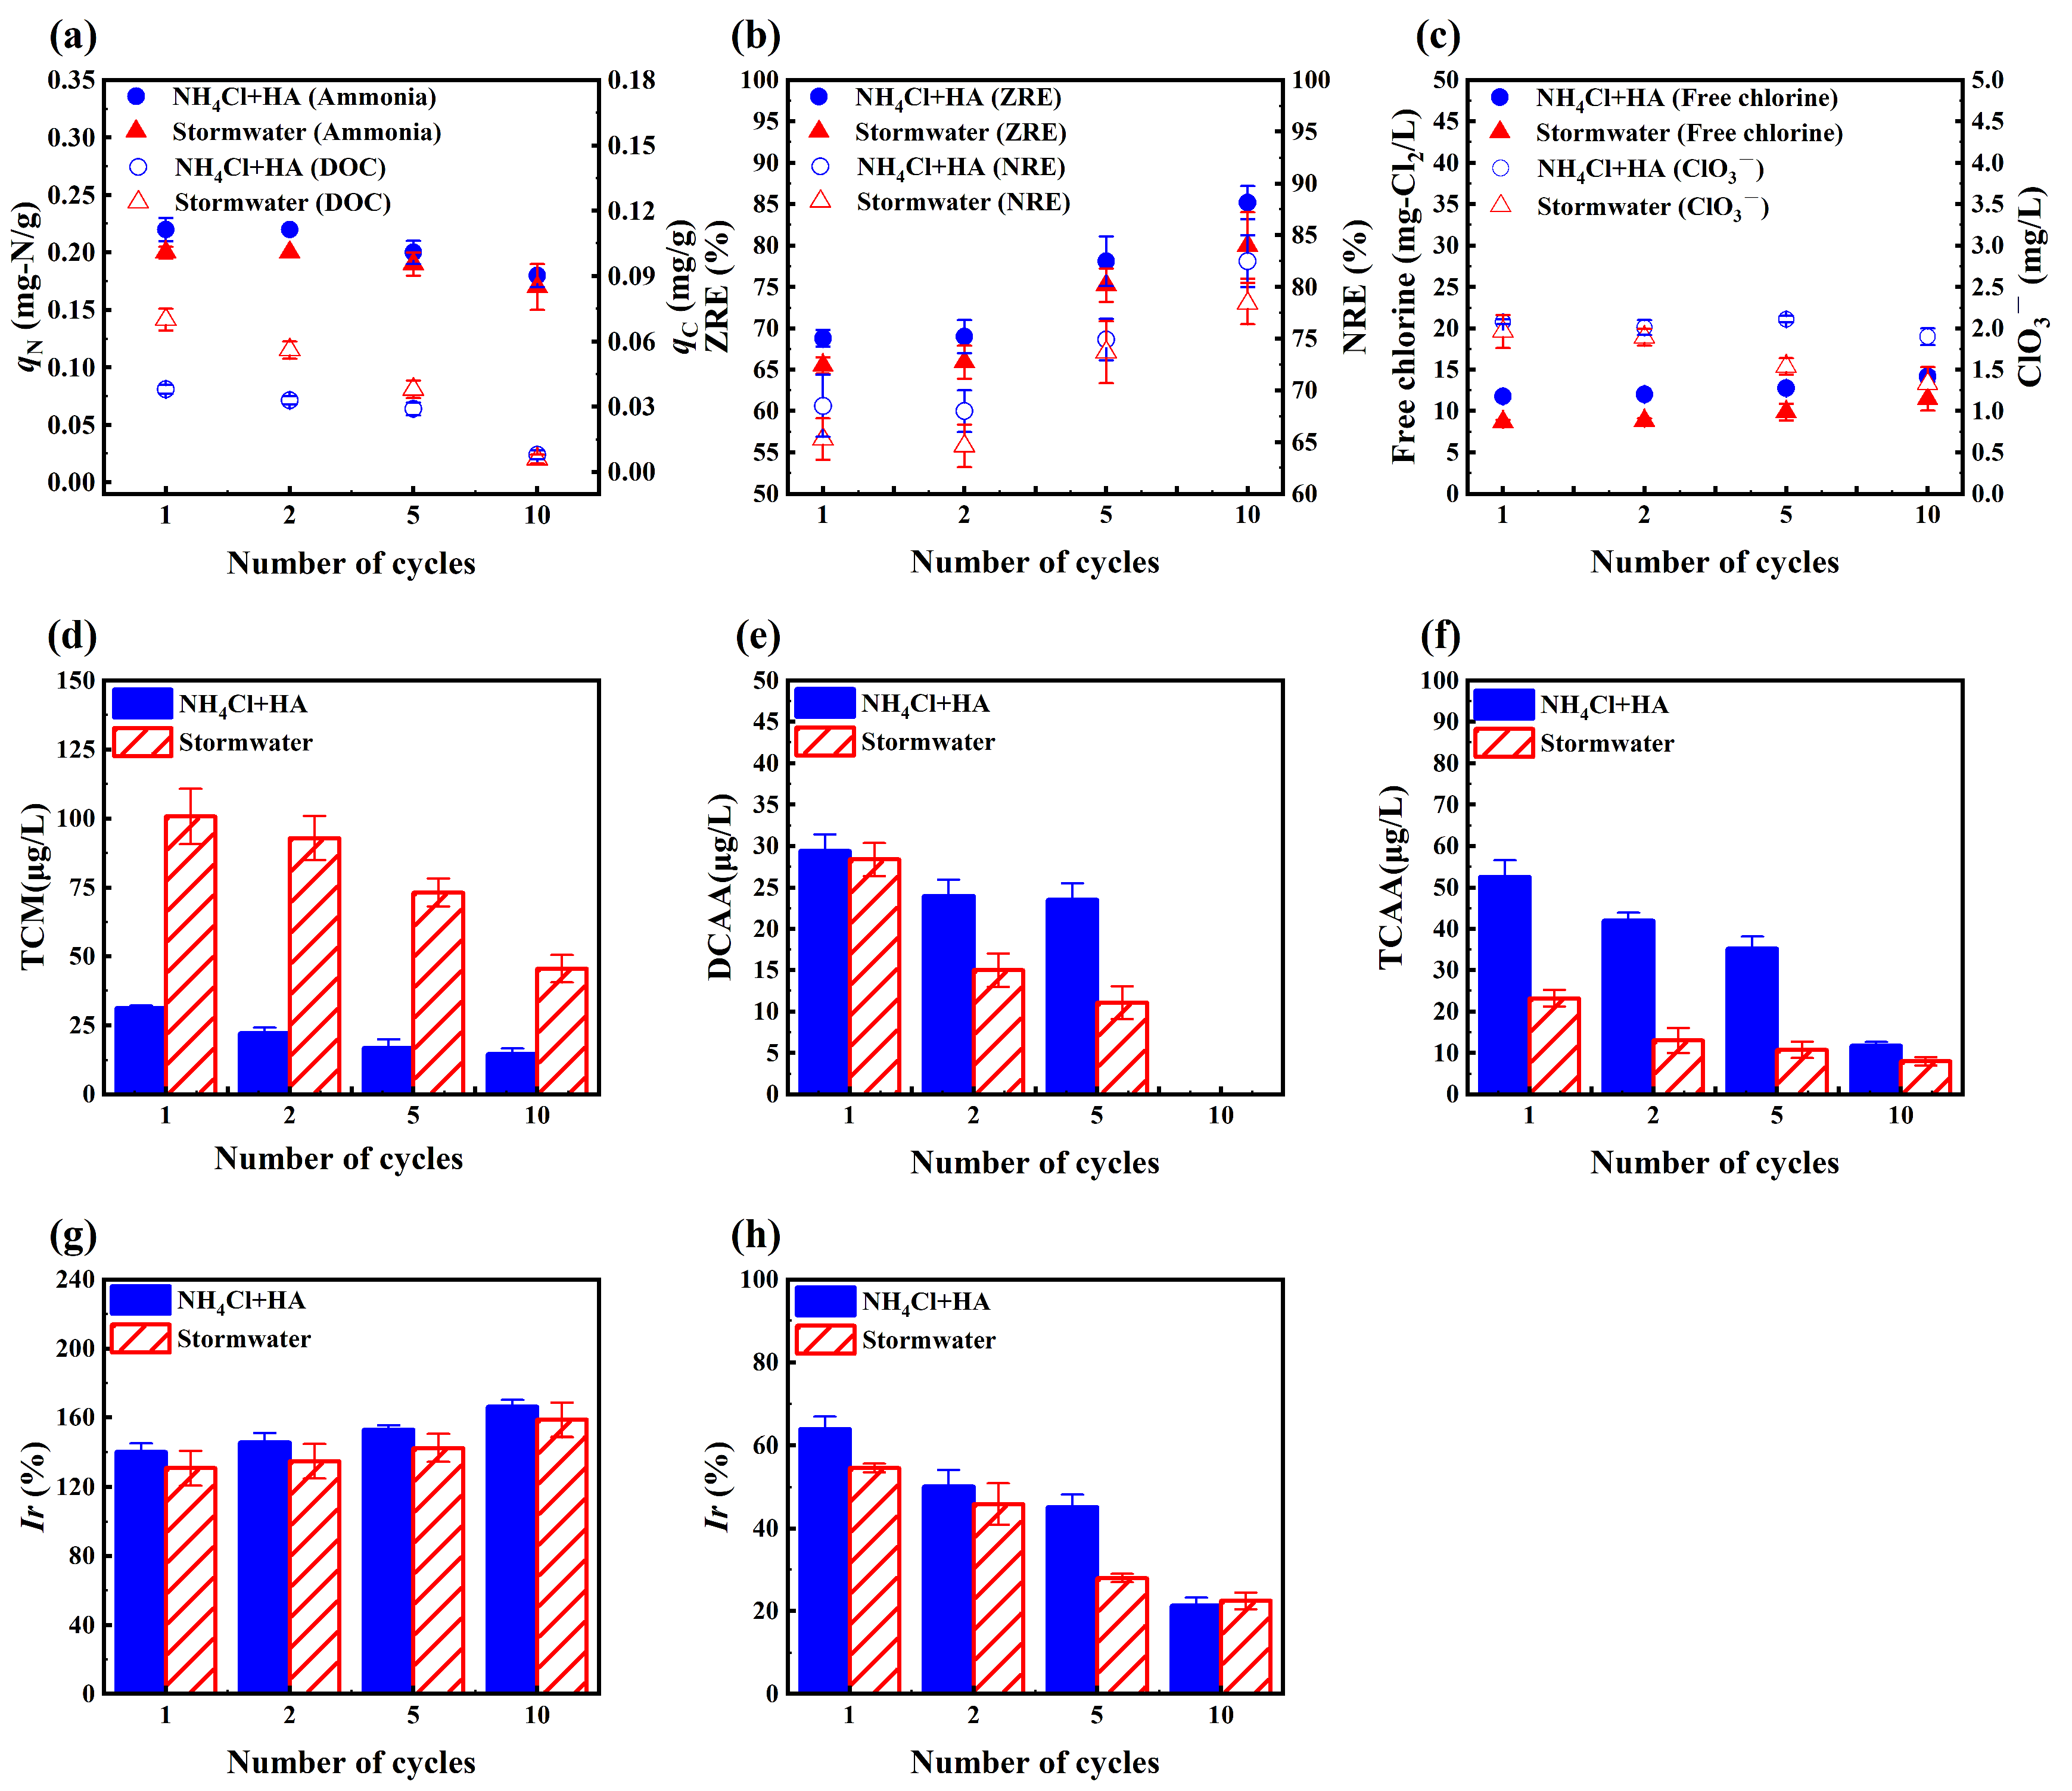
The adsorption process of ammonia and HA in the NH4Cl + HA solution and stormwater by zeolite followed pseudo-second-order kinetic characteristics. Zeolite exhibited a higher adsorption capacity for HA in stormwater than in the NH4Cl + HA solution. The presence of ammonia had little impact on this process. NaCl-NaClO (0.5 g/L NaCl, ClO: N molar ratio of 1.8, pH = 10) demonstrated a stable zeolite regeneration performance, with a ZRE of 65.0–68.8% and an NRE of 62.8–65.5%. During the regeneration process, ammonia preferentially reacted with ClO to generate N2, while the gradual formation of COPs made it difficult for organic matter to mineralize.
(2)
Among the four sets of regeneration solutions, ClO3 was an inevitable AICS and degraded slowly within 1 h. TCAA and TCM were the dominant COPs in operations with the NH4Cl + HA solution and stormwater, respectively. Based on comprehensive toxicity effects and stoichiometry, the toxicity order of chlorine species in the regeneration solution was free chlorine > COPs > ClO3. Due to the difference in adsorption capacity, the toxicity generated by continuous operations was three times that of intermittent operations. The total toxicity generated by COPs and ClO3 gradually increased over time. The zeolite regeneration using NaCl-NaClO required controlling the regeneration time to reduce the formation and toxicity of chlorine species.
(3)
During the 10 cycles, the zeolite adsorption capacity for ammonia and HA decreased gradually, while the ZRE and NRE increased. There was a notable accumulation of HA in the zeolites. Chlorine species continued to be formed during the regeneration process and produced a high toxicity hazard, although all of them showed a decreasing trend.
(4)
In engineering applications, it is advisable to collect the regeneration solution separately for the treatment of stable COPs and ClO3. Future research could focus on exploring the way the regeneration solution treatment as well as the quantitative detection and toxicity evaluation of other unregulated yet harmful substances during the regeneration.

Supplementary Materials

The following supporting information can be downloaded at: https://www.mdpi.com/article/10.3390/w17131955/s1. Text S1: Coagulation-precipitation condition; Text S2: Calculation equations of zeolite regeneration efficiency (ZRE) and nitrogen removal efficiency (NRE); Text S3: Algal acute toxicity test conditions; Text S4: Pretreatment methods and testing procedures of COPs; Text S5: Detection limits of water quality indicators; Text S6: Experimental conditions for adsorption kinetics; Text S7: NaCl-NaClO chlorination reaction condition; Text S8: Reaction equations in the chlorination reaction and the zeolite regeneration process; Figure S1: Three-dimensional fluorescence spectra of initial stormwater before and after coagulation–precipitation treatment; Figure S2: The changes during the NaCl-NaClO chlorination reaction of NH4Cl, HA, and NH4Cl + HA: (a) ammonia, (b) DOC, and (c) free chlorine; Table S1: Toxic effect values of chlorine species on the subject organisms; Table S2: Adsorption kinetic parameters of ammonia on zeolite; Table S3: Adsorption kinetic parameters of HA on zeolite; Table S4: Parameters of three models for the penetration curves of ammonia and DOC in continuous adsorption; Table S5: Parameters of absorption and regeneration in intermittent and continuous operation with the NH4Cl + HA solution and stormwater.

Author Contributions

Formal analysis, W.L.; investigation, W.L.; data curation, W.L.; writing—original draft preparation, W.L.; writing—review and editing, X.C. and Y.L.; conceptualization, Y.L.; methodology, C.L.; validation, Y.Z.; supervision, Y.L. All authors have read and agreed to the published version of the manuscript.

Funding

This research received no external funding.

Data Availability Statement

Data are contained within the article or supplementary material.

Conflicts of Interest

The authors declare no conflicts of interest.

Abbreviations

The following abbreviations are used in this manuscript:
AICSActive inorganic chlorine species
BDLBelow detection limit
CHOChinese hamster ovary
CODChemical oxygen demand
COPsChlorinated organic products
DCAADichloroacetic acid
DCANDichloroacetonitrile
DOCDissolved organic carbon
DOMDissolved organic matter
ECDElectron capture detector
ECOSAREcological structure activity relationship
HAHumic acid
MCAAMonochloroacetic acid
NOMNatural organic matter
NRENitrogen removal efficiency
SCODSoluble chemical oxygen demand
SSSuspended solids
TCAATrichloroacetic acid
TCANTrichloroacetonitrile
TCMTrichloromethane
TN Total nitrogen
TPTotal phosphorus
U.S. EPAUnited State Environmental Protection Agency
WHOWorld Health Organization
ZREZeolite regeneration efficiency

References

  1. Kirshen, P.; Aytur, S.; Hecht, J.; Walker, A.; Burdick, D.; Jones, S.; Fennessey, N.; Bourdeau, R.; Mather, L. Integrated urban water management applied to adaptation to climate change. Urban Clim. 2018, 24, 247–263. [Google Scholar] [CrossRef]
  2. Shi, M.; Geng, B.; Zhao, T.; Wang, F. Influence of atmospheric deposition on surface water quality and DBP formation potential as well as control technology of rainwater DBPs: A review. Environ. Sci. Water Res. Technol. 2021, 7, 2156–2165. [Google Scholar] [CrossRef]
  3. Xu, J.; Wu, X.; Ge, X.; Tian, Y.; Ma, X.; Li, Y.; Xu, X.; Li, Z. Variations of Concentration Characteristics of Rainfall Runoff Pollutants in Typical Urban Living Areas. Bull. Environ. Contam. Toxicol. 2021, 106, 608–613. [Google Scholar] [CrossRef]
  4. Liu, Y.; Wang, C.; Yu, Y.; Chen, Y.; Du, L.; Qu, X.; Peng, W.; Zhang, M.; Gui, C. Effect of Urban Stormwater Road Runoff of Different Land Use Types on an Urban River in Shenzhen, China. Water 2019, 11, 2545. [Google Scholar] [CrossRef]
  5. Song, Y.; Du, X.; Ye, X. Analysis of Potential Risks Associated with Urban Stormwater Quality for Managed Aquifer Recharge. Int. J. Environ. Res. Public Health 2019, 16, 3121. [Google Scholar] [CrossRef] [PubMed]
  6. Xu, D.; Lee, L.Y.; Lim, F.Y.; Lyu, Z.; Zhu, H.; Ong, S.L.; Hu, J. Water treatment residual: A critical review of its applications on pollutant removal from stormwater runoff and future perspectives. J. Environ. Manag. 2020, 259, 109649. [Google Scholar] [CrossRef]
  7. State Environmental Protection Administration, Environmental Quality Standard for Surface Water: GB3838-2002. 2002. Available online: https://www.mee.gov.cn/ywgz/fgbz/bz/bzwb/shjbh/shjzlbz/200206/t20020601_66497.shtml (accessed on 20 June 2025).
  8. Wang, K.; Zhou, Z.; Qiang, J.; Yu, S.; Wang, X.; Yuan, Y.; Zhao, X.; Qin, Y.; Xiao, K. Emerging wastewater treatment strategy for efficient nitrogen removal and compact footprint by coupling mainstream nitrogen separation with chemical coagulation and biological aerated filter. Bioresour. Technol. 2021, 320, 124389. [Google Scholar] [CrossRef]
  9. Nyström, F.; Nordqvist, K.; Herrmann, I.; Hedström, A.; Viklander, M. Laboratory scale evaluation of coagulants for treatment of stormwater. J. Water Process Eng. 2020, 36, 101271. [Google Scholar] [CrossRef]
  10. Zong, Y.; Jin, X.; Li, Y.; Shang, Y.; Wang, Y.; Jin, P.; Wang, X.C.; Guo, F.; Li, D. The coagulation behavior and mechanism of low-coagulability organic matter (LCOM). Sep. Purif. Technol. 2024, 328, 125055. [Google Scholar] [CrossRef]
  11. Qin, Y.; Zhou, C.; Yu, S.; Pang, H.; Guo, J.; Wei, J.; Wang, L.; Xing, Y.; An, Y.; Zhou, Z. Optimization of a compact on-site stormwater runoff treatment system: Process performance and reactor design. Chemosphere 2023, 315, 137767. [Google Scholar] [CrossRef]
  12. Lucke, T.; Drapper, D.; Hornbuckle, A. Urban stormwater characterisation and nitrogen composition from lot-scale catchments—New management implications. Sci. Total. Environ. 2018, 619, 65–71. [Google Scholar] [CrossRef] [PubMed]
  13. Qiang, J.; Zhou, Z.; Wang, K.; Qiu, Z.; Zhi, H.; Yuan, Y.; Zhang, Y.; Jiang, Y.; Zhao, X.; Wang, Z.; et al. Coupling ammonia nitrogen adsorption and regeneration unit with a high-load anoxic/aerobic process to achieve rapid and efficient pollutants removal for wastewater treatment. Water Res. 2020, 170, 115280. [Google Scholar] [CrossRef] [PubMed]
  14. Sun, Y.; Zhang, D.; Wang, Z.-W. The potential of using biological nitrogen removal technique for stormwater treatment. Ecol. Eng. 2017, 106, 482–495. [Google Scholar] [CrossRef]
  15. Morales-Figueroa, C.; Castillo-Suárez, L.A.; Linares-Hernández, I.; Martínez-Miranda, V.; Teutli-Sequeira, E.A. Treatment processes and analysis of rainwater quality for human use and consumption regulations, treatment systems and quality of rainwater. Int. J. Environ. Sci. Technol. 2023, 20, 9369–9392. [Google Scholar] [CrossRef]
  16. Xi, J.; Zhou, Z.; Yuan, Y.; Xiao, K.; Qin, Y.; Wang, K.; An, Y.; Ye, J.; Wu, Z. Enhanced nutrient removal from stormwater runoff by a compact on-site treatment system. Chemosphere 2022, 290, 133314. [Google Scholar] [CrossRef]
  17. Lahav, O.; Schwartz, Y.; Nativ, P.; Gendel, Y. Sustainable removal of ammonia from anaerobic-lagoon swine waste effluents using an electrochemically-regenerated ion exchange process. Chem. Eng. J. 2013, 218, 214–222. [Google Scholar] [CrossRef]
  18. Niri, M.V.; Mahvi, A.H.; Alimohammadi, M.; Shirmardi, M.; Golastanifar, H.; Mohammadi, M.J.; Naeimabadi, A.; Khishdost, M. Removal of natural organic matter (NOM) from an aqueous solution by NaCl and surfactant-modified clinoptilolite. J. Water Health 2015, 13, 394–405. [Google Scholar] [CrossRef]
  19. Liu, G.-H.; Wang, Y.; Zhang, Y.; Xu, X.; Qi, L.; Wang, H. Modification of natural zeolite and its application to advanced recovery of organic matter from an ultra-short-SRT activated sludge process effluent. Sci. Total. Environ. 2019, 652, 1366–1374. [Google Scholar] [CrossRef]
  20. Hong, N.; Li, Y.; Liu, J.; Yang, M.; Liu, A. A snapshot on trihalomethanes formation in urban stormwater: Implications for its adequacy as an alternative water resource. J. Environ. Chem. Eng. 2022, 10, 107180. [Google Scholar] [CrossRef]
  21. Wang, Z.; Liao, Y.; Li, X.; Shuang, C.; Pan, Y.; Li, Y.; Li, A. Effect of ammonia on acute toxicity and disinfection byproducts formation during chlorination of secondary wastewater effluents. Sci. Total. Environ. 2022, 826, 153916. [Google Scholar] [CrossRef]
  22. Li, X.-F.; Mitch, W.A. Drinking Water Disinfection Byproducts (DBPs) and Human Health Effects: Multidisciplinary Challenges and Opportunities. Environ. Sci. Technol. 2018, 52, 1681–1689. [Google Scholar] [CrossRef]
  23. Feretti, D.; Zerbini, I.; Ceretti, E.; Villarini, M.; Zani, C.; Moretti, M.; Fatigoni, C.; Orizio, G.; Donato, F.; Monarca, S. Evaluation of chlorite and chlorate genotoxicity using plant bioassays and in vitro DNA damage tests. Water Res. 2008, 42, 4075–4082. [Google Scholar] [CrossRef]
  24. Kali, S.; Khan, M.; Ghaffar, M.S.; Rasheed, S.; Waseem, A.; Iqbal, M.M.; Niazi, M.B.K.; Zafar, M.I. Occurrence, influencing factors, toxicity, regulations, and abatement approaches for disinfection by-products in chlorinated drinking water: A comprehensive review. Environ. Pollut. 2021, 281, 116950. [Google Scholar] [CrossRef] [PubMed]
  25. Ding, S.; Chu, W.; Krasner, S.W.; Yu, Y.; Fang, C.; Xu, B.; Gao, N. The stability of chlorinated, brominated, and iodinated haloacetamides in drinking water. Water Res. 2018, 142, 490–500. [Google Scholar] [CrossRef]
  26. Wang, X.-X.; Liu, B.-M.; Lu, M.-F.; Li, Y.-P.; Jiang, Y.-Y.; Zhao, M.-X.; Huang, Z.-X.; Pan, Y.; Miao, H.-F.; Ruan, W.-Q. Characterization of algal organic matter as precursors for carbonaceous and nitrogenous disinfection byproducts formation: Comparison with natural organic matter. J. Environ. Manag. 2021, 282, 111951. [Google Scholar] [CrossRef] [PubMed]
  27. Huang, H.; Yang, L.; Xue, Q.; Liu, J.; Hou, L.; Ding, L. Removal of ammonium from swine wastewater by zeolite combined with chlorination for regeneration. J. Environ. Manag. 2015, 160, 333–341. [Google Scholar] [CrossRef] [PubMed]
  28. Zhang, W.; Zhou, Z.; An, Y.; Du, S.; Ruan, D.; Zhao, C.; Ren, N.; Tian, X. Optimization for zeolite regeneration and nitrogen removal performance of a hypochlorite-chloride regenerant. Chemosphere 2017, 178, 565–572. [Google Scholar] [CrossRef]
  29. Narbaitz, R.M.; Akerele, G.O.; Sartaj, M.; Downey, J. Chlorine regeneration of a zeolite ion-exchange column for ammonia removal from an explosives-impacted mining wastewater. Environ. Technol. 2025, 46, 1–14. [Google Scholar] [CrossRef]
  30. Kukučka, M.; Stojanović, N.K.; Foglar, L. Enhancement of synthetic zeolite (Crystal-Right) adsorption characteristics toward NH4+ by regeneration. Desalin. Water Treat. 2017, 80, 326–336. [Google Scholar] [CrossRef]
  31. Pandian, A.M.K.; Rajamehala, M.; Singh, M.V.P.; Sarojini, G.; Rajamohan, N. Potential risks and approaches to reduce the toxicity of disinfection by-product—A review. Sci. Total Environ. 2022, 822, 153323. [Google Scholar] [CrossRef]
  32. Rodak, C.M.; Moore, T.L.; David, R.; Jayakaran, A.D.; Vogel, J.R. Urban stormwater characterization, control, and treatment. Water Environ. Res. 2019, 91, 1034–1060. [Google Scholar] [CrossRef] [PubMed]
  33. Zhou, C.T.; Zhu, S.L.; Yang, D.H.; An, Y.; Zhou, Z.; Yu, S.Q. Pilot Study on On-site Rapid Treatment Technology of Initial Rainwater. China Water Wastewater 2022, 38, 108–113. [Google Scholar] [CrossRef]
  34. Du, Q.; Liu, S.; Cao, Z.; Wang, Y. Ammonia removal from aqueous solution using natural Chinese clinoptilolite. Sep. Purif. Technol. 2005, 44, 229–234. [Google Scholar] [CrossRef]
  35. OECD. OECD Guidelines for the Testing of Chemicals, Section 2; OECD: Paris, France, 2011. [Google Scholar]
  36. Li, C.; Luo, G.; Liu, Y. Comparison on the formation and toxicity for chlorinated products during the oxidation of acetic acid (CH3COOH) by three widely used advanced oxidation processes (AOPs) at the presence of Cl−. J. Environ. Chem. Eng. 2023, 11, 111501. [Google Scholar] [CrossRef]
  37. Cui, H.; Zhu, X.; Zhu, Y.; Huang, Y.; Chen, B. Ecotoxicological effects of DBPs on freshwater phytoplankton communities in co-culture systems. J. Hazard. Mater. 2022, 421, 126679. [Google Scholar] [CrossRef]
  38. Lau, S.S.; Wei, X.; Bokenkamp, K.; Wagner, E.D.; Plewa, M.J.; Mitch, W.A. Assessing Additivity of Cytotoxicity Associated with Disinfection Byproducts in Potable Reuse and Conventional Drinking Waters. Environ. Sci. Technol. 2020, 54, 5729–5736. [Google Scholar] [CrossRef]
  39. Wagner, E.D.; Plewa, M.J. CHO cell cytotoxicity and genotoxicity analyses of disinfection by-products: An updated review. J. Environ. Sci. 2017, 58, 64–76. [Google Scholar] [CrossRef] [PubMed]
  40. Tomazic–Jezic, V.; Lucas, A.; Lamanna, A.; Stratmeyer, M. Quantitation of Natural Rubber Latex Proteins: Evaluation of Various Protein Measurement Methods. Toxicol. Mech. Methods 1999, 9, 153–164. [Google Scholar] [CrossRef]
  41. Frølund, B.; Palmgren, R.; Keiding, K.; Nielsen, P.H. Extraction of extracellular polymers from activated sludge using a cation exchange resin. Water Res. 1996, 30, 1749–1758. [Google Scholar] [CrossRef]
  42. APHA. Standard Methods for the Examination of Water and Wastewater; American Public Health Association: Washington, DC, USA, 2012. [Google Scholar]
  43. Baig, U.; Faizan, M.; Sajid, M. Effective removal of hazardous pollutants from water and deactivation of water-borne pathogens using multifunctional synthetic adsorbent materials: A review. J. Clean. Prod. 2021, 302, 126735. [Google Scholar] [CrossRef]
  44. Alomar, T.; Qiblawey, H.; Almomani, F.; Al-Raoush, R.I.; Han, D.S.; Ahmad, N.M. Recent advances on humic acid removal from wastewater using adsorption process. J. Water Process Eng. 2023, 53, 103679. [Google Scholar] [CrossRef]
  45. Yao, A.K.Z.; Jiun, L.W.; Yong, L.C.; Shi, C.Y.; Seng, O.B. Ammonium sorption and regeneration using Mg-modified zeolites: A study on the interferences of competing ions from aquaculture effluent. J. Water Process. Eng. 2022, 48, 102909. [Google Scholar] [CrossRef]
  46. Jha, V.K.; Hayashi, S. Modification on natural clinoptilolite zeolite for its NH4+ retention capacity. J. Hazard. Mater. 2009, 169, 29–35. [Google Scholar] [CrossRef]
  47. Moussavi, G.; Talebi, S.; Farrokhi, M.; Sabouti, R.M. The investigation of mechanism, kinetic and isotherm of ammonia and humic acid co-adsorption onto natural zeolite. Chem. Eng. J. 2011, 171, 1159–1169. [Google Scholar] [CrossRef]
  48. Croué, J.P.; Lefebvre, E.; Martin, B.; Legube, B. Removal of Dissolved Hydrophobic and Hydrophilic Organic Substances during Coagulation/Flocculation of Surface Waters. Water Sci. Technol. 1993, 27, 143–152. [Google Scholar] [CrossRef]
  49. Shi, X.; Xu, C.; Hu, H.; Tang, F.; Sun, L. Characterization of dissolved organic matter in the secondary effluent of pulp and paper mill wastewater before and after coagulation treatment. Water Sci. Technol. 2016, 74, 1346–1353. [Google Scholar] [CrossRef]
  50. Driss, K.; Bouhelassa, M. Modeling drinking water chlorination at the breakpoint: I. Derivation of breakpoint reactions. Desalin. Water Treat. 2014, 52, 5757–5768. [Google Scholar] [CrossRef]
  51. Chuang, Y.-H.; Chou, C.-S.; Chu, Y.-L. Unveiling the critical pathways of hydroxyl radical formation in breakpoint chlorination: The role of trichloramine and di-chloramine interactions. Environ. Sci. Technol. 2024, 58, 21086–21096. [Google Scholar] [CrossRef]
  52. Gao, J.-N.; Ma, Q.-Q.; Wang, Z.-W.; Rittmann, B.E.; Zhang, W. Direct electrosynthesis and separation of ammonia and chlorine from waste streams via a stacked membrane-free electrolyzer. Nat. Commun. 2024, 15, 8455. [Google Scholar] [CrossRef]
  53. Hu, C.-Y.; Li, A.-P.; Lin, Y.-L.; Ling, X.; Cheng, M. Degradation kinetics and DBP formation during chlorination of metribuzin. J. Taiwan Inst. Chem. Eng. 2017, 80, 255–261. [Google Scholar] [CrossRef]
  54. Stefán, D.; Erdélyi, N.; Izsák, B.; Záray, G.; Vargha, M. Formation of chlorination by-products in drinking water treatment plants using breakpoint chlorination. Microchem. J. 2019, 149, 104008. [Google Scholar] [CrossRef]
  55. Liu, Z.; Tao, Y.; Zhang, Z.; He, J.; Yang, K.; Ma, J. Active chlorine mediated ammonia oxidation in an electrified SnO2–Sb filter: Reactivity, mechanisms and response to matrix effects. Sep. Purif. Technol. 2023, 312, 123369. [Google Scholar] [CrossRef]
  56. Nikolaou, A.D.; Lekkas, T.D. The role of natural organic matter during formation of chlorination by-products: A review. Acta Hydroch. Hydrob. 2001, 29, 63–77. [Google Scholar] [CrossRef]
  57. Du, Y.; Wu, Q.-Y.; Lu, Y.; Hu, H.-Y.; Yang, Y.; Liu, R.; Liu, F. Increase of cytotoxicity during wastewater chlorination: Impact factors and surrogates. J. Hazard. Mater. 2017, 324, 681–690. [Google Scholar] [CrossRef]
  58. Asami, M.; Kosaka, K.; Kunikane, S. Bromate, chlorate, chlorite and perchlorate in sodium hypochlorite solution used in water supply. J. Water Supply: Res. Technol. AQUA 2009, 58, 107–115. [Google Scholar] [CrossRef]
  59. Meng, X.; Khoso, S.A.; Lyu, F.; Wu, J.; Kang, J.; Liu, H.; Zhang, Q.; Han, H.; Sun, W.; Hu, Y. Study on the influence and mechanism of sodium chlorate on COD reduction of minerals processing wastewater. Miner. Eng. 2019, 134, 1–6. [Google Scholar] [CrossRef]
  60. Rougé, V.; Lee, Y.; von Gunten, U.; Allard, S. Kinetic and mechanistic understanding of chlorite oxidation during chlorination: Optimization of ClO2 pre-oxidation for disinfection byproduct control. Water Res. 2022, 220, 118515. [Google Scholar] [CrossRef]
  61. van Wijk, D.J.; Kroon, S.G.; Garttener-Arends, I.C. Toxicity of Chlorate and Chlorite to Selected Species of Algae, Bacteria, and Fungi. Ecotoxicol. Environ. Saf. 1998, 40, 206–211. [Google Scholar] [CrossRef]
  62. Jakab-Nácsa, A.; Stomp, D.; Farkas, L.; Kaptay, G. Large NaCl-effect on the Decomposition Rate of Chlorate Ions in HCl-containing Brine Solutions and Its Consequences for the Chlor-alkali Industry. Period. Polytech. Chem. Eng. 2021, 65, 238–242. [Google Scholar] [CrossRef]
  63. Busch, M.; Simic, N.; Ahlberg, E. Exploring the mechanism of hypochlorous acid decomposition in aqueous solutions. Phys. Chem. Chem. Phys. 2019, 21, 19342–19348. [Google Scholar] [CrossRef]
  64. Lu, W.; Chen, N.; Feng, C.; Deng, Y.; Zhang, J.; Chen, F. Treatment of polluted river sediment by electrochemical oxidation: Changes of hydrophilicity and acute cytotoxicity of dissolved organic matter. Chemosphere 2020, 243, 125283. [Google Scholar] [CrossRef]
  65. Zhang, H.; Liu, H.; Zhao, X.; Qu, J.; Fan, M. Formation of disinfection by-products in the chlorination of ammonia-containing effluents: Significance of Cl2/N ratios and the DOM fractions. J. Hazard. Mater. 2011, 190, 645–651. [Google Scholar] [CrossRef] [PubMed]
  66. Ye, B.; Song, Z.-M.; Wu, D.-X.; Liang, J.-K.; Wang, W.-L.; Hu, W.; Yu, Y. Comparative molecular transformations of dissolved organic matter induced by chlorination and ammonia/chlorine oxidation process. Environ. Pollut. 2023, 339, 122771. [Google Scholar] [CrossRef]
  67. Nguyen, H.V.-M.; Lee, H.-S.; Lee, S.-Y.; Hur, J.; Shin, H.-S. Changes in structural characteristics of humic and fulvic acids under chlorination and their association with trihalomethanes and haloacetic acids formation. Sci. Total. Environ. 2021, 790, 148142. [Google Scholar] [CrossRef]
  68. Feng, W.; Ma, W.; Zhao, Q.; Li, F.; Zhong, D.; Deng, L.; Zhu, Y.; Li, Z.; Zhou, Z.; Wu, R.; et al. The mixed-order chlorine decay model with an analytical solution and corresponding trihalomethane generation model in drinking water. Environ. Pollut. 2023, 335, 122227. [Google Scholar] [CrossRef]
  69. Cai, L.; Huang, H.; Li, Q.; Deng, J.; Ma, X.; Zou, J.; Li, G.; Chen, G. Formation characteristics and acute toxicity assessment of THMs and HAcAms from DOM and its different fractions in source water during chlorination and chloramination. Chemosphere 2023, 329, 138696. [Google Scholar] [CrossRef] [PubMed]
  70. Malamis, S.; Katsou, E. A review on zinc and nickel adsorption on natural and modified zeolite, bentonite and vermiculite: Examination of process parameters, kinetics and isotherms. J. Hazard. Mater. 2013, 252, 428–461. [Google Scholar] [CrossRef]
  71. Feng, H.; Liao, X.; Yang, R.; Chen, S.; Zhang, Z.; Tong, J.; Liu, J.; Wang, X. Generation, toxicity, and reduction of chlorinated byproducts: Overcome bottlenecks of electrochemical advanced oxidation technology to treat high chloride wastewater. Water Res. 2023, 230, 119531. [Google Scholar] [CrossRef] [PubMed]
  72. Cui, H.; Chen, B.; Jiang, Y.; Tao, Y.; Zhu, X.; Cai, Z. Toxicity of 17 Disinfection By-products to Different Trophic Levels of Aquatic Organisms: Ecological Risks and Mechanisms. Environ. Sci. Technol. 2021, 55, 10534–10541. [Google Scholar] [CrossRef] [PubMed]
  73. Zheng, T.; Wang, Q.; Shi, Z.; Fang, Y.; Shi, S.; Wang, J.; Wu, C. Advanced treatment of wet-spun acrylic fiber manufacturing wastewater using three-dimensional electrochemical oxidation. J. Environ. Sci. 2016, 50, 21–31. [Google Scholar] [CrossRef]
  74. Han, J.; Zhang, X. Evaluating the Comparative Toxicity of DBP Mixtures from Different Disinfection Scenarios: A New Approach by Combining Freeze-Drying or Rotoevaporation with a Marine Polychaete Bioassay. Environ. Sci. Technol. 2018, 52, 10552–10561. [Google Scholar] [CrossRef]
  75. Chen, H.; Lin, T.; Chen, W.; Tao, H.; Xu, H. Removal of disinfection byproduct precursors and reduction in additive toxicity of chlorinated and chloraminated waters by ozonation and up-flow biological activated carbon process. Chemosphere 2019, 216, 624–632. [Google Scholar] [CrossRef]
  76. Xu, X.; Chen, G.; Wei, J.; Qin, Y.; Tang, R.; Wang, L.; Wei, H.; Zhou, C.; Wu, J.; Zhao, X.; et al. Effects of competitive cations and dissolved organic matter on ammonium exchange and up-concentration properties of ion exchangers from domestic wastewater under multicycle exchange—Regeneration operation. Sep. Purif. Technol. 2024, 345, 127274. [Google Scholar] [CrossRef]
  77. Koryabkina, N.; Bergendahl, J.; Thompson, R.; Giaya, A. Adsorption of disinfection byproducts on hydrophobic zeolites with regeneration by advanced oxidation. Microporous Mesoporous Mater. 2007, 104, 77–82. [Google Scholar] [CrossRef]
  78. Osio-Norgaard, J.; Srubar, W.V. Zeolite Adsorption of Chloride from a Synthetic Alkali-Activated Cement Pore Solution. Materials 2019, 12, 2019. [Google Scholar] [CrossRef] [PubMed]
  79. Huang, R.; Liu, Z.; Yan, B.; Zhang, J.; Liu, D.; Xu, Y.; Wang, P.; Cui, F.; Liu, Z. Formation kinetics of disinfection byproducts in algal-laden water during chlorination: A new insight into evaluating disinfection formation risk. Environ. Pollut. 2019, 245, 63–70. [Google Scholar] [CrossRef] [PubMed]
Figure 1. The intermittent and continuous adsorption processes of zeolites with NH4Cl + HA solution and stormwater: adsorption capacity of zeolites for ammonia (a) and HA (represented by DOC) (b) in the intermittent operations; the penetration curves of ammonia (c) and HA (represented by DOC) (d) in the continuous operations.
Water 17 01955 g001
Figure 2. The changes of TN, DOC, and free chlorine during regeneration processes in the intermittent operations with (a) the NH4Cl + HA solution and (b) stormwater.
Water 17 01955 g002
Figure 3. The changes of AICS and COPs during zeolite regeneration processes of the four sets: intermittent (a) and continuous (b) operations with the NH4Cl + HA solution; intermittent (c) and continuous (d) operations with stormwater.
Water 17 01955 g003
Figure 4. The changes of algal specific growth inhibition during regeneration in operations with the NH4Cl + HA solution and stormwater: (a,b) intermittent operations, (c,d) continuous operations, (a,c) unquenched, (b,d) quenched.
Water 17 01955 g004
Figure 5. Toxicity analysis of AICS in the regeneration solution of the four sets: (a,e) intermittent operations with the NH4Cl + HA solution; (b,f) intermittent operations with stormwater; (c,g) continuous operations with the NH4Cl + HA solution; (d,h) continuous operations with stormwater.
Water 17 01955 g005
Figure 6. Toxicity analysis of COPs in the regeneration solution of the four sets: (a,e,i,m) intermittent operation with the NH4Cl + HA solution; (b,f,j,n) intermittent operation with stormwater; (c,g,k,o) continuous operation with the NH4Cl + HA solution; (d,h,l,p) continuous operation with stormwater.
Water 17 01955 g006
Figure 7. Changes in 10 cycles of intermittent operations with the NH4Cl + HA solution and stormwater: (a) adsorption capacity of zeolites for ammonia and DOC; (b) ZRE and NRE; (c) AICS; (df) TCM, DCAA, and TCAA; (g,h) algal specific growth inhibition in unquenched and quenched regeneration solutions.
Water 17 01955 g007
Table 1. Parameters of stormwater before and after coagulation–precipitation.
Water Quality
Indicator
UnitRaw Initial StormwaterStormwater After Coagulation–Precipitation
DOCmg/L20.6 ± 0.110.6 ± 0.1
CODmg/L104 ± 146 ± 1
SCODmg/L80 ± 135 ± 1
TNmg/L10.05 ± 0.059.5 ± 0.05
Ammoniamg-N/L10.05 ± 0.029.50 ± 0.02
NO3mg-N/LBDL *BDL
NO2mg-N/LBDLBDL
Polysaccharidemg/L12.24 ± 0.2BDL
Proteinmg/L5.16 ± 0.3BDL
Humic acidmg/L18.93 ± 0.35.36 ± 0.3
Alkalinity (CaCO3)mg/L244.97 ± 0.2219.84 ± 0.2
TurbidityNTU70.1 ± 0.055.13 ± 0.05
SSmg/L138 ± 0.510 ± 0.5
Clmg/L46.5 ± 145.0 ± 1
pH/7.50 ± 0.17.50 ± 0.1
Note: BDL *: below detection limit.
Table 2. Parameters of the adsorption isotherm models for the zeolite adsorption of ammonia and HA.
ModelEquationParameterAmmonia (N)HA (DOC)
Langmuir 1 q e = 1 C e q m k L + 1 q m qm (mg/g)1.69 ± 0.010.110 ± 0.002
kL (L/mg)0.116 ± 0.0020.071 ± 0.005
R20.9960.966
Freundlich l n q e = 1 n l n C e + l n k F 1/n0.730 ± 0.0030.519 ± 0.005
kF (mg/g)0.168 ± 0.0020.012 ± 0.002
R20.9940.997
Note: qe is the equilibrium adsorption capacity of the zeolite (mg/g); qm is the maximum adsorption capacity of the zeolite (mg/g); Ce is the equilibrium concentration (mg/L); kL is the Langmuir adsorption isotherm constant (L/mg); kF is the Freundlich capacity factor (mg/g); n is the heterogeneity parameter. ± value is the standard error.
Disclaimer/Publisher’s Note: The statements, opinions and data contained in all publications are solely those of the individual author(s) and contributor(s) and not of MDPI and/or the editor(s). MDPI and/or the editor(s) disclaim responsibility for any injury to people or property resulting from any ideas, methods, instructions or products referred to in the content.

