Article

Comprehensive Evaluation of Pollution Status and Health Risk Assessment of Water Bodies in Different Reaches of the Shaying River

1
School of Life Sciences, Qufu Normal University, Qufu 273165, China
2
College of Life Sciences, Northwest A&F University, Yangling 712100, China
3
Jiangxi Poyang Lake National Nature Reserve Administration Bureau, Nanchang 330038, China
4
College of Life Sciences, Zaozhuang University, Zaozhuang 277160, China
5
Shandong Academy for Environmental Planning, Jinan 250101, China
*
Authors to whom correspondence should be addressed.
Water 2025, 17(13), 1892; https://doi.org/10.3390/w17131892
Submission received: 27 May 2025 / Revised: 21 June 2025 / Accepted: 23 June 2025 / Published: 25 June 2025
(This article belongs to the Section Water Quality and Contamination)

Abstract

In order to evaluate spatial pollution patterns of the Shaying River and assess human health risk, thirty-three sampling points were established in different reaches of the upper, middle, and lower reaches of the Shaying River. According to the difference in human activities and land use types, the sampling points were artificially divided into three areas: mountainous area, urban area, and agricultural area. Water samples and sediments were collected at each sampling site, and the physicochemical parameters of the water at each site were measured simultaneously. The nutrient content of water samples and the heavy metal content of sediments were measured in the laboratory. The water pollution status of the Shaying River, as well as the status of heavy metal pollution and its associated risk to human health, were assessed and analyzed using the Water Quality Index (WQI) method, principal component analysis (PCA) method, potential ecological risk index method, and health risk assessment method, respectively. The results of the Water Quality Index indicated that the water quality of the Shaying River was moderate, with the reaches in the urban area being more polluted, the agricultural area being the second most polluted, and the mountainous area being in better condition. The results of the principal component analysis showed that soluble ions, organic matter, and nutrients were the main factors contributing to water pollution in the Shaying River, and there was significant variability in the factors contributing to water pollution in different regions, with human activities being the main cause of this variation. The results of a potential ecological risk assessment of heavy metals in sediments showed that heavy metal pollution in the water bodies of the Shaying River was serious and had significant spatial variability. Mountain reaches were the most polluted, followed by agricultural reaches, and urban reaches were the least polluted. The results of the health risk assessment showed that non-carcinogenic risks of heavy metals in different reaches of the Shaying River were within acceptable limits, while carcinogenic risks in agricultural areas exceeded thresholds. Among them, agricultural areas had the highest health risk, with Cr being the most carcinogenic heavy metal and Pb and Cr being the most non-carcinogenic heavy metals. The assessment also found that children’s carcinogenic risk was 8.4 times higher than adult males and 7.3 times higher than adult females. This study involves the typical diverse areas where the Shaying River passes, in order to provide data support and a theoretical basis for environmental protection of the Shaying River Basin.

1. Introduction

Water quality plays a critical role in ecosystem health and public well-being [1]. In recent years, the deterioration of water quality has been becoming a global concern [2] due to the increasing intensity of human agricultural and industrial activities and the release of pollutants such as nitrogen, phosphorus, and heavy metals into the water environment [3]. Water quality in rivers is influenced by natural factors (atmospheric deposition, erosion, and mineral weathering) and human factors (industrial and agricultural discharge, domestic sewage discharge, etc.), which pose a serious challenge to river basin water management [4]. Water quality evaluation is the basis of river basin water resources management, and its content and evaluation standard are constantly improving [5]. The Water Quality Index (WQI) is a comprehensive evaluation method that combines the physical and chemical factors of a water body into a single value to evaluate the water quality of a watershed, avoiding the bias of single-factor water quality assessment methods and providing a more objective and comprehensive quantitative assessment of water quality [6,7]. Multivariate statistical techniques, including cluster analysis (CA) and principal component analysis (PCA), have the advantage of simplifying data structure and extracting potential information, and are becoming common methods to interpret complex water quality monitoring data and evaluate water quality spatio-temporal dynamics [8,9]. The combination of water quality evaluation methods and multivariate statistical technology is helpful to comprehensively evaluate the present situation and trends of river water quality and identify the main factors affecting water quality [10].
Besides nutrition and organic pollution, heavy metal pollution is an important part of river water pollution. Heavy metals in the environment can enter and enrich organisms along the food chain [11], and when they accumulate in excess of a certain amount in organisms, they can seriously affect the normal physiological functions of plants and animals and hinder their growth and development [12]. Heavy metal pollutants are widespread in three media: air, soil, and water, with a small amount of heavy metal pollutants entering rivers, dissolving in the water, and most remaining in sediment at the bottom of the river [13]. Sediment is a reservoir for heavy metals, and heavy metals in sediment can be interchanged with heavy metals in water during changes in the physicochemical environment of the water column [14]. The release of heavy metals from sediments into water can cause secondary pollution in rivers, and their levels are often considered an important index of heavy metal pollution in rivers [15]. In addition, sediments have been widely used for environmental protection because they are easy to sample, transport, and sensitive [16]. The degree of heavy metal pollution in the environment is assessed by measuring its heavy metal content [17].
The Shaying River flows through central Henan Province and is an important water source for agricultural irrigation in the main grain-producing areas of Henan Province [18]. The middle and lower reaches of the river are densely populated, and a large amount of industrial and agricultural wastewater and domestic sewage are discharged into the river, causing serious pollution to the water quality of the river [19]. Studies have shown that heavy metal pollution in the Shaying River basin is associated with local production and livelihoods [20] and has become a health hazard for residents in the basin [21]. In 2016, the “Thirteenth Five-Year Plan” of ecological environment protection in the State Council City, China, proposed that the Shaying River basin should significantly reduce the emission intensity of pollutants such as paper, fertilizers, and wine; effectively control ammonia nitrogen pollution; continuously improve water quality; and effectively prevent and control pollution emergencies [22]. The water quality of rivers is influenced by various factors such as nutrients, organic matter, and heavy metals [23,24,25]. Currently, most studies on water pollution in the Shaying River focus only on one aspect, lacking a comprehensive evaluation of water quality [26,27]. Furthermore, existing research has predominantly assessed the water quality status of the Shaying River [1], without utilizing multivariate statistical techniques to further analyze the factors influencing water quality. In addition, studies on heavy metal pollution in the Shaying River have been limited to ecological risk assessment [28], and there is a lack of studies on human health risk assessment. This study aims to (1) comprehensively assess the water quality of the Shaying River using multiple assessment methods; (2) investigate the potential ecological and health risks of heavy metals in the sediments of the Shaying River; and (3) to provide data support and to provide scientifically grounded recommendations for pollution control.

2. Materials and Methods
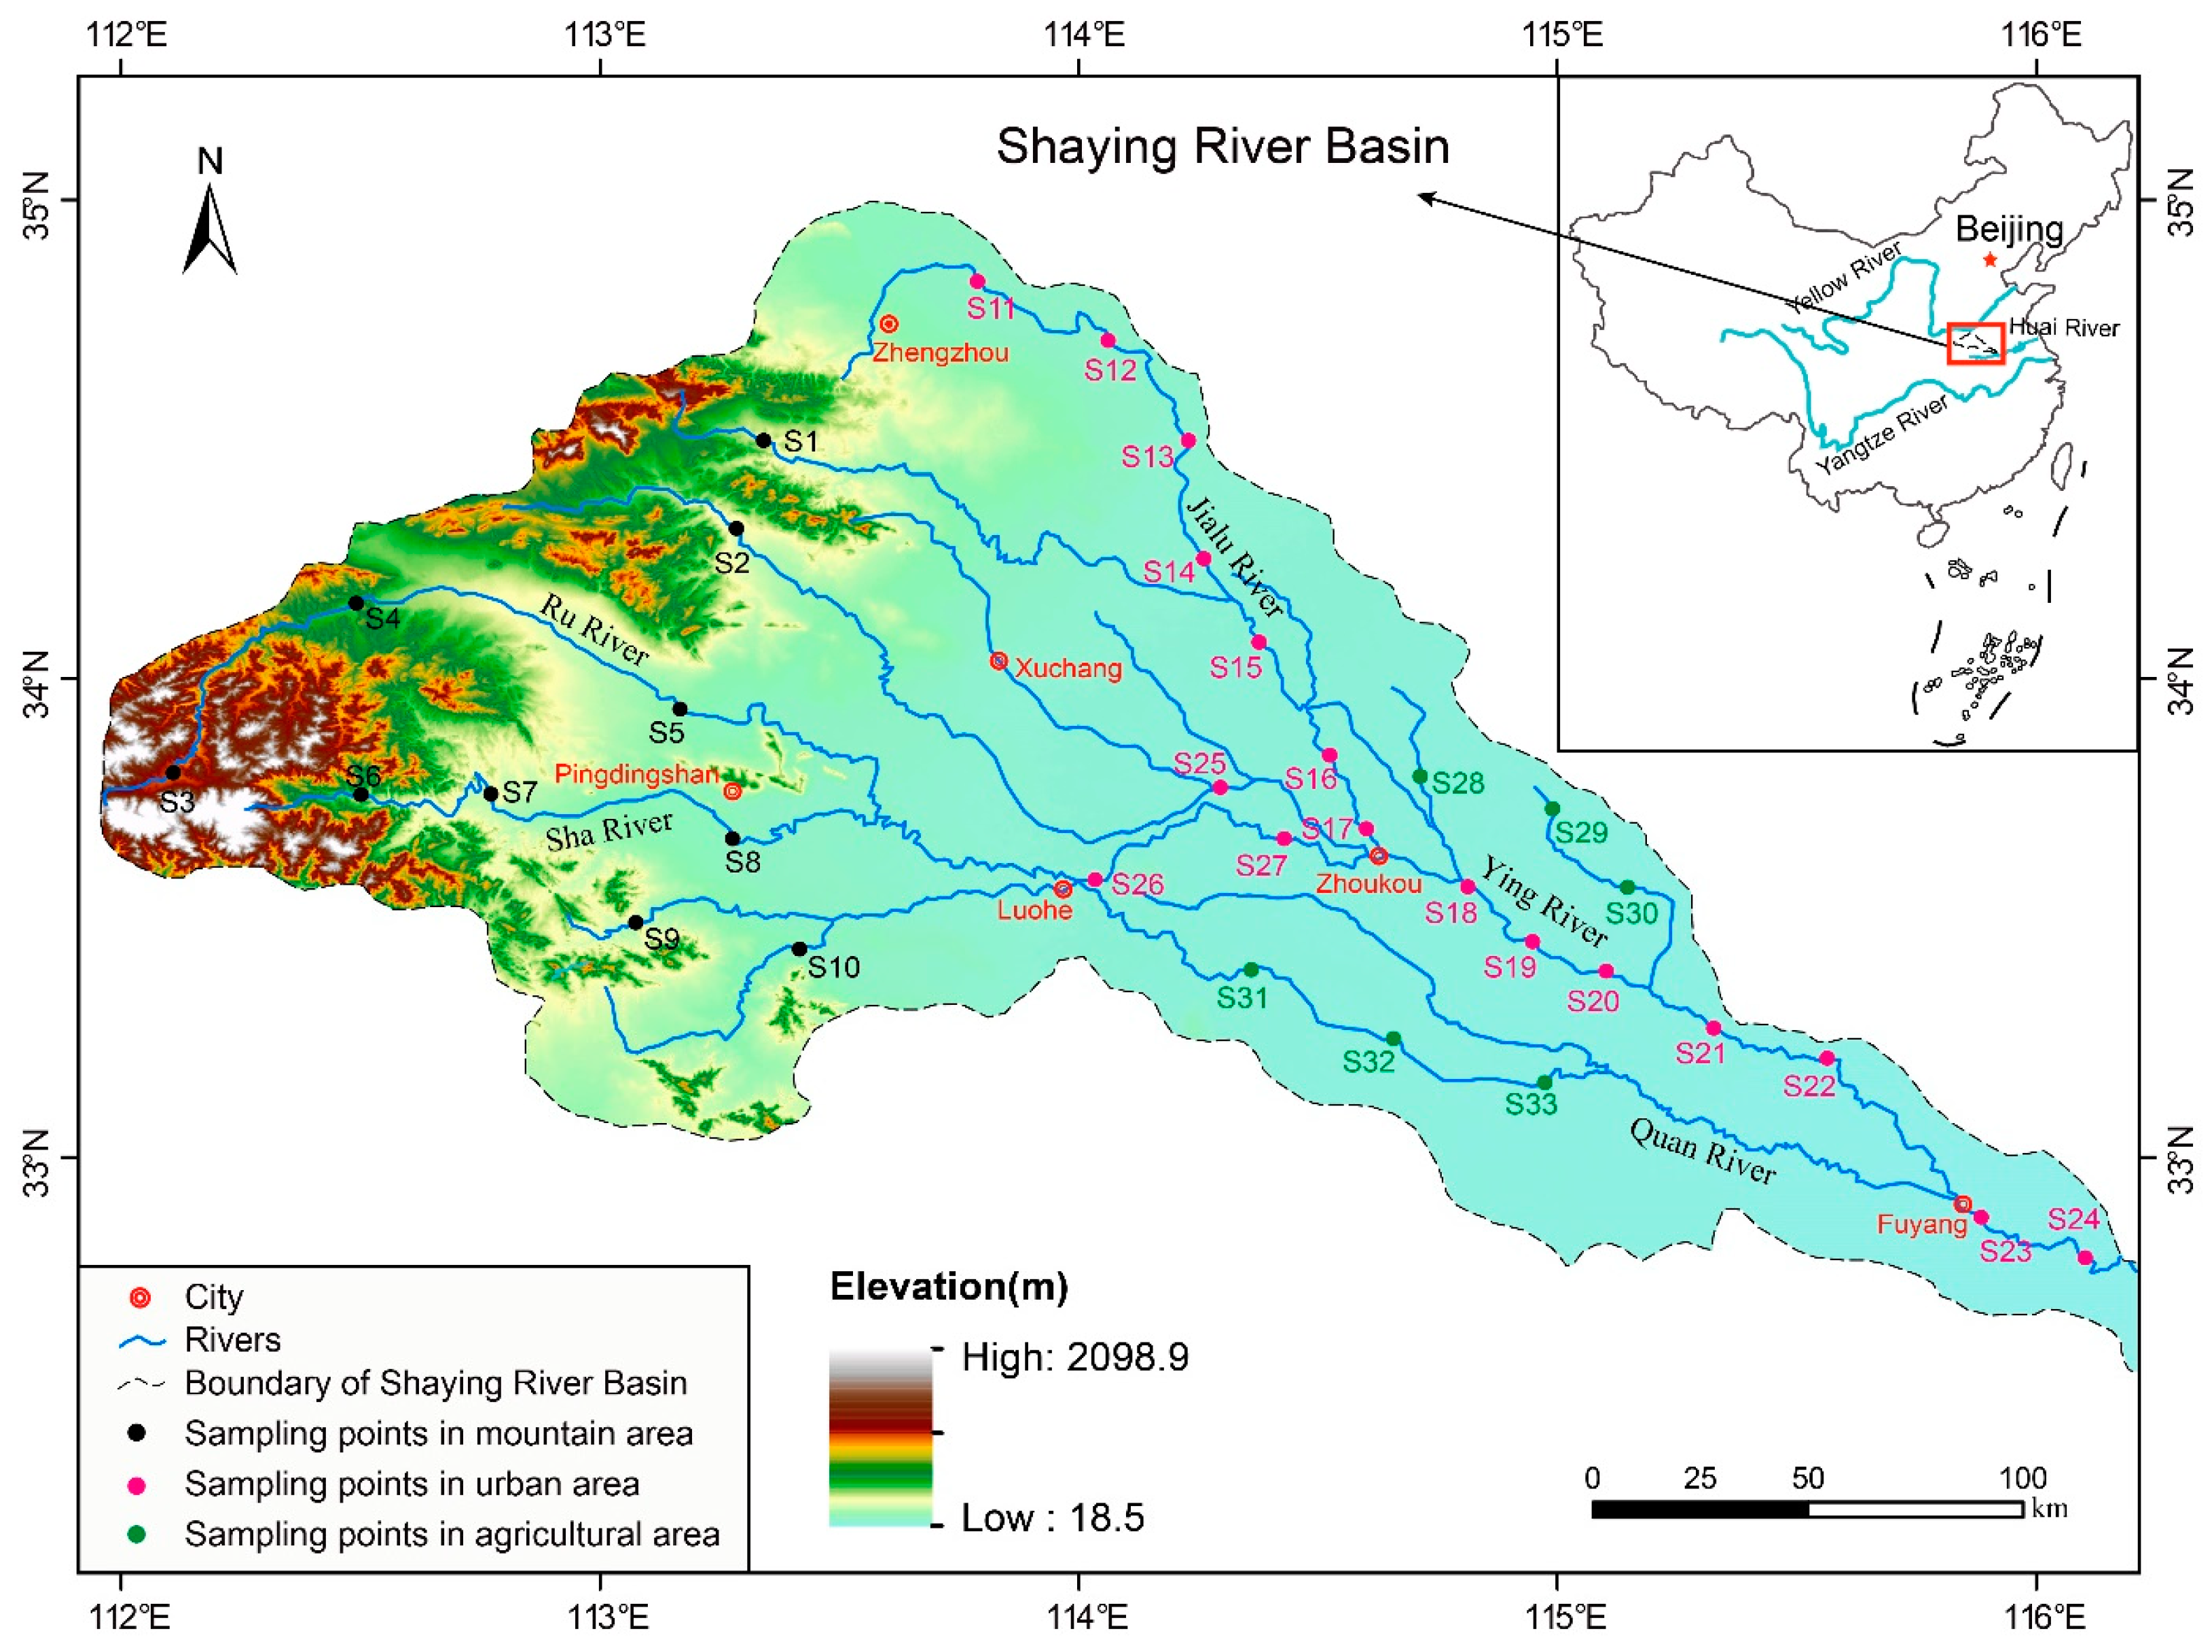
2.1. Study Area

The Shaying River (111°56′44″–116°31′07″ E, 32°29′24″–34°57′15″ N) originates from Song Mountain in Dengfeng City, Henan Province, and flows through more than 40 counties and cities in Henan and Anhui Provinces (Figure 1). It is the largest tributary of the upper reaches of the Huai River and is the most important source of water supply for grain irrigation in Henan Province [18]. The Shaying River originates in the hilly mountains and flows through the North China Plain in the middle and lower reaches [29]. The river basin is densely populated with towns and cities, with frequent human activities, and the ecological damage to the river is serious [20].

2.2. Sampling Point Setting

In late autumn (from 26 to 29 November 2019), thirty-three sampling points were set up in the Shaying River Basin by a stratified random sampling method based on altitude to collect water samples and sediments (Figure 1). The sampling point is located by the river with a wide water surface and no shoal, and it is as far as possible to avoid backwater and dead water. Based on the differences in land use types around the sampling sites, the Shaying River basin was divided into three areas: mountainous area, urban area, and agricultural area. The sampling points in the mountainous area are far away from the towns, and there are few human activities around. The agricultural area is mostly large-scale agricultural areas that have an obvious influence on agricultural activities.

2.3. Sample Collection, Water Physicochemical Parameters, and Heavy Metal Determination

Collection and preservation of water samples: Two 500 mL parallel water samples were collected at each sampling point, and 66 bottles were collected in total. The water samples were stored in a refrigerator at 4 °C and brought back to the laboratory, and the total nitrogen (TN), total phosphorus (TP), nitrate (NO3-N) and ammonia (NH3-N), orthophosphate (PO43−), chloridion (Cl), and total hardness (TH, CaCO3) were determined within 72 h.
Determination of nutrient salts, potassium permanganate index, orthophosphate, chloridion, and total hardness: Total phosphorus (TP) was determined using the continuous flow ammonium molybdate spectrophotometric method. The detection upper limit was 0.60 mg/L, and the detection lower limit was 0.01 mg/L [30]. Total nitrogen (TN) was measured using gas-phase molecular absorption spectrometry. The detection upper limit was 0.20 mg/L, and the detection lower limit was 0.05 mg/L [31]. Nitrate nitrogen (NO3-N) was determined using ultraviolet spectrophotometry. The detection upper limit was 4.00 mg/L, and the detection lower limit was 0.32 mg/L [32]. Ammonia nitrogen (NH3-N) was measured using the gas-phase molecular absorption spectrometry method. The detection upper limit was 0.08 mg/L and the detection lower limit was 0.02 mg/L [33]. The potassium permanganate index (CODMn) was measured using the acidic potassium permanganate method. The detection upper limit was 0.3 mg/L and the detection lower limit was 10 mg/L [34]. Orthophosphate (PO43−) was measured using the extraction–Phosphomolybdenum blue colorimetric method. The detection upper limit was 2.00 μg/mL and the detection lower limit was 0.20 μg/mL [35]. Chloridion (Cl) was determined using Moore’s method (silver nitrate titration method). The detection upper limit was 1000 mg/L and the detection lower limit was 5 mg/L [36]. Total hardness (TH) was determined using the ethylenediamine tetraacetic acid disodium (EDTA) titration method. The detection upper limit was 1000 mg/L and the detection lower limit was 1 mg/L [37].
Determination of water physicochemical parameters: The water temperature (WT), acidity (pH), dissolved oxygen (DO), total dissolved solids (TDS), and salinity (Sal) were determined at the sampling point using a portable multi-parameter water quality analyzer (YSI EXO2; Xylem Inc., Washington, DC, USA).
Collection and storage of bottom sediment: Surface sediment samples were collected from the river at the sampling site using a Peterson sampler, and the top surface sediment was taken with a wooden spoon, mixed well, packed into 50 mL round bottom centrifuge tubes, and stored at low temperature (4 °C in a portable refrigerator). The samples were returned to the laboratory and stored frozen at −20 °C. Some samples were air-dried indoors. Stones, shells, and plant fragments were taken out from the sediment, ground in an agate mortar, passed through a 65-mesh sieve, and then stored in sealed bags and put in a dryer.
Determination of heavy metals in sediments: Soil sediment samples (about 0.1 g) were digested in a MARS 6 microwave digestion unit (CEM) using H2O2 + HF + HNO3, cooled, filtered, and diluted to 50 mL with deionized water. The heavy metal content was determined using ICP-MS inductively coupled plasma–mass spectrometry. 1767-2004 multi-element standard solution was used. The limits of detection of the six heavy metals were as follows: Cr 0.10 mg·kg−1, As 0.1 mg·kg−1, Cd 0.01 mg·kg−1, Sb 0.05 mg·kg−1, Pb 0.02 mg·kg−1, and Hg 0.04 ng·g−1. The recoveries rate of all heavy metals in the reference sediments were controlled between 85% and 115%, and the relative standard deviations (RSD) of all replicate samples varied within ±5%.
Before conducting the analysis of heavy metal data, the box plot analysis was used to perform on the measured heavy metal data, and the values that exceed the upper and lower limits were eliminated.

2.4. Data Analysis

2.4.1. Water Quality Index Calculation

The water quality index (WQI) method is widely used for comprehensive water quality assessment, and its calculation method is as follows [38]:
W Q I = i = 1 n C i P i i = 1 n P i
Among them, n is the number of water quality indicators involved in the calculation, Ci and Pi are the normalized value and weight of variable i. Ci represents the standardized assignment value of the measured concentration of indicator i. The specific values are shown in Table 1. Ci is divided into 11 levels from 0 to 100 for assignment. Pi is the weight of indicator i. The Pi values of pH, DO, CODMn, NH3–N, and TP are 1, 4, 3, 3, and 1, respectively. According to the WQI value, water quality can be divided into the following five grades: excellent (WQI > 90), good (70 < WQI ≤ 90), moderate (50 < WQI ≤ 70), bad (25 < WQI ≤ 50), and very bad (0 ≤ WQI ≤ 25). The WQI value was calculated by five indicators, DO, CODMn, NH3–N, TP, and pH, and the values of each parameter are shown in Table 1.

2.4.2. Principal Component Analysis of Water Physicochemical Parameters

The principal component analysis method is based on retaining as much of the original information as possible, reducing the overlap of information between different indicators by linearly combining water quality variables, reducing the contribution of minor significant variables, simplifying the data structure, and objectively screening out a smaller number of independent composite factors [39]. Before the analysis, the KMO (Kaiser–Meyer–Olkin) test and Bartlett sphericity test were used to determine the applicability of the original variables for principal component analysis, and the following calculation programs were used in SPSS 25.0 software for statistical analysis [40] as follows:
(1) Create the original coordinate matrix. (2) Normalize the raw data. (3) Calculate the correlation coefficient matrix of the standardized data. (4) Select the Varimax method to rotate the standardized data. (5) Find the eigenroots and eigenvectors of the correlation coefficient matrix R, and determine the principal components. (6) Determine the number of principal components. (7) Determine the comprehensive evaluation function.

2.4.3. Calculation of Potential Ecological Risk Index

The potential ecological risk index method was proposed by the Swedish scientist Hakanson for evaluating the environmental sensitivity and the degree of soil heavy metal pollution. This method integrates the toxicity differences of heavy metal elements, regional background value differences, multi-element synergy, and environmental sensitivity to heavy metal pollution, eliminating the error caused by different regions and heterogeneous sources of pollution Therefore, it is widely used in the evaluation of sediment heavy metal pollution [41]. The following equation was used to calculate the potential ecological risk index of individual metals, E r i :
E r i = T r i × c c 0
In the above equation, c represents the actual measured heavy metal concentration, and c0 is the background value of heavy metals in soil (using the soil heavy metal content of Henan Province). E r i represents the environmental risk index of heavy metal i, and T r i represents the toxicity response coefficient of heavy metal i, which mainly reflects the toxicity level of heavy metals and the sensitivity of the environment to heavy metal pollution.
A potential ecological risk index (RI) based on heavy metal concentrations and toxicity is used to calculate the combined potential environmental risk of total hazardous heavy metals. The following equation is used to calculate the RI:
R I = E r i
The toxicity response factors for Cd, Pb, Cr, As, Sb, and Hg were 30, 15, 10, 20, 40, and 40, respectively.
In R v4.1.2 software, the “pheatmap” package is used to conduct correlation analysis on the potential ecological risk index (RI) of heavy metals and generate a clustering heatmap (Table 2).

2.5. Health Risk Assessment

Heavy metals in rivers and lakes can enter the human body through direct ingestion pathways (e.g., drinking water, inhalation) and indirect absorption pathways (e.g., dermal contact). Among these, accidental oral ingestion and dermal contact constitute the primary exposure routes through which sediment-bound heavy metals pose health risks to humans. At present, most studies on the health risk assessment of heavy metals use the exposure health risk assessment method proposed by the US Environmental Protection Agency [42]. However, ethnic differences in different regions make the exposure parameters used in the health risk assessment very different. However, if the original data from the United States are directly used for the health risk assessment of the Chinese population, the results obtained will be somewhat different from the actual health status of the residents of China [43]. In order to reduce the errors and uncertainties in the experimental study, this study used exposure parameters suitable for Chinese people based on the US health risk assessment index to obtain health risk assessment results more suitable for the Chinese population.

2.5.1. Chronic Daily Intake

Long-term daily intakes (CDI) can be appropriately assessed for risk groups using site-specific information. The formula for calculating the intake of heavy metals by metals in sediment through oral ingestion and dermal contact is as follows:
C D I i n g e s t = C S × I R S × E F × E D B W × A T × C F
C D I d e m a l = C S × S A × A F × A B S × E F × E D B W × A T × C F
Here, C D I d e m a l   and   C D I i n g e s t represent the chronic daily intake of heavy metals through oral ingestion and dermal contact from sediments, respectively, mg·kg−1; CS is the concentration of heavy metals in sediment, mg·kg−1; IRS is the sediment ingestion rate, mg·day−1; EF is exposure frequency, day·year−1; ED is exposure time, year; SA is the exposed accessible skin surface area, cm2; AF is the adhesion coefficient of sediment to skin, mg·cm−2; ABS is the skin absorption fraction, 0.01 for adults and 0.001 for children; IRS is the sediment uptake rate, mg·day−1; BW is body weight, kg; AT is the mean time for non-carcinogens, 365 ED; CF is the unit conversion factor, 10−6 mg·kg−1.

2.5.2. Hazard Index

The non-carcinogenic risk of individual heavy metals can be assessed using hazard entropy (HQ), which is calculated using the following equation:
H Q = C D I R f D
RfD is the reference value, mg·(kg·day)−1. The RfD values for As, Cd, Cr, Hg, Pb, and Sb are 3 × 10⁻³, 1 × 10⁻³, 3 × 10⁻³, 3.0 × 10⁻⁴, 1.4 × 10⁻³, and 4.0 × 10⁻³ mg·(kg·day)−1.
Assuming additive effects, the hazard index for the skin exposure pathway is calculated using the following equation:
H I = H Q
Non-carcinogenic risk exists for HI > 1 by the dermal contact route; small or negligible risk for HI ≤ 1.

2.5.3. Carcinogenic Risk Index (CRI)

In this study, As, Cd, and Cr were classified as Class I carcinogens, while Hg, Pb, and Sb were non-carcinogens according to the International Agency for Research on Cancer (IARC) classification of chemical substances as carcinogens. The formula of the cancer risk index is calculated as follows:
C R I = C D I i × S F i
The SF value indicates the probability of the cancer per unit exposure level, mg·(kg·day)−1. In this study, the SF values for As, Cd, and Cr were taken as 15.1, 6.1, and 41.0 mg·(kg·day)−1, respectively. If CRI < 10−6, it means no carcinogenic risk; 1 × 10⁻⁴ > CRI > 10−6 indicates carcinogenic risk but within an acceptable range; and CRI > 1 × 10⁻⁴ represents high risk of cancer in humans [12].

3. Results

3.1. Shaying River Evaluation of Water Pollution in Different Regional River Reaches

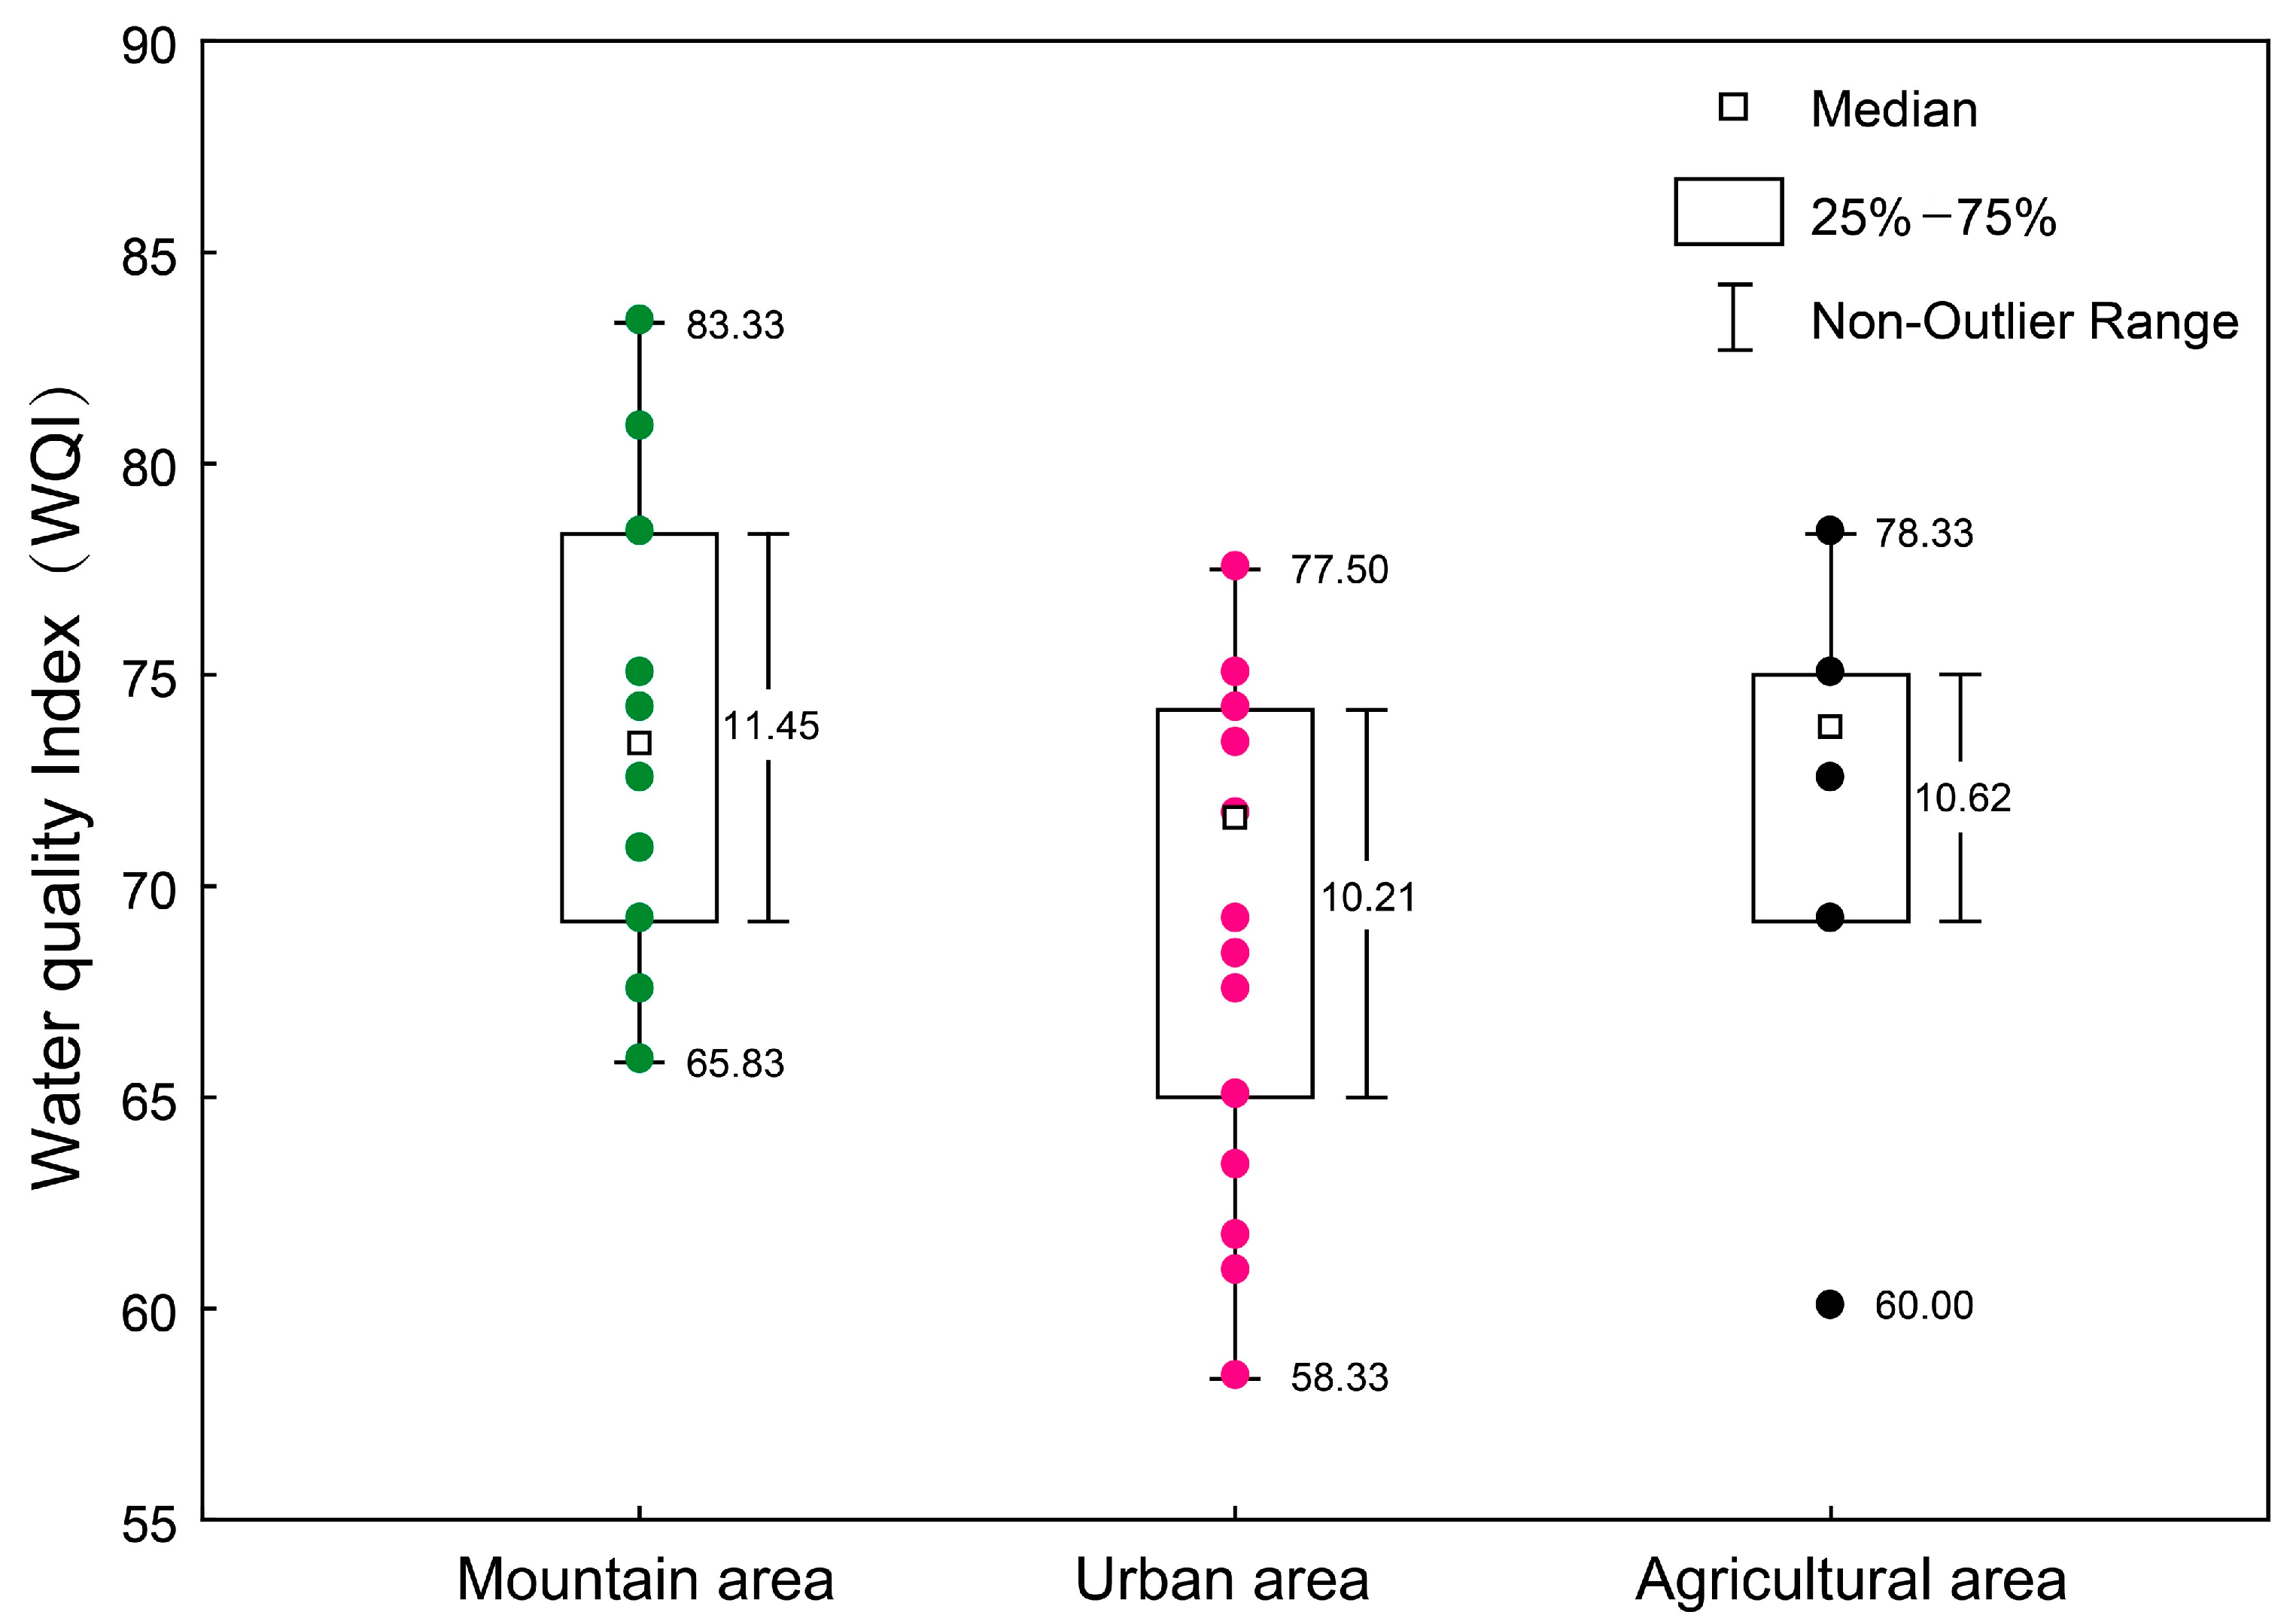
3.1.1. Evaluation Results of the Integrated Water Quality Index Method

Most of the sampling sites (20) in the Shaying River had moderate water quality assessment results, a few (13) had good water quality assessment results, and all sampling sites had no excellent, bad, or very bad water quality assessment results (Figure 2). Overall, the water body of Shaying River in the late autumn was polluted to a certain extent, but not seriously. There were significant differences in the water quality of the three regions of Shaying River (p < 0.05). The results show that the mountainous area of the river has the best condition (WQI = 73.75 ± 1.82), followed by the agricultural area (WQI = 71.67 ± 2.64). It is found that the urban area of the river is polluted to a certain extent (WQI = 69.51 ± 1.42).

3.1.2. Evaluation Results of the Shaying River Water Quality Comprehensive Evaluation Index Method

The specific observations of the thirteen indicators of NO3–N, TN, PO43−, TP, NH3–N, Cl, CODMn, pH, WT, TDS, DO, Sal, and total hardness (CaCO3) from 33 sampling sites in the Shaying River Basin in the late autumn were evaluated by principal component analysis. The statistical analysis yielded a KMO test result of 0.698, which was greater than 0.6; the Bartlett’s spherical test p-value was less than 0.001, indicating that the test values were significantly different and suitable for principal component analysis. After the statistical analysis of the data using SPSS 24.0 software, 13 principal components were obtained. In this study, according to the principle of extracting principal components with eigenvalues greater than 1.09, the first five principal components were extracted as a summary of information on the pollution status of water quality parameters in the Shaying River. The cumulative contribution of the first principal component, second principal component, third principal component, fourth principal component, and fifth principal component reached 86.997% (greater than 85%), which could explain most of the information contained in the original variables. In order to make the significance of each principal component clearer, the maximum variance method was used to perform factor rotation followed by principal component analysis, and the closer the absolute value of the rotated factor loadings of each indicator under each principal component was to 1, the greater the correlation between that factor and this principal component.
Table 3 shows the factor loadings of the first five principal components extracted after rotation, of which the first principal component carried the most information, accounting for 48.582%; thus, the water quality of the Shaying River was mainly controlled by the first principal component. The main factors associated with it are p(Cl), p(TDS), p(Sal), p(total hardness), p(TN), p(NO3–N), and p(CODMn), where the content of p(Cl), p(TDS), p(Sal), and p(total hardness) represent the concentration of soluble ions in the water body, and the level of p(TN) and p(NO3–N) reflects the eutrophication degree of the water body. The p(CODMn) content represents the degree of organic pollution in the water body. Thus, the first principal component reflects the soluble ion content in the water body and the influence of nutrient and organic pollution in the water body. The contribution of the second principal component was 12.300% and the factors associated with it were p(PO43−) and p(TP) with loadings of 0.889 and 0.866, respectively, reflecting phosphorus pollution of the water body. The factor with the highest loading in the third principal component was p(pH) and p(WT) with a loading of 0.840 and 0.762. Strongly correlated with the fourth principal component is p(NH3–N), with a loading of 0.929. The second and fourth principal components further reflect the nutrient pollution of the Shaying River water body based on the first principal component. The highest loading of the fifth principal component was 0.897, which belongs to the environmental factor dissolved oxygen (DO). The third and the fifth principal components reflect the physicochemical characteristics of the water bodies in the Shaying River.
The results of the principal component analysis in the late autumn showed that the scores of the four principal components for water bodies in different reaches of the Shaying River varied considerably. The overall scores indicated better water quality in the mountainous area than in urban and agricultural reaches (Figure 3A). The scores of the first principal component were generally higher at each sampling site in the agricultural area, while the scores of the second principal components were lower at each sampling site in the agricultural area except for S29 (Figure 3B), indicating that the water quality conditions in the agricultural area were mainly influenced by the first principal component factors (soluble salts, organic matter, and total nitrogen). The water quality in the urban area is influenced by the fourth principal component (ammonia nitrogen), which is much higher than at the other sampling sites. The scores of the first and second principal components and the overall scores were generally lower in the mountain area, except for S3, indicating that the pollution level of the water bodies in the mountain area was relatively low. Thirty-three sampling sites had different scores of the fifth principal component, but did not show any obvious pattern among the three regions, indicating that the water physicochemical factors (water temperature and pH) associated with the fifth principal component did not show obvious spatial heterogeneity.

3.2. Potential Ecological Risk Assessment of Heavy Metals in Shaying River Sediments and Health Risk Assessment

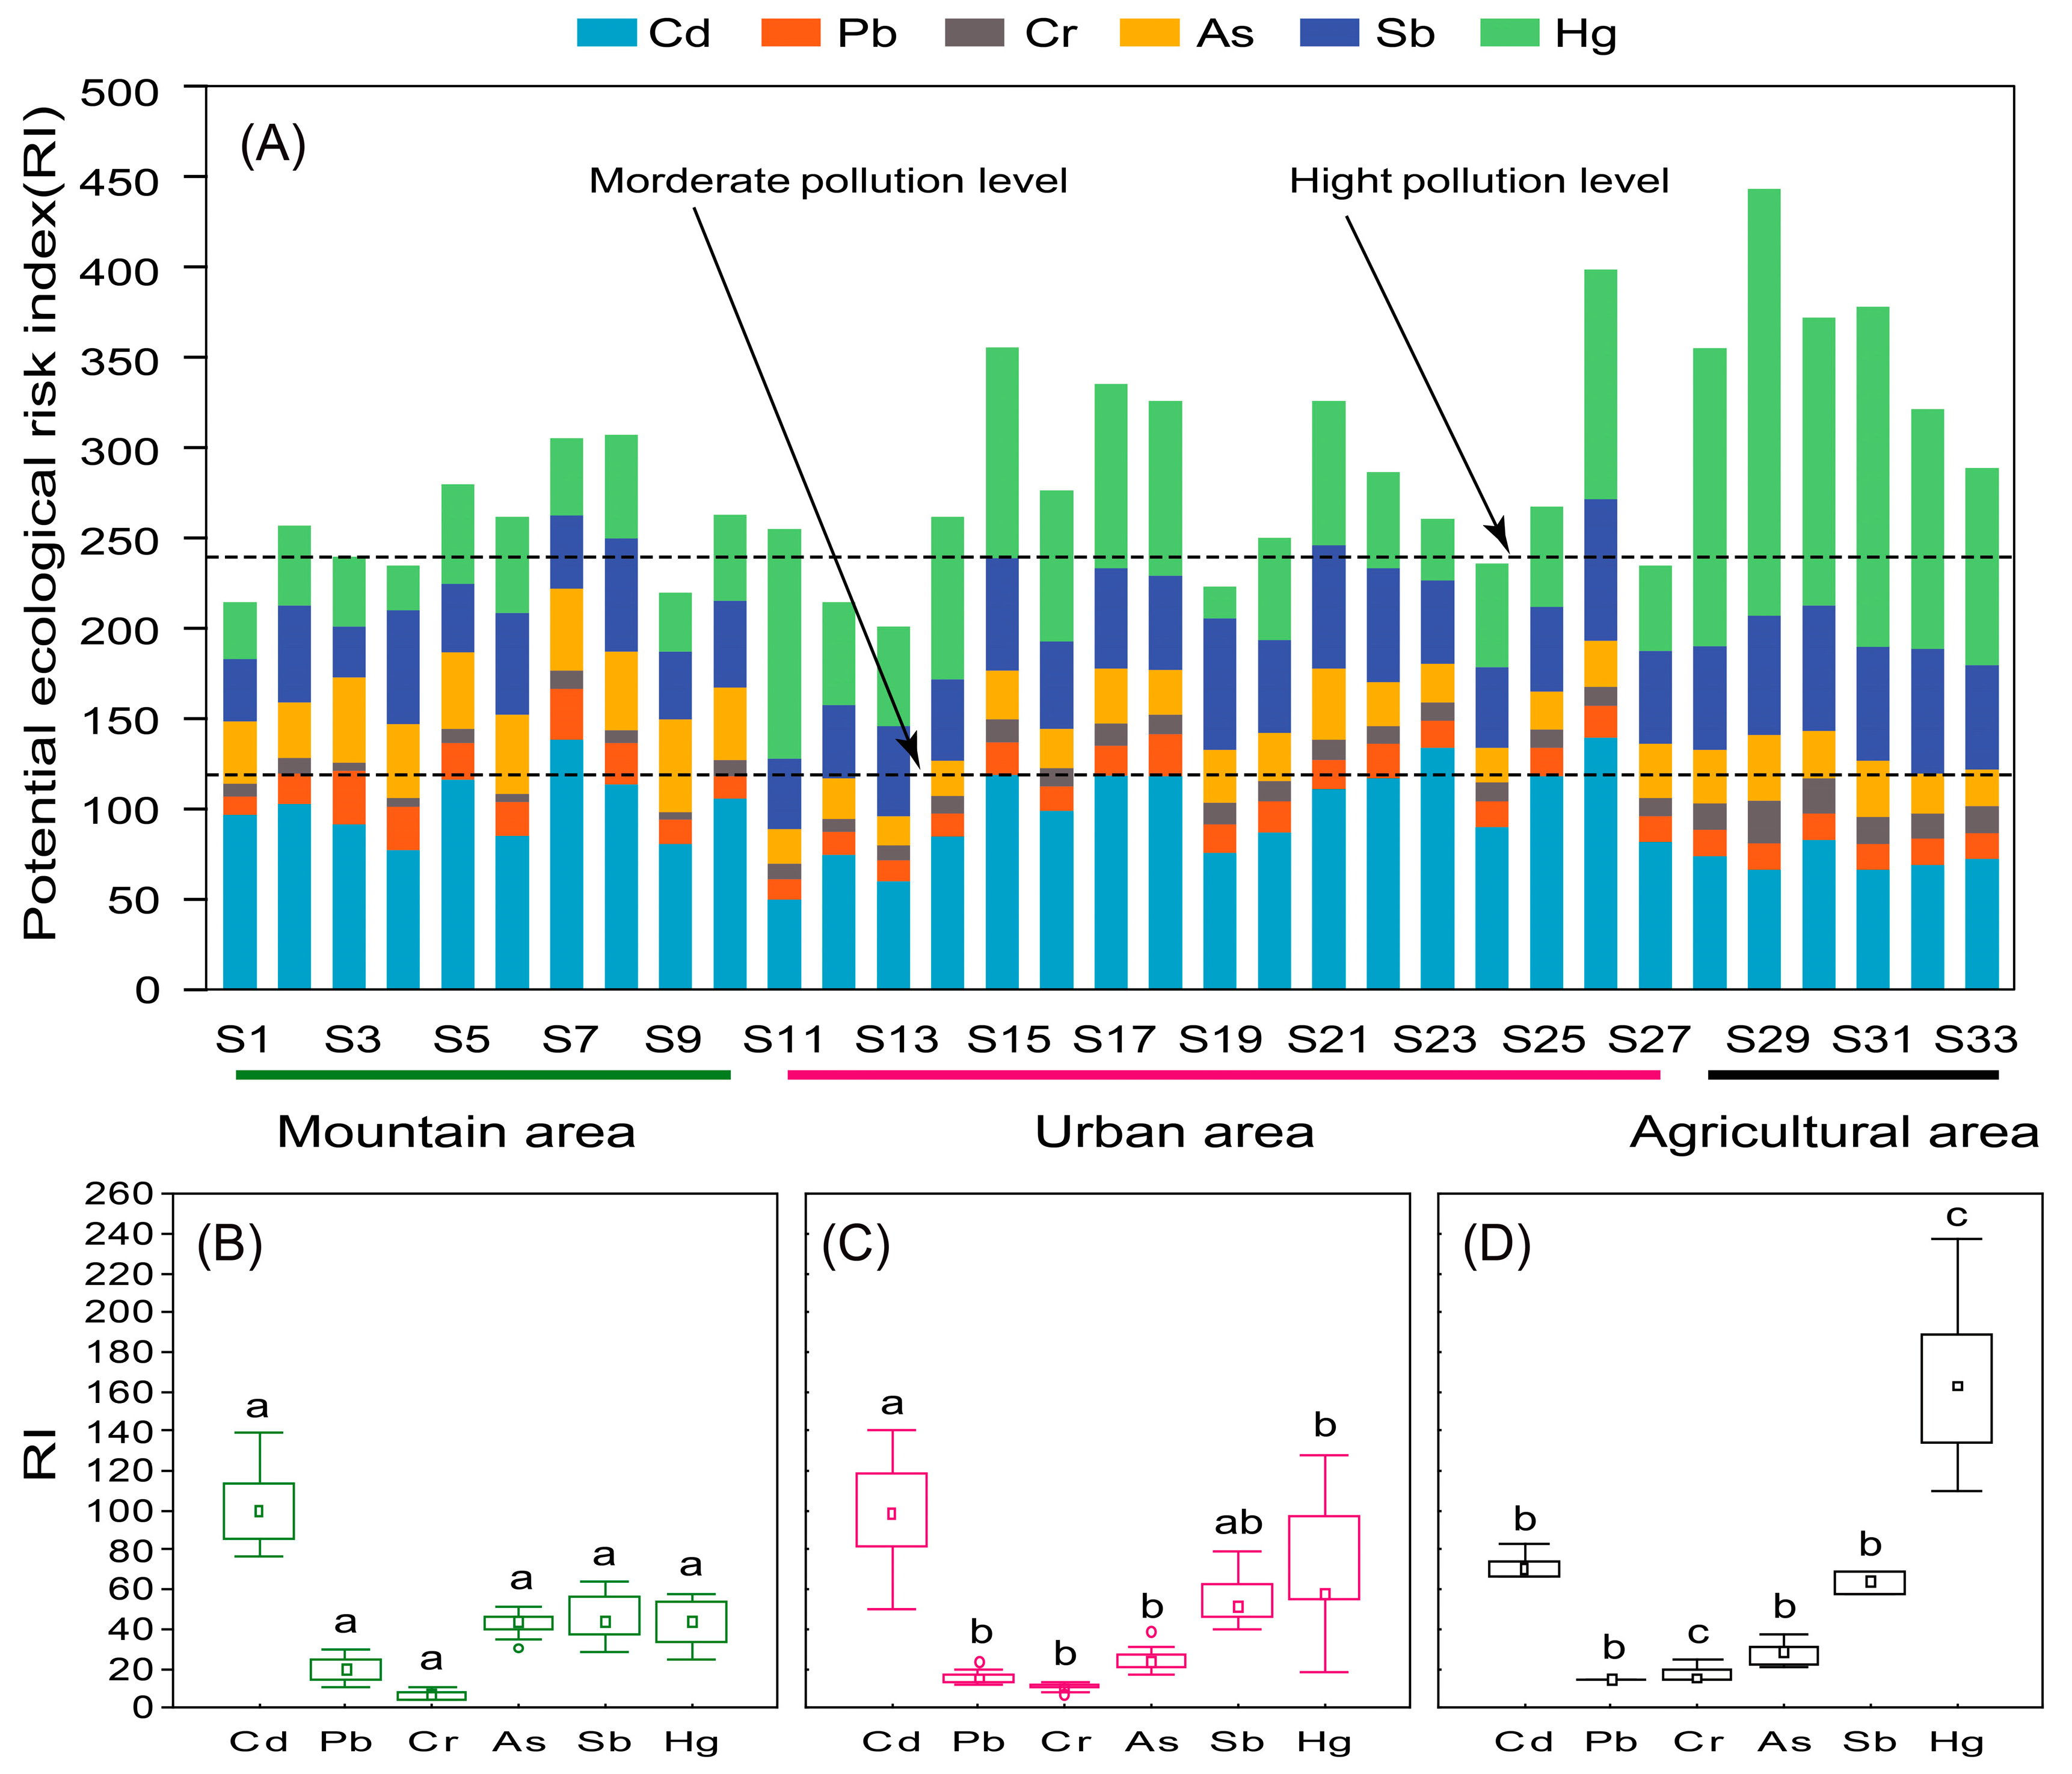
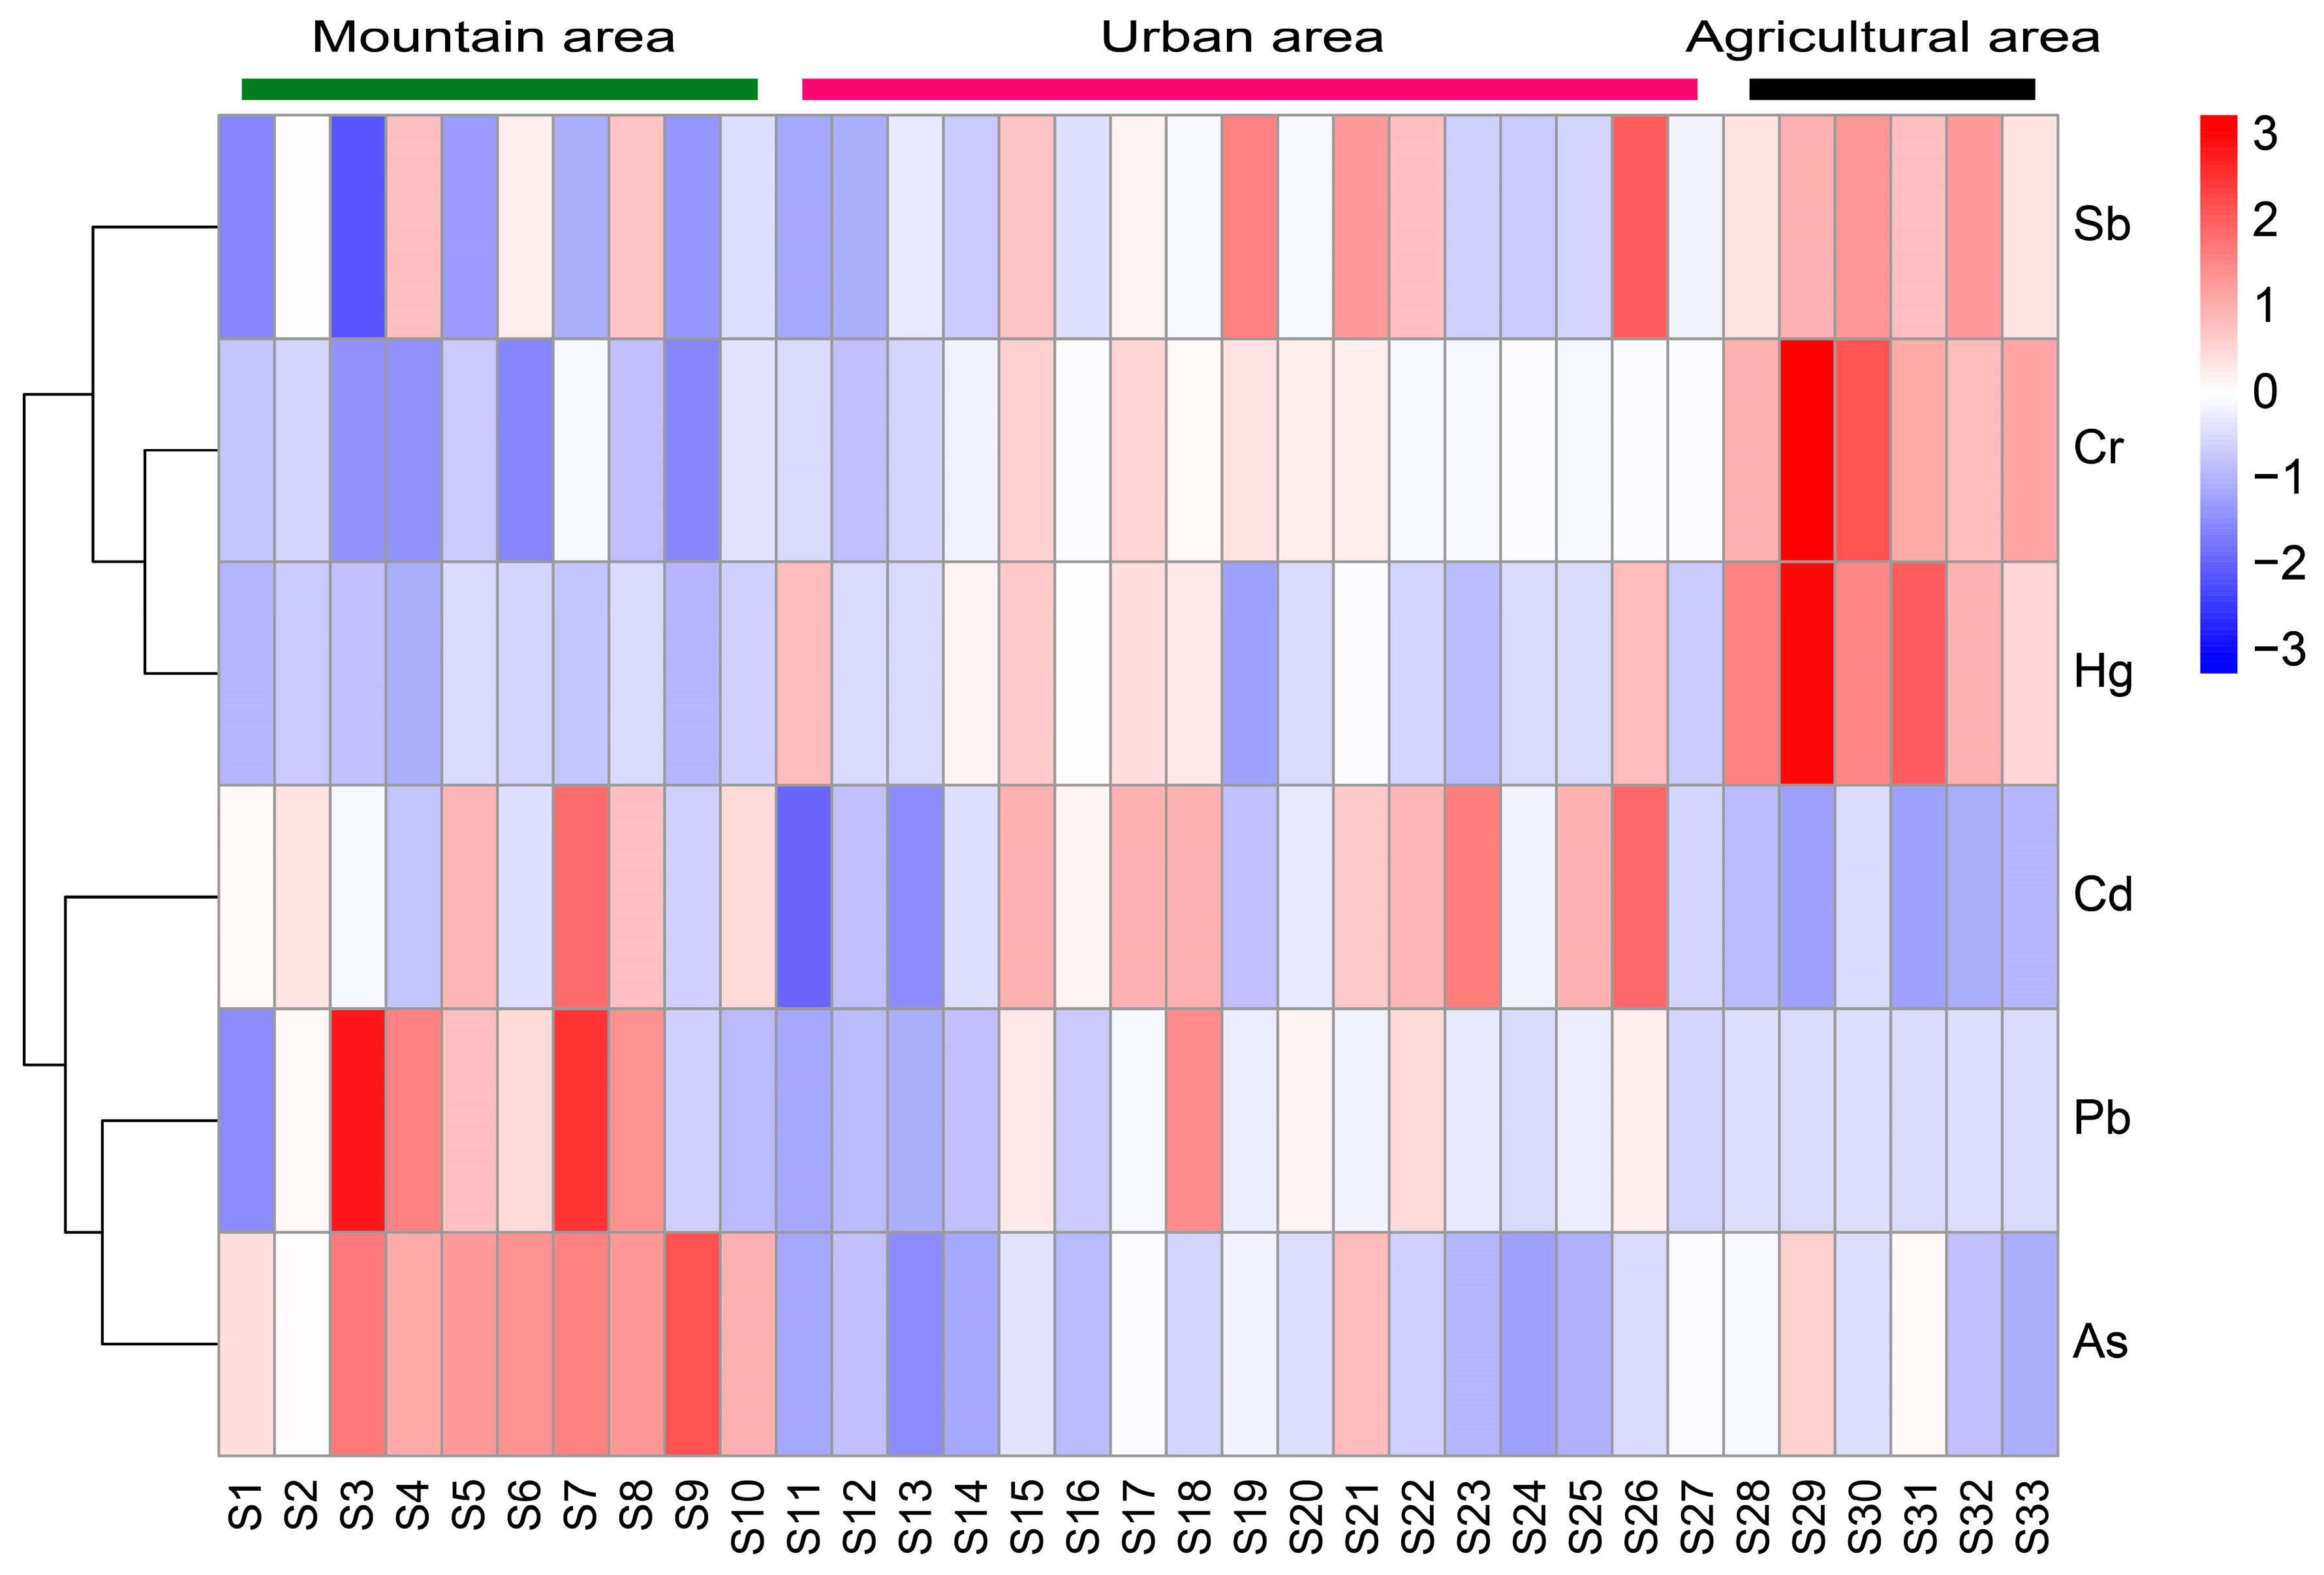
3.2.1. Potential Ecological Risk Assessment of Sediment Heavy Metals

The results of the evaluation in the late autumn showed that heavy metal pollution in the Shaying River was severe, reaching moderate levels at all sampling sites and severe levels at approximately half of the sites (Figure 4A). Overall, the level of heavy metal contamination was higher in the agricultural area (RI = 361.83) than in the urban (RI = 278.39) and mountainous areas (RI = 259.59). The potential risk assessment results for all six sampling sites in the agricultural area were more contaminated, with the highest level of heavy metal contamination (RI = 445.97) at sample site S29. Of the six heavy metals, the level of contamination reached a high potential ecological risk level for Cd ( E r i = 94.68) and Hg ( E r i = 81.67), and a medium potential ecological risk level for Sb ( E r i = 53.62). In addition, the heavy metals As ( E r i = 30.66), Pb ( E r i = 16.71), and Cr ( E r i = 10.52) showed lower potential ecological risk levels.
The degree of pollution of the same heavy metal in different regional river reaches differed significantly (Figure 4B–D). Cd was the most polluting heavy metal in the mountainous and urban areas, and Hg was the most polluting heavy metal in the agricultural areas. Cd was more polluting in the water bodies in all three areas, and the potential ecological risk was higher in the mountainous area than in the urban area, and in the urban area than in the agricultural area (101.08 > 98.96 > 71.88). The potential ecological risk of Hg was significantly higher in the agricultural area (166.28) than in the mountainous area (43.16) and the urban area (74.46). The potential ecological risk of As was significantly higher in the mountainous area (42.40) than in the other two areas (27.94 in the agricultural area and 24.72 in the urban area) (10.42), and urban areas were higher than mountainous areas (6.78).
Correlation clustering analysis was conducted on the potential ecological risk index of heavy metals. The results indicated that Sb, Cr, and Hg had strong correlations, and Cd, Pb, and As had strong correlations (Figure 5). The potential ecological risks of heavy metals Cd, Pb, and As were higher in the mountainous area (S1–S10). In the urban area, only Sb and Cd had certain potential ecological risks. In the agricultural area, the potential ecological risks of heavy metals Sb, Cr, and Hg were higher.

3.2.2. Sediment Health Risk Assessment for Heavy Metals

The results of the health risk assessment showed that the highest carcinogenic risk index (CRI) and hazard index (HI) were found in agricultural areas (Table 4). The carcinogenic risk index and hazard index in agricultural areas were significantly higher than those in urban areas and mountainous areas (p < 0.01). The evaluation also revealed that children had CRI values 8.4 times higher than adult males and 7.3 times higher than adult females (Table A1). The hazard index was higher for children than for adult females, and higher for adult females than for adult males. Overall, children had the highest health risks and were most at risk from heavy metals in the Shaying survey area.
Health risk assessments conducted in the Shaying River Basin identified agricultural areas as the most contaminated zones, with children exhibiting the highest carcinogenic risk (CRI = 5.93 × 10⁻³) and non-carcinogenic risk (HI = 7.22 × 10⁻³) among all populations (Table 4). Children’s CRI values exceeded adult males by 8.4-fold and adult females by 7.3-fold.
The results of the carcinogenic risk index assessment showed that Cr had the highest values (Table 5). This indicated that the carcinogenic risk of Cr was significantly higher than that of other heavy metals in the Shaying River Basin (p < 0.001). Non-carcinogenic risks followed identical demographic gradients (p < 0.01). The results of the hazard quotient assessment showed that Cr and Pb had higher values. This meant Cr and Pb were more harmful to human health in the Shaying River Basin. There were significant differences in the health risks of Cr and Pb among different populations (p < 0.05).
The CRI specific for Cr in children was 3.53 × 10⁻³, which was 35 times higher than the high–risk threshold (10−4) and significantly higher than that of other metals (p < 0.001). This result confirmed that children were facing severe health threats, and priority treatment should be implemented in agricultural river sections where chromium pollution sources are concentrated.

4. Discussion

4.1. Spatial Variation in Water Quality and Analysis of Influencing Factors

In the late autumn, this study found water quality in mountainous segments of the Shaying River was superior to agricultural reaches, while urban zones exhibited the poorest conditions (Figure 3B). These results demonstrate the influence of different human land use patterns and intensities on the overall water quality of the river [44]. The results of this study also revealed significant differences in the principal component scores of water bodies in the three regions (Figure 3A), indicating that different reaches of the Shaying River are affected by different sources of pollution, which is directly related to the differences in land use types in the three regions [45].
This study found that the water bodies in the agricultural reach of the Shaying River were mainly affected by soluble ions and organic matter pollution. It is speculated that the extensive use of chemical fertilizers and pesticides in agricultural practices, which were subsequently washed into the water bodies through surface runoff [1], leads to elevated levels of soluble ions. In addition, villages are located in the vicinity of each sampling site in the agricultural area, and the discharge of domestic sewage from villagers may also have a negative impact on the water quality of the river [46]. Furthermore, site S29 in the agricultural area exhibited a significantly higher second principal component score compared to other sites. This can be attributed to the presence of a nearby rabbit farm, where the discharge of nitrogen and phosphorus-rich excreta from rabbit farming has resulted in elevated nitrogen and phosphorus levels in the river [47,48]. The water quality of the river in the urban area is usually influenced by different types and intensities of human activities in the surrounding area [49]. These three sampling sites were close to towns (county towns), and the domestic sewage (containing a large amount of ammonia and nitrogen pollutants, such as human excreta) discharged by urban residents into the surrounding water bodies after treatment by sewage treatment plants has caused water pollution in the three sampling sites (S12, S13, and S14) in the urban area [50]. The sampling sites in the mountainous river area had lower scores in the first and second principal components, as well as in the composite score, compared to the urban and agricultural river areas. This indicates that the level of nutrient and organic matter pollution in the mountainous area was lower than in the urban and agricultural areas. The presence of higher vegetation cover in the mountainous area likely helped to prevent the transport of pollutants like nitrogen and phosphorus into the water bodies, resulting in better water quality [51].
The second principal component score of the S3 sampling site was significantly higher than the other sampling sites, indicating that the nutrient pollution of the water body is more serious at this site. A small reservoir about 100 m upstream of the S3 sampling site was found to be used for net-pen aquaculture, and organic debris and fish excreta from feeding bait entered the water column, causing a significant increase in nitrogen levels in the water column [52]. The results of this study are consistent with the results of Ma et al., who reported that the most serious ammonia nitrogen pollution was found in the Jalu River in the town area of the Shaying River [53]. The mean concentrations of NH3–N, TP, and CODMn met the criteria of Class II, Class III, and Class III for surface water quality, respectively, with medium pollution status [54]. The sampling sites with more serious water quality pollution were mainly located in the middle and upper reaches of the river, which is consistent with the findings of Xia et al. for the Shaying River [55]. The study also found that the water bodies of the Shaying River are affected by both point and surface sources of pollution, with point source discharges of pollutants from human activities being the main cause of water quality deterioration at some sampling sites [56]. Nutrient pollution in winter agricultural areas is mainly due to point source pollution, such as livestock farming effluent [57].

4.2. Sediment Heavy Metal Risk Assessment and Differences in Spatial Distribution

4.2.1. Evaluation of the Potential Ecological Risk of Sediment Heavy Metals

The results of the potential ecological risk assessment showed that Cd and Hg were the most polluted heavy metals in the sediments of Shaying River, while As, Pb, and Cr were less polluted, which was consistent with the report’s findings on heavy metal pollution in the sediments of Shaying River [20,29]. Cd has been shown to be reproductive toxic, and its intake might lead to hypertension, renal tubular dysfunction, osteoporosis, or neurological or brain damage [58,59]. It can also cause irreversible health damage such as hypertension, renal impairment, and cognitive impairment [60]. Therefore, the prevention and control of Cd and Hg in the Shaying River should be taken seriously. The potential ecological risk index results revealed variations in the potential ecological risk associated with the same heavy metal across the sediments in the three regions. The higher potential ecological risk of Hg in sediments from the agricultural area (Figure 4D) was attributed to the high toxicity of Hg and the utilization of Hg-containing sewage irrigation practices in that specific agricultural region [61]. This was related to the high emissions of Sb from the burning of coal during winter heating [62]. Under the influence of the northwest monsoon in winter, Sb from coal combustion emissions was transported to lower-lying downwind agricultural areas and deposited into rivers [63]. The high potential ecological risk of As in mountainous areas was consistent with the finding that As in the Shaying River was mainly derived from natural erosion and sporadic industrial pollution [28,64]. The potential ecological risk of Pb in mountainous river sediments was slightly higher than in agricultural and urban areas, which was directly related to the release of Pb from mining and smelting activities in mountainous areas [65]. In contrast to the high potential ecological risk of Pb contamination in the sediments of the Shaying River (Anhui reach) [66], the low level of Pb contamination in the sediments of the Shaying River (Henan reach) was related to the fact that the background value of Pb in Anhui Province was much higher than the background value in Henan Province [67]. The potential ecological risk of Cr in mountain river sediments was slightly higher than in urban and agricultural areas, mainly because mining activities in mountainous areas disrupted surface tectonics, making Cr more likely to have entered mountain rivers through mineral weathering or rainfall erosion [68,69,70]. In this study, the content and distribution of Cd and Hg were mainly influenced by anthropogenic factors, while the content and distribution of Sb and Cr were mainly influenced by natural factors. Current studies on heavy metal pollution sources in China have mostly focused on the influence of anthropogenic factors [71]. Although anthropogenic factors are the main cause of heavy metal pollution, the influence of natural factors (diagenesis and pedogenesis) on the distribution of heavy metal pollution cannot be ignored [72]. It has been shown that Cd, As, and Pb are significantly enriched in the Yunnan–Guizhou region of south-western China, with a very high ecological risk, which is closely related to the local basaltic geological type [73]. Under the same geological conditions, natural factors such as climate, vegetation, and topography can also influence rock weathering, which in turn has an impact on heavy metal content and distribution [74,75].

4.2.2. Health Risk Assessment for Heavy Metals in the Shaying River

The health risk assessment results indicated that the carcinogenic and non-carcinogenic risks of heavy metals in the Shaying River range from 10−3–10−1 and 10−3–100 (Table 4). It was found that less than 1 in 1000 people in the Shaying River basin were exposed to health hazards or faced the risk of death due to exposure to heavy metals in sediments, and that the health risk of heavy metals in sediments was within acceptable limits. However, heavy metal pollution is hidden, long–term, and irreversible [76]. And previous studies had shown a high incidence of cancer and high mortality in some villages in the Shaying River basin area (Sunying villages and Chenkou villages, among others) [77]. Therefore, we still need to pay attention to the heavy metal pollution of the Shaying River.
The research results in western Hunan, Poyang Lake, and southern India found that the heavy metals with the highest health risk were Cr and Pb [78,79,80], and the heavy metal with the highest carcinogenic risk was Cr. This indicated that Cr and Pb pollution was the prevalent type of heavy metal pollution and should be a priority in environmental management [81]. In the Shaying River Basin, children exhibited a chromium-specific carcinogenic risk of 3.53 × 10⁻³, surpassing the high-risk threshold (10−4) by 35-fold and exceeding values documented in comparative regions [61]. In this study, both carcinogenic and noncarcinogenic risks were found to be higher in children than in adults in the Shaying River Basin [61], which was related to the behavioral and physiological status of children, who were more likely to be exposed to heavy metals in sediments. In addition, the relative intake of heavy metals by children in the same environment is higher than that of adults, thus exposing children to greater health risks [11].

5. Conclusions

In late autumn, the water quality of Shaying River was evaluated as moderate. Urban reaches exhibited the most severe pollution, followed by agricultural areas, while mountainous segments maintained optimal conditions. The water quality of the Shaying River was mainly influenced by soluble ions, nutrient salts, and organic pollution. The heavy metal pollution of sediments in the Shaying River was relatively serious, with considerable variation in potential ecological risk among different river reaches, and the highest level of heavy metal contamination was observed in the agricultural area. The heavy metal health risk assessment found that the highest cancer risk was in the agricultural area of the Shaying River, with higher cancer risk in children than in adults.
In order to improve the water quality of Shaying River, sewage treatment should be strengthened, pollution sources along the river should be strictly investigated, and the supervision of industrial wastewater and agricultural wastewater discharge should be strengthened to ensure that the discharged sewage meets the national standards. At the same time, the discharge of domestic sewage is controlled, the sewage outlets are planned in a unified way, and the degree of water pollution at the outlet of sewage treatment plants is supervised regularly. In future research, a more systematic analysis of the water quality of rivers should be conducted from both temporal and spatial perspectives, with the aim of providing a more reliable basis for water resource management and water ecological protection of river ecosystems.

Author Contributions

Conceptualization, H.Q. and J.S.; methodology, H.Q.; software, L.G.; validation, X.W., H.L. and M.S.; formal analysis, M.S.; investigation, L.G., H.L. and J.L.; resources, H.Q.; data curation, W.J. and J.C.; writing—original draft preparation, X.W.; writing—review and editing, H.Q.; visualization, J.S.; supervision, Y.Y.; project administration, J.H.; funding acquisition, H.Q. and Y.Y. All authors have read and agreed to the published version of the manuscript.

Funding

This work was supported by the project of the National Natural Science Foundation of China (No. 31560133), the open fund project of the State Key Laboratory of Lake Science and Environment (2022SKL014), the open foundation of Hebei Key Laboratory of Wetland Ecology and Conservation (No. hklk202202), and the National Nature Science Foundation of China (No. 51979241).

Data Availability Statement

The original contributions presented in this study are included in the article. Further inquiries can be directed to the corresponding author.

Acknowledgments

We thank Shiliang Wang of Qufu Normal University for his guidance and assistance in this work. We are grateful to the anonymous reviewers for their valuable comments. We are grateful to the editors for their review and revision of the manuscript.

Conflicts of Interest

The authors declare no conflicts of interest.

Appendix A

Table A1. Health risk index of thirty—three sampling points in Shaying River.
Sample PointsAdult MaleAdult FemaleChildren
CRI
(×10−3)
HI
(×10−2)
CRI
(×10−3)
HI
(×10−2)
CRI
(×10−3)
HI
(×10−2)
S13.324.923.835.6727.7841.09
S23.676.304.227.2630.6352.65
S32.447.522.818.6720.3662.85
S42.366.482.717.4719.6954.17
S53.576.914.117.9629.8357.74
S62.215.602.556.4518.4646.80
S75.209.556.0011.0043.5079.79
S83.327.183.828.2727.7360.00
S92.294.942.645.6919.1141.27
S104.656.495.367.4838.8954.26
S113.595.134.145.9130.0042.88
S123.144.993.625.7526.2841.70
S133.455.003.975.7628.7941.79
S144.125.814.756.7034.4648.56
S155.497.886.339.0845.8765.87
S164.356.155.017.0836.3451.36
S175.397.586.228.7445.0763.35
S184.618.005.319.2238.5166.86
S195.087.195.858.2942.4360.09
S204.867.225.608.3240.5860.32
S214.977.345.728.4641.5161.37
S224.266.984.918.0535.5758.37
S234.286.364.947.3335.7953.12
S244.376.265.047.2136.5152.28
S254.326.424.977.4036.0753.66
S264.467.005.158.0737.3158.52
S274.446.455.117.4337.0753.89
S286.147.807.088.9951.3665.19
S299.9611.1311.4812.8383.2293.05
S308.079.499.3110.9467.4779.30
S316.318.077.289.3052.7767.46
S325.847.536.738.6748.7762.90
S336.267.827.229.0152.3565.32

References

  1. Jiang, J.Q.; Zhao, G.F.; Wang, D.W.; Liu, L.; Yan, X.; Song, H.R. Identifying trends and driving factors of spatio-temporal water quality variation in Guanting Reservoir Basin, North China. Environ. Dev. Sustain. 2022, 29, 88347–88358. [Google Scholar] [CrossRef] [PubMed]
  2. Kumar, A.; Kumar, P.; Raj, A.; Kisku, G.C. Assessment of influence of heavy metal, organochlorine pesticide, and bacterial presence on water quality of Gomti River, India. Environ. Dev. Sustain. 2022, 6, 1879–1901. [Google Scholar] [CrossRef]
  3. Lkr, A.; Singh, M.R.; Puro, N. Assessment of water quality status of Doyang River, Nagaland, India, using Water Quality Index. Appl. Water Sci. 2020, 10, 46. [Google Scholar] [CrossRef]
  4. Singh, R.; Majumder, C.B.; Vidyarthi, A.K. Assessing the impacts of industrial wastewater on the inland surface water quality: An application of analytic hierarchy process (AHP) model-based water quality index and GIS techniques. Phys. Chem. Earth 2023, 129, 103314. [Google Scholar] [CrossRef]
  5. Wang, X.N.; Li, J.; Chen, J.; Cui, L.; Li, W.W.; Gao, X.; Liu, Z.T. Water quality criteria of total ammonia nitrogen (TAN) and un-ionized ammonia (NH3–N) and their ecological risk in the Liao River, China. Chemosphere 2020, 243, 125328. [Google Scholar] [CrossRef] [PubMed]
  6. Liu, Y.; Li, L. Multiple evaluations of the spatial and temporal characteristics of surface water quality in the typical area of the Yangtze River Delta of China using the water quality index and multivariate statistical analysis: A case study in Shengzhou city. Int. J. Environ. Res. Public Health 2023, 20, 2883. [Google Scholar] [CrossRef]
  7. Wu, T.; Wang, S.R.; Su, B.L.; Wu, H.X.; Wang, G.Q. Understanding the water quality change of the Yilong Lake based on comprehensive assessment methods. Ecol. Indic. 2021, 126, 107714. [Google Scholar] [CrossRef]
  8. Naik, M.R.; Mahanty, B.; Sahoo, S.K.; Jha, V.N.; Sahoo, N.K. Assessment of groundwater geochemistry using multivariate water quality index and potential health risk in industrial belt of central Odisha, India. Environ. Pollut. 2022, 303, 119161. [Google Scholar] [CrossRef]
  9. Singh, G.; Chaudhary, S.; Giri, S.B.; Mishra, V.K. Assessment of geochemistry and irrigation suitability of the River Ganga, Varanasi, India: PCA reduction for water quality index and health risk evaluation. Environ. Sci. Pollut. Res. Int. 2025, 32, 4199–4218. [Google Scholar] [CrossRef]
  10. Wang, Z.; Luo, P.P.; Zha, X.B.; Xu, C.Y.; Kang, S.X.; Zhou, M.M.; Nover, D.; Wang, Y.H. Overview assessment of risk evaluation and treatment technologies for heavy metal pollution of water and soil. J. Clean. Prod. 2022, 379, 0959–6526. [Google Scholar] [CrossRef]
  11. Shi, W.C.; Li, T.; Feng, Y.; Su, H.; Yang, Q.L. Source apportionment and risk assessment for available occurrence forms of heavy metals in Dongdahe Wetland sediments, southwest of China. Sci. Total Environ. 2022, 815, 152837. [Google Scholar] [CrossRef] [PubMed]
  12. Mohsen, H.; Tooba, D.; Vali, A. Heavy metal pollution of road dust in a city and its highly polluted suburb; quantitative source apportionment and source-specific ecological and health risk assessment. Chemosphere 2021, 273, 129656. [Google Scholar]
  13. Wang, Z.; Lin, K.X.; Liu, X.S. Distribution and pollution risk assessment of heavy metals in the surface sediment of the intertidal zones of the Yellow River Estuary, China. Mar. Pollut. Bull. 2022, 174, 113286. [Google Scholar] [CrossRef]
  14. Dan, S.F.; Udoh, E.C.; Wang, Q.Q. Contamination and ecological risk assessment of heavy metals, and relationship with organic matter sources in surface sediments of the Cross River Estuary and nearshore areas. J. Hazard. Mater. 2022, 438, 129531. [Google Scholar] [CrossRef] [PubMed]
  15. Lian, G.Q.; Lee, X.Q. Concentrations, distribution, and pollution assessment of metals in river sediments in China. Int. J. Env. Res. Public Health 2021, 18, 6908. [Google Scholar] [CrossRef]
  16. Hu, Y. Study on automatic monitoring system of sediment environmental pollution for ecological environment protection. Chin. Energy Environ. Prot. 2023, 45, 67–72+79. [Google Scholar]
  17. Proshad, R.; Kormoker, T.; Islam, S. Distribution, source identification, ecological and health risks of heavy metals in surface sediments of the Rupsa River, Bangladesh. Toxin Rev. 2021, 40, 77–101. [Google Scholar] [CrossRef]
  18. Cheng, Y.; Ma, J.X.; Zuo, Q.T. Level measurement and driving factors analysis of water resources intensive utilization in Shaying River Basin. Water Res. Plan. Des. 2024, 12, 164–170. [Google Scholar]
  19. Yu, T.Z.; Liu, Y.T.; Cao, D.; Fang, L.J.; Wang, Y.C.; Ma, G.B.; Cao, Z.H. Study on pollution control factors and their influencing laws on heavy metal migration in the Shaying River Basin. Environ. Eng. 2023, 41, 30–36+52. [Google Scholar]
  20. Du, S.L. The Research on Screening of Priority Pollutants in the Water Environment and Potential Ecological Risk Assessment in Shaying River Basin. Master’s Thesis, Guilin University of Technology, Guilin, China, 2020. [Google Scholar]
  21. Ma, W.; Fan, K.M.; Wang, P. Pollution characteristics and ecological risk assessment of heavy metals in the sediments of Shaying River controlled by sluice station. J. Anhui Agric. Sci. 2020, 48, 77–79+83. [Google Scholar]
  22. Wang, W.L.; Du, W.; Han, Y.J.; Cao, B.S.; Li, W.J.; Tong, Y.; Dai, S.Y.; Liu, B. Ammonia emission characteristics and construction of an emission reduction system for livestock and poultry farming in China. J. Agro-Environ. Sci. 2021, 40, 2305–2316. [Google Scholar]
  23. Sahoo, M.M.; Swain, J.B. Investigation and comparative analysis of ecological risk for heavy metals in sediment and surface water in east coast estuaries of India. Mar. Pollut. Bull. 2023, 190, 114894. [Google Scholar] [CrossRef] [PubMed]
  24. Li, B.L.; Yang, L.H.; Song, X.F.; Qin, M.Z. The influence of soil physics and chemical properties on groundwater nitrogen pollution in the riparian zone of Shaying River. Chin. Environ. Sci. 2024, 44, 3955–3965. [Google Scholar]
  25. Zhang, H.J.; Zhang, W.L. Remediation status of polluted river sediments in Guizhou Province and research on the in-situ remediation of sediments. Chin. Res. Comp. Util. 2025, 43, 183–186. [Google Scholar]
  26. Zhou, K.S. Assessing heavy metal pollution in surface sediments of China’s Shaying River. Pol. J. Environ. Stud. 2019, 28, 4495–4502. [Google Scholar] [CrossRef]
  27. Chu, Y.J.; He, B.N.; He, J.T.; Zou, H.; Sun, J.C.; Wen, D.G. Revealing the drivers and genesis of NO3-N pollution classification in shallow groundwater of the Shaying River Basin by explainable machine learning and pathway analysis method. Sci. Total Environ. 2024, 918, 170742. [Google Scholar] [CrossRef]
  28. Hao, M.H.; Zuo, Q.T.; Li, J.L.; Shi, S.J.; Li, B.; Zhao, X.N. A comprehensive exploration on distribution, risk assessment, and source quantification of heavy metals in the multi-media environment from Shaying River Basin, China. Ecotoxicol. Environ. Saf. 2022, 231, 113190. [Google Scholar] [CrossRef] [PubMed]
  29. Ying, Y.M.; Shang, M.; Wang, X.; Cui, X.R.; Huang, R.J.; Song, Z.X.; Han, Y.J. Soil heavy metals assessment of the Zhoukou riparian zone base of Shaying river basin, China: Spatial distribution, source analysis and ecological risk. Environ. Geochem. Health 2025, 47, 77. [Google Scholar] [CrossRef]
  30. GB 11893-89; Water Quality-Determination of Total Phosphorus—Ammonium Molybdate Spectrophotometric Method. Ministry of Ecology and Environment of People’s Republic of China: Beijing, China, 1990.
  31. HJ 199-2023; Water Quality—Determination of Total Nitrogen—Gas-Phase Molecular Absorption Spectrometry. Ministry of Ecology and Environment of People’s Republic of China: Beijing, China, 2024.
  32. HJ/T 346-2007; Water Quality—Determination of Nitrate-Nitrogen—Ultraviolet Spectrophotometry. Ministry of Ecology and Environment of People’s Republic of China: Beijing, China, 2007.
  33. HJ 195-2023; Water Quality—Determination of Ammonia Nitrogen—Gas-Phase Molecular Absorption Spectrometry. Ministry of Ecology and Environment of People’s Republic of China: Beijing, China, 2024.
  34. GB 11892-89; Water Quality—Determination of Permanganate Index. Ministry of Ecology and Environment of People’s Republic of China: Beijing, China, 1989.
  35. GB/T 9727-2007; Chemical Reagent—General Method for the Determination of Phosphate. General Administration of Quality Supervision, Inspection and Quarantine of the People’s Republic of China: Beijing, China, 2008.
  36. GB/T 15453-2018; Determination of Chloride in Water for Industrial Circulating Cooling System and Boiler. State Administration of Market Supervision: Beijing, China, 2019.
  37. GB 8538-2016; Methods for Examination of Drinking Natural Mineral Water. National Health and Family Planning Commission of PRC: Beijing, China, 2017.
  38. Wang, S.; Liu, X.F.; Hou, Q.; Zhao, Z.J. Analysis of Water Environmental Quality Characteristics in Leshan in 2023. Environ. Monit. 2025; in press. [Google Scholar]
  39. Koukoulakis, P.H.; Kanatas, P.; Kyritsis, S.S.; Ntzala, G.; Kalavrouziotis, I.K. The Impact of the Elemental Interactions on Soil Fertility and Toxicity in the Presence of Wastewater and Biosolids: A Quantitative Evaluation. Water 2023, 15, 3743. [Google Scholar] [CrossRef]
  40. Arumugam, T.; Kinattinkara, S.; Kannithottathil, S.; Velusamy, S.; Krishna, M.; Shanmugamoorthy, M.; Sivakumar, V.; Boobalakrishnan, K.V. Comparative assessment of groundwater quality indices of Kannur District, Kerala, India using multivariate statistical approaches and GIS. Environ. Monit. Assess. 2022, 195, 29. [Google Scholar] [CrossRef]
  41. Wu, M.; Liu, S.L.; Yuan, Y.Y.; Zhao, J.Y.; Liu, Y.; Liu, S.Y.; Liu, Y.L. Optimization of potential ecological risk index method for soil heavy metals—A case study of Chengkou County, Chongqing City. Chin. J. Soil Sci. 2023, 54, 473–480. [Google Scholar]
  42. USEPA. Supplemental Guidance for Developing Soil Screening Levels for Superfund Sites; U.S. Environmental Protection Agency: Washington, DC, USA, 2002.
  43. Ministry of Health of the People’s Republic of China. China Health Statistics Yearbook; Peking Union Medical College Press: Beijing, China, 2007; pp. 207–208.
  44. Tong, X.X.; Tang, H.; Gan, R.; Li, Z.T.; He, X.L.; Gu, S.Q. Characteristics and causes of changing groundwater quality in the boundary line of the middle and lower Yellow River (right bank). Water 2022, 14, 1846. [Google Scholar] [CrossRef]
  45. Gani, M.A.; Sajib, A.M.; Siddik, M.A.; Moniruzzaman, M. Assessing the impact of land use and land cover on river water quality using water quality index and remote sensing techniques. Environ. Monit. Assess. 2023, 195, 449. [Google Scholar] [CrossRef]
  46. Matta, G.; Kumar, A.; Nayak, A.; Kumar, P. Appraisal of spatial–temporal variation and pollution source estimation of Ganga River system through pollution indices and environmetrics in Upper Ganga basin. Appl. Water Sci. 2022, 12, 33. [Google Scholar] [CrossRef]
  47. Wang, R.J.; Wang, Q.B.; Dong, L.S.; Zhang, J.F. Cleaner agricultural production in drinking-water source areas for the control of non-point source pollution in China. J. Environ. Manag. 2021, 285, 112096. [Google Scholar] [CrossRef]
  48. Andrade, A.F.O.; Lima, C.; Bacha, L.; Oliveira, M.A.P.; Leomil, L.; Rezende, C.E.; Wasserman, J.C.F.A.; Costa, P.M.S.; Costa, R.; Siegle, E.; et al. Large polluted river plumes threats sustainable mariculture in the Baia da Ilha Grande. Reg. Stud. Mar. Sci. 2025, 83, 104049. [Google Scholar] [CrossRef]
  49. Zhang, W.P.; Gao, D.D.; Wang, C.; Shi, H.L.; Tian, X.G.; Ren, X.N.; Liu, S.Y.; Guo, M.K.; He, P. Quantitative tracking of seasonal river pollution sources and integration of sustainable development goals in hilly regions. Sustainability 2024, 16, 9235. [Google Scholar] [CrossRef]
  50. Nishat, M.H.; Khan, M.H.R.B.; Ahmed, T.; Hossain, S.N.; Ahsan, A.; Sergany, M.M.E.; Shafiquzzaman, M.; Imteaz, M.A.; Alresheedi, M.T. Comparative analysis of machine learning models for predicting water quality index in Dhaka’s rivers of Bangladesh. Environ. Sci. Eur. 2025, 37, 31. [Google Scholar] [CrossRef]
  51. Xu, G.C.; Li, P.; Lu, K.X.; Zhan, T.T.; Zhang, J.X.; Ren, Z.P.; Wang, X.K.; Yu, K.X.; Shi, P.; Cheng, Y.T. Seasonal changes in water quality and its main influencing factors in the Dan River basin. Catena 2019, 173, 131–140. [Google Scholar] [CrossRef]
  52. Xu, H.X.; Gao, Q.; Yuan, B. Analysis and identification of pollution sources of comprehensive river water quality: Evidence from two river basins in China. Ecol. Indic. 2022, 135, 108561. [Google Scholar] [CrossRef]
  53. Ma, P.; Liu, S.X.; Yu, Q.B.; Li, X.Y.; Han, X.Q. Sources and transformations of anthropogenic nitrogen in the highly disturbed Huai River Basin, Eastern China. Environ. Sci. Pollut. Res. 2019, 26, 11153–11169. [Google Scholar] [CrossRef] [PubMed]
  54. Tang, Y.M. Research on Regional Water Environment Evaluation and Sustainable Development—A Case Study of Lhasa River basin and Huairou District. Master’s Thesis, Beijing University of Chemical Technology, Beijing, China, 2024. [Google Scholar]
  55. Yang, Q.; Zhang, Y.Y. Non-point source pollution simulation of ammonia nitrogen and spatial-temporal characteristics analysis in Shaying River catchment (Henan section). Res. Environ. Sci. 2021, 34, 319–327. [Google Scholar]
  56. Huang, J.C.; Zhang, Y.J.; Bing, H.J.; Peng, J.; Dong, F.F.; Gao, J.F.; Arhonditsis, G.B. Characterizing the river water quality in China: Recent progress and on-going challenges. Water Res. 2021, 201, 117309. [Google Scholar] [CrossRef] [PubMed]
  57. Savic, R.; Stajic, M.; Blagojevic, B.; Bezdan, A.; Vranesevic, M.; Jokanovic, V.N.; Baumgertel, A.; Kovacic, M.B.; Horvatinec, J.; Ondrasek, G. Nitrogen and phosphorus concentrations and their ratios as indicators of water quality and eutrophication of the hydro-system Danube-Tisza-Danube. Agriculture 2022, 12, 935. [Google Scholar] [CrossRef]
  58. Shukla, G.S.; Singhal, R.L. The present status of biological effects of toxic metals in the environment: Lead, cadmium, and manganese. Can. J. Physiol. Pharm. 1984, 62, 1015–1031. [Google Scholar] [CrossRef]
  59. Genchi, G.; Sinicropi, M.S.; Lauria, G.; Carocci, A.; Catalano, A. The effects of cadmium toxicity. Int. J. Environ. Res. Public Health 2020, 17, 3782. [Google Scholar] [CrossRef]
  60. Nabi, M.; Tabassum, N. Role of Environmental Toxicants on Neurodegenerative Disorders. Front. Toxicol. 2022, 4, 837579. [Google Scholar] [CrossRef]
  61. Hu, B.F.; Shao, S.; Ni, H.; Fu, Z.Y.; Hu, L.S.; Zhou, Y.; Min, X.X.; She, S.F.; Chen, S.C.; Huang, M.X.; et al. Current status, spatial features, health risks, and potential driving factors of soil heavy metal pollution in China at province level. Environ. Pollut. 2020, 266, 114961. [Google Scholar] [CrossRef]
  62. Zheng, P.; Cui, X.L.; Li, H.X.; Che, X.K.; Shi, X.Y.; Wang, L.; Zheng, Q. Research progress and development trend of antimony contaminated soil remediation technology. Chin. J. Rare Met. 2024, 48, 411–426. [Google Scholar]
  63. Zhang, Y.X.; Li, T.S.; Guo, Z.H.; Xie, H.M.; Hu, Z.H.; Ran, H.Z.; Li, C.Z.; Jiang, Z.C. Spatial heterogeneity and source apportionment of soil metal(loid)s in an abandoned lead/zinc smelter. J. Environ. Sci. 2023, 127, 519–529. [Google Scholar] [CrossRef]
  64. Yang, Y.; Jin, Q.; Fang, J.M.; Liu, F.Q.; Li, A.M.; Tandon, P.J.; Shan, A.D. Spatial distribution, ecological risk assessment, and potential sources of heavy metal(loid)s in surface sediments from the Huai River within the Bengbu section, China. Environ. Sci. Pollut. Res. 2017, 24, 11360–11370. [Google Scholar] [CrossRef] [PubMed]
  65. Tian, K.; Wu, Q.; Liu, P.; Hu, W.; Huang, B.; Shi, B.; Zhou, Y.; Kwon, B.O.; Choi, K.; Ryu, J.S.; et al. Ecological risk assessment of heavy metals in sediments and water from the coastal areas of the Bohai Sea and the Yellow Sea. Environ. Int. 2020, 136, 105512. [Google Scholar] [CrossRef] [PubMed]
  66. Wang, J.; Liu, G.J.; Liu, H.Q.; Lam, P.K.S. Multivariate statistical evaluation of dissolved trace elements and a water quality assessment in the middle reaches of Huaihe River, Anhui, China. Sci. Total Environ. 2017, 583, 421–431. [Google Scholar] [CrossRef]
  67. Ding, T.T.; Li, Q.; Du, S.L.; Liu, Y.F.; Zhang, Y.H.; Zhang, J.; Wang, Y.Z.; He, L.S. Pollution characteristics and ecological risk assessment of heavy metals in Shaying River Basin. Environ. Chem. 2019, 38, 2386–2401. [Google Scholar]
  68. Zhang, J.; Li, S.Y.; Dong, R.Z.; Jiang, C.S.; Ni, M.F. Influences of land use metrics at multi-spatial scales on seasonal water quality: A case study of river systems in the Three Gorges Reservoir Area, China. J. Clean. Prod. 2018, 206, 76–85. [Google Scholar] [CrossRef]
  69. Fang, X.H.; Peng, B.; Wang, X.; Song, Z.L.; Zhou, D.X.; Wang, Q.; Qin, Z.L.; Tan, C.Y. Distribution, contamination and source identification of heavy metals in bed sediments from the lower reaches of the Xiangjiang River in Hunan province, China. Sci. Total Environ. 2019, 689, 557–570. [Google Scholar] [CrossRef]
  70. Liang, J.L.; Huang, X.M.; Yan, J.W.; Li, Y.Y.; Zhao, Z.W.; Liu, Y.Y.; Ye, J.Y.; Wei, Y.M. A review of the formation of Cr (VI) via Cr (III) oxidation in soils and groundwater. Sci. Total Environ. 2021, 774, 145762. [Google Scholar] [CrossRef]
  71. Liu, N.T.; Liu, H.Y.; Wu, P.; Meng, W.; Li, X.X.; Chen, X. Distribution characteristics and potential pollution assessment of heavy metals (Cd, Pb, Zn) in reservoir sediments from a historical artisanal zinc smelting area in Southwest China. Environ. Sci. Pollut. R Int. 2021, 46, 85–89. [Google Scholar] [CrossRef]
  72. Ran, H.Z.; Guo, Z.H.; Yi, L.W.; Xiao, X.Y.; Zhang, L.; Hu, Z.H.; Li, C.Z.; Zhang, Y.X. Pollution characteristics and source identification of soil metal(loid)s at an abandoned arsenic-containing mine, China. J. Hazard Mater. 2021, 413, 125382. [Google Scholar] [CrossRef]
  73. Wu, W.H.; Qu, S.Y.; Nel, W.; Ji, J.F. The influence of natural weathering on the behavior of heavy metals in small basaltic watersheds: A comparative study from different regions in China. Chemosphere 2021, 262, 127897. [Google Scholar] [CrossRef]
  74. Mei, M.; Zhang, J.; Lei, J.S.; Yang, F.Y.; Wang, X.K. Assessment and source apportionment of heavy metal pollution in alluvial soils of the Anhui section of the Yangtze River. Environ. Ecol. 2025, 7, 31–39. [Google Scholar]
  75. Sun, H.Y.; Ma, F.; Chen, Z.R.; Zhu, X.; Wei, X.F. Source apportionment and ecological risk of soil heavy metals in a typical vanadium-titanium magnetite mining areas affected by intensive transportation activities in Chengde. Environ. Sci. 2025; in press. [Google Scholar]
  76. Ali, H.; Khan, E.; Ilahi, I. Environmental chemistry and ecotoxicology of hazardous heavy metals: Environmental persistence, toxicity, and bioaccumulation. J. Chem. 2019, 2019, 6730305. [Google Scholar] [CrossRef]
  77. Chen, Y.Z.; Li, T.Q.; Ma, J.H.; Ruan, X.J.; Wang, L.; Zou, G.Y. Nitrate nitrogen pollution and health risks in typical cancer prone areas of the Shaying River Basin. J. Environ. Sci. 2019, 39, 1698–1707. [Google Scholar]
  78. Wu, P.; Shu, Q.; Luo, X.F.; Wu, G. Surface water pollution characteristics and risk assessment of the manganese mine area in Guzhang, Xiangxi. Soil Water Conse Notif. 2019, 39, 70–74, 79. [Google Scholar]
  79. Adimalla, N.; Chen, J.; Qian, H. Spatial characteristics of heavy metal contamination and potential human health risk assessment of urban soils: A case study from an urban region of South India. Ecotoxicol. Environ. Saf. 2020, 194, 110406. [Google Scholar] [CrossRef]
  80. Wang, Z.G.; Zhan, H.M.; Xu, L.G.; Guo, H.K.; Li, J.L. Distribution of heavy metal and human health risk assessment of water bodies in the basin of Poyang Lake into the Yangtze River. Resour. Environ. Yangtze Basin 2023, 32, 1281–1290. [Google Scholar]
  81. Peng, J.Y.; Zhang, S.; Han, Y.Y.; Bate, B.; Ke, H.; Chen, Y.M. Soil heavy metal pollution of industrial legacies in China and health risk assessment. Sci. Total Environ. 2022, 816, 151632. [Google Scholar] [CrossRef]
Figure 1. Distribution of sampling points in the Shaying River basin.
Water 17 01892 g001
Figure 2. Box plots of water quality indices (WQIs) for different regional sampling sites (The colorful dots indicates the distribution of sampling points in the three regions).
Water 17 01892 g002
Figure 3. Spatial differences in the total principal component scores of the thirty–three sampling sites (A) and principal components (F1, F2, F3, F4, and F5) of sample points in different regional reaches score histogram (B).
Water 17 01892 g003
Figure 4. Potential ecological risk index of heavy metals in Shaying River sediment ((A) potential ecological risk index of each sampling point; (B) box plot of potential ecological risk index of heavy metals in sediments in mountainous areas; (C) box plot of potential ecological risk index of sediment heavy metals in urban areas; (D) box plot of potential ecological risk index of heavy metals in urban areas). a, b, and c show that there are significant differences among the three areas.
Water 17 01892 g004
Figure 5. Clustering heat map of spatial characteristics of potential ecological risks of six heavy metals.
Water 17 01892 g005
Table 1. Weights and normalized values of water quality parameters. mg/L.
ParametersPiCi
1009080706050403020100
pH177–87–8.57–96.5–76–9.55–104–113–122–131–14
DO4≥7.5>7.0>6.5>6.0>5.0>4.0>3.5>3.0>2.0≥1.0<1.0
CODMn3<1<2<3<4<6<8<10<12<14≤15>15
NH3–N3<0.01<0.05<0.10<0.20<0.30<0.40<0.50<0.75<1.00≤1.25>1.25
TP1<0.01<0.02<0.05<0.1<0.15<0.2<0.25<0.3<0.35≤0.4>0.4
Table 2. Evaluation criteria of heavy metals E r i and RI.
Evaluating IndicatorContamination Degree
LowModerateHighHigherSerious
E r i E r i < 40 40     E r i < 80 80     E r i < 160 160     E r i < 320 E r i ≥ 320
RIRI < 120120 ≤ RI < 240240 ≤ RI < 480RI ≥ 480
Table 3. Principal component load matrix after rotation.
ParametersPrincipal Components
F1F2F3F4F5
Cl0.910.01−0.02−0.070.19
TDS0.870.330.04−0.180.13
Sal0.870.330.03−0.170.14
TH (CaCO3)0.830.08−0.250.160.01
TN0.820.370.070.29−0.08
NO3–N0.820.350.100.20−0.09
CODMn0.740.110.010.260.34
TP0.270.870.080.07−0.05
PO43−0.250.89−0.060.010.29
NH3–N0.120.060.060.93−0.12
DO−0.23−0.150.020.16−0.90
pH−0.24−0.150.840.220.19
WT−0.26−0.29−0.760.180.32
Note: bold indicates the main factors associated with each of the five principal component axes.
Table 4. Carcinogenic risk index (CRI) and hazard index (HI) of sediment heavy metals in three regions of Shaying River for different populations.
Different Regional River ReachesAdult MaleAdult FemaleChildren
CRI
(×10−3)
HI
(×10−2)
CRI
(×10−3)
HI
(×10−2)
CRI
(×10−3)
HI
(×10−2)
Mountain area3.30 ± 0.33 aA6.59 ± 0.43 aA3.81 ± 0.37 aA7.59 ± 0.50 aA27.60 ± 2.72 aB55.06 ± 3.60 aB
Urban area4.42 ± 0.15 bA6.57 ± 0.23 aA5.10 ± 0.18 bA7.58 ± 0.27 aA36.95 ± 1.29 bB54.94 ± 1.93 aB
Agricultural area7.10 ± 0.66 cA8.64 ± 0.57 bA8.18 ± 0.76 cA9.96 ± 0.66 bA59.32 ± 5.49 cB72.20 ± 4.80 bB
Note: “a, b, c” indicates that there are significant variations among CRI and HI of three regions; “A, B” indicates that there are significant variations among CRI and HI of three groups of people.
Table 5. Carcinogenic risk index (CRI) and hazard quotient (HQ) of heavy metals in 6 sediments of Shaying River.
Heavy MetalsAdult MaleAdult FemaleChildren
CRI
(×10−4)
HQ
(×10−3)
CRI
(×10−4)
HQ
(×10−3)
CRI
(×10−4)
HQ
(×10−3)
Cr42.20 ± 2.87 a34.31 ± 2.33 a48.63 ± 3.31 a39.54 ± 2.69 a352.66 ± 23.97 b286.72 ± 19.49 b
As3.47 ± 0.19 a7.67 ± 0.42 a4.00 ± 0.22 a8.84 ± 0.49 a29.03 ± 1.60 b64.09 ± 3.54 b
Cd0.02 ± 0.00 a0.30 ± 0.01 a0.02 ± 0.00 a0.35 ± 0.02 a0.16 ± 0.01 b2.55 ± 0.12 b
Sb-0.47 ± 0.02 a-0.55 ± 0.02 a-3.97 ± 0.16 b
Pb-26.53 ± 1.28 a-30.57 ± 1.47 a-221.69 ± 10.67 b
Hg-0.26 ± 0.03 a-0.30 ± 0.04 a-2.15 ± 0.28 b
Note: “-” indicates that the heavy metal is a non-carcinogenic heavy metal; “a, b” indicates that there are significant differences among different groups of people.
Disclaimer/Publisher’s Note: The statements, opinions and data contained in all publications are solely those of the individual author(s) and contributor(s) and not of MDPI and/or the editor(s). MDPI and/or the editor(s) disclaim responsibility for any injury to people or property resulting from any ideas, methods, instructions or products referred to in the content.

