
Dried Out and Priced Up: Physical Water Risk, CSR Strategies, and the Cost of Equity

Abstract
1. Introduction
2. Literature Review
2.1. Physical Water Risk
2.2. Factors Affecting the Cost of Equity Capital
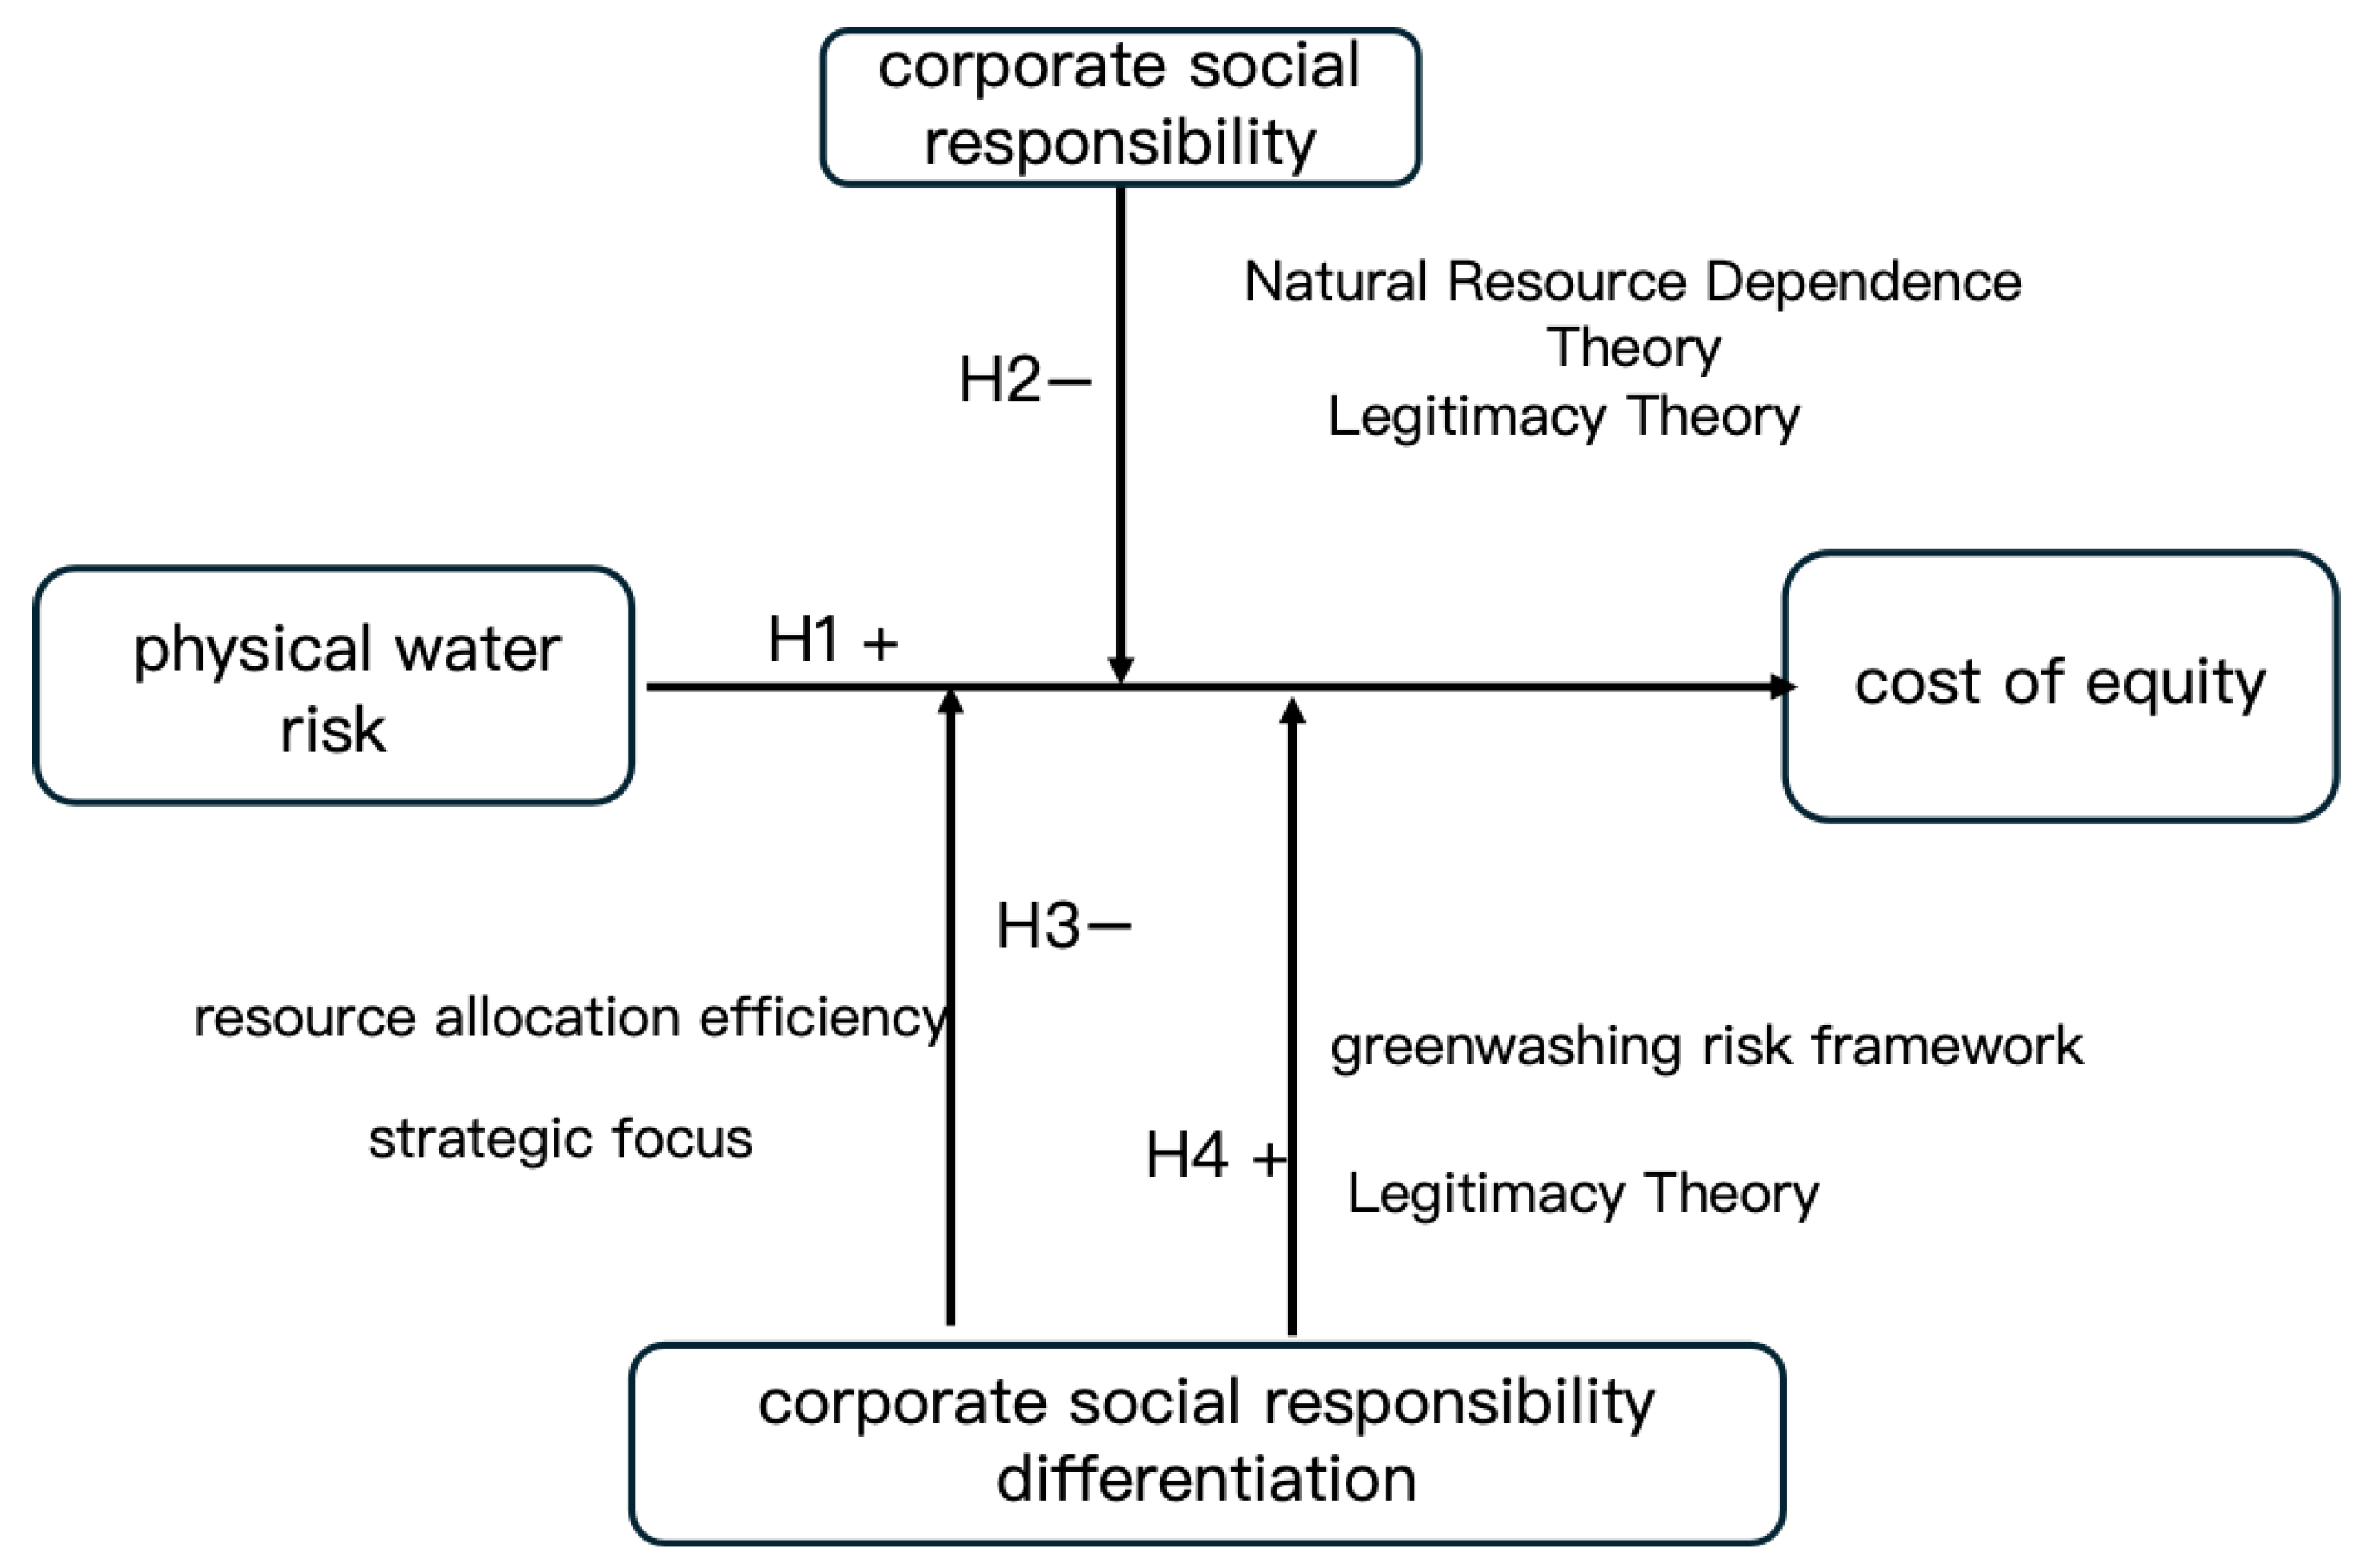
3. Research Hypotheses
4. Research Design
4.1. Samples and Data
4.2. Variable Measurement
4.2.1. Physical Water Risk
4.2.2. Cost of Equity
4.2.3. CSR
4.2.4. Control Variables
4.3. Model
5. Empirical Analysis
5.1. Descriptive Statistics
5.2. Hypothesis Testing
5.3. Robustness and Endogeneity Tests
- (1)
- Robustness Test
- (2)
- Endogeneity Test
5.4. Channel Analysis
5.5. Moderating Effects
5.6. Further Analysis
- (1)
- Ownership Structure
- (2)
- Firm Size
6. Discussion and Conclusions
7. Policy Recommendations and Future Directions
7.1. Policy Recommendations
7.2. Potential Limitations and Future Directions
Author Contributions
Funding
Data Availability Statement
Conflicts of Interest
References
- Mehta, L. The Politics and Poetics of Water: The Naturalisation of Scarcity in Western India; Orient Blackswan: Hyderabad, India, 2005. [Google Scholar]
- Hussein, H. Lifting the Veil: Unpacking the Discourse of Water Scarcity in Jordan. Environ. Sci. Policy 2018, 89, 385–392. [Google Scholar] [CrossRef]
- Zheng, L.; Ye, L.; Wang, M.; Wang, Y.; Zhou, H. Does Water Matter? The Impact of Water Vulnerability on Corporate Financial Performance. Int. J. Environ. Res. Public Health 2022, 19, 11272. [Google Scholar] [CrossRef]
- Bhat, V.N. Water and Its Effect on Business Productivity: A Cross-Country Analysis. Water Resour. Manag. 2015, 29, 4007–4020. [Google Scholar] [CrossRef]
- Sánchez-Hernández, M.; Robina-Ramírez, R.; De Clercq, W. Water Management Reporting in the Agro-Food Sector in South Africa. Water 2017, 9, 830. [Google Scholar] [CrossRef]
- Kurland, N.B.; Zell, D. Water and Business: A Taxonomy and Review of the Research. Organ. Environ. 2010, 23, 316–353. [Google Scholar] [CrossRef]
- Evans, J.; Allan, N.; Cantle, N. A New Insight into the World Economic Forum Global Risks. Econ. Pap. A J. Appl. Econ. Policy 2017, 36, 185–197. [Google Scholar] [CrossRef]
- Wicaksono, A.P.; Setiawan, D. Water Disclosure in the Agriculture Industry: Does Stakeholder Influence Matter? J. Clean. Prod. 2022, 337, 130605. [Google Scholar] [CrossRef]
- Vo, X.V. Corporate Social Responsibility and Sustainable Development: A Literature Review and Future Research Directions. Papers SSRN 2025. preprint. [Google Scholar]
- Godfrey, P.C.; Merrill, C.B.; Hansen, J.M. The Relationship between Corporate Social Responsibility and Shareholder Value: An Empirical Test of the Risk Management Hypothesis. Strateg. Manag. J. 2009, 30, 425–445. [Google Scholar] [CrossRef]
- Prasad, K.; Kumar, S.; Devji, S.; Lim, W.M.; Prabhu, N.; Moodbidri, S. Corporate Social Responsibility and Cost of Capital: The Moderating Role of Policy Intervention. Res. Int. Bus. Financ. 2022, 60, 101620. [Google Scholar] [CrossRef]
- Ortas, E.; Burritt, R.L.; Christ, K.L. The Influence of Macro Factors on Corporate Water Management: A Multi-Country Quantile Regression Approach. J. Clean. Prod. 2019, 226, 1013–1021. [Google Scholar] [CrossRef]
- Distefano, T.; Kelly, S. Are We in Deep Water? Water Scarcity and Its Limits to Economic Growth. Ecol. Econ. 2017, 142, 130–147. [Google Scholar] [CrossRef]
- Yang, J.; Li, J.; Van Vliet, M.T.H.; Jones, E.R.; Huang, Z.; Liu, M.; Bi, J. Economic Risks Hidden in Local Water Pollution and Global Markets: A Retrospective Analysis (1995–2010) and Future Perspectives on Sustainable Development Goal 6. Water Res. 2024, 252, 121216. [Google Scholar] [CrossRef]
- Wang, C.; Shuai, C.; Chen, X.; Sun, J.; Zhao, B. Linking Local and Global: Assessing Water Scarcity Risk through Nested Trade Networks. Sustain. Dev. 2025, 33, 1–18. [Google Scholar] [CrossRef]
- Zhu, Y.; Zhang, C.; Wang, T.; Miao, Y. Corporate Water Risk: A New Research Hotspot under Climate Change. Sustain. Dev. 2024, 32, 2623–2637. [Google Scholar] [CrossRef]
- Zhang, L.; Tang, Q.; Huang, R.H. Mind the Gap: Is Water Disclosure a Missing Component of Corporate Social Responsibility? Br. Account. Rev. 2021, 53, 100940. [Google Scholar] [CrossRef]
- Mueller, S.A.; Carlile, A.; Bras, B.; Niemann, T.A.; Rokosz, S.M.; McKenzie, H.L.; Chul Kim, H.; Wallington, T.J. Requirements for Water Assessment Tools: An Automotive Industry Perspective. Water Resour. Ind. 2015, 9, 30–44. [Google Scholar] [CrossRef]
- Chen, F.; Liu, J.; Yang, Z.; Dusengemungu, D.-R.; Zhang, H. Does Water Risk Increase Corporate Debt Financing Capacity? Evidence from Listed Companies in High-Water Sensitive Industries in China. J. Clean. Prod. 2023, 415, 137858. [Google Scholar] [CrossRef]
- Fama, E.F.; French, K.R. The Cross-Section of Expected Stock Returns. J. Financ. 1992, 47, 427–465. [Google Scholar] [CrossRef]
- Chen, F.; Hope, O.-K.; Li, Q.; Wang, X. Financial Reporting Quality and Investment Efficiency of Private Firms in Emerging Markets. Account. Rev. 2011, 86, 1255–1288. [Google Scholar] [CrossRef]
- Yang, J.; Cai, G.; Zheng, G.; Gu, Q. Firm Internationalization and Cost of Equity: Evidence from China. China J. Account. Res. 2022, 15, 100237. [Google Scholar] [CrossRef]
- Nukala, V.B.; Prasada Rao, S.S. Role of Debt-to-Equity Ratio in Project Investment Valuation, Assessing Risk and Return in Capital Markets. Future Bus. J. 2021, 7, 13. [Google Scholar] [CrossRef]
- Jang, S.; Choi, H.; Kim, H. Managerial Ability and Cost of Equity Capital. Adv. Account. 2024, 65, 100681. [Google Scholar] [CrossRef]
- Gerged, A.M.; Matthews, L.; Elheddad, M. Mandatory Disclosure, Greenhouse Gas Emissions and the Cost of Equity Capital: UK Evidence of a U-shaped Relationship. Bus. Strategy Environ. 2021, 30, 908–930. [Google Scholar] [CrossRef]
- Chen, Y.; Li, T.; Zeng, Q.; Zhu, B. Effect of ESG Performance on the Cost of Equity Capital: Evidence from China. Int. Rev. Econ. Financ. 2023, 83, 348–364. [Google Scholar] [CrossRef]
- Mathath, N.; Kumar, V.; Balasubramanian, G. ESG Disclosure and Cost of Equity: Do Big 4 Audit Firms Matter? J. Emerg. Mark. Financ. 2025, 24, 87–108. [Google Scholar] [CrossRef]
- Nasrallah, N.; El Khoury, R.; Atayah, O.F.; Marashdeh, H.; Najaf, K. The Impact of Carbon Awareness, Country-Governance, and Innovation on the Cost of Equity: Evidence from Oil and Gas Firms. Res. Int. Bus. Financ. 2025, 73, 102640. [Google Scholar] [CrossRef]
- Han, L.; Cheng, X.; Chan, K.C.; Gao, S. Does Air Pollution Affect Seasoned Equity Offering Pricing? Evidence from Investor Bids. J. Financ. Mark. 2022, 59, 100657. [Google Scholar] [CrossRef]
- Cepni, O.; Şensoy, A.; Yılmaz, M.H. Climate Change Exposure and Cost of Equity. Energy Econ. 2024, 130, 107288. [Google Scholar] [CrossRef]
- Yue, X.; Kong, X.; Zhao, Q.; Ho, K.-C. Impact of Climate Change Risks on Equity Capital: Evidence-Based on Chinese Markets. Pac.-Basin Financ. J. 2024, 88, 102541. [Google Scholar] [CrossRef]
- Debaere, P.; Kapral, A. The Potential of the Private Sector in Combating Water Scarcity: The Economics. Water Secur. 2021, 13, 100090. [Google Scholar] [CrossRef]
- Afrin, R.; Peng, N.; Bowen, F. The Wealth Effect of Corporate Water Actions: How Past Corporate Responsibility and Irresponsibility Influence Stock Market Reactions. J. Bus. Ethics 2021, 180, 105–124. [Google Scholar] [CrossRef]
- Kumar Kanike, U. Factors Disrupting Supply Chain Management in Manufacturing Industries. J. Supply Chain. Manag. Sci. 2023, 4, 1–24. [Google Scholar] [CrossRef]
- Skouloudis, A.; Leal Filho, W.; Deligiannakis, G.; Vouros, P.; Nikolaou, I.; Evangelinos, K. Coping with Floods: Impacts, Preparedness and Resilience Capacity of Greek Micro-, Small- and Medium-Sized Enterprises in Flood-Affected Areas. Int. J. Clim. Change Strateg. Manag. 2023, 15, 81–103. [Google Scholar] [CrossRef]
- Zhong, S.; Geng, Y.; Liu, W.; Gao, C.; Chen, W. A Bibliometric Review on Natural Resource Accounting during 1995–2014. J. Clean. Prod. 2016, 139, 122–132. [Google Scholar] [CrossRef]
- He, Y.; Wang, Y.; Chen, X. Spatial Patterns and Regional Differences of Inequality in Water Resources Exploitation in China. J. Clean. Prod. 2019, 227, 835–848. [Google Scholar] [CrossRef]
- El Ghoul, S.; Guedhami, O.; Kim, H.; Park, K. Corporate Environmental Responsibility and the Cost of Capital: International Evidence. J. Bus. Ethics 2018, 149, 335–361. [Google Scholar] [CrossRef]
- Wang, H.; Niu, X.; Xing, H. Regional Climate Risk and Corporate Social Responsibility: Evidence from China. Emerg. Mark. Financ. Trade 2025, 61, 21–43. [Google Scholar] [CrossRef]
- Le, T.T. Corporate Social Responsibility and SMEs’ Performance: Mediating Role of Corporate Image, Corporate Reputation and Customer Loyalty. Int. J. Emerg. Mark. 2023, 18, 4565–4590. [Google Scholar] [CrossRef]
- Liu, Q.; Wu, J. Financial Regulation and Corporate Social Responsibility: Evidence from China. Pac.-Basin Financ. J. 2025, 89, 102599. [Google Scholar] [CrossRef]
- Weber, O.; Saunders-Hogberg, G. Water Management and Corporate Social Performance in the Food and Beverage Industry. J. Clean. Prod. 2018, 195, 963–977. [Google Scholar] [CrossRef]
- Zhang, Y.; Wang, H.; Zhou, X. Dare to Be Different? Conformity Versus Differentiation in Corporate Social Activities of Chinese Firms and Market Responses. Acad. Manag. J. 2020, 63, 717–742. [Google Scholar] [CrossRef]
- Zhou, J.; Lu, Y.; Wu, Z.; Wang, H. Optimally Distinctive Corporate Social Responsibility Strategy: How Strategic Conformity and Differentiation Contribute to Entrepreneurial Firm Performance. Corp. Soc. Responsib. Environ. Manag. 2025, 32, 3693–3710. [Google Scholar] [CrossRef]
- Barlow, M.A.; Verhaal, J.C.; Angus, R.W. Optimal Distinctiveness, Strategic Categorization, and Product Market Entry on the Google Play App Platform. Strateg. Manag. J. 2019, 40, 1219–1242. [Google Scholar] [CrossRef]
- Gorovaia, N.; Makrominas, M. Identifying Greenwashing in Corporate-social Responsibility Reports Using Natural-language Processing. Eur. Financ. Manag. 2025, 31, 427–462. [Google Scholar] [CrossRef]
- Xu, M.; Tse, Y.K.; Geng, R.; Liu, Z.; Potter, A. Greenwashing and Market Value of Firms: An Empirical Study. Int. J. Prod. Econ. 2025, 284, 109606. [Google Scholar] [CrossRef]
- Wang, M.; Xu, X.; Zheng, L.; Xu, X.; Zhang, Y. Analysis of the Relationship between Economic Development and Water Resources–Ecological Management Capacity in China Based on Nighttime Lighting Data. Int. J. Environ. Res. Public Health 2023, 20, 1818. [Google Scholar] [CrossRef]
- Bhuiyan, M.d.B.U.; Hu, Y. Do Corporate Donations Affect the Cost of Equity? International Evidence. J. Account. Lit. 2025, ahead-of-print. [Google Scholar] [CrossRef]
- Radwan, S.R.A.; Xiongyuan, W.; Abdelall, M.A.A.; Abdelgawad, H.N.M. The Impact of Integrated Reporting Quality on the Cost of Equity Capital: Evidence from Asia. J. Financ. Report. Account. 2025, ahead-of-print. [Google Scholar] [CrossRef]
- Xie, X.; Zhang, W. Impacts of CSR on the Efficiency of Chinese Enterprises’ Outward FDI. Financ. Res. Lett. 2023, 57, 104252. [Google Scholar] [CrossRef]
- Wang, H.; Choi, J. A New Look at the Corporate Social–Financial Performance Relationship: The Moderating Roles of Temporal and Interdomain Consistency in Corporate Social Performance. J. Manag. 2013, 39, 416–441. [Google Scholar] [CrossRef]
- Zheng, L.; Gao, P.; Wang, M. The Economic Impact of Water Vulnerability on Corporate Sustainability: A Perspective of Corporate Capital Cost. Water 2024, 16, 2560. [Google Scholar] [CrossRef]
- Jo, H.; Na, H. Does CSR Reduce Firm Risk? Evidence from Controversial Industry Sectors. J. Bus. Ethics 2012, 110, 441–456. [Google Scholar] [CrossRef]
- Hu, C.; Li, Y.; Zheng, X. Data Assets, Information Uses, and Operational Efficiency. Appl. Econ. 2022, 54, 6887–6900. [Google Scholar] [CrossRef]
- Oikonomou, I.; Brooks, C.; Pavelin, S. The Impact of Corporate Social Performance on Financial Risk and Utility: A Longitudinal Analysis. Financ. Manag. 2012, 41, 483–515. [Google Scholar] [CrossRef]
- Wang, Y.; Llasat, M.C.; Randin, C.; Coppola, E. Climate Change Impacts on Water Resources in the Mediterranean. Reg. Environ. Change 2020, 20, 83. [Google Scholar] [CrossRef]
- Boardman, A.E.; Vining, A.R. Ownership and Performance in Competitive Environments: A Comparison of the Performance of Private, Mixed, and State-Owned Enterprises. J. Law Econ. 1989, 32, 1–33. [Google Scholar] [CrossRef]
- Huang, M.; Jiang, H.; Ning, Z.; Tu, J. Institutional Ownership and Cost of Equity of Chinese Firms. China Financ. Rev. Int. 2024, ahead-of-print. [Google Scholar] [CrossRef]
- Nguyen, V.H.; Agbola, F.W.; Choi, B. Does Corporate Social Responsibility Reduce Information Asymmetry? Empirical Evidence from Australia. Aust. J. Manag. 2019, 44, 188–211. [Google Scholar] [CrossRef]
- Inrawan, A.; Sembiring, L.D.; Loist, C. The Moderating Role of Liquidity in the Relationship between Leverage, Firm Size, and Profitability. Int. J. Bus. Law Educ. 2025, 6, 54–68. [Google Scholar] [CrossRef]
- Muhammad, H.; Migliori, S.; Consorti, A. Corporate Governance and R&D Investment: Does Firm Size Matter? Technol. Anal. Strateg. Manag. 2024, 36, 518–532. [Google Scholar] [CrossRef]
- Tashman, P. A Natural Resource Dependence Perspective of the Firm: How and Why Firms Manage Natural Resource Scarcity. Bus. Soc. 2021, 60, 1279–1311. [Google Scholar] [CrossRef]
- Daddi, T.; Todaro, N.M.; De Giacomo, M.R.; Frey, M. A Systematic Review of the Use of Organization and Management Theories in Climate Change Studies: A Review of Management Theories in Climate Change Studies. Bus. Strategy Environ. 2018, 27, 456–474. [Google Scholar] [CrossRef]
- Sun, Y.; Yang, Y.; Huang, N.; Zou, X. The Impacts of Climate Change Risks on Financial Performance of Mining Industry: Evidence from Listed Companies in China. Resour. Policy 2020, 69, 101828. [Google Scholar] [CrossRef]
- Havlinova, A.; Kukacka, J. Corporate Social Responsibility and Stock Prices After the Financial Crisis: The Role of Strategic CSR Activities. J. Bus. Ethics 2023, 182, 223–242. [Google Scholar] [CrossRef]
- Su, W.; Peng, M.W.; Tan, W.; Cheung, Y.-L. The Signaling Effect of Corporate Social Responsibility in Emerging Economies. J. Bus. Ethics 2016, 134, 479–491. [Google Scholar] [CrossRef]
- Chen, T.; Dong, H.; Lin, C. Institutional Shareholders and Corporate Social Responsibility. J. Financ. Econ. 2020, 135, 483–504. [Google Scholar] [CrossRef]

| Industry Code | Industry Name | Obs | Industry Code | Industry Name | Obs |
|---|---|---|---|---|---|
| B06 | Coal Mining and Washing Industry | 216 | C26 | Manufacture of Raw Chemical Materials and Chemical Products | 1982 |
| B08 | Ferrous Metal Mining and Dressing Industry | 60 | C27 | Pharmaceutical Manufacturing Industry | 1788 |
| B09 | Non-ferrous Metal Ore Mining and Dressing Industry | 200 | C28 | Chemical Fiber Manufacturing Industry | 230 |
| C13 | Agricultural and Sideline Food Processing Industry | 395 | C29 | Rubber and Plastic Products Industry | 596 |
| C14 | Food Manufacturing Industry | 352 | C30 | Manufacture of other non-metallic mineral products | 778 |
| C15 | Manufacture of Liquor, Beverages and Refined Tea | 380 | C31 | Smelting and Pressing of Ferrous Metals Industry | 212 |
| C17 | Textile Industry | 388 | C32 | Smelting and Pressing of Non-Ferrous Metals Industry | 614 |
| C18 | Textile and Apparel Industry | 280 | C33 | Metal Products Manufacturing Industry | 535 |
| C19 | Leather, Fur, Feather and Related Products, and Footwear Manufacturing Industry | 86 | D44 | Production and Supply of Electric Power and Heat Power Industry | 562 |
| C22 | Manufacture of pulp, paper and paper products | 248 | D46 | Water Production and Supply Industry | 140 |
| C25 | Petroleum, Coal and Other Fuel Processing Industry | 152 |
| First Class Indicator | Second Class Indicator | Attribute |
|---|---|---|
| Water resources system | Total water resources | Positive |
| The amount of water supply | Positive | |
| Water social system | Per capita life water consumption | Negative |
| Per capita water consumption | Negative | |
| Water economic system | Proportion of agricultural water consumption | Negative |
| Proportion of industrial water consumption | Negative | |
| Water consumption per 10,000 Yuan of GDP | Negative | |
| Water ecological environment | Per capita ecological water consumption | Positive |
| wastewater discharge per 10,000 Yuan of GDP | Negative |
| Variable | Name | Symbol | Measure | Source |
|---|---|---|---|---|
| Dependent variable | Cost of equity capital | COE | PEG model according to Formula (5) | CSMAR |
| Water risk | WR | Score according to Table 1 | China Statistical Yearbook | |
| Independent variable | Corporate Social Responsibility | CSR | Ln (The total score of the five sub-items of CSR) + 1) | Hexun.com. |
| CSR differentiation | CSRSD | The standard deviation of the five sub-item CSR scores published by Hexun.com. | Hexun.com. | |
| Control variables | Firm size | Size | Ln (the year-end total assets of a company) | CSMAR |
| Return on assets | ROA | Business net profit/total assets | ||
| Leverage | LEV | (Total liabilities /Total Assets) × 100% | ||
| Firm age | Age | Ln (Year of observation − Year of listed company + 1) | ||
| Growth | Growth | Revenue Growth Rate | ||
| Ownership concentration | TOP1 | Shareholding ratio of the largest shareholder | ||
| Board size | Board | Number of board members of a company | ||
| Proportion of independent directors | IDP | The proportion of independent directors on the board of directors | ||
| Gross regional product per capita | PGDP | Ln (Gross regional product per capital) | ||
| Year | Control influence of annual factors | |||
| Industry | Control influence of industry factors |
| Variable | Sample | Mean | Std. Dev | Min | Median | Max |
|---|---|---|---|---|---|---|
| COE | 10,194 | 0.109 | 0.043 | 0.015 | 0.036 | 0.600 |
| WR | 10,194 | −0.220 | 0.642 | −0.670 | −0.321 | −0.090 |
| CSR | 10,194 | 9.22 | 14.51 | −18.2 | 30.34 | 90.9 |
| CSRSD | 10,194 | 5.54 | 2.20 | 0.097 | 3.250 | 13.2 |
| ROA | 10,194 | 0.048 | 0.0812 | −0.494 | 0.041 | 0.867 |
| Size | 10,194 | 22.0 | 0.203 | 17.8 | 23.30 | 27.2 |
| Age | 10,194 | 2.78 | 0.472 | 0.001 | 2.89 | 3.87 |
| Growth | 10,194 | 0.341 | 8.65 | −0.998 | 0.107 | 847 |
| LEV | 10,194 | 0.414 | 0.203 | 0.007 | 0.410 | 3.09 |
| Board | 10,194 | 2.16 | 0.216 | 0.001 | 2.20 | 3.18 |
| IDP | 10,194 | 0.371 | 0.0540 | 0.179 | 0.327 | 0.786 |
| TOP1 | 10,194 | 0.361 | 0.152 | 0.003 | 0.343 | 0.900 |
| Pgdp | 10,194 | 11.3 | 0.512 | 10.0 | 11.4 | 12.2 |
| Variables | COE (1) | COE (1) |
|---|---|---|
| WR | 0.037 *** (6.54) | 0.041 ** (1.36) |
| Size | −0.038 ** (−1.28) | |
| ROA | 0.121 ** (1.31) | |
| Lev | 0.023 ** (1.21) | |
| Age | −0.031 *** (−5.43) | |
| Top1 | −0.041 *** (−6.54) | |
| BS | −0.018 * (1.720) | |
| PGDP | 0.001 (0.011) | |
| Cons | 10.0 ** (2.34) | 12.01 ** (2.37) |
| Year | YES | YES |
| Industry | YES | YES |
| Adjusted R-squared | 0.412 | 0.591 |
| Obs | 10,194 | 10,194 |
| Variables | COE (1) | COE (2) | COE (3) |
|---|---|---|---|
| WR | 0.027 *** (4.30) | 0.049 ** (2.36) | |
| WR_1 | 0.008 * (1.75) | ||
| Cons | 13.4 ** (2.46) | 15.0 *** (5.64) | 12.6 *** (3.03) |
| Year | YES | YES | YES |
| Industry | YES | YES | YES |
| Adjusted R-squared | 0.532 | 0.467 | 0.501 |
| Obs | 10,194 | 10,194 | 10,194 |
| Variables | COE (2011–2016) | COE (2017–2022) |
|---|---|---|
| WR | 0.017 * (1.80) | 0.069 ** (2.23) |
| Cons | 10.3 ** (2.03) | 14.4 *** (6.44) |
| Year | YES | YES |
| Industry | YES | YES |
| Adjusted R-squared | 0.472 | 0.510 |
| Obs | 4,852 | 5,339 |
| Variables | COE (1) | COE (2) | COE (3) |
|---|---|---|---|
| WR | 0.031 *** (3.55) | 0.019 *** (5.56) | |
| COEt−1 | 2.67 *** (3.40) | ||
| WRt−1 | 0.021 *** (5.25) | ||
| Cons | 20.4 ** (2.43) | 10.3 ** (2.28) | 12.1 *** (6.35) |
| Year | YES | YES | YES |
| Industry | YES | YES | YES |
| Adjusted R-squared | 0.482 | 0.562 | 0.635 |
| Obs | 9846 | 10,194 | 10,024 |
| Variables | COE (1) | TAT (2) | COE_1 (2) |
|---|---|---|---|
| WR | 0.041 ** (1.36) | −0.035 ** (−2.36) | 0.037 *** (3.01) |
| TAT | −0.023 ** (−2.01) | ||
| Cons | 12.0 ** (2.37) | 15.0 *** (5.64) | 12.5 *** (7.22) |
| Year | YES | YES | YES |
| Industry | YES | YES | YES |
| Adjusted R-squared | 0.365 | 0.467 | 0.472 |
| Obs | 10,194 | 10,194 | 10,194 |
| Variables | COE (1) | COE (1) |
|---|---|---|
| WR | 0.031 *** (3.62) | 0.041 ** (2.36) |
| CSR | −0.032 * (−1.22) | |
| WR × CSR | −0.275 ** (−2.14) | |
| CSRSD | 0.037 ** (2.32) | |
| WR × CSRSD | 0.381 *** (3.24) | |
| Controls | YES | YES |
| Year | YES | YES |
| Industry | YES | YES |
| Adjusted R-squared | 0.426 | 0.517 |
| Obs | 10,194 | 10,194 |
| Variables | CSR_1 The First STAGE | COE the Second Stage | CSRD_1 The First Stage | COE The Second Stage |
|---|---|---|---|---|
| CSR_IV | 0.024 *** (5.00) | |||
| WR × CSR_1 | −0.134 ** (−2.14) | |||
| CSRSD_IV | 0.007 ** (2.20) | |||
| WR × CSRSD_IV | 0.025 ** (2.00) | |||
| Controls | YES | YES | YES | YES |
| Year | YES | YES | YES | YES |
| Industry | YES | YES | YES | YES |
| Obs | 10,194 | 10,194 | 10,194 | 10,194 |
| Variables | COE (2011–2016) | COE (2017–2022) | COE (2011–2016) | COE (2017–2022) |
|---|---|---|---|---|
| WR × CSR | −0.014 (−0.001) | −0.058 ** (−2.25) | ||
| WR × CSRSD | 0.034 (0.009) | 0.093 *** (4.63) | ||
| Controls | YES | YES | YES | YES |
| Year | YES | YES | YES | YES |
| Industry | YES | YES | YES | YES |
| Obs | 4852 | 5339 | 4852 | 5339 |
| COE (1) | COE (2) | COE (3) | ||||
|---|---|---|---|---|---|---|
| State-Owned | Nonstate-Owned | State-Owned | Nonstate-Owned | State-Owned | Nonstate-Owned | |
| WR | 0.017 (0.341) | 0.022 ** (2.06) | 0.029 * (1.65) | 0.034 ** (2.36) | 0.021 (0.010) | 0.042 ** (2.02) |
| CSR | −0.018 (−0.001) | −0.032 * (−1.72) | ||||
| WR × CSR | −0.069 (−0.305) | −0.137 ** (−2.49) | ||||
| CSRSD | 0.031 (0.134) | 0.031 *** (2.36) | ||||
| WR × CSRSD | 0.264 (0.049) | 0.047 ** (2.36) | ||||
| Controls | YES | YES | YES | YES | YES | YES |
| Year | YES | YES | YES | YES | YES | YES |
| Industry | YES | YES | YES | YES | YES | YES |
| Adjusted R-squared | 0.410 | 0.425 | 0.430 | 0.481 | 0.529 | 0.527 |
| Obs | 6278 | 3916 | 6278 | 3916 | 6278 | 3916 |
| COE (1) | COE (2) | COE (3) | ||||
|---|---|---|---|---|---|---|
| Larger | Smaller | Larger | Smaller | Larger | Smaller | |
| WR | 0.025 ** (2.24) | 0.014 ** (2.05) | 0.015 * (1.83) | 0.021 * (1.75) | 0.021 * (1.81) | 0.042 (0.123) |
| CSR | −0.042 ** (−2.60) | −0.162 (−0.321) | ||||
| WR × CSR | −0.069 ** (−2.41) | −0.052 (−0.182) | ||||
| CSRSD | 0.028 ** (2.23) | 0.136 (0.125) | ||||
| WR × CSRSD | 0.264 ** (2.36) | 0.041 (0.253) | ||||
| Controls | YES | YES | YES | YES | YES | YES |
| Year | YES | YES | YES | YES | YES | YES |
| Industry | YES | YES | YES | YES | YES | YES |
| Adjusted R-squared | 0.362 | 0.427 | 0.330 | 0.537 | 0.473 | 0.472 |
| Obs | 4862 | 5332 | 4862 | 5332 | 4862 | 5332 |
Disclaimer/Publisher’s Note: The statements, opinions and data contained in all publications are solely those of the individual author(s) and contributor(s) and not of MDPI and/or the editor(s). MDPI and/or the editor(s) disclaim responsibility for any injury to people or property resulting from any ideas, methods, instructions or products referred to in the content. |
© 2025 by the authors. Licensee MDPI, Basel, Switzerland. This article is an open access article distributed under the terms and conditions of the Creative Commons Attribution (CC BY) license (https://creativecommons.org/licenses/by/4.0/).
Share and Cite
Wang, M.; Zheng, L.; Zhang, Y. Dried Out and Priced Up: Physical Water Risk, CSR Strategies, and the Cost of Equity. Water 2025, 17, 1881. https://doi.org/10.3390/w17131881
Wang M, Zheng L, Zhang Y. Dried Out and Priced Up: Physical Water Risk, CSR Strategies, and the Cost of Equity. Water. 2025; 17(13):1881. https://doi.org/10.3390/w17131881
Chicago/Turabian StyleWang, Mengjiao, Liyuan Zheng, and Yukuo Zhang. 2025. "Dried Out and Priced Up: Physical Water Risk, CSR Strategies, and the Cost of Equity" Water 17, no. 13: 1881. https://doi.org/10.3390/w17131881
APA StyleWang, M., Zheng, L., & Zhang, Y. (2025). Dried Out and Priced Up: Physical Water Risk, CSR Strategies, and the Cost of Equity. Water, 17(13), 1881. https://doi.org/10.3390/w17131881