Abstract
Domestic showers are critical points of human exposure to microbial biofilms, which may harbor opportunistic pathogens such as Legionella spp. and nontuberculous Mycobacterium. However, biofilm development in reverse osmosis (RO)-treated drinking water systems remains poorly understood. We tested whether shower plumbing material (flexible polymer hose versus showerhead with inline polyethersulfone filter) and seasonal water variations influence biofilm community assembly. In a controlled field study, commercial shower systems were deployed in households supplied with RO-treated tap water from the KAUST Seawater Desalination Plant; biofilm samples were collected from hoses and filters over 3–17 months. Flow cytometry and 16S rRNA gene amplicon sequencing characterized microbial abundance, diversity, and taxonomic composition. We found that alpha diversity, measured by observed OTUs, was uniformly low, reflecting ultra-low biomass in RO-treated tap water. Beta diversity analyses revealed clear clustering by material type, with hoses exhibiting greater richness and evenness than filters. Core taxa—Pelomonas, Blastomonas, and Porphyrobacter—dominated both biofilm types, suggesting adaptation to low-nutrient, chlorinated conditions. Overall, our results demonstrate that ultra-low-nutrient RO tap water still supports the formation of material-driven, low-diversity biofilms dominated by oligotrophic taxa, underscoring plumbing-material choice as a critical factor for safeguarding shower water quality. These findings advance our understanding of biofilm ecology in RO-treated systems, informing strategies to mitigate potential health risks in shower water.
1. Introduction
Domestic water systems, such as household showers, are prone to microbial biofilm formation on interior surfaces including showerheads, filters, and flexible hoses. Once established, these biofilms serve as reservoirs for microorganisms that are intermittently released into the water and aerosolized during shower use. Opportunistic pathogens such as Legionella spp. and nontuberculous Mycobacterium have been detected in showerheads [1,2,3] and linked to respiratory infections in susceptible individuals [4,5,6]. Thus, understanding biofilm development in shower environments is crucial for public health, as it directly relates to human exposure to waterborne microbes in daily life.
Biofilm development in drinking water plumbing systems depends largely on the material of construction and prevailing water conditions. Different pipe and fixture materials (e.g., copper, polyvinyl chloride/PVC, stainless steel, rubber) provide distinct surface properties that influence microbial attachment and subsequent growth [7,8,9,10]. For example, copper pipes tend to exhibit lower bacterial colonization than plastic pipes due to the release of antimicrobial copper ions, whereas synthetic polymers can promote higher biomass and diversity [11]. In addition, disinfectant residuals and water chemistry shape these communities by inhibiting many organisms while permitting others such as chlorine-tolerant bacteria [12,13].
Most studies on biofilms in plumbing systems have been conducted on systems supplied with conventionally treated municipal water [5,14,15,16], leaving a gap in our understanding of biofilm development under reverse osmosis (RO)-treated drinking water conditions. The present study was guided by two primary hypotheses. First, we hypothesized that the material of shower plumbing—specifically comparing an inline shower filter versus a flexible polymer hose—significantly influences the biofilm microbial community composition. This hypothesis is supported by evidence indicating that different substrata select for distinct microbial assemblages; for instance, biofilms on plastic or rubber surfaces often differ in community makeup and cell density from those on metal or glass surfaces [8,9]. Second, we hypothesized that biofilm communities in the shower system undergo seasonal shifts in composition/structure. Seasonal variations in water temperature, usage patterns, and source water microbial inputs are known to impact drinking water microbiomes [17,18,19].
To test these hypotheses, we systematically compared biofilms on two shower components—an inline filter unit and the adjacent shower hose surface—within the same chlorinated RO-treated water system. Sampling occurred at multiple time points, spanning usage periods from three to seventeen months, to capture potential seasonal effects. RO-treated water is characterized by extremely low dissolved organic carbon and typically carries a residual chlorine concentration. This combination may constrain microbial growth in ways that differ from conventional distribution systems [13,20]. Consequently, it remains unclear whether—and to what extent—seasonal factors (i.e., short-term versus long-term usage) alter shower biofilm composition and function, or if certain materials consistently support more diverse or robust communities. We addressed three key research questions: (1) How do biofilm diversity and composition differ between the shower filter and hose surfaces? (2) How do these communities change across locations and usage periods that span different seasons? (3) To what extent do biofilm populations correspond with—or diverge from—the microbial populations present in the water entering and exiting the shower system? By answering these questions, this work aims to shed light on microbial ecological processes in low-nutrient, chlorinated plumbing environments, inform risk assessments of biofilm growth on common shower materials, and ultimately contribute to improved public health strategies in settings with advanced water treatment.
2. Materials and Methods
2.1. Study Site and Controlled Shower Experiment
The reverse osmosis (RO)-produced tap water used in this study originated from the KAUST Seawater Desalination Plant (Thuwal, Kingdom of Saudi Arabia). Details of the desalination and post-treatment processes are provided elsewhere [13,21]. Briefly, seawater undergoes ultrafiltration, reverse osmosis, and subsequent chlorine disinfection to maintain a residual chlorine concentration of approximately 0.5 mg/L throughout the distribution network.
In multiple houses and apartments (n = 16 households; Supplementary Figure S1), we deployed identical shower units consisting of a commercial showerhead fitted with a 0.2 µm hollow-fiber PES membrane (cBlue SC Aquafree, Hamburg, Germany)—hereafter called the “shower filter”—capable of retaining up to 107 microbial cells (including Legionella spp.), along with a standard 125 cm Isiflex synthetic shower hose (Hansgrohe, Schiltach, Germany). These units remained in place under normal household conditions for various periods (3, 6, 12, 14, 15, or 17 months) to encompass both short- and long-term use. All selected households were supplied exclusively with RO-treated tap water from the KAUST Seawater Desalination Plant. The shower filter and hose model were standardized across all participating homes to ensure consistency. Participants installed the units in their bathrooms and used them under ordinary daily routines (i.e., no special instructions regarding water usage or flushing). Due to privacy concerns, we did not collect data on each household’s exact usage frequency.
2.2. Water and Biofilm Analysis
Before disassembling the shower unit (comprising the hose and showerhead with the inline filter used in subsequent analyses), a one-liter sample of cold water was collected directly from the shower outlet. The water was collected in an autoclaved, Milli-Q–rinsed Nalgene bottle to ensure sample sterility. This water sample was used to determine total cell count (TCC) and intact cell count (ICC) employing an established flow cytometry protocol [22,23].
For TCC, 700 µL of the water sample was mixed with 7 µL of SYBR Green~I (prepared as a 1:100 dilution in sterile deionized water). For ICC, 700 µL of the water sample was similarly mixed with 7 µL of SYBR Green I (1:100 dilution) and supplemented with propidium iodide (PI) to achieve a final concentration of 4 µM. The stained samples were then incubated in the dark at 35 °C for 10 min to ensure proper staining and subsequently analyzed using an Accuri C6 Plus flow cytometer (BD Biosciences, Franklin Lakes, NJ, USA). The cytometer was equipped with a 50 mW laser emitting at 488 nm, and measurements were conducted at a flow rate of 66 µL/min; a threshold of 600 arbitrary units (a.u.) was applied to the green fluorescence channel (FL1). All water samples were measured in triplicate to guarantee analytical precision.
Total adenosine triphosphate (ATP) was also quantified using a Celsis luminometer (Celsis Advance, Charles River Laboratories, Inc., Boston, MA, USA) following the manufacturer’s protocol. In brief, either water samples or biofilm suspension samples were analyzed using the Celsis AMPiScreen kit (RST400; Celsis, Charles River Laboratories, Inc., Boston, MA, USA), which includes both an extraction reagent (for cell lysis) and an enzyme reagent (luciferin/luciferase). After manually adding 50 µL of sample, an automatic dispensing system on the luminometer initiated the reaction. ATP levels were below the kit detection limit (0.3 pg/mL) for nearly all samples; the maximum value measured was 0.43 pg/mL in one instance, likely due to the inhibitory effect of the residual chlorine (approximately 0.5 mg/L) present in the RO tap water.
Additionally, a 2 cm section cut from both ends of the shower hose was analyzed for TCC, ICC, and ATP. To prepare the biofilm suspension, the cut hose section was immersed in 40 mL of Milli-Q water (for TCC/ICC measurements) or sterile RO tap water (for ATP analysis) within a sterile 50 mL Falcon tube. The tube was then vortexed for 5 s followed by sonication using a probe sonicator for 1 min to ensure complete and homogeneous biofilm dispersion. TCC and ICC data were normalized to the surface area of the hose section (inner diameter = 7.5 mm). Finally, the shower hose and the showerhead containing the filter unit were stored at −80 °C until DNA extraction was performed. An additional set of inlet- and outlet-water samples from the 15-month time point were dechlorinated (using 1% v/v sodium thiosulfate, 20 g/L), then incubated at 30 °C for 72 h to promote the recovery and regrowth of any surviving microorganisms prior to 16S rRNA gene sequencing.
2.3. Water Physicochemical Analysis
Water physicochemical properties were characterized immediately following sample collection. Temperature, pH, and conductivity were measured using a pH/conductivity multiparameter probe (WTW, Wuppertal, Germany) (Supplementary Table S1). The concentration of total chlorine was determined via the diethyl-p-phenylenediamine (DPD) method using a Hach Pocket Colorimeter (Hach, London, UK). In addition, major cations (Na+, K+, Mg2+, and Ca2+) were quantified from the same biofilm suspension samples using inductively coupled plasma optical emission spectrometry/ICP-OES (Agilent Technologies 5110, Santa Clara, CA, USA) in 15 mL Falcon tubes.
2.4. DNA Extraction and 16S rRNA Gene Amplicon Sequencing
DNA extraction was performed on biofilm swab samples collected from the shower hose using the DNeasy PowerBiofilm Kit (Qiagen, Hilden, Germany) according to the manufacturer’s protocol. Notably, the median length of the cut hose section swabbed with a sterile cotton swab for biofilm DNA extraction was 21 cm. In parallel, biofilm suspension samples—obtained by resuspending the inline shower filter in 500 mL of Milli-Q water—were processed using a modified version of the DNeasy PowerWater Kit, which was optimized specifically for RO water samples [24]. A minimum of 30 µL of the genomic DNA extract was then sent to the DNASense Laboratory (Denmark) for library preparation and sequencing. Throughout library preparation, we included multiple negative controls: virgin (unused) hose, virgin (unused) filter resuspension in Milli-Q, and extraction/reagent blanks. The sequencing followed their custom protocol targeting bacterial 16S rRNA gene variable regions 1–8 (bV18-A) and was performed on a PromethION R10.4.1 flowcell using the MinKNOW 24.02.19 software (Oxford Nanopore Technologies, Oxford, UK).
2.5. Data Analysis
Twenty-four of the twenty-eight DNA extracts yielded usable libraries and met a minimum quality threshold of 1800 mapped reads; negative controls (virgin hose, virgin filter, reagent blanks) were used to screen out contaminants during bioinformatics processing. Reads were clustered at 99% identity against SILVA 138 NR99 with DNASense’s pipeline. Although “ASV” (Amplicon Sequence Variant) and “OTU” (Operational Taxonomic Unit) are often distinguished—exact-sequence inference versus similarity clustering—the OTUs provided by DNASense’s protocol effectively behave as ASVs [25]. Samples were rarefied to a common depth (1874 reads) before analysis.
Alpha diversity (OTU richness) was compared between sample types using the Kruskal–Wallis test. Beta diversity was visualized via Bray–Curtis Principal Coordinate Analysis (PCoA) and constrained analysis of principal coordinates (CAP) with sample type (hose, filter, inlet, outlet) as the constraint; CAP axes significance was assessed via permutation testing [26]. Community composition differences were quantified with PERMANOVA (adonis2, vegan) [27] and pairwise Adonis comparisons across levels of sample type and usage duration (3–17 months).
Flow cytometry-derived total and intact cell counts (TCC, ICC) were also analyzed in R. After confirming normality (QQ plots) and homoscedasticity (residual vs. fitted plots) [28], one-way ANOVA or Kruskal–Wallis (when assumptions failed) tested TCC/ICC differences across sample types and usage durations. All tests used α = 0.05.
3. Results
3.1. Microbial Community Composition in Biofilm and Water Samples
Observed OTU counts were uniformly low across all four sample types (Figure 1). Richness ranged from 14–22 OTUs in the water samples. Meanwhile, biofilm samples had higher OTUs that ranged from 2–48 OTUs for showerhead filter, and 17–105 OTUs for shower hose; When comparing between different sample types, however, these differences were not statistically significant (p = 0.121, Kruskal–Wallis). This low number of taxa mirrors the low biomass measured by flow cytometry (2.5–4 log cells/cm2 on hoses; 1–3 log cells/mL in outlet water; Supplementary Figures S2 and S3) and the sparse surface of microbial cells coverage observed on shower filters by SEM (Supplementary Figure S5).
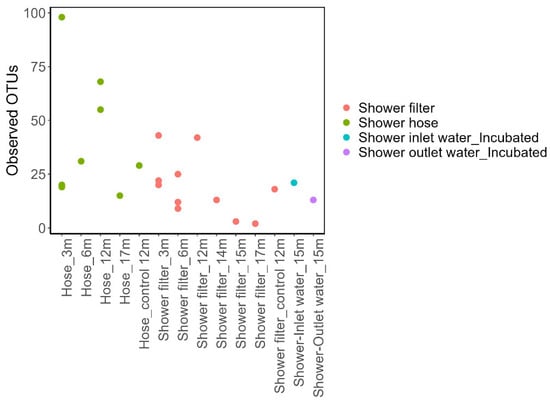
Figure 1.
Observed OTUs across individual samples from the shower filter (pink), shower hose (green), shower inlet water (incubated, blue), and shower outlet water (incubated, purple). Each point represents one sample at a given usage duration (e.g., 3 months, 6 months, etc.). Most of the samples had low OTU counts, reflecting the low bacterial abundance in these samples.
Constrained PCoA (CAP; Figure 2) separated the data into three well-defined clusters that correspond to hose biofilms, filter biofilms, and incubated water samples. CAP1 (31.9% of total variance) discriminates the two biofilm materials (hose versus filter) while CAP2 (13.8%) separates all biofilm samples from incubated inlet/outlet water.
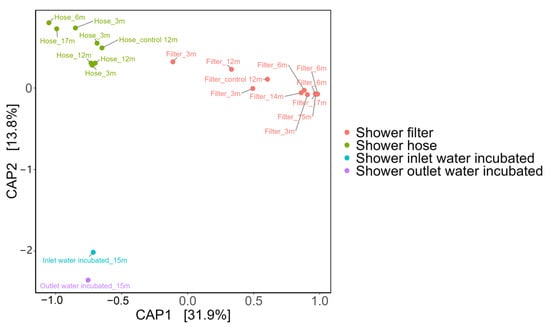
Figure 2.
Constrained Analysis of Principal Coordinates (CAP) based on Bray–Curtis dissimilarities, illustrating distinct clustering among shower filter (red), shower hose (green), shower inlet water_Incubated (blue), and shower outlet water_Incubated (purple) samples. The first two CAP axes explain 32% and 13.8% of the total variation, respectively, underscoring how biofilm communities (hose and filter) differ markedly from one another and from the inlet/outlet water communities. Each sample was labeled with “sample type_xm” which denotes the sample type and its usage duration in months (e.g., “3m” = 3 months).
Venn analysis (Figure 3) shows that biofilms harbored more unique taxa than the incubated waters: 231 OTUs were exclusive to hoses and 98 to filters, versus only 25 unique OTUs in water. Core-versus-non-core analysis (Figure 4) revealed that only one OTU persisted across all groups, and each sample group harbored a unique community composition. The genus Blastomonas dominated this core set (Figure 4B) and was two orders of magnitude more abundant on both hose and filter surfaces than in bulk water, pointing to a strong surface affinity and an oligotrophic life strategy suited to chlorinated, low-carbon conditions.
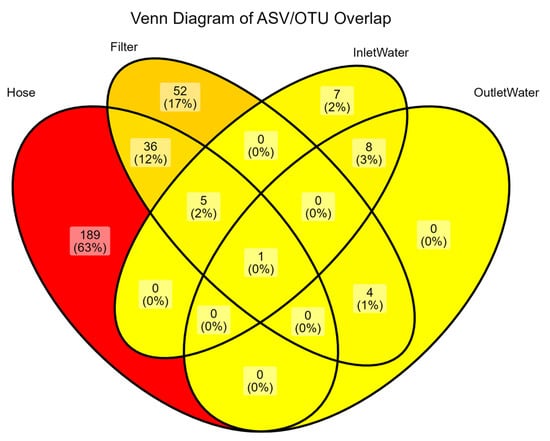
Figure 3.
Distribution of ASV/OTUs across shower hose, shower filter, inlet water (incubated), and outlet water (incubated). Each region shows the number (and percentage) of ASVs unique to or shared by the indicated subsets. The minimal central overlap suggests that each environment harbors a largely distinct microbial community, with the hose exhibiting the highest proportion of unique OTUs.
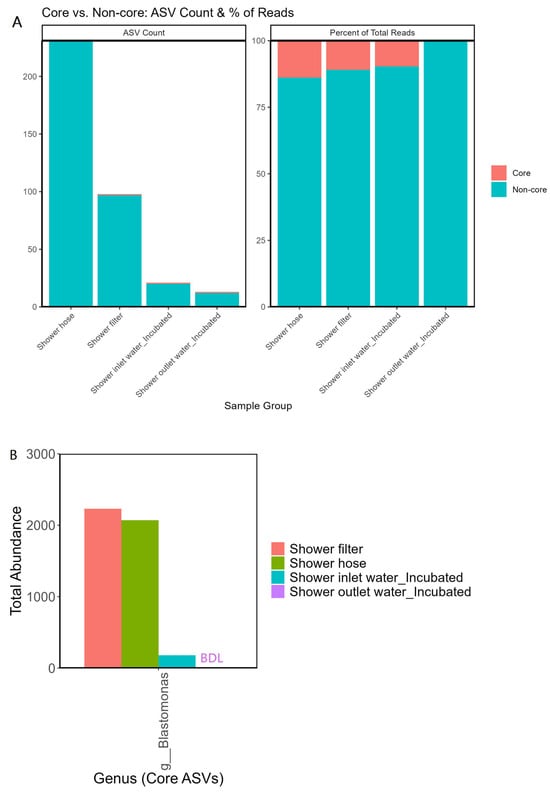
Figure 4.
(A) Stacked bar plots showing core versus non-core ASVs among the four sample types—shower filter, hose, inlet water (incubated), and outlet water (incubated). The left panel indicates the total ASV count for each sample type, while the right panel displays the percentage of total reads attributed to core versus non-core ASVs. (B) Total abundance of the top core genus (shared by all four groups), illustrating how a single taxon dominates among the few ASVs that persist across both biofilm and water samples. BDL indicates below detection limit (zero abundance for that particular sample group).
Taken together, these results show that even within the same household plumbing and under ultra-low-nutrient conditions, the shower hose and inline filter foster distinct, low-diversity (i.e., OTU richness) but surface-specialized biofilm communities that share only a minimal core with the surrounding water.
3.2. Impact of Surface Material on Shower Biofilm Diversity
Our results demonstrate that material-specific factors strongly shape shower biofilm communities. PERMANOVA confirmed a clear distinction between the microbial profiles of the hose and the filter (p = 0.005, R2 = 0.37), underscoring that substrate chemistry, porosity, and surface properties govern which taxa colonize each surface. The shower hose supported a richer, more even community—reflected by higher ASV counts and greater evenness—whereas the PES membrane of the shower filter, engineered for fine particulate removal, harbored a narrower, specialized assemblage.
Despite deployment at different locations and seasonal time points (3, 6, 12, 14, 15, and 17 months), hose biofilm composition remained statistically consistent (all pairwise PERMANOVA, p > 0.005), indicating that the hose material itself, rather than seasonal shifts in source water, sustained a stable community over time. In contrast, the filter’s lower diversity suggests that its fine pores and reduced nutrient accessibility favored only a small subset of oligotrophic specialists.
Figure 5 illustrates the relative abundance of the top 20 genera across all sample types. At the phylum level (Figure 5), Proteobacteria overwhelmingly predominate, followed by a smaller contribution from Actinobacteria. At the genus level, among the 42 OTUs shared by both hose and filter (Figure 3), three core genera—Pelomonas, Blastomonas, and Porphyrobacter—dominate. Their high abundance in both surface biofilms suggests these taxa are specifically adapted to the low-carbon, chlorinated conditions of RO-treated water.
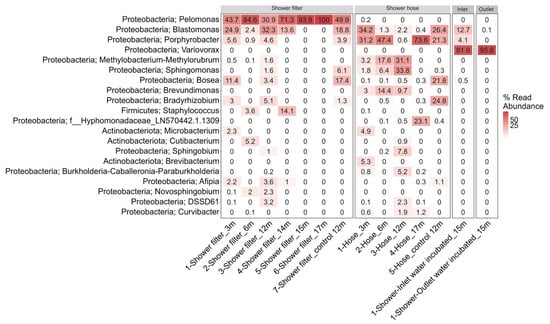
Figure 5.
Heatmap showing the relative abundance of the dominant (top 20) bacterial genera across the four sample types. Each row corresponds to a distinct genus, while each column represents an individual sample. Deeper shades of red indicate higher relative abundances, whereas lighter shades (or zeros) indicate genera that are less abundant or undetected in a given sample.
In summary, although both surfaces are exposed to identical RO-treated water, the pipe material itself dictates biofilm diversity: the hose’s polymer surface fosters a richer, more even community, while the PES filter selects for a narrower group of specialist taxa adapted to ultra-low-nutrient, chlorinated environments.
4. Discussion
We observed uniformly low-diversity biofilm communities on both shower hoses and inline filters (Figure 1), mirroring the low cell densities measured (Supplementary Figure S2). Despite continuous exposure to chlorinated, RO-treated water, biofilm composition did not differ between short-term (3-month) and long-term (up to 17-month) deployments, indicating remarkable temporal stability. The inline filter did, however, reduce the abundance of the core biofilm taxon Blastomonas between inlet and outlet water, suggesting that its 0.2 µm PES membrane selectively impedes certain surface-associated populations.
Biofilm formation remains the dominant microbial lifestyle in drinking water systems because it affords protection against disinfectants and environmental stresses [7]. Consistent with prior work in the KAUST RO network [13], our biofilm communities diverged sharply from the surrounding water microbiota (Figure 2), reaffirming the general finding that biofilm and bulk-water assemblages are distinct in distribution systems [7,15,29,30,31]. Early studies of U.S. showerhead biofilms revealed highly variable DNA yields and a dominance of Actinobacteria and Proteobacteria via 16S amplicon sequencing [14,32]. In contrast to these reports, we did not detect opportunistic-pathogen genera such as Legionella spp., Mycobacterium spp., or Pseudomonas spp. in our samples. This absence likely reflects the extensive biomass removal by upstream RO treatment and the sustained chlorine residual in our system. Quantitatively, our biofilm cell densities (2.5–4 log cells/cm2; Supplementary Figure S2) were 5–6 log lower than those reported by Feazel et al. [14], consistent with chlorinated networks exhibiting fewer OTUs and lower biomass than unchlorinated systems [15,33].
4.1. Material-Driven Community Assembly
Material properties exerted a stronger influence on community structure than seasonal or usage-duration effects. Shower hose biofilms consistently exhibited higher ASV richness and evenness than shower PES-filter biofilms (PERMANOVA p = 0.009, R2 = 0.37). The PES membrane’s fine pores and low nutrient permeability likely favor a narrow set of oligotrophic specialists, whereas the polymer hose surface supports a broader array of taxa. This substrate-specific selection aligns with findings in bench-scale reactors comparing copper, PVC, and polyethylene crosslinked/PEX, where plastics leaching biodegradable organics fostered greater biomass and diversity than inert or antimicrobial surfaces [9,11]. While previous studies [7,10,12] focused on short-term (e.g., days to weeks) incubation tests of growing biofilm across different pipe materials under laboratory conditions, our study shows that the same plumbing materials (shower system unit) across different locations established material-specific biofilm communities [34] for the case of an RO-treated drinking water network.
4.2. Role of Assimilable Organic Carbon and Microenvironments
Although RO-treated tap water carries only ~10 µg C/L of assimilable organic carbon (AOC) [13], i.e., organic carbon that can be utilized by microorganisms, we hypothesize that the growth of biofilm in the shower plumbing materials used in this study could be due to the following factors: First, biochemical hydrolysis of dissolved organic carbon into an assimilable fraction that fuels the microbial growth due to heating and mixing of hot and cold water during showering [35]. Second, lysis from drinking water microflora itself [35], resulting in the accumulation of organic matter and biofilm [36]. Additionally, low-flow or intermittent usage conditions promote biofilm formation because shear stress is zero and residual disinfectant is dissipated [37]. The persistence of biofilm in the hose could be caused by the activation of bacterial tolerance mechanisms into viable but non-culturable (VBNC) cells [38]. This is a fact since heterotrophic plate count results were constantly under the detection limit (<1 CFU/mL) in a previous study of the same RO network while flow cytometry detected higher bacterial cell counts [20].
Lastly, migration of AOC from material’s surfaces. However, our BGP assays (Supplementary Figure S4 and Table S2) revealed that hose leachate did not significantly elevate cell yields above control RO water (p = 0.08), indicating minimal carbon migration from this material. Thus, biofilm development in our system appears driven more by surface-generated AOC and endogenous recycling than by bulk leachate. That means the low AOC is not the only driving mechanism explaining the bacterial regrowth in ultra-pure-quality RO-treated tap water, as supported by findings from William et al. [39], where they found that reducing organic carbon in distributed water is not adequate as a sole strategy for controlling bacterial plate colony counts and gene copies of selected model opportunistic pathogens. AOC levels in a given distribution system could be a function of the balance between two factors: organic matter oxidation by chlorine and consumption of bacterial activity [40,41]. There is no straightforward correlation between AOC and microbial growth, especially biofilm, so far because its likelihood is probably reduced in real-world premise plumbing systems comprised of various materials preceding the shower hose system, resulting in complex microbial ecology [39].
4.3. Biofilm Core Taxa
Across both hose and filter biofilms, three genera—Porphyrobacter, Blastomonas, and Pelomonas—dominated and made up the three most abundant OTUs. Porphyrobacter (Erythrobacteraceae) can modulate its own DNA replication and sacrifice cells to release nutrients under starvation and thrives in thermal niches [42,43], explaining its persistence in shower hoses experiencing daily heating/cooling cycles. Blastomonas (Sphingomonadaceae) is a known pioneer biofilm former, often aggregating on plastic surfaces [44,45,46]. Pelomonas (Comamonadaceae) has been isolated from sand filters of drinking water treatment plants, possessing ability to degrade organic compounds under oligotrophic conditions [47] and is frequently observed in drinking water systems, and it has been linked to the formation of O-methylated (i.e., an emerging contaminant in drinking water that can cause taste and odor issue) pollutants in treatment plants [48]. Its presence has also been reported in Intensive Care Unit (ICU) drinking water systems in Saudi Arabia [49]. Their persistence underscores a functional guild (different taxa that thrive together with similar functioning [50]) adapted to low-nutrient, chlorinated plumbing environments.
4.4. Limitations and Future Directions
The near-zero overlap of OTUs between water and biofilms (Figure 3) underscores limited seeding from the planktonic phase or rapid surface-driven selection once disinfectant residuals drop [51]. However, it should be noted that there is only one water sample from inlet and outlet water that could affect the shared OTUs between biofilm and water samples which could influence the uncertainty in the contribution of each sample type to the core OTUs. The depth of sequencing may also affect the detection of low-abundance OTUs. Nevertheless, the high degree of stability of RO-treated water seeding the shower system plus the presence of residual chlorine limit the bacterial number and composition of the biofilm community detected in our samples. Additionally, since the shower materials were fed with chlorinated RO-treated tap water, low biomass and consequently low DNA yield are expected. Multiple controls/blanks as well as increasing sample number may allow us to conclusively profile the microbial community in this particular low-biomass environment/sample. The choices of DNA extraction method and kit may also affect the resulting community [52]. The protocol must be documented and encourage consistency to allow future cross-comparison studies. The true seasonal effect cannot be evaluated since we observed a high degree of biostability of RO-treated tap water seeding the biofilm community based on flow cytometer fingerprints in our preliminary study (Supplementary Figure S6), and it reflected in the biofilm measures (i.e., biofilm TCC/ICC, and microbial community composition). Further research could test the impact of other nutrient limitations such as nitrogen and/or phosphate and how they influence the bacterial growth in the water as well as biofilm fraction, in addition to the carbon leachates from the shower that could elucidate the cause of biofilm growth.
Choosing the right pipe material is a factor for better management of biofilm development in DWDS [19]. Compared to iron pipes (ductile cast iron, gray cast iron), plastic materials like PE, and PVC commonly used in shower hoses and faucet connections often leach biodegradable organic carbon [32]. This leaching can negate carbon reduction efforts in water treatment, leading to biologically unstable water and increased planktonic and biofilm concentration [32,53]. Our growth experiment (Supplementary Figure S4 and Supplementary Table S2), however, revealed that migration of AOC from the hose material was minimal; the bacterial cell yield from the shower hose leachate was comparable to that of the untreated RO tap water (post hoc Tukey HSD, p = 0.08), thus indicating that the shower hose used in this study is a good material to use. Since the (re)growth of biofilm even when supplied with high-degree, biostable RO-treated water is unavoidable, designing materials to leach carbon that selects for a desirable ‘benign’ bacterial community is a potential concept for future shower hoses. It should be noted that beyond material choice, the water operator to the user’s end should, i.e., maintain a disinfection residual, limit inorganic nutrients (such as metals and phosphate), and conduct regular flushing [54,55]. Ultimately, safeguarding high-quality RO-treated water in premise plumbing will demand an integrated approach, managing both the chemistry (nutrient levels, materials) and the biology (biofilm dynamics) in tandem.
5. Conclusions
We performed a controlled field study deploying commercial shower systems in households supplied with reverse-osmosis (RO)-treated tap water from a full-scale seawater desalination plant and characterized biofilms that formed on two plumbing materials—a flexible polymer hose and a showerhead containing an inline polyethersulfone filter—over 3–17 months. Flow cytometry, ATP/TCC measurements, and 16S rRNA gene sequencing collectively revealed that the RO network maintains very low planktonic and biofilm cell densities and correspondingly low microbial diversity. Despite this ultra-low biomass starting point, distinct and stable biofilm communities still developed, and their structure was governed primarily by the underlying material. The shower hose supported higher OTU richness and greater evenness than the showerhead inline filter, while both surfaces shared a small set of core taxa, i.e., most abundantly Blastomonas, Pelomonas, and Porphyrobacter, indicating that these taxa dominate biofilms on both hose and filter under chlorinated, oligotrophic conditions. Minimal shared OTUs between biofilms and bulk water indicate that local microenvironments—surface chemistry, roughness, and hydrodynamics—rather than uniform seeding from inlet water, drive community heterogeneity. Nutrient assays further showed that carbon limitation persists, with negligible organic-carbon leaching from the hose, keeping bacterial growth potential at levels comparable to RO water with no nutrient spiking. Collectively, these findings advance our understanding of how plumbing-material properties, nutrient scarcity, and local hydraulics interact to shape biofilm ecology in RO-treated building networks and provide a scientific basis for designing mitigation strategies that limit opportunistic pathogen proliferation in domestic showers.
Supplementary Materials
The following supporting information can be downloaded at: https://www.mdpi.com/article/10.3390/w17131870/s1. Supplementary Figure S1. Map of shower installations across the KAUST distribution network. Supplementary Figure S2. Total and Intact Cell Counts in Shower Hose Biofilms. Supplementary Figure S3. TCC and ICC in Shower Outlet Water. Supplementary Figure S4. Bacterial Growth Potential (BGP) in RO Tap Water Under Various Treatments. Supplementary Figure S5. SEM and EDX Characterization of PES Hollow-Fiber Shower Filter. Supplementary Figure S6. Flow cytometric fingerprint (total bacterial cell concentration versus high nucleic acid cells percentage) of a premised tap in KAUST reverse osmosis drinking water network. Supplementary Table S1. Shower outlet water quality parameters at different sampling times. Supplementary Table S2. Pairwise comparisons of bacterial growth potential treatments.
Author Contributions
Conceptualization, R.E.P. and N.F.; methodology, R.E.P. and N.F.; validation, N.F.; formal analysis, R.E.P.; investigation, R.E.P. and N.F.; writing—original draft preparation, R.E.P.; writing—review and editing, N.F. and J.V.; visualization, R.E.P.; supervision, N.F.; funding acquisition, J.V. All authors have read and agreed to the published version of the manuscript.
Funding
This research received no external funding.
Data Availability Statement
All results are available within this article and Supplementary Material; further inquiries can be directed to the corresponding authors. All Nanopore sequencing data used in this study have been uploaded to the NCBI Sequence Read Archive (SRA) numbers under the BioProject number: PRJNA1277179.
Acknowledgments
During the preparation of this manuscript, ChatGPT-o4 was used to help refine the R code for data visualization and statistical analysis. The authors have reviewed and edited the output and take full responsibility for the content of this publication.
Conflicts of Interest
The authors declare no conflicts of interest. The funders had no role in the design of the study; in the collection, analyses, or interpretation of data; in the writing of the manuscript; or in the decision to publish the results.
References
- Borella, P.; Montagna Maria, T.; Stampi, S.; Stancanelli, G.; Romano-Spica, V.; Triassi, M.; Marchesi, I.; Bargellini, A.; Tatò, D.; Napoli, C.; et al. Legionella Contamination in Hot Water of Italian Hotels. Appl. Environ. Microbiol. 2005, 71, 5805–5813. [Google Scholar] [CrossRef] [PubMed]
- Falkinham, J.O. Living with Legionella and Other Waterborne Pathogens. Microorganisms 2020, 8, 2026. [Google Scholar] [CrossRef]
- Choi, J.Y.; Sim, B.R.; Park, Y.; Yong, S.H.; Shin, S.J.; Kang, Y.A. Identification of nontuberculous mycobacteria isolated from household showerheads of patients with nontuberculous mycobacteria. Sci. Rep. 2022, 12, 8648. [Google Scholar] [CrossRef]
- Soto-Giron Maria, J.; Rodriguez, R.L.M.; Luo, C.; Elk, M.; Ryu, H.; Hoelle, J.; Santo Domingo Jorge, W.; Konstantinidis Konstantinos, T. Biofilms on Hospital Shower Hoses: Characterization and Implications for Nosocomial Infections. Appl. Environ. Microbiol. 2016, 82, 2872–2883. [Google Scholar] [CrossRef]
- Gebert, M.J.; Delgado-Baquerizo, M.; Oliverio, A.M.; Webster, T.M.; Nichols, L.M.; Honda, J.R.; Chan, E.D.; Adjemian, J.; Dunn, R.R.; Fierer, N. Ecological Analyses of Mycobacteria in Showerhead Biofilms and Their Relevance to Human Health. mBio 2018, 9, e01614-18. [Google Scholar] [CrossRef] [PubMed]
- Falkinham, J.O.; Pruden, A.; Edwards, M. Opportunistic Premise Plumbing Pathogens: Increasingly Important Pathogens in Drinking Water. Pathogens 2015, 4, 373–386. [Google Scholar] [CrossRef] [PubMed]
- Learbuch, K.L.G.; Smidt, H.; van der Wielen, P.W.J.J. Influence of pipe materials on the microbial community in unchlorinated drinking water and biofilm. Water Res. 2021, 194, 116922. [Google Scholar] [CrossRef]
- Goraj, W.; Pytlak, A.; Kowalska, B.; Kowalski, D.; Grządziel, J.; Szafranek-Nakonieczna, A.; Gałązka, A.; Stępniewska, Z.; Stępniewski, W. Influence of pipe material on biofilm microbial communities found in drinking water supply system. Environ. Res. 2021, 196, 110433. [Google Scholar] [CrossRef]
- Ren, H.; Wang, W.; Liu, Y.; Liu, S.; Lou, L.; Cheng, D.; He, X.; Zhou, X.; Qiu, S.; Fu, L.; et al. Pyrosequencing analysis of bacterial communities in biofilms from different pipe materials in a city drinking water distribution system of East China. Appl. Microbiol. Biotechnol. 2015, 99, 10713–10724. [Google Scholar] [CrossRef]
- Zhao, Z.; Zhang, Y.; Wang, L.; Shi, W. Effect of Particle Concentration and Pipe Materials on the Formation of Biofilms in Drinking Water Distribution Systems. Water 2022, 14, 224. [Google Scholar] [CrossRef]
- Shan, L.; Xu, S.; Pei, Y.; Zhu, Z.; Xu, L.; Liu, X.; Yuan, Y. Effect of domestic pipe materials on microbiological safety of drinking water: Different biofilm formation and chlorination resistance for diverse pipe materials. Process Biochem. 2023, 129, 11–21. [Google Scholar] [CrossRef]
- Siponen, S.; Ikonen, J.; Gomez-Alvarez, V.; Hokajärvi, A.-M.; Ruokolainen, M.; Jayaprakash, B.; Kolehmainen, M.; Miettinen, I.T.; Pitkänen, T.; Torvinen, E. Effect of pipe material and disinfectant on active bacterial communities in drinking water and biofilms. J. Appl. Microbiol. 2025, 136, lxaf004. [Google Scholar] [CrossRef] [PubMed]
- Farhat, N.; Kim, L.; Mineta, K.; Alarawi, M.; Gojobori, T.; Saikaly, P.; Vrouwenvelder, J. Seawater desalination based drinking water: Microbial characterization during distribution with and without residual chlorine. Water Res. 2022, 210, 117975. [Google Scholar] [CrossRef] [PubMed]
- Feazel, L.M.; Baumgartner, L.K.; Peterson, K.L.; Frank, D.N.; Harris, J.K.; Pace, N.R. Opportunistic pathogens enriched in showerhead biofilms. Proc. Natl. Acad. Sci. USA 2009, 106, 16393–16398. [Google Scholar] [CrossRef]
- Proctor, C.R.; Reimann, M.; Vriens, B.; Hammes, F. Biofilms in shower hoses. Water Res. 2018, 131, 274–286. [Google Scholar] [CrossRef]
- Moat, J.; Rizoulis, A.; Fox, G.; Upton, M. Domestic shower hose biofilms contain fungal species capable of causing opportunistic infection. J. Water Health 2016, 14, 727–737. [Google Scholar] [CrossRef]
- Ke, Y.; Sun, W.; Chen, X.; Zhu, Y.; Guo, X.; Yan, W.; Xie, S. Seasonality Determines the Variations of Biofilm Microbiome and Antibiotic Resistome in a Pilot-Scale Chlorinated Drinking Water Distribution System Deciphered by Metagenome Assembly. Environ. Sci. Technol. 2023, 57, 11430–11441. [Google Scholar] [CrossRef]
- Douterelo, I.; Fish, K.E.; Boxall, J.B. Succession of bacterial and fungal communities within biofilms of a chlorinated drinking water distribution system. Water Res. 2018, 141, 74–85. [Google Scholar] [CrossRef]
- Liu, S.; Gunawan, C.; Barraud, N.; Rice, S.A.; Harry, E.J.; Amal, R. Understanding, Monitoring, and Controlling Biofilm Growth in Drinking Water Distribution Systems. Environ. Sci. Technol. 2016, 50, 8954–8976. [Google Scholar] [CrossRef]
- Farhat, N.; Kim, L.H.; Vrouwenvelder, J.S. Online characterization of bacterial processes in drinking water systems. npj Clean Water 2020, 3, 16. [Google Scholar] [CrossRef]
- Belila, A.; El-Chakhtoura, J.; Otaibi, N.; Muyzer, G.; Gonzalez-Gil, G.; Saikaly, P.E.; van Loosdrecht, M.C.M.; Vrouwenvelder, J.S. Bacterial community structure and variation in a full-scale seawater desalination plant for drinking water production. Water Res. 2016, 94, 62–72. [Google Scholar] [CrossRef] [PubMed]
- Farhat, N.; Hammes, F.; Prest, E.; Vrouwenvelder, J. A uniform bacterial growth potential assay for different water types. Water Res. 2018, 142, 227–235. [Google Scholar] [CrossRef]
- Prest, E.I.; Hammes, F.; Kotzsch, S.; van Loosdrecht, M.C.; Vrouwenvelder, J.S. Monitoring microbiological changes in drinking water systems using a fast and reproducible flow cytometric method. Water Res. 2013, 47, 7131–7142. [Google Scholar] [CrossRef]
- Putri, R.E.; Vrouwenvelder, J.S.; Farhat, N. Enhancing the DNA yield intended for microbial sequencing from a low-biomass chlorinated drinking water. Front. Microbiol. 2024, 15, 1339844. [Google Scholar] [CrossRef] [PubMed]
- McMurdie, P.J.; Holmes, S. phyloseq: An R package for reproducible interactive analysis and graphics of microbiome census data. PLoS ONE 2013, 8, e61217. [Google Scholar] [CrossRef] [PubMed]
- Xia, Y. Chapter Eleven—Correlation and association analyses in microbiome study integrating multiomics in health and disease. In Progress in Molecular Biology and Translational Science; Sun, J., Ed.; Academic Press: Cambridge, MA, USA, 2020; Volume 171, pp. 309–491. [Google Scholar]
- Oksanen, J.; Kindt, R.; Legendre, P.; O’Hara, B.; Stevens, M.H.H.; Oksanen, M.J.; Suggests, M. The vegan package. Community Ecol. Package 2007, 10, 719. [Google Scholar]
- Mangiafico, S.S. An R Companion for the Handbook of Biological Statistics; Rutgers Cooperative Extension: New Brunswick, NJ, USA, 2015. [Google Scholar]
- Martiny Adam, C.; Albrechtsen, H.-J.; Arvin, E.; Molin, S. Identification of Bacteria in Biofilm and Bulk Water Samples from a Nonchlorinated Model Drinking Water Distribution System: Detection of a Large Nitrite-Oxidizing Population Associated with Nitrospira spp. Appl. Environ. Microbiol. 2005, 71, 8611–8617. [Google Scholar] [CrossRef]
- Henne, K.; Kahlisch, L.; Brettar, I.; Hofle, M.G. Analysis of structure and composition of bacterial core communities in mature drinking water biofilms and bulk water of a citywide network in Germany. Appl. Environ. Microbiol. 2012, 78, 3530–3538. [Google Scholar] [CrossRef]
- Liu, G.; Bakker, G.L.; Li, S.; Vreeburg, J.H.; Verberk, J.Q.; Medema, G.J.; Liu, W.T.; Van Dijk, J.C. Pyrosequencing reveals bacterial communities in unchlorinated drinking water distribution system: An integral study of bulk water, suspended solids, loose deposits, and pipe wall biofilm. Environ. Sci. Technol. 2014, 48, 5467–5476. [Google Scholar] [CrossRef]
- Proctor, C.R.; Gächter, M.; Kötzsch, S.; Rölli, F.; Sigrist, R.; Walser, J.C.; Hammes, F. Biofilms in shower hoses—Choice of pipe material influences bacterial growth and communities. Environ. Sci. Water Res. Technol. 2016, 2, 670–682. [Google Scholar] [CrossRef]
- Bertelli, C.; Courtois, S.; Rosikiewicz, M.; Piriou, P.; Aeby, S.; Robert, S.; Loret, J.F.; Greub, G. Reduced Chlorine in Drinking Water Distribution Systems Impacts Bacterial Biodiversity in Biofilms. Front. Microbiol. 2018, 9, 2520. [Google Scholar] [CrossRef] [PubMed]
- Neu, L.; Hammes, F. Feeding the Building Plumbing Microbiome: The Importance of Synthetic Polymeric Materials for Biofilm Formation and Management. Water 2020, 12, 1774. [Google Scholar] [CrossRef]
- Egli, T.; Campostrini, L.; Leifels, M.; Füchslin, H.P.; Kolm, C.; Dan, C.; Zimmermann, S.; Hauss, V.; Guiller, A.; Grasso, L.; et al. Domestic hot-water boilers harbour active thermophilic bacterial communities distinctly different from those in the cold-water supply. Water Res. 2024, 253, 121109. [Google Scholar] [CrossRef]
- Cazals, M.; Bédard, E.; Guerra Maldonado, J.F.; Prévost, M. What happens in your water system? Impact of materials, temperature, stagnation and chlorination on water quality and biofilm formation. Chemosphere 2025, 376, 144248. [Google Scholar] [CrossRef] [PubMed]
- Bedard, E.; Laferriere, C.; Deziel, E.; Prevost, M. Impact of stagnation and sampling volume on water microbial quality monitoring in large buildings. PLoS ONE 2018, 13, e0199429. [Google Scholar] [CrossRef]
- Nisar, M.A.; Ross, K.E.; Brown, M.H.; Bentham, R.; Whiley, H. Water Stagnation and Flow Obstruction Reduces the Quality of Potable Water and Increases the Risk of Legionelloses. Front. Environ. Sci. 2020, 8, 611611. [Google Scholar] [CrossRef]
- Williams, K.; Pruden, A.; Falkinham, J.; Edwards, M. Relationship Between Organic Carbon and Opportunistic Pathogens in Simulated Glass Water Heaters. Pathogens 2015, 4, 355–372. [Google Scholar] [CrossRef]
- Liu, W.; Wu, H.; Wang, Z.; Ong, S.L.; Hu, J.Y.; Ng, W.J. Investigation of assimilable organic carbon (AOC) and bacterial regrowth in drinking water distribution system. Water Res. 2002, 36, 891–898. [Google Scholar] [CrossRef]
- Zlatanović, L.; van der Hoek, J.P.; Vreeburg, J.H.G. An experimental study on the influence of water stagnation and temperature change on water quality in a full-scale domestic drinking water system. Water Res. 2017, 123, 761–772. [Google Scholar] [CrossRef]
- Tinguely, C.; Paulméry, M.; Terrettaz, C.; Gonzalez, D. Diurnal cycles drive rhythmic physiology and promote survival in facultative phototrophic bacteria. ISME Commun. 2023, 3, 125. [Google Scholar] [CrossRef]
- Xu, L.; Wu, Y.-H.; Zhou, P.; Cheng, H.; Liu, Q.; Xu, X.-W. Investigation of the thermophilic mechanism in the genus Porphyrobacter by comparative genomic analysis. BMC Genom. 2018, 19, 385. [Google Scholar] [CrossRef] [PubMed]
- Vaz-Moreira, I.; Nunes, O.C.; Manaia, C.M. Ubiquitous and persistent Proteobacteria and other Gram-negative bacteria in drinking water. Sci. Total Environ. 2017, 586, 1141–1149. [Google Scholar] [CrossRef] [PubMed]
- Sala-Comorera, L.; Caudet-Segarra, L.; Galofré, B.; Lucena, F.; Blanch, A.R.; García-Aljaro, C. Unravelling the composition of tap and mineral water microbiota: Divergences between next-generation sequencing techniques and culture-based methods. Int. J. Food Microbiol. 2020, 334, 108850. [Google Scholar] [CrossRef]
- Liu, R.; Yu, Z.; Guo, H.; Liu, M.; Zhang, H.; Yang, M. Pyrosequencing analysis of eukaryotic and bacterial communities in faucet biofilms. Sci. Total Environ. 2012, 435–436, 124–131. [Google Scholar] [CrossRef] [PubMed]
- Vandermaesen, J.; Lievens, B.; Springael, D. Isolation and identification of culturable bacteria, capable of heterotrophic growth, from rapid sand filters of drinking water treatment plants. Res. Microbiol. 2017, 168, 594–607. [Google Scholar] [CrossRef]
- Tang, Y.; Wu, Z.; Zhang, Y.; Wang, C.; Ma, X.; Zhang, K.; Pan, R.; Cao, Y.; Zhou, X. Cultivation-dependent and cultivation-independent investigation of O-methylated pollutant-producing bacteria in three drinking water treatment plants. Water Res. 2023, 231, 119618. [Google Scholar] [CrossRef]
- Farhat, M.; Alkharsah, K.R.; Alkhamis, F.I.; Bukharie, H.A. Metagenomic study on the composition of culturable and non-culturable bacteria in tap water and biofilms at intensive care units. J. Water Health 2018, 17, 72–83. [Google Scholar] [CrossRef]
- Banerjee, S.; Schlaeppi, K.; van der Heijden, M.G.A. Keystone taxa as drivers of microbiome structure and functioning. Nat. Rev. Microbiol. 2018, 16, 567–576. [Google Scholar] [CrossRef]
- Waegenaar, F.; García-Timermans, C.; Van Landuyt, J.; De Gusseme, B.; Boon, N. Impact of operational conditions on drinking water biofilm dynamics and coliform invasion potential. Appl. Environ. Microbiol. 2024, 90, e00042-24. [Google Scholar] [CrossRef]
- Brandt, J.; Albertsen, M. Investigation of Detection Limits and the Influence of DNA Extraction and Primer Choice on the Observed Microbial Communities in Drinking Water Samples Using 16S rRNA Gene Amplicon Sequencing. Front. Microbiol. 2018, 9, 2140. [Google Scholar] [CrossRef]
- Proctor, C.R.; Dai, D.; Edwards, M.A.; Pruden, A. Interactive effects of temperature, organic carbon, and pipe material on microbiota composition and Legionella pneumophila in hot water plumbing systems. Microbiome 2017, 5, 130. [Google Scholar] [CrossRef] [PubMed]
- Douterelo, I.; Husband, S.; Loza, V.; Boxall, J. Dynamics of Biofilm Regrowth in Drinking Water Distribution Systems. Appl. Environ. Microbiol. 2016, 82, 4155–4168. [Google Scholar] [CrossRef] [PubMed]
- Fish, K.E.; Boxall, J.B. Biofilm Microbiome (Re)Growth Dynamics in Drinking Water Distribution Systems Are Impacted by Chlorine Concentration. Front. Microbiol. 2018, 9, 2519. [Google Scholar] [CrossRef] [PubMed]
Disclaimer/Publisher’s Note: The statements, opinions and data contained in all publications are solely those of the individual author(s) and contributor(s) and not of MDPI and/or the editor(s). MDPI and/or the editor(s) disclaim responsibility for any injury to people or property resulting from any ideas, methods, instructions or products referred to in the content. |
© 2025 by the authors. Licensee MDPI, Basel, Switzerland. This article is an open access article distributed under the terms and conditions of the Creative Commons Attribution (CC BY) license (https://creativecommons.org/licenses/by/4.0/).