Abstract
The impacts of backwater due to large dam construction on flow may lead to navigation or flood control problems in curved rivers. This study conducted flume experiments to investigate the effects of backwater on the velocity distribution characteristics of a 90-degree bend. The experimental results show that the backwater degree (η, defined as the ratio of flow depth under backwater to that under non-backwater conditions) has significant impacts on the three-dimensional velocity distribution in the bend. The depth-averaged velocities decrease with increasing backwater degree, and the deflection degrees of depth-averaged velocities are found to be highly related to the backwater degree and cross-sectional position. In this experimental setup, the mean cross-sectional velocity decreases by 67.2% as η increases from 1.00 to 3.64 for Q = 35 L/s; 63.7% as η increases from 1.00 to 3.26 for Q = 52 L/s; and 60.1% as η increases from 1.00 to 2.80 for Q = 52 L/s. The maximum values of transversal and vertical velocities near the riverbed gradually shift to the inner bank as the backwater degree increases at the 45° cross section. The center of the high transversal velocity area shifts about 0.1 m toward the inner bank as the backwater degree increases from 1.00 to 3.26 for Q = 52 L/s, which can reduce the erosion of the riverbed near the outer bank. In the current study, we also demonstrate that the growth and decay processes of secondary flow cells under backwater conditions are similar to those under non-backwater conditions. However, the scales and positions of the secondary flow cells change continuously with different backwater degrees. From the entrance to the exit of the bend, the secondary flow intensity first increases, and then decreases, with its maximum values occurring at the 45° cross section. The findings detailed in this manuscript provide insights for navigation channel design in reservoir backwater zones.
1. Introduction
Curved channels are typical and widespread elements in natural rivers. The flow patterns and structures in channel bends play vital roles in navigation safety and flood control. The centrifugal effect of open channel bends induces significant changes in hydraulic characteristics and geomorphic patterns, manifesting in the transversal slope of the water’s surface, as well as in the redistribution of velocities, secondary flows, deposition and erosion of the riverbed, etc. [1,2,3]. Studying these changes, especially the flow velocity and water depth, is significant in the context of hydraulic and environmental engineering (e.g., channel training, ship navigation, floodplain development, and ecological restoration).
In recent decades, bend flow characteristics have been extensively studied. Akbari and Vaghefi [4] and Vaghefi et al. [5] experimentally studied streamlines, velocity distributions, secondary flows, and bed shear stress distributions in curved channels. Kashyap et al. [6] numerically and experimentally assessed the influences of curvature ratio (i.e., rc/B, where rc is the central curvature radius, and B is the river width) and aspect ratio (i.e., B/h, where h is the water depth) on flow patterns in a 135° bend. Li et al. [7] investigated the effects of the central angle of a channel bend (i.e., θ) on flow behaviors, indicating that the maximum transversal slope and secondary flow intensity increase with the central angle. Experiments and simulations were conducted by Zeng et al. [8] for a sharp bend, in order to reveal the nonlinear coupling mechanisms that exist between the longitudinal velocity and transversal circulation. Raeisifar et al. [9] and Rismani et al. [10] investigated the effects of bending and vegetation on open channel flow, finding that the influence of the centrifugal effect on the bending flow patterns decreases with increasing plant density, further enhancing turbulent kinetic energy. In curved channels, the generation of secondary flows principally stems from the dynamic equilibrium between the transversal pressure gradient and the centrifugal effect [3,11,12,13]. Although the velocities of secondary circulation are relatively smaller than the streamwise velocities, their momentum exchange with streamwise components significantly modulates bed shear stress distribution patterns, further governing morphological evolution in channel bends [2,14,15,16,17,18]. Previous studies have identified the following dual circulation structures: a dominant central cell, accompanied by a counter-rotating outer bank cell (typically weaker in intensity). Blanckaert and De Vriend [14] hypothesized that the secondary circulation effect is generated by synergy between the centrifugal effect (skewing-induced) and anisotropy turbulence characteristics (skewing-induced), which is important for bank erosion dynamics.
Dam construction has proliferated worldwide in recent decades [19,20], fundamentally altering hydrological regimes through upstream impoundment effects. Anthropogenic modification through dams generates hydraulic backwater zones, which induce substantial sediment trapping and changes in the natural flow regimes of reservoir channels [21,22,23]. Dams can cause the subcritical flow regimes in upstream reservoirs, especially in mountainous rivers. In these types of rivers, the flow is normally nearly critical (or even supercritical), often linked to steep slopes or flow discharge with intense floods [24,25]. In addition, supercritical flows with high Froude numbers may also cause abundant sediment transport and scouring processes [26,27]. In backwater zones, the flow may be in subcritical, critical, or supercritical regimes, which is determined by the operation of the downstream reservoir. Under these conditions, the curved channels of the upstream reservoir may show more complex flow patterns, leading to navigation or engineering issues. A critical motivation for this study was the Dajiantan bend (which approaches 90°) in the Three Gorges Reservoir (TGR)’s backwater zone, China, where complex hydrodynamic characteristics induce unpredictable velocity redistribution and secondary currents, causing 12 navigation issues between 2011 and 2017 [28]. This case exemplifies the global challenge of managing sharp bends in reservoir backwater zones. Although the effects of backwater on the hydrodynamics of straight channels have been extensively investigated [29,30,31,32,33], few studies have been concerned with the backwater-induced hydrodynamic modifications in meandering channel systems. Liro et al. [22,23] simulated the flood flow of the mountainous Dunajec River, upstream from the Czorsztyn Reservoir, and found that the backwater may modify the hydrodynamics—especially reducing flow velocity and triggering channel widening and bed aggradation. Nie et al. [28] conducted experiments to study the influence of backwater on the water surface profile in a sharp bend, finding that the transversal slope decreases with increasing backwater degree. In addition, the regulation of reservoir water levels has caused a complex phosphorus migration and release process in the backwater zone of the TGR, which also poses significant challenges to effective pollution management strategies [33].
Obviously, previous studies on bend flows have largely neglected the unsteady backwater effect in reservoir fluctuation zones, limiting practical insights for navigation and sediment management. In this study, we conducted a series of experiments to investigate the effects of backwater on the flow characteristics of a 90-degree bend. The flow velocity was measured using an Acoustic Doppler Velocimeter (ADV), and the velocity distribution characteristics under different backwater degrees were compared. Our intent was to address a research gap by quantifying how the backwater degree alters the velocity distribution and secondary flow dynamics in a sharp bend.
2. Methods
2.1. Experimental Setup
Experiments were conducted in a glass-walled recirculating flume (19.4 m × 0.6 m × 0.8 m) with a 0.005 bed slope (the same flume geometry used by Nie et al. [28]), as shown in Figure 1. Its geometry featured a 10.5 m upstream straight reach, a 2.4 m long 90° curved bend along the flume central axis, and a 6.5 m long downstream straight reach. The internal curvature radius (ri), central curvature radius (rc), and external curvature radius (re) were 1.2 m, 1.5 m, and 1.8 m, respectively. According to Leschziner and Rodi [34] and Rozovskii [35], this bend is considered a sharp bend (rc/B = 2.5 < 3).
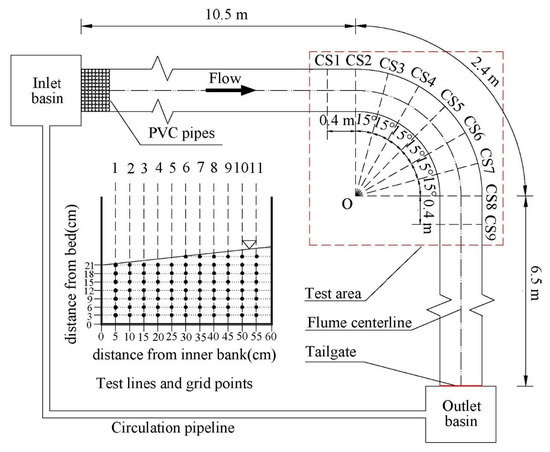
Figure 1.
Sketches of flume, measurement cross sections, test lines, and grid points.
In this study, we applied the following three flow discharges: Q = 35 L/s, Q = 52 L/s, and Q = 80 L/s. For each discharge, numerous test groups were established. The test for one group was conducted under non-backwater conditions, while those for the other groups were conducted under backwater conditions with different backwater depths. Table 1 summarizes the hydraulic conditions of all experiments, where Q is the flow discharge; Vd is the mean cross-sectional velocity in the downstream straight reach; hd is the mean cross-sectional flow depth in the downstream straight reach; hd0 is the mean cross-sectional flow depth under non-backwater conditions in the downstream straight reach; B/hd is the ratio of the flume width to the mean cross-sectional flow depth in the downstream straight reach; Re is the Reynolds number; Fr is the Froude number; and η is the backwater parameter, which is defined as hd/hd0.

Table 1.
Summary of experimental conditions.
In experiments, the non-backwater conditions were supercritical and all the Froude number Fr > 1. The backwater conditions were subcritical and all the Froude numbers Fr < 1. Under backwater conditions, the backwater can influence the flow pattern from the outlet to the inlet of the flume; that is, the whole flume is in the backwater zone, and there is also no hydraulic jump occurring in the flume during experiments. The current study was conducted to assess the effects of the backwater degree on the bend flow characteristics, regardless of the influence of the backwater curve.
2.2. Data Collection and Process
The upstream water supply was controlled with a water pump. A rectangular weir, positioned before the flume inlet, quantified the flow discharge. A tailgate at the outlet of the flume controlled the backwater depth. The water level was measured precisely, using a point gauge with ±1 mm accuracy. Three-dimensional velocities were measured in the test area (the red square in Figure 1) using a Nortek Vectrino Profiler.
In experiments, 9 cross sections were emphasized for velocity and water depth measurement, 0.4 m before and after the bend, with central angles of 0°, 15°, 30°, 45°, 60°, 75°, and 90° within the bend (CS1–CS9, in Figure 1). Particularly, the 0°, 45°, and 90° cross sections (i.e., CS2, CS5, and CS8) were the entrance, apex, and exit of the bend, respectively. Each cross section had 11 test lines, with transversal spaces of 0.05 m between adjacent test lines (1–11, in Figure 1). The vertical spaces between test points for velocity measurement were 0.03 m. Due to the differences in backwater depths, the lines featured different test point numbers in the vertical direction. The test points of the inner and outer banks were also different, due to the water surface transversal slope.
The Vectrino Profiler was manufactured by Nortek AS in Norway for three-dimensional velocity measurement. This instrument captures velocity profiles across 30 vertically aligned cells only 1 mm in height, enabling high-resolution boundary layer characterization over a 30 mm range. Its down-looking probe recorded velocities at 40 mm from the sensor tip across subsurface layers, and near-surface measurements employed linear extrapolation. The velocity measurements ranged from 0 m/s to 3 m/s, and the accuracy was ±1% of the measured value ±0.001 m/s. According to the analyses of the previous experimental results, the Vectrino Profiler sampling frequency was set to 100 Hz, and the measurement of each point on the defined mesh required 30 s to record the data [36,37]. The data, collected as various time series, were recorded and transferred using the Vectrino Software. Post-processing was also performed to remove average velocities with low correlation (<70%) and low signal-to-noise ratio (<10) [6]. All velocity data after processing appeared to be accurate when considering a rigid bed (without sediment–flow interaction) and ignoring free-surface turbulence and scale effects due to rc/B = 2.5 (smaller than typical natural bend).
The longitudinal depth-averaged velocity ud, transversal depth-averaged velocity vd, vertical depth-averaged velocity wd, depth-averaged velocity up, and mean cross-sectional velocity V were calculated using Equations (1) to (5), respectively.
where u, v, and w are velocity components at a given point along the longitudinal, transversal, and vertical directions, respectively; and y and z are the transversal and vertical location coordinates, respectively.
In previous studies [5,38,39], the ratio of the mean lateral kinetic energy Klateral to the total kinetic energy Kmain of the per unit weight fluid was used to quantitatively describe the secondary flow intensity Sxy at cross sections, as follows:
where Sxy is the secondary flow intensity at each cross section; Klateral and Kmain are the mean lateral and total kinetic energy of per unit weight fluid, respectively; and g is the acceleration of gravity.
3. Results
3.1. Depth-Averaged Velocity Distributions
To assess depth-averaged velocity distributions, we assessed the evolution of depth-averaged velocities, flow deflection angle (defined as the angular deviation between the depth-averaged velocity and the cross-sectional normal line, which quantifies the relative deflection degree of the depth-averaged velocity), and flow dynamic axes (defined as the locus of maximum depth-averaged velocities across all cross sections, which describes the primary flow trajectory along the bend) along the bend under varying backwater conditions.
As shown in Figure 2, in the upstream straight reach, velocity profiles exhibited near uniformity. Once backwater enters the bend, inertial forces drive a distinct retribution as follows: velocities increase near the inner bank, while they decrease near the outer bank until the 45° cross section, after which the interaction of the transverse pressure gradient and secondary flow cells redirect the velocity toward the centerline of the channel, displacing it from the inner bank. In the downstream straight reach, high velocities localize near the outer bank. Furthermore, the increasing backwater degree amplifies flow depth, inducing a continuous decrease in depth-averaged velocities for all runs.
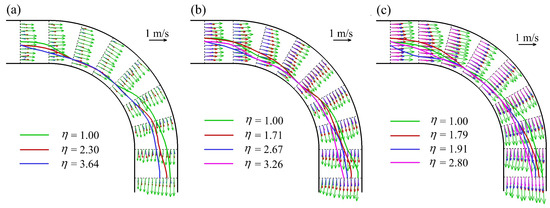
Figure 2.
Distributions of depth-averaged velocities and flow dynamic axes in the bend for (a) Q = 35 L/s, (b) Q = 52 L/s, and (c) Q = 80 L/s.
As shown in Figure 2, under non-backwater conditions (η = 1.00), the depth-averaged velocities before the 45° cross section were roughly inclined toward the outer bank, while those after the 45° cross section were roughly inclined toward the inner bank. Under backwater conditions (η > 1.00), the deflection degree in each cross section was smaller than that under non-backwater conditions, which is highly related to the magnitudes of the centrifugal effect, as that of the flow decreases with increasing backwater degree. As a result, the deflection degree becomes increasingly smaller with increasing backwater degree.
In addition, before the 45° cross section, the flow dynamic axis deflected toward the inner bank, due to the flow velocity’s increase near the inner bank and decrease near the outer bank (Figure 2), after which the main streamline began to shift gradually toward the middle of the flume after the 45° cross section. Owing to inertia, the main streamline inclined to the outer bank after exiting the bend, even if there was no effect from centrifugal force. For a given discharge, the deflection degree of the flow dynamic axis toward the outer bank downstream is dissimilar for different backwater degrees. The smaller the backwater degree, the closer the position of the flow dynamic axis is to the outer bank.
Meanwhile, the mean cross-sectional velocities were compared under backwater and non-backwater conditions. In continuous channel bends, the mean cross-sectional velocity exhibited a “W” shape along the bend [36]. The highest velocities were observed at the apex of the bend, whereas lower velocities occurred in other areas. For the 90° single bend, the mean cross-sectional velocities along the bend were significantly different from those in continuous bends. In Figure 3, the mean cross-sectional velocity forms a “—“ shape; in other words, the velocities show few differences along the bend for different backwater degrees. For a given discharge, the mean cross-sectional velocities decrease with increasing flow depth, caused by the increasing backwater degree at cross sections. For Q = 35 L/s, as the backwater degree increases from 1.00 to 3.64, the mean cross-sectional velocity decreases by 67.2%; for Q = 52 L/s, the mean cross-sectional velocity decreases by 63.7% as the backwater degree increases from 1.00 to 3.26; for Q = 80 L/s, the mean cross-sectional velocity decreases by 60.1% as the backwater degree increases from 1.00 to 2.80.
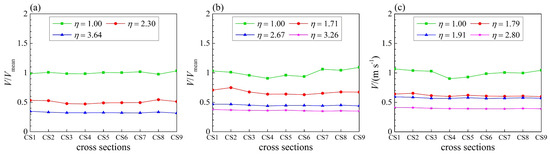
Figure 3.
Dimensionless cross-sectional velocity distributions for (a) Q = 35 L/s, (b) Q = 52 L/s, and (c) Q = 80 L/s. Vmean is average velocity over considered cross sections under non-backwater conditions.
Example plots of longitudinal velocity at different flow depths are shown in Figure 4, in order to explore the velocity distribution characteristics along the vertical line under different backwater degrees. Figure 4 shows that the longitudinal velocity does not present classical logarithmic velocity profiles, which is different from that in straight channel. For the apex of the bend, the velocities near the outer bank are more uniform than those near the inner bank, but with intense gradient changing. The flow depth increases, and the flow velocity decreases, with increasing backwater degree; in addition, the longitudinal flow velocity distribution along the vertical line becomes more uniform, and the flow velocity gradient also gradually decreases. Overall, the greater the degree of backwater, the more stable the water flow.
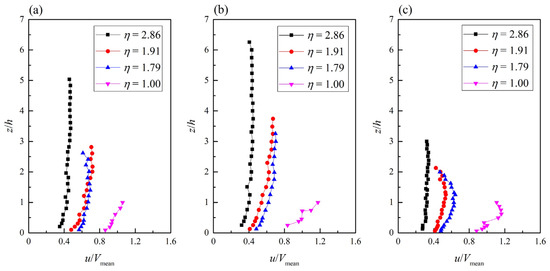
Figure 4.
Distribution of longitudinal dimensionless velocity along vertical lines of (a) 0.17B, (b) 0.50B, and (c) 0.83B at apex bend for Q = 80 L/s. The three vertical lines of 0.17B, 0.50B, and 0.83B were selected to represent values near the inner bank, centerline, and near the outer bank, respectively.
3.2. Transversal and Vertical Velocity Shifts
The special cross section CS5 was used as a representative to investigate the impacts of backwater on the transversal and vertical velocity distributions, as shown in Figure 5. For η = 1.00 (Figure 5a,d,h), the velocity distributions are not highly symmetrical, due to the water surface transversal slope. The region of high velocity is situated near the riverbed, and the low-velocity area occurs in the middle the flow. For each vertical test line, the (v2 + w2)0.5 values decrease initially, and increase subsequently, from the bed layer to the water surface. Secondary flow is the main reason for this phenomenon, and the lower velocity area occurs in the center of the circulation cells [4,12,13,14].
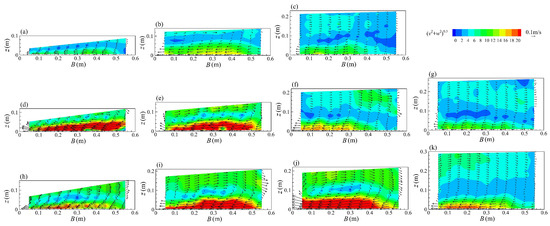
Figure 5.
Contours and vectors of transversal and vertical velocities at apex of the bend (CS5): (a) Q = 35 L/s, η = 1.00; (b) Q = 35 L/s, η = 2.30; (c) Q = 35 L/s, η = 3.64; (d) Q = 52 L/s, η = 1.00; (e) Q = 52 L/s, η = 1.71; (f) Q = 52 L/s, η = 2.67; (g) Q = 52 L/s, η = 3.26; (h) Q = 80 L/s, η = 1.00; (i) Q = 80 L/s, η = 1.79; (j) Q = 80 L/s, η = 1.91; and (k) Q = 80 L/s, η = 2.80. B = 0 m and B = 0.6 m represent inner and outer banks, respectively.
For each flow discharge, the backwater degree has significant influences on the transversal and vertical velocity distributions. The transversal and vertical velocities for η > 1.00 are lower than those for η = 1.00. Reductions in velocity occur due to the water depth rising with increasing backwater degree; as the backwater degree increases, the high-velocity area near bed tends toward the inner bank. As shown in Figure 5d–g (Q = 52 L/s), the center of the high transversal velocity area shifts about 0.1 m (y/B = 0.17) toward the inner bank as the backwater degree increases from 1.00 to 3.26.
3.3. Secondary Flow Cell Evolution
Figure 6 presents the development of the secondary flow cells at three cross sections (i.e., CS2, CS5, and CS8) for Q = 80 L/s. In CS2 (Figure 6a–d), there are one-way radial flows toward the inner bank, indicating immature vortex formation. In CS5 (Figure 6e–h), there are a large clockwise secondary flow cells at the center region, and a small, weakly anti-clockwise cell along the outer bank in the upper flow. In CS8 (Figure 6i–l), two secondary flow cells appear obviously. From the entrance to the exit, the dominant central cell gradually shifts to the inner bank and develops to the water’s surface, whereas the counter-rotating cell is always near the water’s surface in the outer bank. The central cells have an important influence on transversal sediment movement, and can cause a continuous scouring to the riverbed near the outer bank and deposition near the inner bank [2,14,18]. The existence of the outer bank cell may reduce the erosion of the central cell near the outer bank of the riverbed [12]; this is also the reason why the central cell moves toward the inner bank continuously.
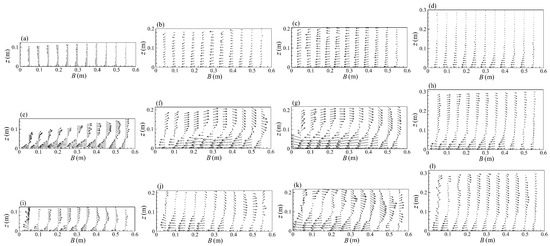
Figure 6.
Secondary flow cell distributions for Q = 80 L/s: (a) CS2, η = 1.00; (b) CS2, η = 1.79; (c) CS2, η = 1.91; (d) CS2, η = 2.80; (e) CS5, η = 1.00; (f) CS5, η = 1.79; (g) CS5, η = 1.91; (h) CS5, η = 2.80; (i) CS8, η = 1.00; (j) CS8, η = 1.79; (k) CS8, η = 1.91; and (l) CS8, η = 2.80. B = 0 m and B = 0.6 m represent inner and outer banks, respectively.
For different backwater degrees, the scales and positions of the central cells show some differences. For example, in CS5 (Figure 6e–h), the central cell gradually shifts to the inner bank with backwater degree increases. The effect of centrifugal force from the curved channel weakens as the velocity decreases, which causes the change in the central cell’s position. Specifically, the transversal locations of the central cell’s distance from the inner back are 0.32 m for η = 1.00, 0.3 m for η = 1.79, 0.25 m for η = 1.91, and 0.15 m for η = 2.80, despite which, toward the inner bank, secondary cells retain their dual-cell structure (clockwise center cell and counter-clockwise outer bank cell) for all η values, confirming the similarities of backwater to non-backwater flows. Moreover, the length scale of secondary flow cells increases with increasing backwater degree, which is highly related to the flow depth.
3.4. Secondary Flow Intensity Trends
Under the effects of backwater, although the length scale of the center region cell increases with increasing backwater degree, the dominant effect of the high flow depth and low velocity led to a decrease in the secondary flow intensity. The secondary flow intensities for different backwater degrees were calculated using Equation (6) and depicted in Figure 7. The figure shows that the secondary flow intensity for all backwater degrees first increases, and then decreases. Specifically, Sxy grows strongly until CS5, reaching its maximum value; thereafter, the secondary flow intensity subsequently decreases slightly until CS9. It is clear from Figure 7 that the increasing backwater degree is closely associated with the decreasing intensity of secondary flow at each cross section. At the apex bend, Sxy decreases from 0.11 to 0.09 as η increases from 1.00 to 3.64 for Q = 35 L/s, from 0.14 to 0.11 as η increases from 1.00 to 3.26 for Q = 52 L/s, and from 0.13 to 0.11 as η increases from 1.00 to 2.80 for Q = 80 L/s.
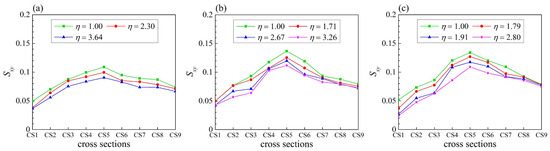
Figure 7.
Secondary flow intensity along the bend for (a) Q = 35 L/s, (b) Q = 52 L/s, and (c) Q = 80 L/s.
4. Discussion
Based on the experimental results, the backwater degree has significant impacts on three-dimensional velocity distributions in a 90-degree bend. Most previous studies were conducted based on laboratory experiments under quasi-uniform flow conditions or natural rivers closed to uniform flow [31], neglecting the backwater effects. The current study was conducted to extend the previous studies on bend flows with individual water depth. In the sharp bend, the combined effects of centrifugal acceleration and turbulence anisotropy explain the cell suppression at the outer bank under backwater conditions, which is consistent with the results of Zeng et al. [8]. In addition, the increasing backwater degree reduces centrifugal acceleration and amplifies pressure gradients. This imbalance causes the high velocity toward the inner bank (Figure 5), and the secondary flow intensity decreases (Figure 7), indicating that the bed shear stress decreases near the outer bank, potentially mitigating bank erosion [16].
The channel’s geometry (rc, B, h, etc.) has various influences on bend flow behaviors. The rc/B and B/h significantly affect the bend migration, secondary flow, bed shear stress, etc. [6,12,13]. In the current study, the flume width B = 0.6 m and different backwater depths were considered. For the secondary flow intensity, we first present the intensity increases, and then the decreases from the entrance to the exit of the bend, which is similar to that obtained by Abhari et al. [38] and Vaghefi et al. [5]. According to Abhari et al. [38], the secondary flow intensity increases with increasing Froude number. In the current study, the backwater degree decreases with increasing Froude number, corresponding to the larger secondary flow intensity. In addition, the position of the maximum secondary flow intensity is dissimilar. The maximum value occurred at about the 45° cross section under backwater conditions in the current study, where the secondary flow was most fully developed, reflecting the early saturation of curvature-induced turbulence in a sharp bend (rc/B = 2.5), which contrasts with milder bends (rc/B > 3), as shown in Table 2. Abhari et al. [38] concluded that the maximum value occurs at about the 30° cross section of a 90° bend. Vaghefi et al. [5] reported that the maximum value occurs at about the 80° angle of a 180° bend. For navigation safety, the occurrence of peak secondary flow intensity implies that maximum bank erosion may occur mid-bank in sharp bends under backwater conditions, which is a critical design consideration.
Table 2.
Location comparison of maximum secondary flow intensity in channel bends.
The backwater effects in curved channels of the backwater fluctuation zones of reservoirs are fully considered in this study. For instance, the Three Gorges Dam can store water from 145 m to 175 m above the sea level, which leads to the change in flow depth between high and low water levels in the backwater fluctuation zone. At a high water level, the deeper flow depth and lower velocity are more conducive to navigation; meanwhile, at the low water level, the shallower flow depth, higher velocity, and sediment deposition, formed at the higher water level, are not conducive to navigation. In the current study, the effects of backwater on the redistribution and deflection of velocity are of crucial research and practical significance for navigation and other hydraulic engineering designs. Generally, the backwater depth is less than two times (i.e., η < 2) that of the non-backwater depth in the backwater fluctuation zone of the TGR. In the current study, we considered the backwater degree of η = 3.64 as the largest, and there is a slight difference between the inner bank and the outer bank. The backwater degree 0 < η < 3.64 in this study can be considered to effectively represent the backwater depth of a real channel. In addition, Froude similarity (Fr = 1.14–1.15 for non-backwater cases) governed the scaling, with the flume geometry (rc/B = 2.5) representing sharp bends in mountainous rivers. While flow depths (64–314 mm) and discharges (Q = 35–80 L/s) of this study were scaled to replicate subcritical to supercritical transitions, sediment-flow interactions and free-surface turbulence were excluded. Thus, the experimental results are primarily applicable to rigid-bed scenarios and require field validation for mobile beds.
5. Conclusions
In this study, we investigated the effects of backwater on the three-dimensional velocity distribution characteristics in a 90-degree sharp bend through flume experiments. Several conclusions can be drawn, as follows:
- (1)
- The increasing backwater degree significantly reduces depth-averaged velocities, with mean cross-sectional velocities decreasing by about 60.1–67.2% as the backwater degree increases from 1.00 to its maximum tested values. The deflection angles of depth-averaged velocities decrease as the backwater degree increases, due to the weakened centrifugal effect.
- (2)
- At the apex of the bend, the increasing backwater degree induces velocity attenuation through increasing flow depth, driving the migration of high-velocity zones near the bed toward the inner bank (e.g., 0.1 m migration for Q = 52 L/s as the backwater degree increases from 1.00 to 3.26).
- (3)
- Secondary flow dynamics present the following continuous spatial adjustments: the central cells gradually migrate toward the inner bank with increasing backwater degree, while the secondary flow intensity peaks at the 45° cross section and declines downstream.
These experimental results quantify hydrodynamic characteristics under backwater conditions in sharp bends. The observed velocity redistribution and secondary flow dynamics provide mechanistic insights for engineering challenges in reservoir backwater zones (e.g., the Dajiantan bend of Three Gorges Reservoir). Further research is needed to extend these findings to natural systems with mobile beds and mild bends.
Author Contributions
Conceptualization, Q.Z., Z.L. and P.C.; methodology, Q.Z.; validation, Z.J. and P.C.; resources, Z.L. and Z.J.; data curation, Q.Z.; writing—original draft preparation, Q.Z. and Z.L.; writing—review and editing, Z.J., Y.W., P.C., Y.L. and X.Y.; funding acquisition, Z.L., Y.W., P.C. and Y.L. All authors have read and agreed to the published version of the manuscript.
Funding
This work research was funded by the National Natural Science Foundation of China (52479058, 52409082), the Fundamental Research Funds for Central Public Welfare Research Institutes (CKSF2023292/HL, CKSF20241011/HL, CKSF2024985/HL), the Open Research Fund of State Key Laboratory of Hydraulics and Mountain River Engineering (SKHL2414), and the Open Research Fund of Key Laboratory of Port, Waterway and Sedimentation Engineering Ministry of Communications of Nanjing Hydraulic Research Institute (CKSD2022739/HL).
Data Availability Statement
The raw data supporting the conclusions of this article will be made available by the authors on request.
Conflicts of Interest
The authors declare no conflicts of interest.
References
- Akhtari, A.A.; Abrishami, J.; Sharifi, M.B. Experimental investigations water surface characteristics in strongly-curved open channels. J. Appl. Sci. 2009, 9, 3699–3706. [Google Scholar] [CrossRef]
- Blanckaert, K. Topographic steering, flow recirculation, velocity redistribution, and bed topography in sharp meander bends. Water Resour. Res. 2010, 46, W09506. [Google Scholar] [CrossRef]
- Gholami, A.; Akhtari, A.A.; Minatour, Y.; Bonakdari, H.; Javadi, A.A. Experimental and numerical study on velocity fields and water surface profile in a strongly-curved 90° open channel bend. Eng. Appl. Comput. Fluid Mech. 2014, 8, 447–461. [Google Scholar] [CrossRef]
- Akbari, M.; Vaghefi, M. Experimental investigation on streamlines in a 180° sharp bend. Acta Sci. Technol. 2017, 39, 425–432. [Google Scholar] [CrossRef]
- Vaghefi, M.; Akbari, M.; Fiouz, A.R. An experimental study of mean and turbulent flow in a 180 degree sharp open channel bend: Secondary flow and bed shear stress. KSCE J. Civ. Eng. 2015, 20, 1582–1593. [Google Scholar] [CrossRef]
- Kashyap, S.; Constantinescu, G.; Rennie, C.D.; Post, G.; Townsend, R. Influence of channel aspect ratio and curvature on flow, secondary circulation, and bed shear stress in a rectangular channel bend. J. Hydraul. Eng. 2012, 138, 1045–1059. [Google Scholar] [CrossRef]
- Li, B.D.; Zhang, X.H.; Tang, H.S.; Tsubaki, R. Influence of deflection angles on flow behaviours in open channel bends. J. Mt. Sci. 2018, 15, 2292–2306. [Google Scholar] [CrossRef]
- Zeng, J.; Constantinescu, G.; Blanckaert, K.; Weber, L. Flow and bathymetry in sharp open-channel bends: Experiments and predictions. Water Resour. Res. 2008, 44, W09401. [Google Scholar] [CrossRef]
- Raeisifar, H.; Rahimpour, A.R.; Afzalimehr, H.; Yagci, O.; Valyrakis, M. Experimental assessment of the turbulent flow field due to emergent vegetation at a sharply curved open channel. Water 2025, 17, 205. [Google Scholar] [CrossRef]
- Rismani, N.; Afzalimehr, H.; Asghari-Pari, S.A.; Nazari-Sharabian, M.; Karakouzian, M. Optimization of threshold velocity values for sediment transport at the outer bank of a 180-degree bend with emergent vegetation. Water 2025, 17, 971. [Google Scholar] [CrossRef]
- Johannesson, H.; Parker, G. Secondary flow in mildly sinuous channel. J. Hydraul. Eng. 1989, 115, 289–308. [Google Scholar] [CrossRef]
- Russell, P.; Vennell, R. High resolution observations of an outer-bank cell of secondary circulation in a natural river bend. J. Hydraul. Eng. 2019, 145, 04019012. [Google Scholar] [CrossRef]
- Yan, X.H.; Rennie, C.D.; Mohammadian, A. A three-dimensional numerical study of flow characteristics in strongly curved channel bends with different side slopes. Environ. Fluid Mech. 2020, 20, 1491–1510. [Google Scholar] [CrossRef]
- Blanckaert, K.; De Vriend, H. Secondary flow in sharp one-channel bends. J. Fluid Mech. 2004, 498, 353–380. [Google Scholar] [CrossRef]
- Hu, C.; Yu, M.; Wei, H.; Liu, C. The mechanisms of energy transformation in sharp open-channel bends: Analysis based on experiments in a laboratory flume. J. Hydrol. 2019, 571, 723–739. [Google Scholar] [CrossRef]
- Blanckaert, K. Saturation of curvature-induced secondary flow, energy losses, and turbulence in sharp open-channel bends: Laboratory experiments, analysis, and modeling. J. Geophys. Res. 2009, 114, F03015. [Google Scholar] [CrossRef]
- Blanckaert, K. Hydrodynamic processes in sharp bends and their morphological implications. J. Geophys. Res. 2011, 116, F01003. [Google Scholar] [CrossRef]
- Blanckaert, K.; Graf, W. Momentum transport in sharp open-channel bends. J. Hydraul. Eng. 2004, 130, 186–198. [Google Scholar] [CrossRef]
- Grill, G.; Lehner, B.; Thieme, M.; Geenen, B.; Tickner, D.; Antonelli, F.; Babu, S.; Borrelli, P.; Cheng, L.; Crochetiere, H.; et al. Mapping the world’s free-flowing rivers. Nature 2019, 569, 215–221. [Google Scholar] [CrossRef]
- Lehner, B.; Reidy Liermann, C.; Revenga, C.; Vörösmarty, C.; Fekete, B.; Crouzet, P.; Doell, P.; Endejan, M.; Frenken, K.; Magome, J.; et al. High-resolution mapping of the world’s reservoirs and dams for sustainable river-flow management. Front. Ecol. Environ. 2011, 9, 494–502. [Google Scholar] [CrossRef]
- Liro, M. Dam-induced base-level rise effects on the gravel-bed channel planform. Catena 2017, 153, 143–156. [Google Scholar] [CrossRef]
- Liro, M. Dam reservoir backwater as a field-scale laboratory of human-induced changes in river biogeomorphology: A review focused on gravel-bed rivers. Sci. Total Environ. 2019, 651, 2899–2912. [Google Scholar] [CrossRef] [PubMed]
- Liro, M.; Ruiz-Villanueva, V.; Mikuś, P.; Wyżga, B.; Bladé Castellet, E. Changes in the hydrodynamics of a mountain river induced by dam reservoir backwater. Sci. Total Environ. 2020, 74, 140555. [Google Scholar] [CrossRef]
- Lang, J.; Le Heron, D.P.; Van den Berg, J.H.; Winsemann, J. Bedforms and sedimentary structures related to supercritical flows in glacigenic settings. Sedimentology 2021, 68, 1539–1579. [Google Scholar] [CrossRef]
- Ventra, D.; Cartigny, M.J.B.; Bijkerk, J.F.; Acikalin, S. Supercritical-flow structures on a Late Carboniferous delta front: Sedimentologic and paleoclimatic significance. Geology 2015, 43, 731–734. [Google Scholar] [CrossRef]
- Auel, C.; Albayrak, I.; Boes Robert, M. Turbulence characteristics in supercritical open channel flows: Effects of froude number and aspect ratio. J. Hydraul. Eng. 2014, 140, 04014004. [Google Scholar] [CrossRef]
- Tan, C.; Plink-BjÖrklund, P. Morphodynamics of supercritical flow in a linked river and delta system, Daihai Lake, Northern China. Sedimentology 2021, 68, 1606–1639. [Google Scholar] [CrossRef]
- Nie, R.; Zhou, Q.; Li, W.; Liu, X.; Xie, G.; Wang, L. Impact of backwater on water surface profile in curved channels. Water Sci. Eng. 2023, 16, 295–301. [Google Scholar] [CrossRef]
- Chung, W.H.; Aldama-Rodríguez, A.; Smith, J. On the effects of downstream boundary conditions on diffusive flood routing. Adv. Water Resour. 1993, 16, 259–275. [Google Scholar] [CrossRef]
- Di Cristo, C.; Iervolino, M.; Vacca, A. Diffusive approximation for unsteady mud flows with backwater effect. Adv. Water Resour. 2015, 81, 84–94. [Google Scholar] [CrossRef]
- Jin, Z.W.; Lu, J.Y.; Wu, H.L. Study of bedload transport in backwater flow. J. Hydrodyn. 2016, 28, 153–161. [Google Scholar] [CrossRef]
- Tsai, C.W. Flood routing in mild-sloped rivers-wave characteristics and downstream backwater effect. J. Hydrol. 2005, 308, 151–167. [Google Scholar] [CrossRef]
- Han, C.; Dai, T.; Tian, Z.; Tang, Y.; Wu, H.; Wang, Y.; Wang, Z. Source identification and release potential of soil phosphorus in the water-level fluctuation zone of large reservoirs: A case study of the Three Gorges Reservoir, China. Water 2025, 17, 611. [Google Scholar] [CrossRef]
- Leschziner, M.; Rodi, W. Calculation of strongly curved open-channel flow. J. Hydraul. Div. 1979, 105, 1297–1314. [Google Scholar] [CrossRef]
- Rozovskii, I.L. Flow of Water in Bends of Open Channels; Israel Program for Scientific Translations: Jerusalem, Israel, 1961. [Google Scholar]
- Pan, Y.; Li, Z.; Yang, K.; Jia, D. Velocity distribution characteristics in meandering compound channels with one-sided vegetated floodplains. J. Hydrol. 2019, 578, 124068. [Google Scholar] [CrossRef]
- Liu, C.; Shan, Y.; Liu, X.; Yang, K.; Liao, H. The effect of floodplain grass on the flow characteristics of meandering compound channels. J. Hydrol. 2016, 542, 1–17. [Google Scholar] [CrossRef]
- Abhari, M.N.; Ghodsian, M.; Vaghefi, M.; Panahpur, N. Experimental and numerical simulation of flow in a 90° bend. Flow Meas. Instrum. 2010, 21, 292–298. [Google Scholar] [CrossRef]
- Shukry, A. Flow around bends in an open flume. Trans. Am. Soc. Civ. Eng. ASCE 1950, 115, 751–779. [Google Scholar] [CrossRef]
Disclaimer/Publisher’s Note: The statements, opinions and data contained in all publications are solely those of the individual author(s) and contributor(s) and not of MDPI and/or the editor(s). MDPI and/or the editor(s) disclaim responsibility for any injury to people or property resulting from any ideas, methods, instructions or products referred to in the content. |
© 2025 by the authors. Licensee MDPI, Basel, Switzerland. This article is an open access article distributed under the terms and conditions of the Creative Commons Attribution (CC BY) license (https://creativecommons.org/licenses/by/4.0/).