Article

Water Saving and Carbon Reduction (CO2) Synergistic Effect and Their Spatiotemporal Distribution Patterns

Water Conservancy Engineering Department, School of Water Resources, Longzihu Campus, North China University of Water Resources and Electric Power, Zhengzhou 450046, China
*
Author to whom correspondence should be addressed.
Water 2025, 17(13), 1847; https://doi.org/10.3390/w17131847 (registering DOI)
Submission received: 14 May 2025 / Revised: 18 June 2025 / Accepted: 18 June 2025 / Published: 21 June 2025
(This article belongs to the Special Issue China Water Forum 2024)

Abstract

:
Under the dual constraints of rigid water resource management systems and China’s “dual carbon” national strategy, water resource management authorities face pressing practical demands for the coordinated governance of water conservation and carbon dioxide emission reduction. This study comprehensively compiles nationwide data on water supply/consumption, energy use, water intensity, and CO2 emissions across Chinese provinces. Employing a non-radial directional distance function (NDDF) model with multiple inputs and outputs, we quantitatively assess provincial water saving and carbon reduction performance during 2000–2021; measure synergistic effects; and systematically examine the spatiotemporal evolution, correlation patterns, and convergence trends of three key indicators: standalone water saving performance, standalone carbon reduction performance, and their synergistic performance—essentially addressing whether “1 + 1 > 2” holds true. Furthermore, we analyze the spatial convergence and clustering characteristics of synergistic effect across regions, delving into the underlying causes of inter-regional disparities in water–carbon synergy. Key findings reveal the following: ① Temporally, standalone water saving and carbon reduction performance generally improved, though the water saving metrics initially declined before stabilizing into sustained growth, ultimately outpacing carbon reduction gains. Synergistic performance consistently surpassed standalone measures, with most regions demonstrating accelerating synergistic enhancement over time. Nationally, water–carbon synergy exhibited early volatile declines followed by steady growth, though the growth rate gradually decelerated. ② Spatially, high-value synergy clusters migrated from the western to eastern regions and the northern to southern zones before stabilizing geographically. The synergy effect demonstrates measurable convergence overall, yet with pronounced regional heterogeneity, manifesting a distinct “high southeast–low northwest” agglomeration pattern. Strategic interventions should prioritize water–carbon nexus domains, leverage spatial convergence trends and clustering intensities, and systematically unlock synergistic potential.

1. Introduction

1.1. Research Background and Significance

Currently, global warming caused by greenhouse gas emissions from human activities has become a severe common challenge for the development of all humanity. The concentration of carbon dioxide in the atmosphere continues to rise year by year, triggering a series of climate issues and causing significant changes in the reserves of various resources essential for human survival.
The latest climate report from the United Nations Intergovernmental Panel on Climate Change (IPCC) states that to limit global warming to 1.5 °C, the world must reduce carbon emissions by 40% by 2030 and achieve net-zero emissions by 2050. Without immediate action, the carbon budget for staying within the 1.5 °C threshold is projected to be exhausted within the next decade.
As the world’s largest developing country, China is still in a phase of rapid development, where socioeconomic progress continues to demand substantial consumption of water resources and carbon-intensive mineral resources. In 2020, China’s carbon dioxide emissions accounted for 31.9% of the global emissions [1]. On 22 September 2020, President Xi Jinping explicitly stated at the 75th United Nations General Assembly that China aims to peak its carbon dioxide emissions before 2030 and strive to achieve carbon neutrality before 2060. The IPCC technical report points out that climate change will have a significant impact on freshwater resources, and the uneven spatial and temporal distribution of water resources will exacerbate the world’s water resource problems, leading to increasingly prominent contradictions between water supply and demand. In October 2019, General Secretary Xi Jinping visited the Yellow River and held a symposium on ecological protection and high-quality development in the Yellow River Basin. He pointed out that “we must adhere to the principle of using water to determine cities, land, people, and production, take water resources as the biggest rigid constraint, plan population, urban, and industrial development reasonably, and resolutely curb unreasonable water demand”. In 2019, the National Development and Reform Commission and the Ministry of Water Resources issued and implemented the National Water Conservation Action Plan, and in 2024, the Ministry of Water Resources organized the preparation of the National Water Conservation Medium-and-Long-Term Plan (2025–2035), both indicating that water conservation has risen to the national strategic level. Compared to 2014, with China’s GDP nearly doubling in 2023, the overall water consumption remains stable at 610 billion cubic meters. The water consumption per CNY 10,000 of GDP and industrial added value have decreased by 41.7% and 55.1%, respectively, indicating a significant water saving effect. The achievement of the “dual carbon” goal is closely related to the conservation and utilization of water resources. With the establishment of the “dual carbon” goal, the comprehensive benefit evaluation that considers both “water conservation” and “carbon reduction” is no longer limited to the ecological environment field, but should take into account the rapid economic and social development and the sustainable utilization of resources.
The energy sector serves as the primary arena for achieving carbon peak and carbon neutrality in China, with energy-related carbon emissions accounting for approximately 88% of the nation’s total CO2 emissions. In 2022, China’s CO2 emissions per unit of GDP reached 6.6 tons per USD 10,000, significantly exceeding both the global average and the levels of major Western developed economies. From 2010 to 2022, China’s per capita cumulative CO2 emissions amounted to around 133 tons, surpassing the global average of 67 tons and France’s 123 tons, yet remaining below the figures for Australia (352 tons), Canada (337 tons), the EU (195 tons), the United States (386 tons), and the UK (162 tons), reflecting the country’s ongoing efforts and challenges in balancing economic growth with decarbonization goals [2]. To achieve carbon peak and carbon neutrality while ensuring energy security, a dual strategy of implementing “subtraction” through energy conservation and emission reduction on the consumption side and executing “addition” by expanding non-fossil energy on the supply side must be adopted, with both approaches being closely intertwined with water resources. On the consumption side, saving 1 ton of coal reduces water consumption by 2 tons and cuts CO2 emissions by 2.5 tons [3], while conserving 1 kWh of electricity saves 4 L of water and reduces CO2 emissions by 0.997 kg. On the supply side, scaling up non-fossil energy requires substantial water inputs—producing 1 m2 of silicon wafers consumes 65 L of purified water, manufacturing a 156 mm × 156 mm photovoltaic cell requires 27 L, and assembling a module with 60 cells needs 34 L. Given that global energy production accounts for about 15% of the total water withdrawals (IEA estimate), the strong synergy between water usage and CO2 emissions in energy systems becomes evident.
Under the dual strategic pressures of “water conservation priority” and “carbon neutrality,” China’s water resource management authorities face urgent practical needs for the coordinated governance of water conservation and carbon emission reduction. The synergistic management of water and CO2 represents both a critical proposition for China’s high-quality development and national security and an imperative requirement under the constraints of resource scarcity and climate change. Currently, the intrinsic mechanisms linking water resource development/utilization with carbon emissions remain unclear, including several pressing practical questions: Does synergy exist between water conservation and carbon reduction? If so, what form does it take? Could the combined effect of coordinated water–carbon management yield greater benefits than the sum of separate water saving and emission reduction efforts (i.e., 1 + 1 > 2)? What are the regional disparities in water–carbon synergy performance? What factors drive these differences?
To address these questions, this study introduces a non-radial directional distance function (NDDF) model capable of handling multiple inputs and outputs. Through this framework, we conduct a comprehensive evaluation of provincial water conservation and carbon reduction performance across China from 2000 to 2021. The analysis includes horizontal and vertical comparisons between standalone water–carbon management and coordinated water–carbon governance. By constructing a synergy quantification model, we examine the spatiotemporal evolution patterns of standalone water conservation, standalone carbon reduction, and their synergistic effect. Furthermore, we investigate the spatial correlation and clustering characteristics of the synergistic effects across provinces and regions, delving into the underlying causes behind the observed regional disparities in water–carbon synergy performance.

1.2. Research Progress at Domestic and International Levels

The theory of synergistic effect originates from the concept of co-benefits, which was proposed to demonstrate that measures taken to reduce greenhouse gas emissions can simultaneously decrease the generation of other pollutants [4]. The concept of “co-benefits” was first formally introduced in the IPCC Third Assessment Report. Synergistic effect, also known as synergistic interactions, refers to the phenomenon where the combined effect of multiple components working together exceeds the sum of their individual effects—essentially achieving a “1 + 1 > 2” outcome. Scholars have conducted extensive research on co-benefit assessment, yielding substantial findings. However, these studies have primarily focused on the domains of atmospheric pollutants and greenhouse gas emissions reduction, examining various scales from global [5,6] to national [7] and regional levels [8], and spanning different sectors including power generation [9], steel production [10], cement manufacturing [11], and transportation [12]. Previous studies have predominantly employed methods such as numerical simulation, correlation analysis, regression analysis, and marginal abatement cost assessment to evaluate the synergistic effect of pollution reduction and carbon mitigation across different countries and industries. While numerical simulation proves highly valuable for predicting policy implementation outcomes, its results represent simulated or projected values under assumed policy targets, lacking retrospective analysis based on historical data [13]. Correlation analysis has provided empirical references for identifying efficient synergistic emission reduction strategies, yet its evaluation results remain simulation values estimated based on engineering technical parameters [14,15]. The methodological limitations of regression analysis, constrained by its single-dependent-variable framework, permit only an isolated assessment of either pollution abatement or carbon mitigation synergies, fundamentally precluding an integrated evaluation of their combined effects. While extant studies have primarily focused on end-of-pipe solutions, China’s dual advancement of water-efficient societal development and low-carbon transition necessitates a paradigm shift toward production-embedded mitigation strategies—particularly through energy mix optimization, economic model transformation, and resource productivity enhancement—which are proving indispensable for achieving systemic water–carbon synergy effect that transcends conventional pollution control approaches [16]. Moreover, production factors such as capital, labor, and energy exhibit certain degrees of substitutability, which collectively influence the operation of the entire economic system [17]. Therefore, the assessment methodology for water saving and carbon reduction synergies should adopt a total-factor productivity perspective to comprehensively evaluate their synergistic effects.
Research on synergistic effects has gradually extended to the water–carbon nexus, though such studies remain in the early developmental stage. The entire process of water resource utilization—including extraction, transportation, and wastewater treatment—consumes substantial energy and generates CO2 emissions. For instance, Wakeel et al.’s study on energy consumption in urban water systems across countries revealed that China’s municipal water supply requires 0.29 kWh of energy per cubic meter [18], while wastewater treatment consumes 0.25 kWh per cubic meter. Sowby et al. evaluated water supply-related CO2 emissions across ten major U.S. cities [19], showing that supplying one cubic meter of water produces 21–560 g of CO2 emissions, and that water conservation could reduce annual emissions by 1200–65,000 metric tons per city. Valek et al. quantified the water–energy nexus in Mexico City [20], demonstrating the feasibility of reducing water supply to decrease both energy consumption and CO2 emissions. A considerable number of domestic studies have focused on the synergistic effects of pollution reduction and carbon emission reduction. For instance, Gu et al. [21], based on data from nine wastewater treatment plants in China, found that treating one cubic meter of domestic sewage requires 13.38 L of water and generates 0.23 kg of carbon dioxide emissions. Zhao et al. identified water systems as a major source of carbon emissions [22]. Zhu et al. noted that urban water systems account for 12% of the total urban carbon emissions during operation [23]. Meanwhile, numerous studies on the “water–carbon nexus” have been conducted from the “water-energy-carbon (WEC) nexus” perspective for discussion. Throughout the energy production chain—including coal mining and power generation—water resources play indispensable roles in cleaning and cooling processes. Notably, both energy production/consumption and wastewater treatment processes represent two primary sources of CO2 emissions [24,25], meaning intensive emission reduction measures in resource- and energy-intensive industries can significantly influence both water usage and carbon emissions [26]. Jin et al. evaluated the synergistic effect between energy conservation and water saving [3], demonstrating that energy-saving measures in the energy sector can yield significant water conservation benefits. Their study quantified that energy conservation in the sector achieved water savings of 12.40 × 10⁸ m3, while water conservation measures resulted in energy savings equivalent to 1.12 × 10⁶ tons of standard coal. Industrial restructuring generates both push and pull effects, leading to coordinated changes in water usage and CO2 emissions [27]. Additionally, the development and utilization of hydropower causes transformations in both energy mix and water source composition, which in turn impacts CO2 emission levels [28]. Li et al. demonstrated that expanding China’s wind power capacity to 200 GW could reduce carbon intensity by 23% while conserving 800 million m3 of water [29]. Zhang et al.’s assessment of the water–carbon nexus in China’s thermal power sector revealed that adopting air-cooled units would increase CO2 emissions by 24.3–31.9 million tons but reduce water consumption by 832–942 million m3 [30]. Feng et al. further quantified that transitioning from coal to low-carbon renewable energy generation could achieve over 79% reduction in CO2 emissions and more than 50% decrease in water usage [31]. The existing research has consistently demonstrated significant synergies between water consumption and CO2 emissions in industrial production processes [32]. Tan et al. identified a significant synergistic effect between water conservation and carbon reduction [33]. Zhao et al. quantified water use per unit of CO2 emission, confirming substantial water–carbon synergy [34]. Zhang et al.’s analysis of the water–energy–carbon nexus in the steel industry revealed that energy-saving measures simultaneously reduce both water use and emissions [35]. Some scholars have also explored the synergistic effects of water conservation and carbon reduction through the lens of the water–carbon coupling relationship. For example, Yang et al. analyzed the trends in industrial water use and CO2 emissions in the Yangtze River Delta region. They employed the coupling coordination degree and the LMDI (Logarithmic Mean Divisia Index) decomposition method to quantify the effects of coordinated water conservation and carbon reduction efforts [36]. These findings collectively prove that water conservation effectively reduces CO2 emissions, while decarbonization processes conserve water, enabling the concurrent achievement of dual water saving and emission reduction objectives.
Although some initial explorations into the synergistic effects of water conservation and carbon reduction have been undertaken, the existing research still has significant limitations. Studies on the synergistic effects of water conservation and carbon reduction across different regions and industry sectors within the entire socioeconomic system remain relatively scarce. There has been no examination of the synergistic effects of water conservation and carbon reduction from a full-factor perspective. Water conservation and performance improvement can be seen as two sides of the same coin. However, few studies have evaluated the synergistic effects of water conservation and carbon reduction from a performance perspective. The spatiotemporal distribution characteristics are still unclear, and the convergence and divergence trends remain to be revealed.

2. Synergy Effect Evaluation Methods

The current literature classifies energy–environmental performance measurement methods into two categories: single-factor indicators and total-factor indicators [37]. Single-factor indicators exhibit inherent limitations as they fail to account for input substitution effects between energy and other production factors such as capital and labor [38]. Within the neoclassical production theory framework, total-factor energy–environmental productivity measures that incorporate capital and other input factors have consequently gained widespread development and application. The production process yields not only desirable outputs but also inevitably generates undesirable by-products simultaneously. It is precisely this capability to jointly evaluate both desirable and undesirable outputs that has made distance function methodology the predominant approach for measuring total-factor energy–environmental productivity. However, the conventional approach requires the proportional scaling of both desirable and undesirable outputs. To reconcile this inherent conflict, Chung et al. developed the directional distance function (DDF) model [39]. The DDF’s key advantage lies in its ability to simultaneously increase desirable outputs while decreasing undesirable outputs within the production possibility set. Nevertheless, the DDF maintains a restrictive assumption of strictly proportional changes—requiring equivalent rates of expansion for desirable outputs and contraction for both input factors and undesirable outputs, which may induce “slack bias” [40]. To address this limitation, the non-radial directional distance function (NDDF) was subsequently developed, relaxing the rigid proportionality assumptions and allowing for non-uniform adjustments [41].
The NDDF (non-radial directional distance function) is a non-parametric efficiency evaluation model based on the Data Envelopment Analysis (DEA) framework, primarily used to measure the efficiency performance of decision-making units (DMUs) in multi-input and multi-output systems. This model significantly improves upon the traditional directional distance function (DDF) by constructing the production frontier through linear programming and defining the efficiency value of DMU as the “directional distance” to the frontier, thereby reflecting their potential for improvement. The NDDF model allows for the simultaneous consideration of input reduction and output expansion, supporting non-radial adjustments, which means that different variables can be optimized at different proportions without any restrictions on the direction and proportion of increase or decrease for each element, making it more flexible in dealing with complex multi-input and multi-output systems.
The article constructs a quantitative model based on the perspective of emission reduction performance, fully reflecting all factor attributes of the production process, introducing water resources variables, constructing a non-radial distance function (NDDF), considering the synergistic effect of two parameters, and measuring the performance of water resource conservation and carbon dioxide emissions. By comparing the changes in emission performance under separate water saving, separate carbon reduction, and water saving and carbon reduction synergistic scenarios, a quantitative evaluation method for water saving and carbon reduction synergistic effect is constructed from the perspective of performance, providing methodological support for evaluating water saving and carbon reduction synergistic effect.

2.1. NDDF Model Construction

We assume that there are i = 1 , 2 , ... N regions as basic decision-making units (DMUs) with a total of t = 1 , 2 , ... T periods. Each region inputs factors for production in each period, resulting in expected output accompanied by unexpected output. This production technology can be represented by P. In this article, considering the dual goals of water conservation and carbon reduction, input factors are set to include capital (K), labor (L), energy consumption (E1), and water usage (E2). The expected output is measured using GDP (G), while unexpected output includes water consumption (W) and carbon dioxide emissions (C). Drawing inspiration from Zhou et al., a non-radial distance function is constructed [42]:
N D ( K , L , E 1 , E 2 , G , W , C ; g ) = sup w T β : K , L , E 1 , E 2 , Y , W , C + g d i a g ( β ) P
The relaxation vector β = β K , β L , β E 1 , β E 2 β G , β W , β C T 0 is the ratio of expansion and reduction in each input–output variable, w = w K , w L , w E 1 , w E 2 w G , w W , w C T represents the weight of each input–output, and g = g K , g L , g E 1 , g E 2 g G , g W , g C is the direction vector, representing the direction of the expected output expansion and the direction of the input and unexpected output reduction.
The linear programming equation for solving the non-radial distance function is as follows:
N D ( K , L , E 1 , E 2 , G , W , C ; g ) = max w K β K + w L β L + w E 1 β E 1 + w E 2 β E 2 + w G β G + w W β W + w C β C s . t . i = 1 N t = 1 T λ i , t K i , t K + β K g K , i = 1 N t = 1 T λ i , t L i , t L + β L g L i = 1 N t = 1 T λ i , t E 1 i . t E 1 + β E 1 g E 1 , i = 1 N t = 1 T λ i , t E 2 i . t E 2 + β E 2 g E 2 i = 1 N t = 1 T λ i , t G i , t G + β G g G , i = 1 N t = 1 T λ i , t W i . t = W + β W g W , i = 1 N t = 1 T λ i , t C i , t = C + β C g C λ i , t 0 , i = 1 , 2 , ... N , t = 1 , 2 , ... T β K , β L , β E 1 , β E 2 , β G , β W , β C 0
The optimal solution β can be obtained by solving Equation (2). Its connotation is to maximize the expected output and minimize the unexpected output, and the relative importance of the maximum and minimum objectives is characterized by the weight vector w .

2.2. Model Parameters and Weight Settings

In accordance with the orientation of the research objectives, to explore how decision-making units (DMUs) can optimize their output structure under a given level of input, the weights of the input variables are set to 0. This aligns with the “Fixed-input, Variable-output” research paradigm and helps focus the analysis on the potential for efficiency improvement on the output side. While maintaining the theoretical rigor of the model, by fixing the input factors, the focus is more on changes in output rather than adjustments in input. This also effectively simplifies the complexity of the model, making it easier to understand and apply.
In sustainability assessment, economic benefits and environmental impacts are irreplaceable. Therefore, setting equal weights (1:1) for desirable outputs (economic benefits) and undesirable outputs (environmental impacts) ensures that the model does not presuppose a value judgment prioritizing economic or environmental goals. This approach prevents the assessment from leaning towards one aspect and avoids evaluation bias introduced by subjective preferences. It also aligns with the OECD’s (2008) principle of policy assessment neutrality.
Taking the case of individual water conservation as an example, the direction vector and weight vector are set as follows:
g = ( K , L , E 1 , E 2 , G , W , 0 ) w T = ( 0 , 0 , 0 , 0 , 1 2 , 1 2 , 0 )
Similarly, the direction vector and weight vector for the coordinated situation of individual carbon reduction, water conservation, and carbon reduction are as follows:
g = ( K , L , E 1 , E 2 , G , 0 , C ) w T = ( 0 , 0 , 0 , 0 , 1 2 0 , 1 2 )
g = ( K , L , E 1 , E 2 , G , W , C ) w T = ( 0 , 0 , 0 , 0 , 1 2 , 1 4 , 1 4 )
Below is an example of the synergistic effect of water conservation and carbon reduction. The weight coefficients and direction vectors are input into the NDDF linear programming equation to obtain the synergistic effect linear programming problem. The optimal solution of the relaxation variable β is solved according to different situations to construct performance indicators.
N D ( K , L , E , G , W , C ; g ) = max ( 1 2 β G + 1 4 β W + 1 4 β C ) s . t . i = 1 N t = 1 T λ i , t K i , t K ( 1 β K ) , i = 1 N t = 1 T λ i , t L i , t L ( 1 β L ) , i = 1 N t = 1 T λ i , t E 1 i . t E 1 ( 1 β E 1 ) , i = 1 N t = 1 T λ i , t E 2 i . t E 2 ( 1 β E 2 ) i = 1 N t = 1 T λ i , t G i , t G ( 1 + β G ) , i = 1 N t = 1 T λ i , t W i . t = W ( 1 β W ) , i = 1 N t = 1 T λ i , t C i , t = C ( 1 β C ) λ i , t 0 , i = 1 , 2 , ... N , t = 1 , 2 , ... T β K , β L , β E 1 , β E 2 , β G , β W , β C 0
The relaxation variables for separate water saving and carbon reduction can be solved in the same way, and will not be repeated here.

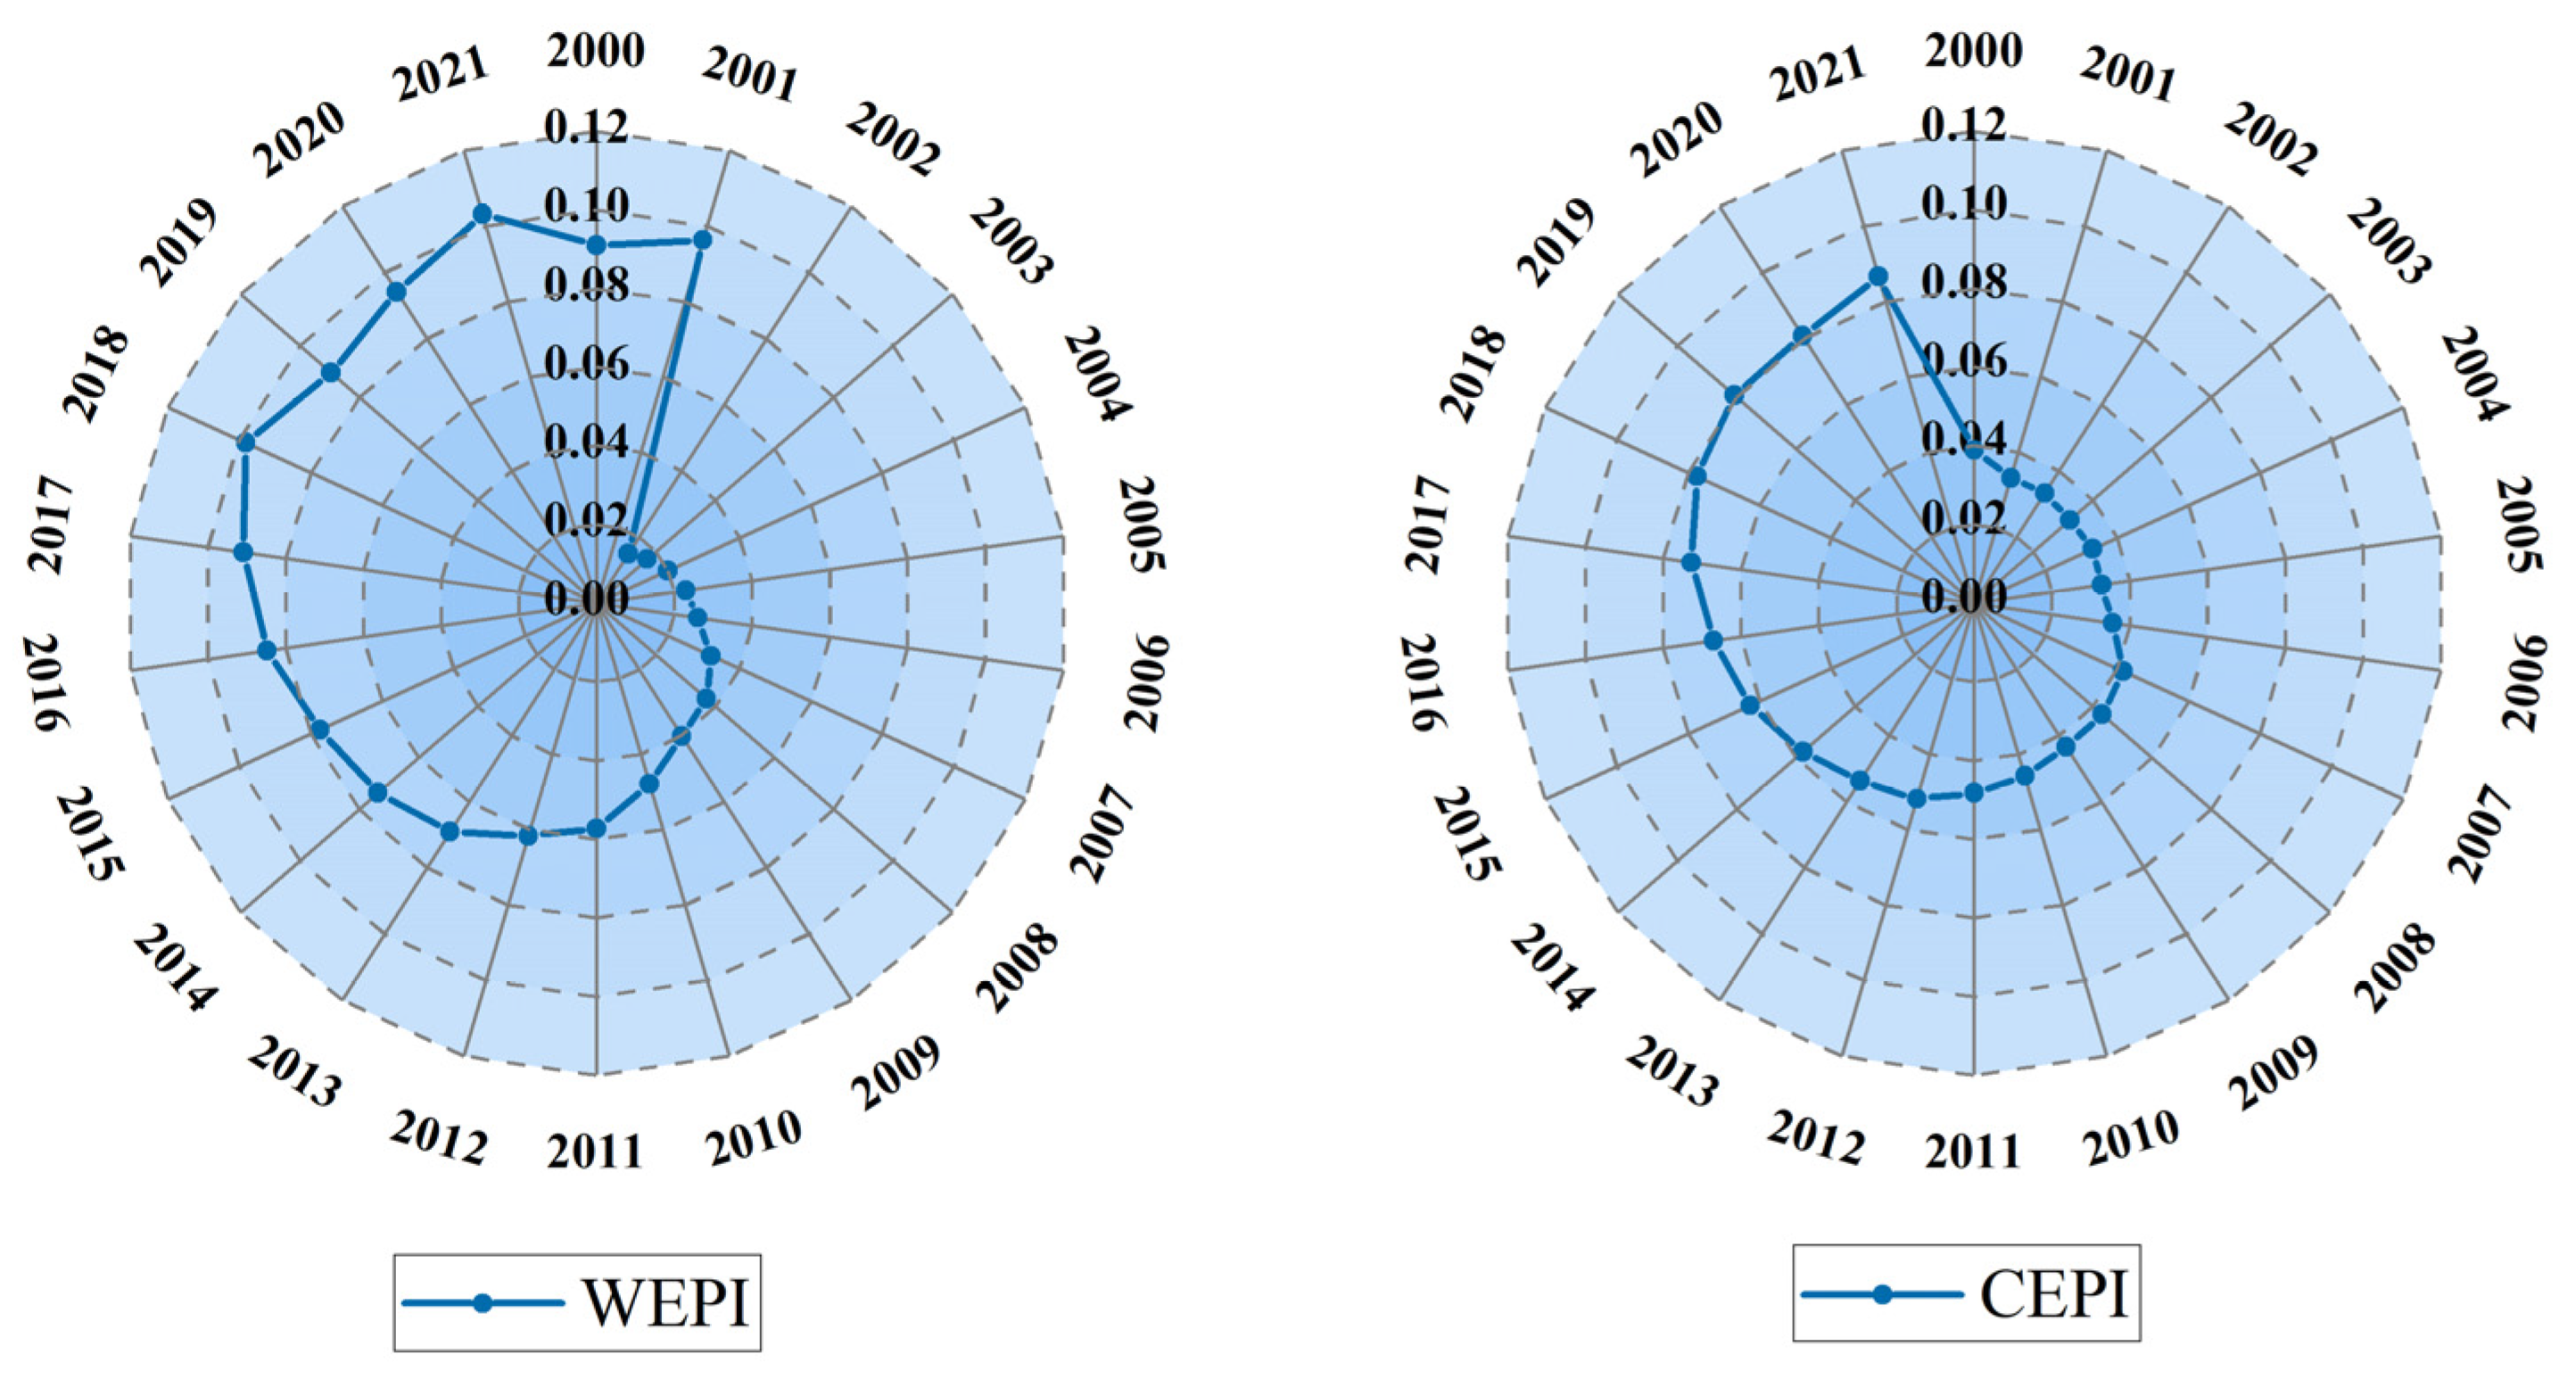
2.3. Construction of Performance Indicators

In order to more intuitively reflect the individual water conservation, carbon reduction, and the synergistic effect of the two, based on solving the relaxation variable and referring to existing literature [32], the efficiency improvement ratio based on DEA measurement is introduced, and two performance indicators, Water Conservation Performance Index (WEPI) and Carbon Reduction Performance Index (CEPI), are introduced. Their calculation formulas are as follows:
W E P I = G / W ( G + β G G ) / ( W β W W ) = 1 β W 1 + β G
C E P I = G / C ( G + β G G ) / ( C β C C ) = 1 β C 1 + β G
In the formula, WEPI is the ratio of the expected output under actual unit water consumption to the expected output under potential unit water consumption, and CEPI is the ratio of the expected output under actual unit CO2 emissions to the expected output under potential CO2 emissions. Obviously, the sizes of both are between 0 and 1. The larger the value, the higher the energy performance and the expected output per unit of energy consumption; β G is the expansion ratio of regional gross domestic product (G) when the decision-making unit performs efficiency improvement, β W is the reduction ratio of water consumption when the decision-making unit performs efficiency improvement, and β C is the reduction ratio of CO2 emissions when the decision-making unit performs efficiency improvement.

2.4. Quantitative Model for Synergistic Effect of Water Saving and Carbon Reduction

Based on the measured water saving and carbon reduction performance, a coupled coordination model is constructed to characterize the synergistic effect of the two. Following the approach of Tian Yun et al., the coupling degree D is first calculated using the following formula [43]:
D = 2 W × C / ( W + C )
In the formula, W is the water saving performance indicator calculated in the previous text, and C is the carbon reduction performance indicator. Based on this, a quantitative model for synergistic effect is further constructed, as shown in formula (10).
S = D × T T = α W + β C
In the formula, S represents the synergistic effect of water conservation and carbon reduction, T is the comprehensive development evaluation index of water conservation performance and carbon reduction performance, α and β are undetermined indices, and α + β = 1 . Both reflect the contribution of water conservation and carbon reduction to collaborative development. Considering the equal status of water conservation and carbon reduction, the values of α and β are evenly divided into 0.5.

2.5. Analysis of Spatial Convergence and Aggregation

Convergence analysis is employed to examine whether variables tend toward a stable state over time. In this study, σ -convergence is utilized to reflect the dispersion degree of the research variables, analyzing and testing the spatial convergence of synergistic effect at the interprovincial level. The calculation formula is as follows:
σ = 1 n 1 i = 1 n ( S i , t S t ¯ ) 2 S t ¯
In the formula, n is the number of provinces, S i , t is the synergy effect of the i -th province in year t , and S t ¯ is the average interprovincial synergy effect in year t . The criterion for determination is as follows: if σ t + 1 < σ t , it indicates the presence of σ -convergence (i.e., regional disparities are diminishing); if σ t + 1 > σ t , it signifies σ -divergence.
To thoroughly investigate the spatial clustering patterns of water saving and carbon reduction synergy effect across China’s provincial regions, this study employs the Local Moran’s I index to identify spatial autocorrelation characteristics. The core methodology involves calculating the similarity degree between each spatial unit and its neighboring units, thereby determining the existence of significant spatial associations and revealing high-value or low-value clustering patterns. The calculation formula for the Local Moran’s I index is as follows:
I i = ( S i S ¯ ) V a r ( S ) i = 1 n ω i j ( S j S ¯ ) V a r ( S ) = 1 n i = 1 n ( S i S ¯ ) 2
The output indicators of the Local Moran’s I index include Local Moran’s I, Z-Score, PValue, and COType. The clustering area and abnormal area are distinguished by the positive and negative values of Local Moran’s I. When the value of Local Moran’s I is positive, it is displayed as a clustering area, otherwise it is an abnormal area. The absolute value of Z-Score can reflect the randomness of regional spatial patterns, and the larger its absolute value, the more significantly the spatial pattern (clustering or anomaly) of the observed values deviates from the random distribution. Using PValue to define the significance of spatial patterns, the smaller the value, the more significant the spatial pattern is considered. COType refers to the four types of spatial patterns, namely High High Cluster (H-H), Low Low Cluster (L-L), High Low Outlier (H-L), and Low High Outlier (L-H), representing hot spot areas, cold spot areas, and outlier areas, respectively.

2.6. Data Source and Explanation

This paper selects panel data from 30 provinces in China (excluding Xizang, Hong Kong, Macao, and Taiwan), mainly based on the following considerations: First, ensure the availability and consistency of data. The availability and refinement of provincial data are relatively high, which can more accurately account for carbon emissions, water resource consumption, and energy use. Secondly, the selected 30 provinces cover the three major economic belts of eastern, central, and western China, with spatial representativeness and accounting for over 95% of the country’s land area and over 99% of the total population. They can comprehensively reflect the commonalities and differences in the coordinated development of water conservation and carbon reduction in different regions of China.
This article selects a time span from 2000 to 2021 to maintain data continuity and avoid the impact of missing or interrupted data on research results, which is beneficial for more a accurate analysis of long-term trends and intrinsic relationships between variables; At the same time, a longer time span covering multiple economic cycles can more comprehensively reflect the changes in the input–output efficiency of the economic system in different states, which helps to analyze in depth the long-term structural factors and short-term random factors that affect production efficiency, thus providing a basis for formulating more scientific and reasonable policies and management measures.
The water consumption data used in the article are sourced from the “Water Resources Bulletin” of various provinces over the years, the labor and economic output data are sourced from the “National Economic and Social Development Bulletin” of various provinces over the years, and the capital stock data of each province is sourced from the “Statistical Yearbook”. Among them, the capital stock input factor is based on 2005 as the initial year. This article refers to Zhang Jun’s perpetual inventory method to calculate the capital stock [44], and the specific calculation formula is as follows:
x 1 t = ( 1 + δ ) x 1 t 1 + I t
In the formula: x 1 is the capital stock in year t ; I is the investment for year t ; and δ is the depreciation rate of fixed assets.

3. Result Analysis

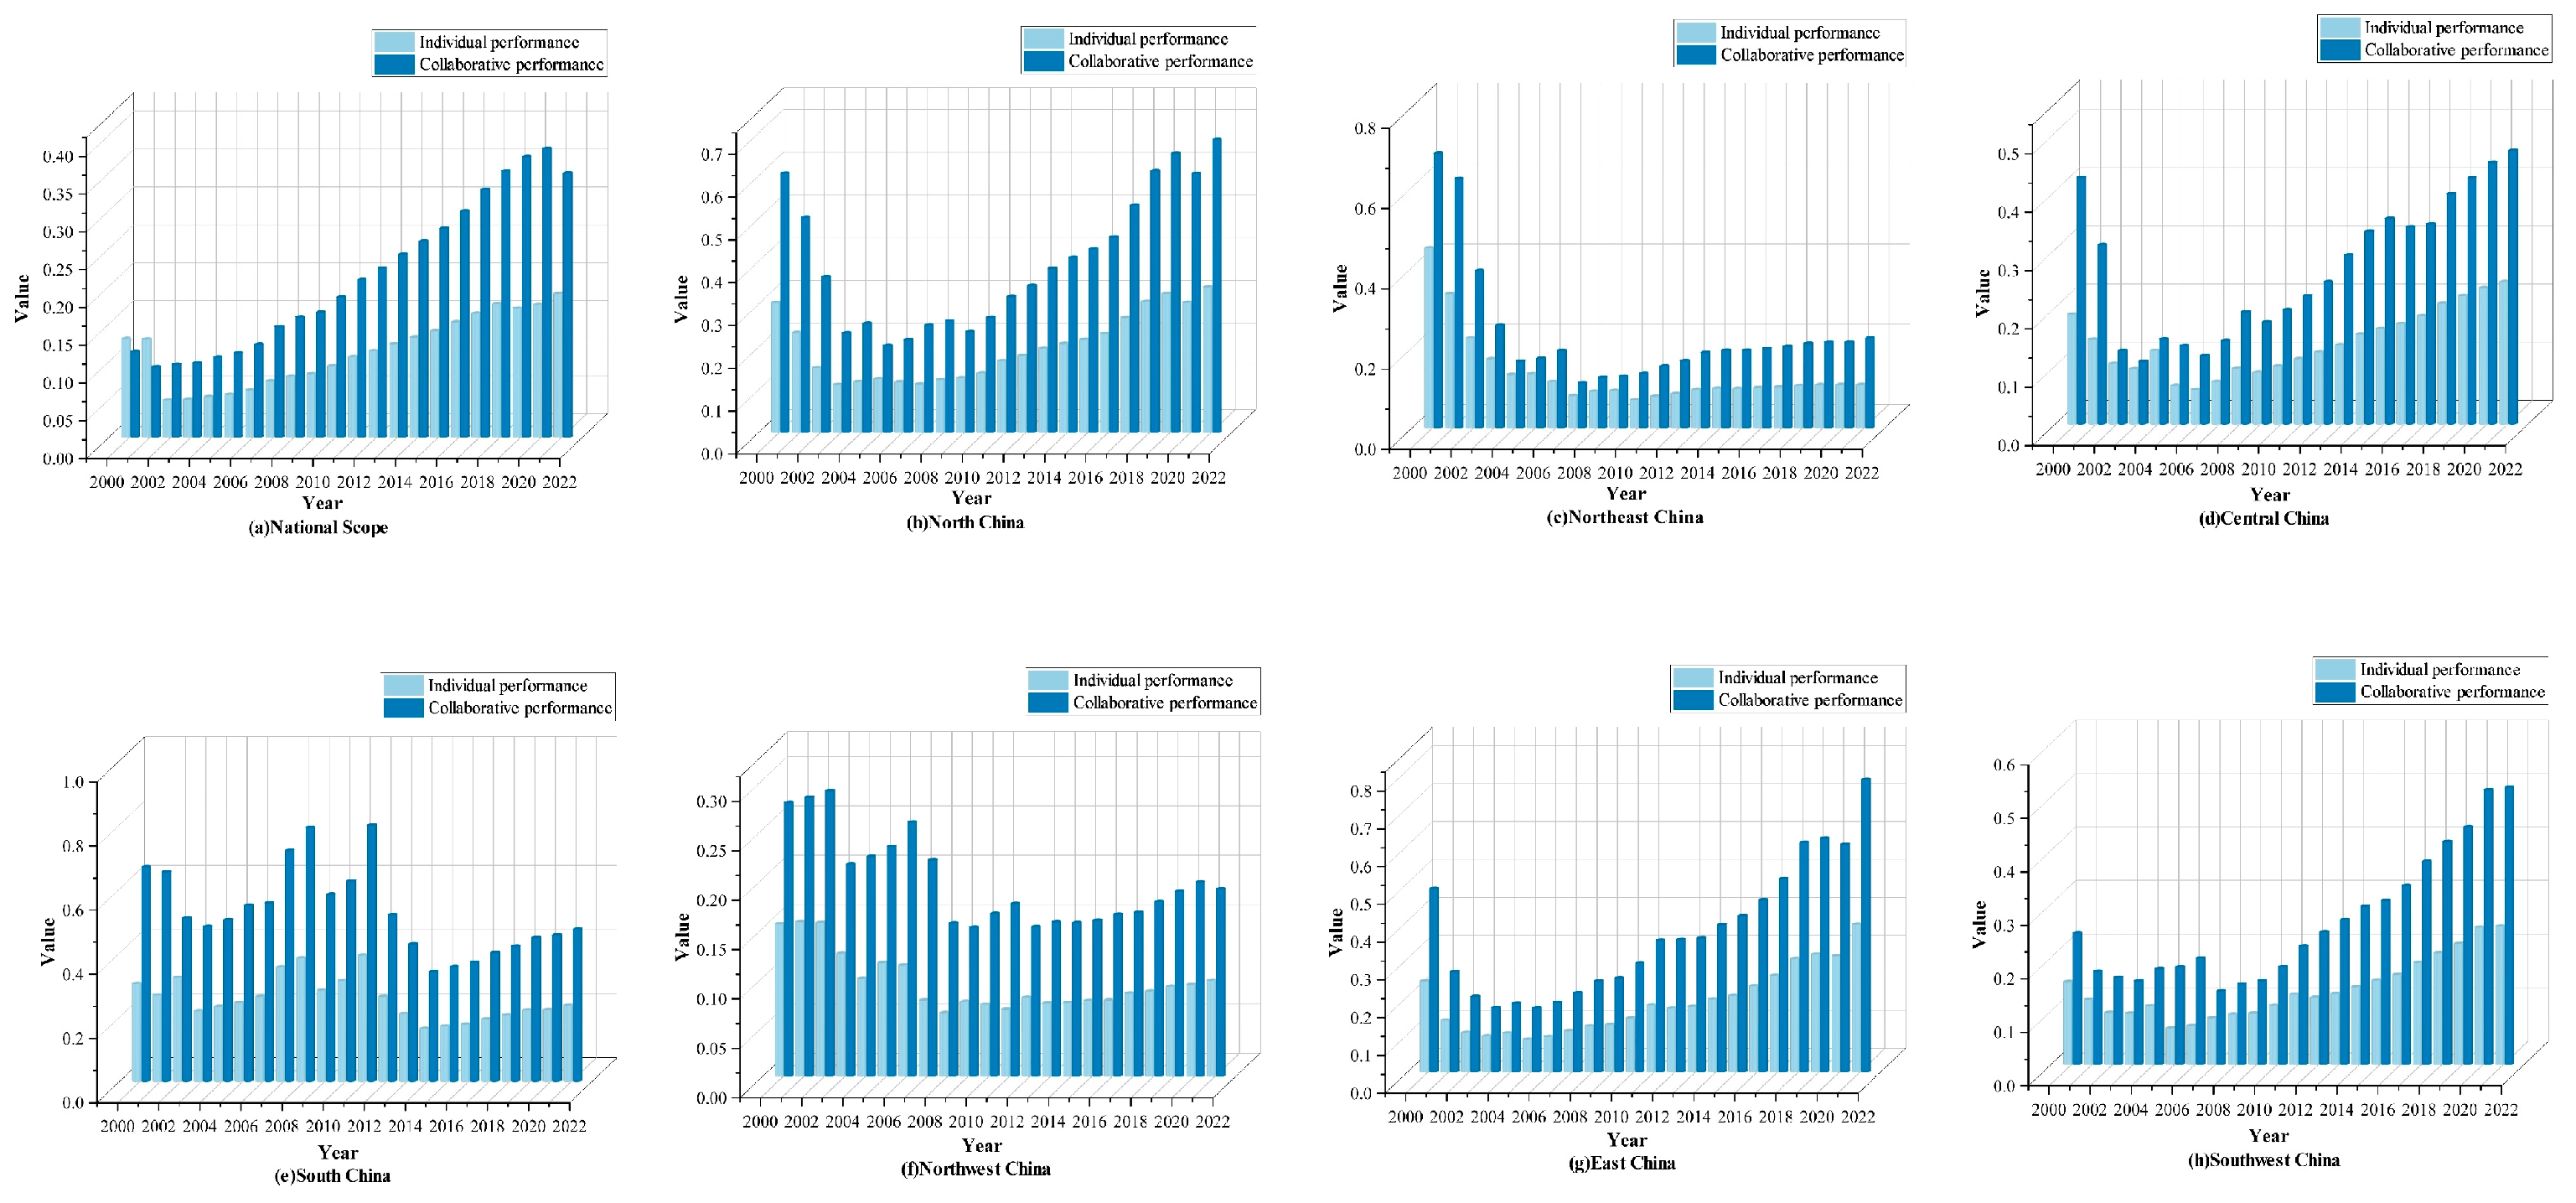
3.1. Comparison of Individual Water Conservation and Carbon Reduction with Collaborative Performance

The national WEPI is 0.061. From 2001 to 2002, WEPI showed a decline, and from 2002 to 2021, it showed a continuous upward trend, increasing from 0.015 in 2002 to 0.103 in 2021, an increase of 5.9 times. WEPI fluctuated slightly from 2018 to 2019, possibly due to the “National Water Conservation Action Plan” jointly released by the National Development and Reform Commission and the Ministry of Water Resources in 2019, which was guided by “policy guidance, market orientation, and innovation drive”, proposing measures such as establishing and improving incentive mechanisms, strengthening social capital investment, supporting water conservation service enterprises, and promoting the development of water conservation industries, further promoting water conservation work throughout society.
The average CEPI is 0.052. In the early stage, due to the initial stage of carbon reduction work, the effects of policies and measures have not yet fully manifested, and their changes have tended to stabilize. After 2003, CEPI maintained an upward trend, and the rate of increase has increased since 2010, with a growth rate of 89.0%. It may be due to the National Development and Reform Commission’s release of the “Notice on Launching Carbon Emission Trading Pilot Work” in 2011, which initiated the pilot work of carbon emission trading. In 2020, China proposed the “dual carbon” goal, and in 2021, the national carbon emission trading market was launched and put into operation. Through market mechanisms, enterprises were incentivized to reduce carbon emissions, increasing carbon reduction efforts and thus promoting further improvement in carbon reduction performance.The temporal variation characteristics of individual water-saving and individual carbon reduction performance are shown in Figure 1.
To comprehensively consider the “individual” performance and “collaborative” performance, the sum of the water saving performance and carbon reduction performance in the collaborative water saving and carbon reduction state is defined as collaborative performance, i.e., “1 + 1”. The sum of the water saving performance in the individual water saving state and the carbon reduction performance in the individual carbon reduction state is defined as individual performance. The changes in individual and collaborative performance in China and seven major regions are shown in Figure 2. From 2000 to 2021, at the national level, both individual and collaborative performance showed an overall upward trend, indicating a significant improvement in water conservation and carbon reduction over time. At the same time, the collaborative performance value is generally higher than the sum of individual performance, and collaborative performance has obvious advantages compared to individual performance. Moreover, the growth rate of collaborative performance in the later stage is relatively fast, with less volatility, showing a more stable growth trend.
The “collaborative” performance in all the regions of the country is greater than the sum of the “individual” performance, that is, “1 + 1 > 2” exists, and there is a characteristic of first fluctuation and then stability. Over time, the improvement of collaborative performance in most regions is greater than that in the initial stage. The growth rate in North China increased from 62.7% to 101.8%, Northeast China increased from 52.7% to 109.1%, East China increased from 79.4% to 98.1%, Southwest China increased from 58.9% to 100.6%, and Northwest China increased from 72.6% to 95.4%, achieving an improvement in collaborative performance growth. The collaborative promotion of water conservation and carbon reduction work can more effectively integrate and optimize the allocation of related resources, fully tap into the potential of resources, achieve the dual goals of water conservation and carbon reduction, and improve resource utilization efficiency and work efficiency.

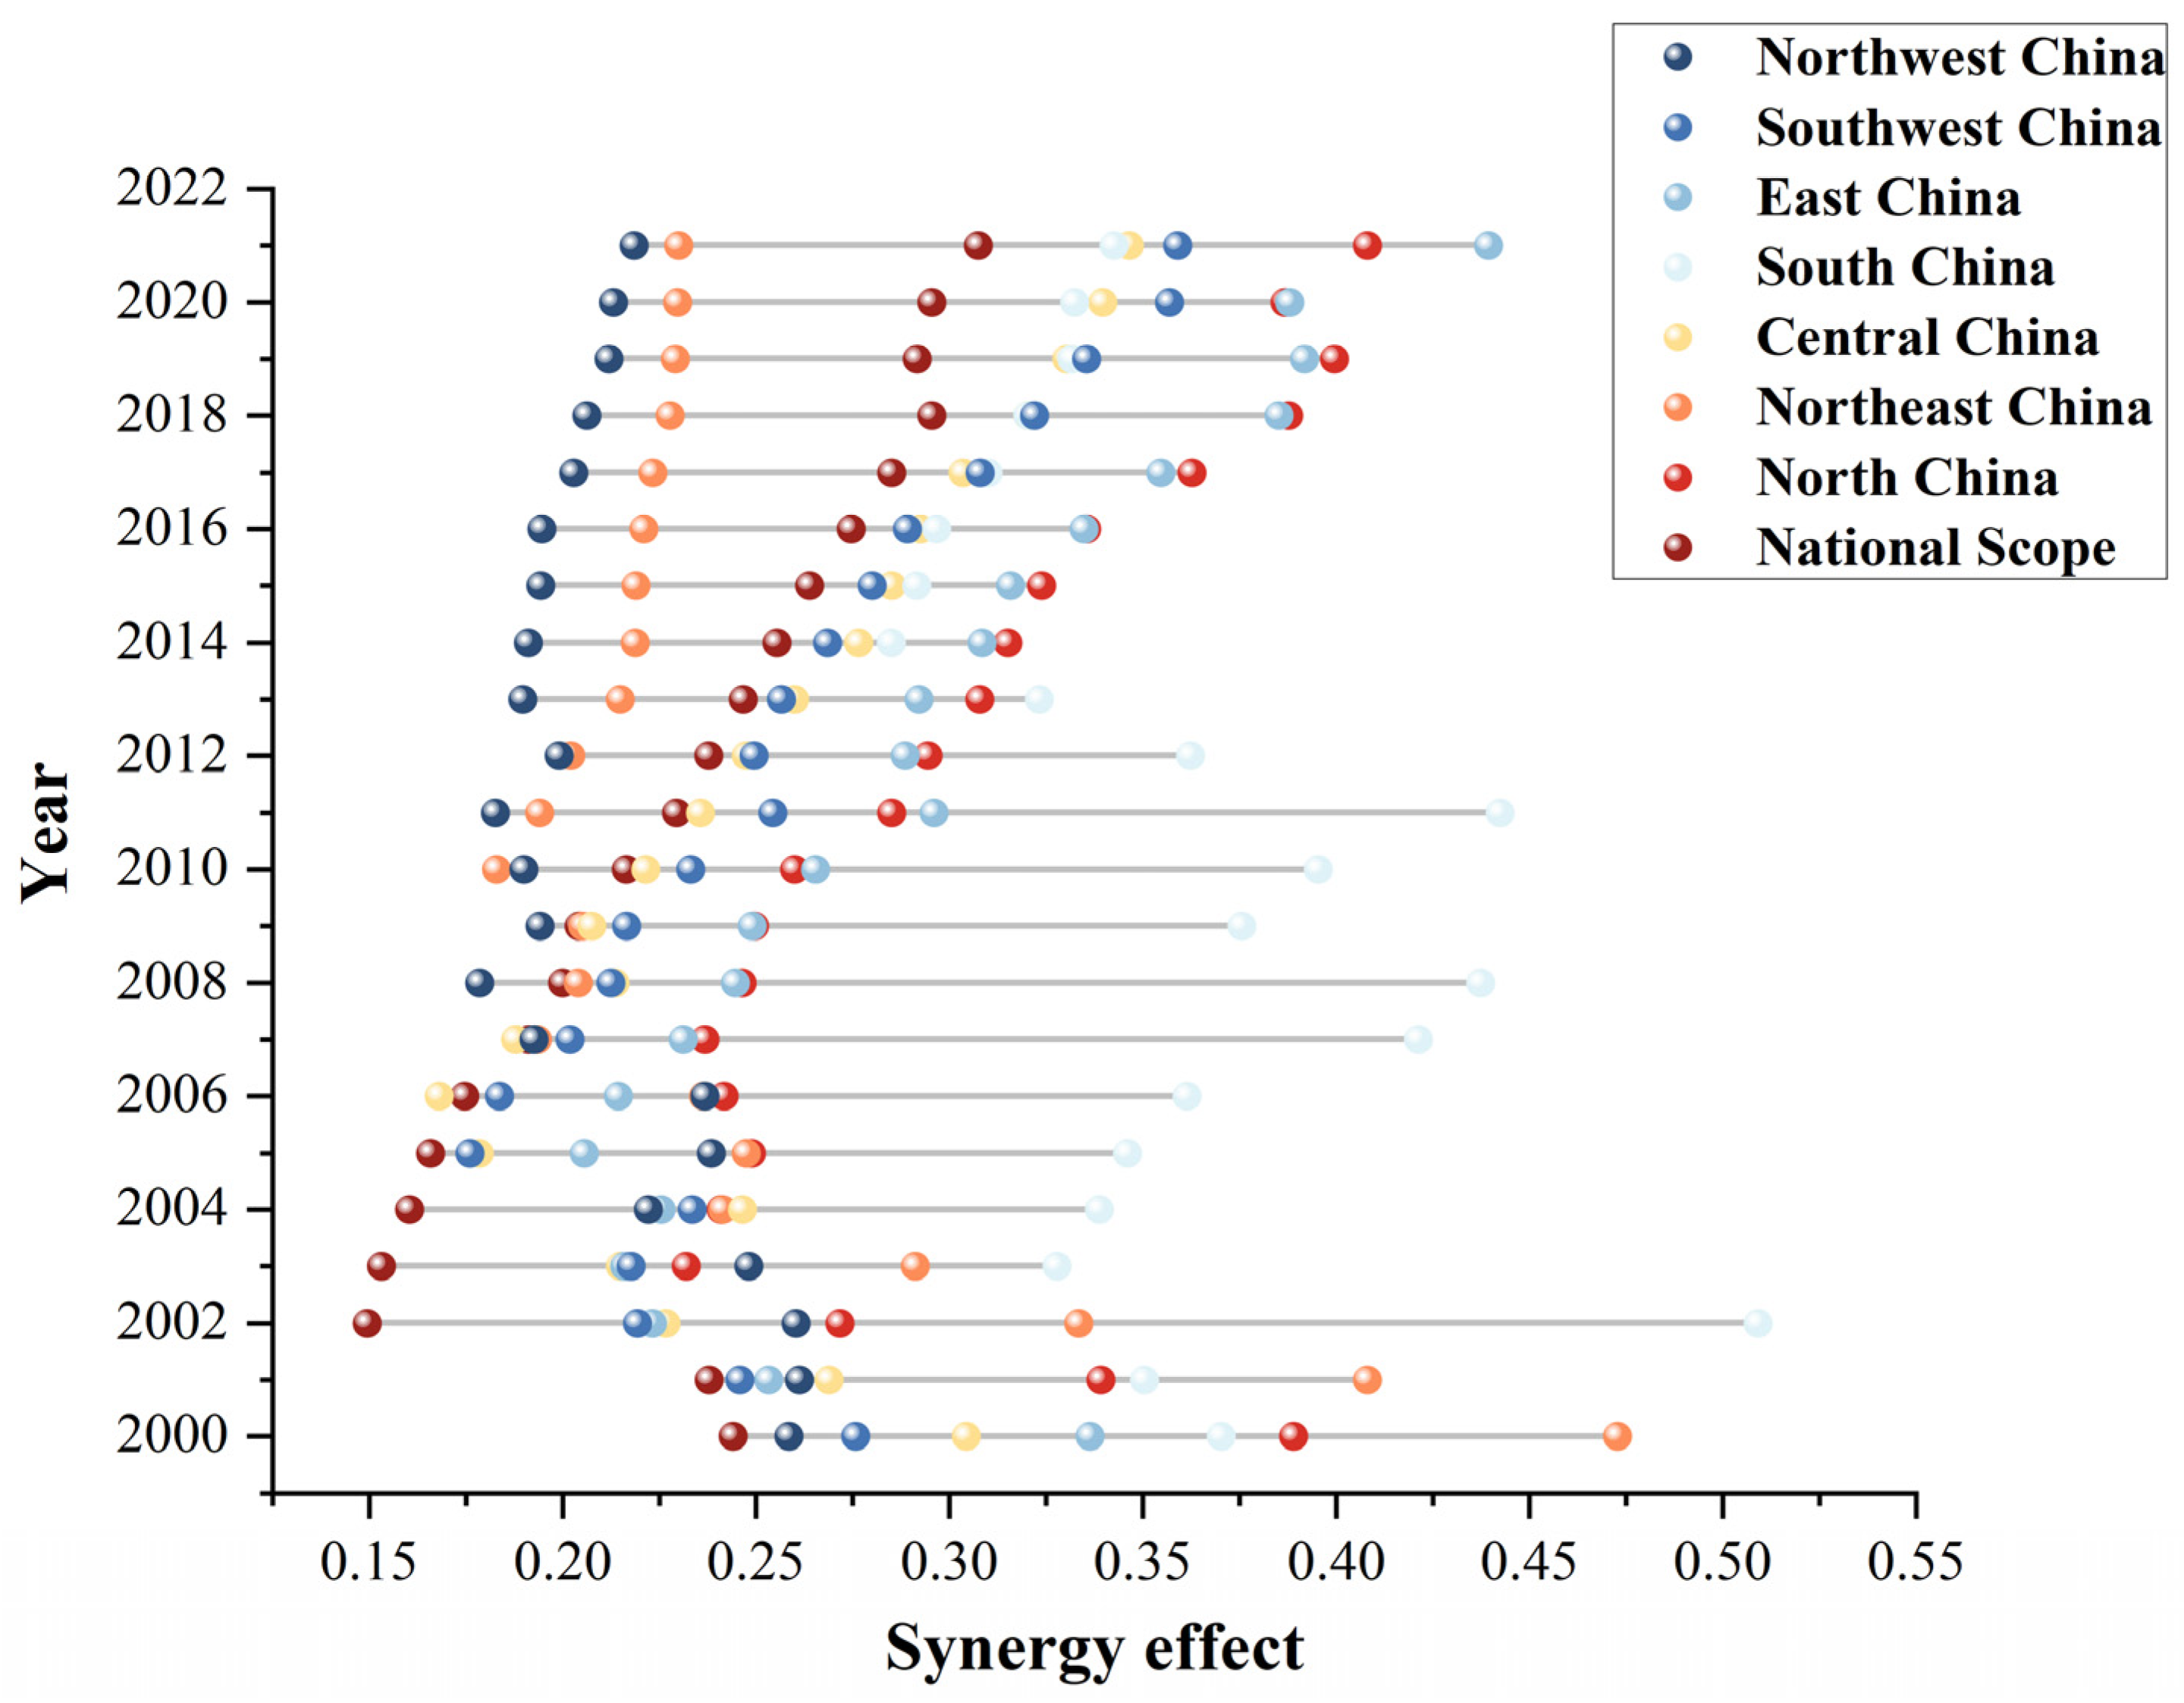
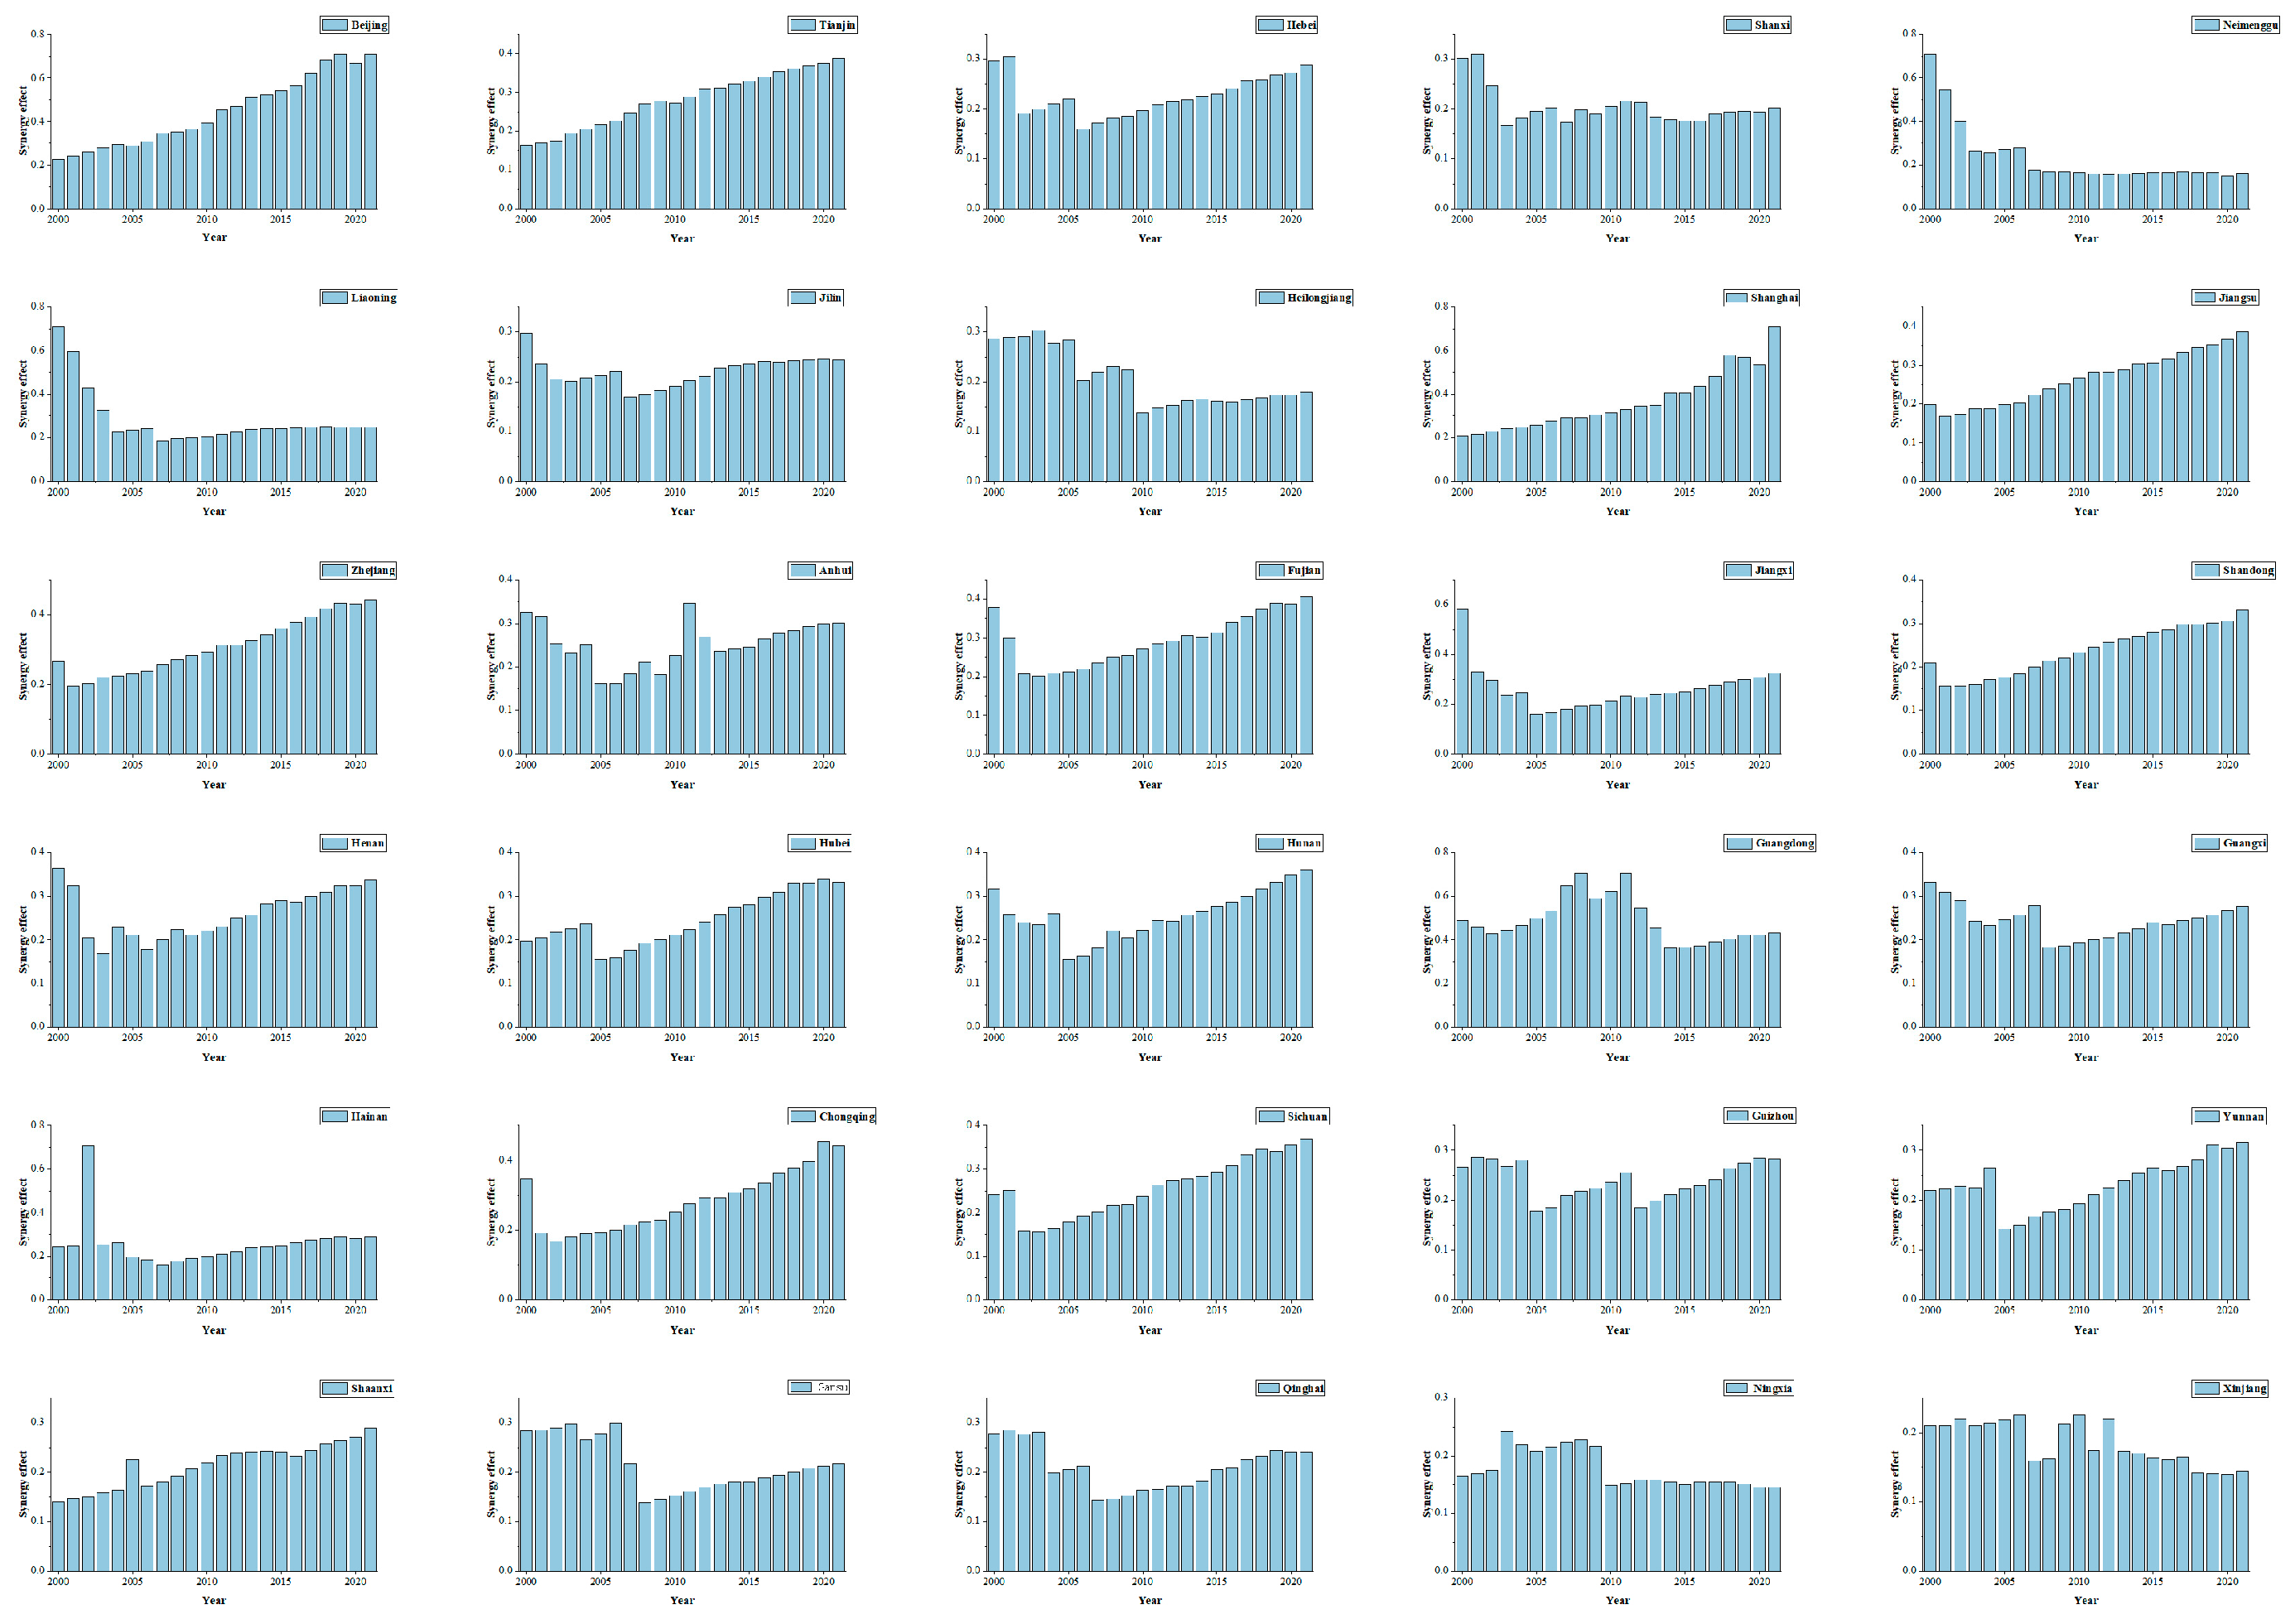
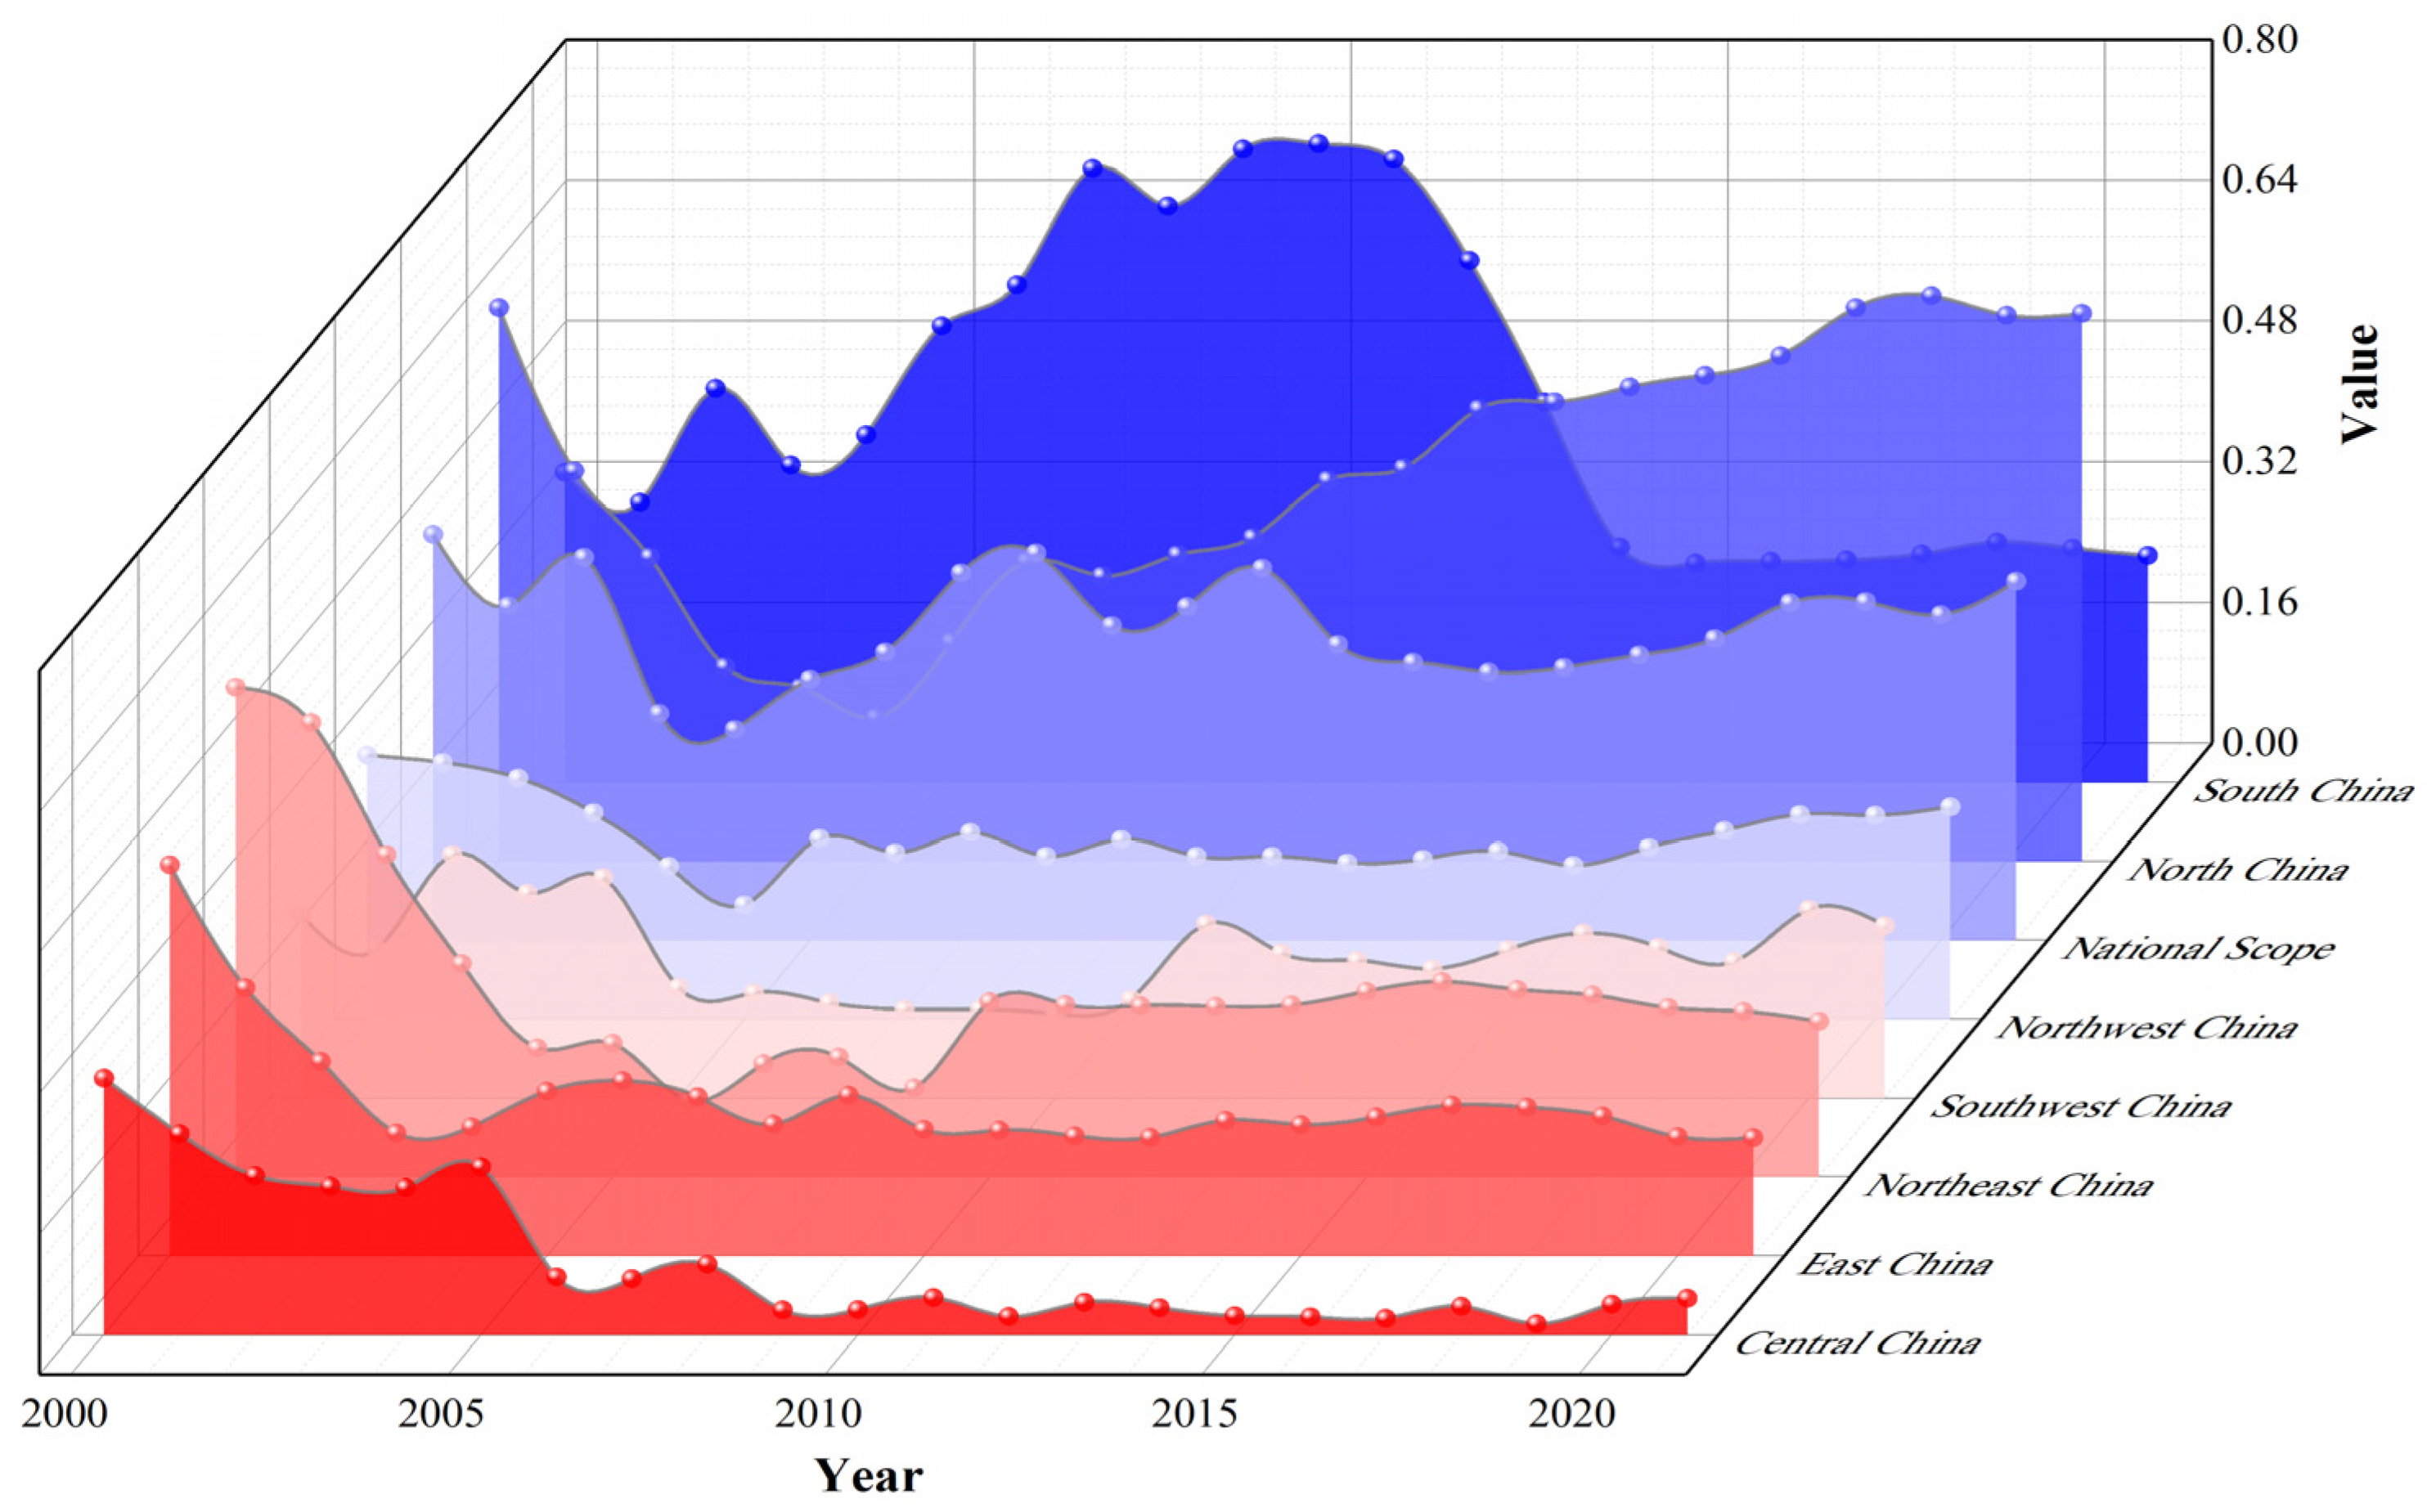
3.2. Temporal Evolution of Water Saving and Carbon Reduction Synergistic Effect

The synergistic effect quantification model further yields the water saving and carbon reduction synergy values. At the national level, the average synergy effect reached 0.231. Due to imperfect coordination mechanisms and the ongoing exploration of policies and technical measures during the initial stage, the synergy effect experienced significant fluctuations, dropping sharply from 0.244 in 2000 to 0.149 in 2002. From 2002 to 2018, it showed continuous and rapid growth, increasing from 0.149 to 0.216, demonstrating a visible synergistic effect. Although the growth rate slightly slowed from 2018 to 2021, it maintained an upward trend. The temporal evolution of the synergy effect at both national and regional levels is illustrated in Figure 3.
During the period 2000–2021, significant synergistic effects were observed across all the regions, exhibiting an overall trend of initial decline followed by growth, which aligns with the evolutionary pattern of national-level water saving and carbon reduction synergy effect.
During 2000–2007, Northeast China experienced significant synergy effect fluctuations characterized by an initial sharp decline followed by stabilization, attributable to delayed economic restructuring that maintained the dominance of energy- and water-intensive heavy industries, resulting in high resource consumption, slow improvements in water-use efficiency, and persistently high carbon emission intensity. Other regions demonstrated distinct patterns: North, East, Central, and Southwest China all showed short-term fluctuating declines before achieving remarkable growth at rates of 75.9%, 113.8%, 106.2%, and 104.0%, respectively, with East China exhibiting the most pronounced synergy enhancement driven by robust development in high-tech industries and modern services. Northwest China followed a similar but more moderate trajectory of initial decline followed by gradual recovery.
At the provincial level, provinces generally showed a downward trend during 2001–2007, while exhibiting a basically stable growth trend during 2007–2020 with only a few exceptions.
The synergy values of municipalities directly under the central government such as Beijing, Tianjin, and Shanghai maintained continuous and rapid growth, while coastal economic powerhouses like Jiangsu, Zhejiang, and Fujian showed steady growth in synergy effect, all surpassing the national average. Among major economic provinces, Shandong’s synergy value increased from 0.156 in 2001 to 0.306 in 2020, and although Guangdong’s synergy value fluctuated, it generally remained at a relatively high level. Provinces with active development in economy, technology, and other aspects including Hebei, Jiangxi, Hainan, Guangxi, and Yunnan saw varying degrees of increase in their synergy values. In recent years, the state has increased policy support and financial investment in the central and western regions, driving significant growth in synergy effect in key western areas like Chongqing and Sichuan. However, Liaoning, Jilin, and Heilongjiang experienced fluctuating declines to varying degrees, and as resource-based provinces, Shanxi and Inner Mongolia showed more obvious downward trends, with their final synergy values being lower than the national average. The evolution process of synergistic effects among 30 provinces and cities is shown in Figure 4.

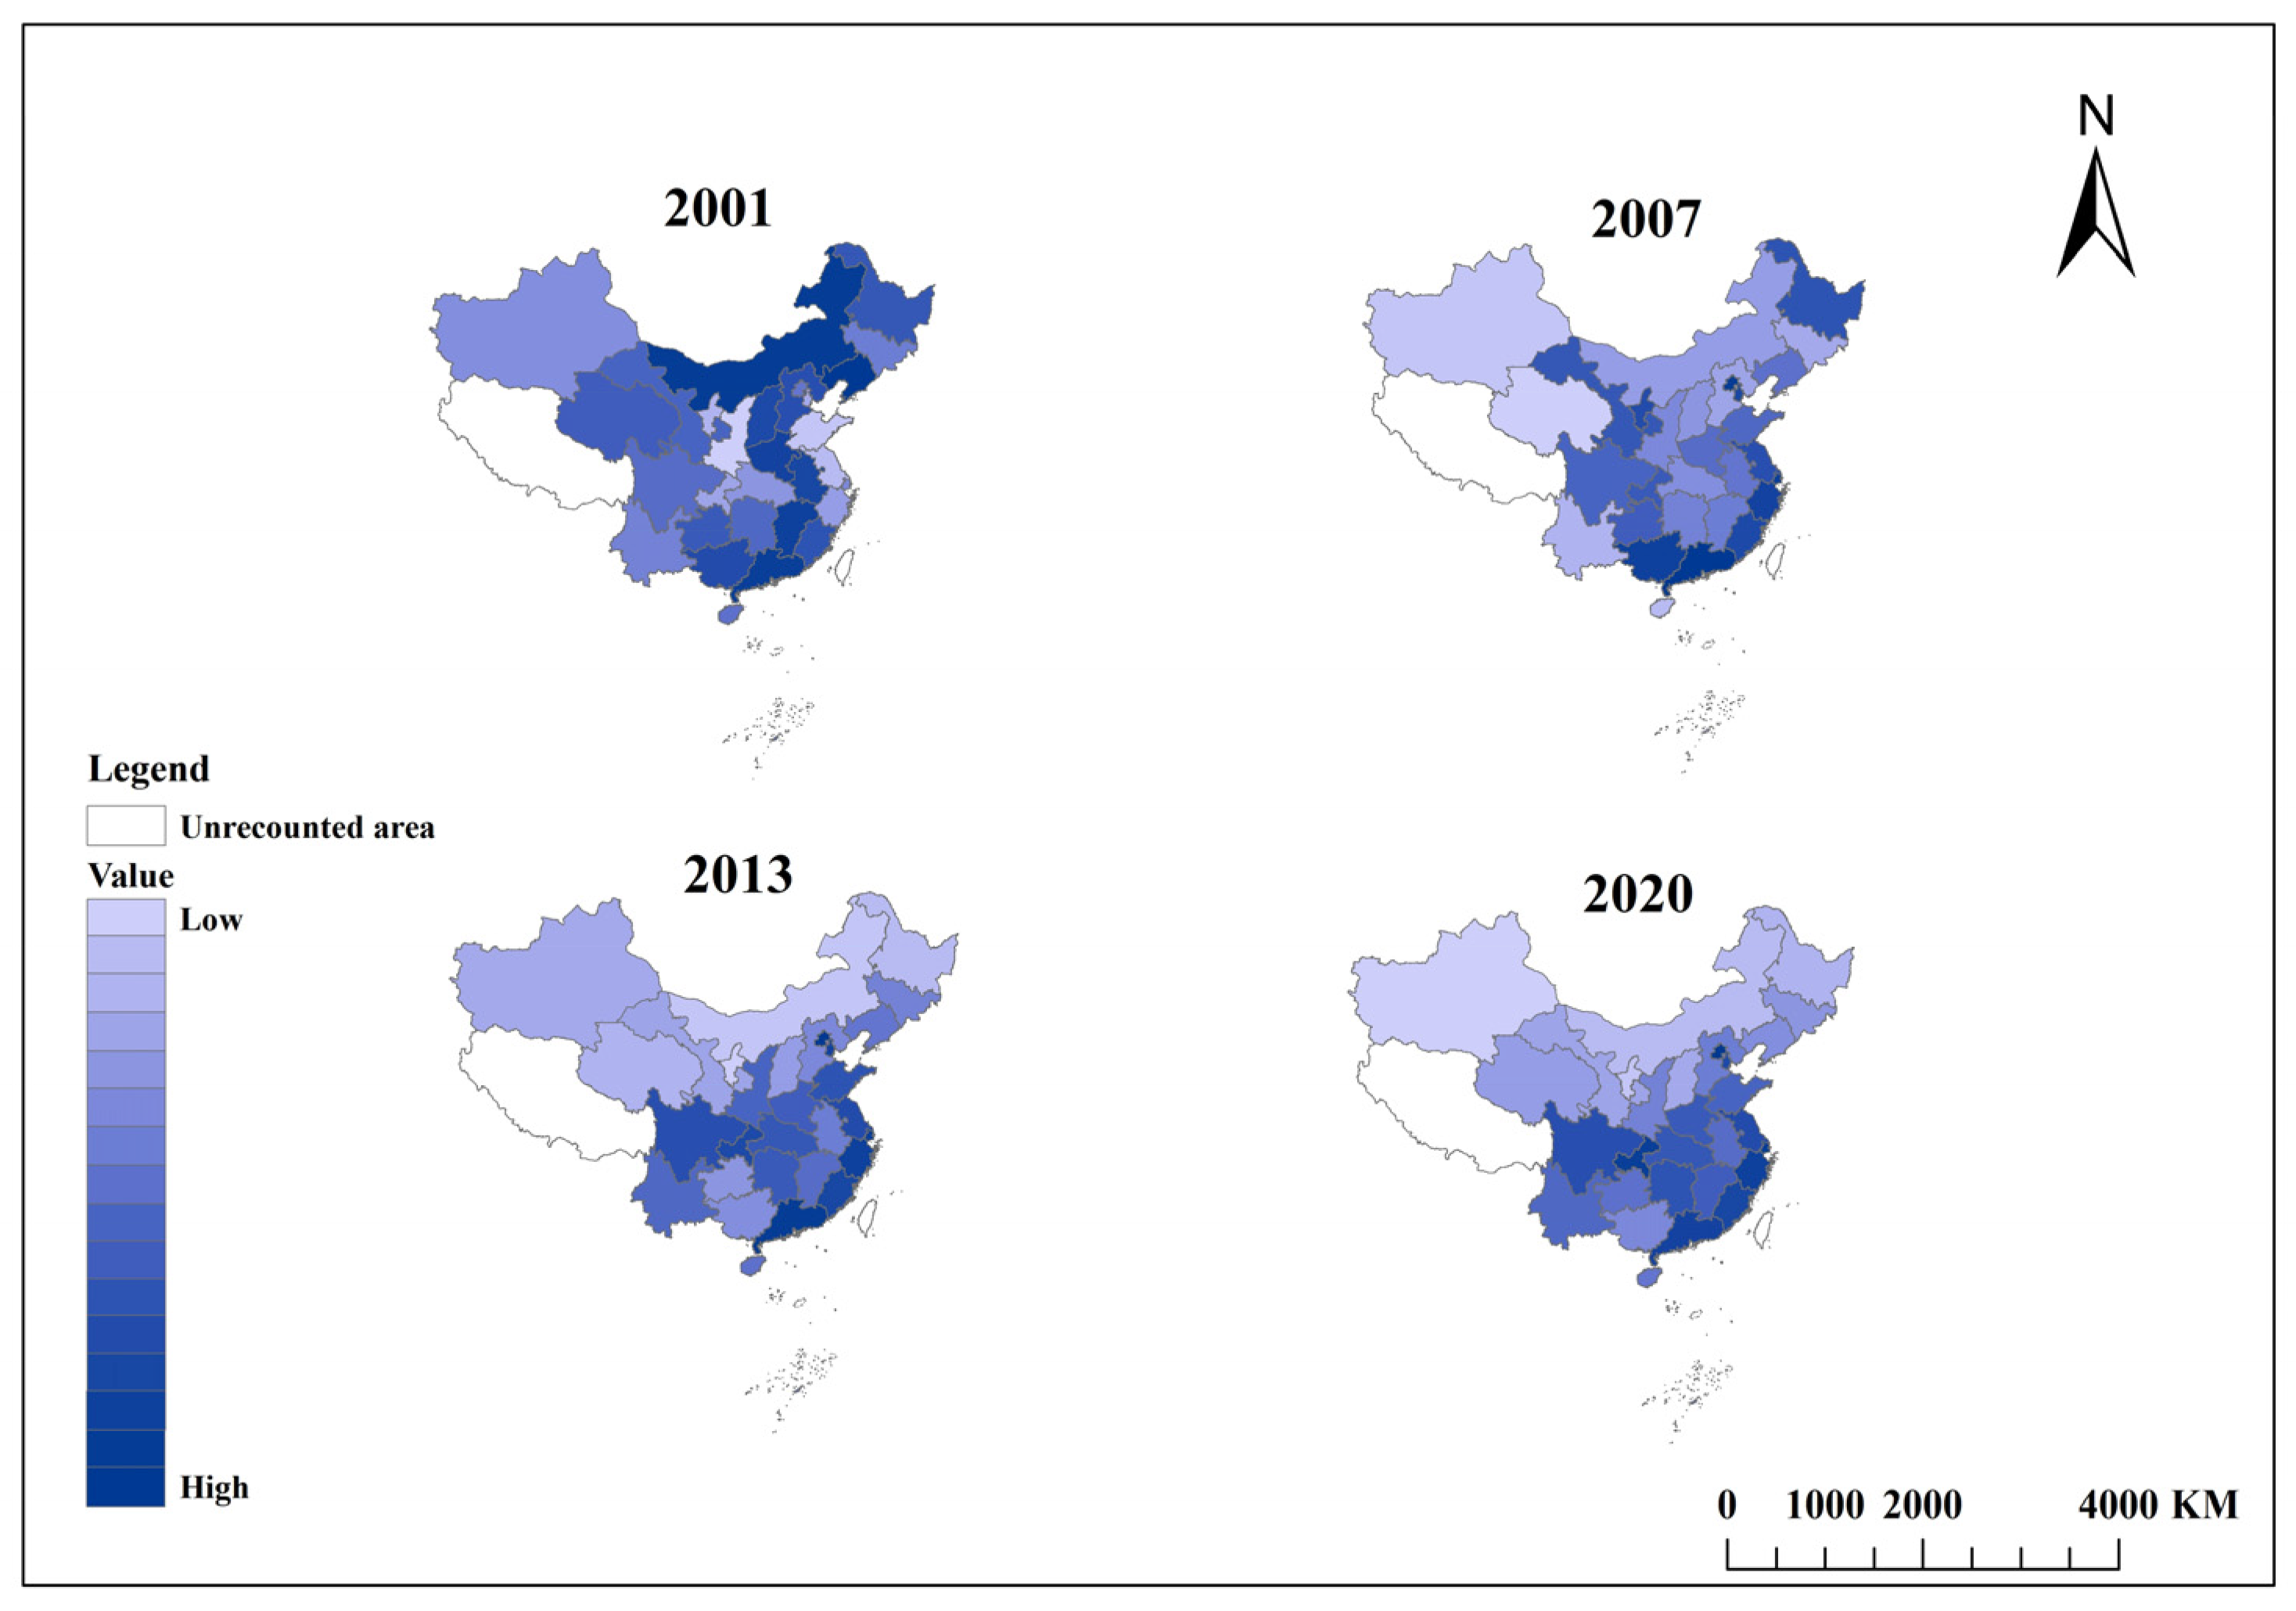
3.3. Spatial Distribution Patterns of Water Saving and Carbon Reduction Synergistic Effect

At the regional level, Northwest China’s arid climate and water scarcity have resulted in relatively higher difficulty and cost for water conservation, coupled with the region’s heavy reliance on high-carbon fossil fuels like coal in its energy mix, leading to substantial carbon emissions from energy consumption. These factors collectively constrain the water–carbon synergy, yielding a below-average synergistic effect of 0.213. While Northeast China’s synergy effect (0.247) exceeds the national average, it remains comparatively lower than other regions. In contrast, East China (0.294), North China (0.307), and South China (0.358) demonstrate significantly better performance in achieving water saving and carbon reduction synergies.
The synergistic effect values of each province/municipality in key years are shown in Figure 5. From 2001 to 2007, the distribution of synergistic effect underwent significant changes, with high-value areas shifting from the western to eastern regions and from the northern to southern parts of China. Between 2013 and 2020, the disparities both within the northern regions and between the northern and southern regions gradually narrowed, indicating a stabilization trend in the spatial distribution of synergistic effect values.
Overall analysis reveals distinct spatial patterns in synergistic effect: The southern provinces generally demonstrate higher values with faster growth rates, while the performance gaps among the high-performing southern regions have progressively narrowed. In contrast, the northern regions like Inner Mongolia and Shanxi showed initially elevated but ultimately stagnant synergy values with limited growth momentum. Regional disparities persist between the eastern and western areas, with the coastal eastern provinces transitioning from single-pole dominance (led by Guangdong and Shanghai) to multi-center collaboration, while the western provinces exhibit growing divergence. Spatially, the high-value clusters of synergistic effect have systematically shifted from the northern to southern regions, developing a “southern acceleration and polarization versus northern structural lock-in” dynamic over time. This evolution has stabilized into a clear spatial pattern characterized by “higher values in southern and eastern regions versus lower values in northern and western areas”.

3.4. Convergence of Water Saving and Carbon Reduction Synergistic Effect

Due to significant disparities in regional resource endowments and production conditions, coupled with divergent development trajectories, this study quantitatively analyzes the convergence characteristics of water saving and carbon reduction synergistic effects. As illustrated in Figure 6, the σ convergence index demonstrates an 11.5% decline at the national level, decreasing from 0.462 in 2000 to 0.409 in 2021, indicating an overall reduction in interprovincial disparities. However, this convergence process exhibits a distinctive three-phase pattern: (1) rapid convergence phase, (2) fluctuating rebound phase, and (3) platform adjustment phase. The analysis reveals stronger convergence tendencies during the earlier stages, while accelerated economic development in the later periods has gradually amplified spatial heterogeneity among provinces, leading to weakened convergence effects.
The convergence characteristics across regions exhibit distinct temporal patterns. In North China and South China, the convergence shows relatively large fluctuations. The σ trend in North China resembles the national pattern, demonstrating a U-shaped rebound—initially decreasing then significantly increasing, indicating pronounced late-stage divergence. Notably, North China recorded the highest σ value nationwide in 2021, with the smallest overall reduction between initial and final periods at just 1.01%. South China displays an inverted U-shaped pattern: early σ values fluctuated upward due to the coexistence of Guangdong’s export-driven economic recovery and Guangxi’s lower efficiency, peaking at 0.727 in 2008, which reflected substantial intra-regional disparities and significant divergence among provinces. Subsequently, the values gradually stabilized, demonstrating Guangdong’s leading and radiating effects. Northwest China shows relatively gradual convergence, with the σ values changing from 0.301 in 2000 to 0.242 in 2021, a 19.6% decrease. Southwest China exhibits weak convergence trends, with the values decreasing by 5.8%. Northeast China, East China, and Central China demonstrate better convergence outcomes with notable spatial convergence. Their σ value reductions reach 68.2%, 69.8%, and 85.7%, respectively. Central China achieved the nation’s lowest σ value at 0.028 in 2009 and maintained stability after 2013, reflecting development level convergence among provincial units in the region. Northeast China shows a fluctuating decline with somewhat prominent volatility, while East China’s convergence σ values display a stepwise decreasing pattern.

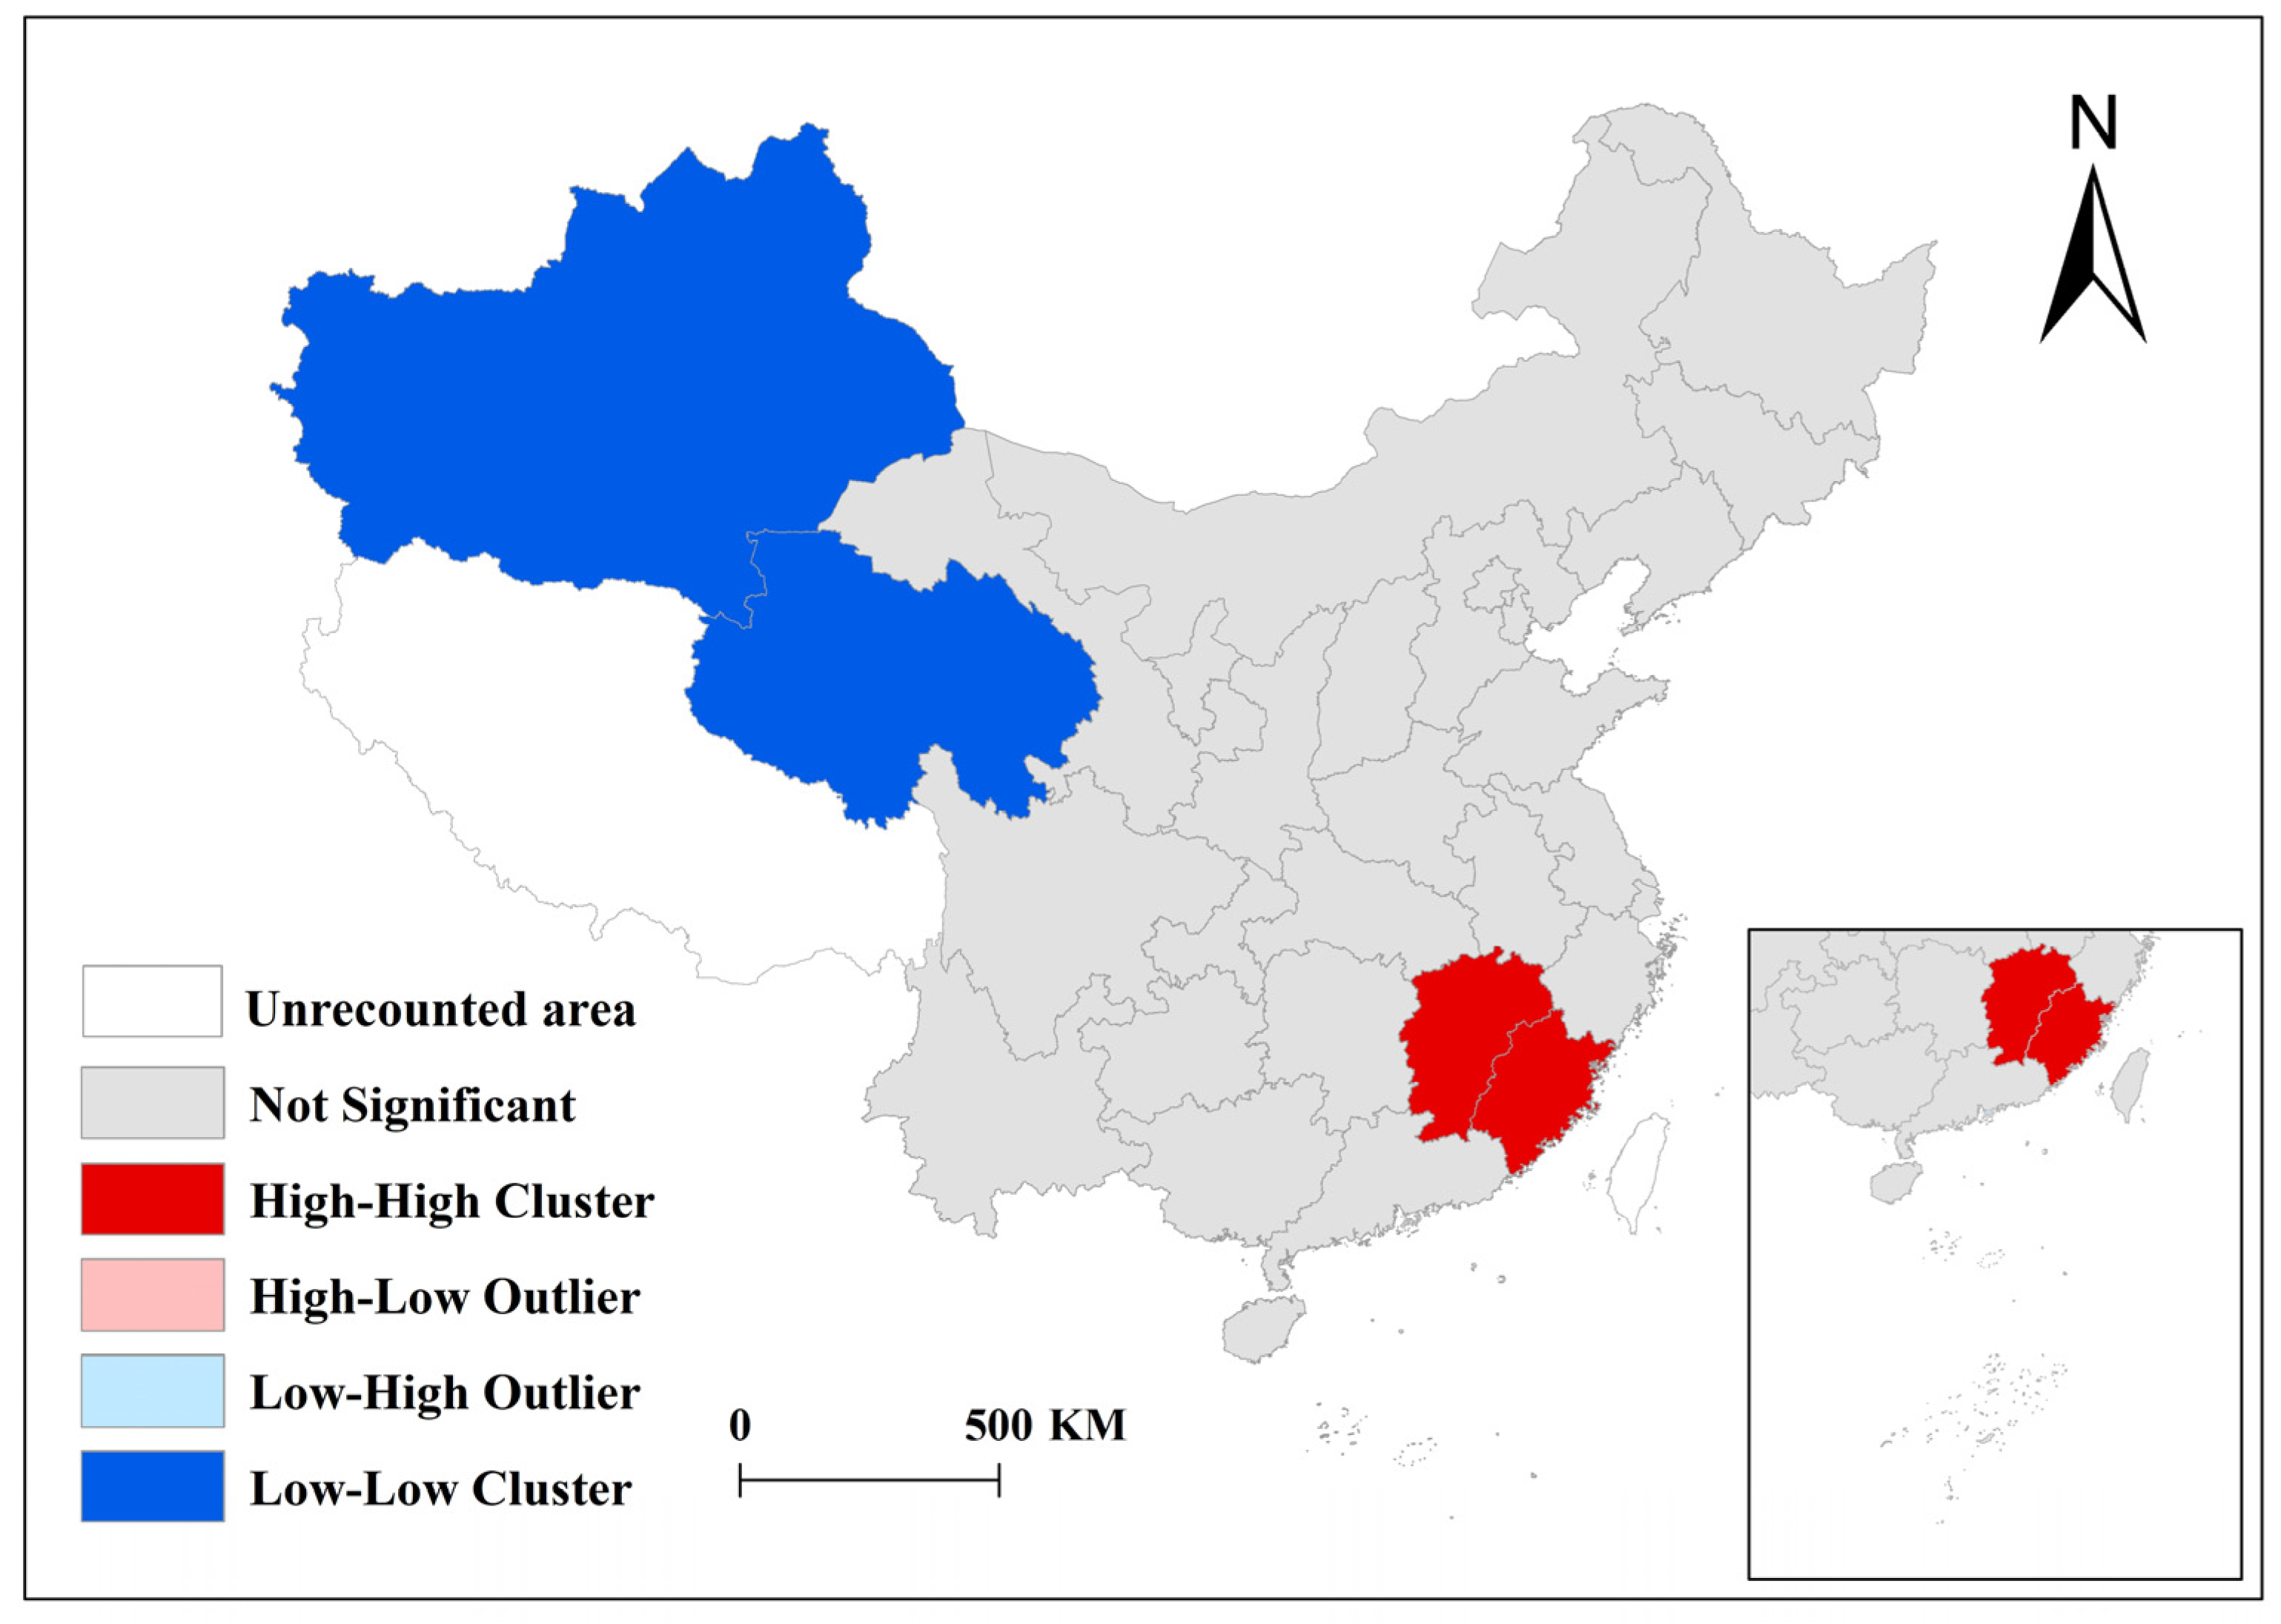
3.5. Spatial Aggregation Characteristics of Water Saving and Carbon Reduction Synergistic Effect

The convergence analysis reveals the temporal variation of overall disparities but fails to capture local interdependencies among spatial units. The Local Moran’s I index was employed to examine spatial clustering, further identifying whether high-value or low-value spatial agglomerations exist. Overall, Figure 7 clearly demonstrates significant spatial clustering characteristics of water saving and carbon reduction synergistic effects across China’s provinces. When provinces with a high synergistic effect are surrounded by other high-value provinces, distinct “high–high” clusters emerge; conversely, when low-value provinces are bordered by other low-value provinces, clear “Low–Low” clusters form. As shown in Figure 7, the “high–high” clusters are predominantly distributed in the eastern and southeastern coastal regions, primarily encompassing Fujian and Jiangxi provinces, establishing positive spatial autocorrelation and serving as exemplary models. In contrast, the northwestern regions, mainly Qinghai and Xinjiang provinces, exhibit “low–low” clustering patterns. Although their synergistic effect remains relatively underdeveloped, they similarly demonstrate positive spatial autocorrelation. Notably, the analysis reveals no “high–low” or “low–high” clusters, indicating the absence of significant spatial outliers.
Among these regions, Fujian and Xinjiang exhibit relatively strong spatial autocorrelation, with Local Moran’s I values of 0.648 and 0.490, respectively, indicating high similarity in attribute values with their neighboring areas. Jiangxi and Qinghai demonstrate weaker but still statistically significant local spatial clustering, with Local Moran’s I values of 0.170 and 0.192. The Z-Scores for Fujian (2.096), Jiangxi (1.956), Qinghai (1.603), and Xinjiang (1.696) all exceed the threshold of 1.6, effectively ruling out the possibility of random spatial clustering. Furthermore, the p-values for these provinces range between 0.015 and 0.046 (all below 0.05), providing additional confirmation of statistically significant spatial aggregation patterns.

4. Discussion

4.1. Why Is “1 + 1 > 2”? Are There Significant Differences Among Different Regions?

According to the calculation results presented above, the characteristic of “1 + 1 > 2” is reflected at both the national and regional levels. At the national level, the collaborative performance is 87.1% higher than the individual performance. Among all the regions, the South China region has the highest growth rate of collaborative performance compared to individual performance, reaching 106.3%, which is far above the national average level. The main reason is that considering the dual goals of water saving and carbon reduction in a coordinated manner can integrate resources, achieve optimal allocation, and maximize the utilization efficiency. It can also promote technological complementarity and innovation, improve policy implementation efficiency, realize economies of scale, and share risks, thereby achieving more efficient water saving and carbon reducing effects.
Although the collaborative performance values of all the regions are generally higher than the individual performance values, there are differences in the collaborative performance values and growth rates among different regions. Among them, the North China, South China, and East China regions have higher collaborative performance values. The North China region shows the most significant trend of first decreasing and then increasing. The South China region, with its vibrant market economy, has frequent fluctuations in its collaborative performance value. Meanwhile, technological progress and innovation provide support for the improvement of performance values, resulting in a steady increase in its collaborative performance value since 2016. The East China region, with its developed economy and a high degree of opening up, can attract more external resources and cooperation opportunities. Its performance growth started earlier and is relatively faster. The sharing of resources and complementary advantages within the region promotes the synchronous improvement of collaborative performance, making the collaborative performance values of the Central China and Southwest China regions relatively synchronized. The collaborative performance values of the Northeast and Northwest regions are relatively low. The Northeast region, which underwent industrial structure adjustment in the early stage, experienced a significant decline in its collaborative performance value. The Northwest region, with its weak economic foundation and relatively slow technological progress, and a relatively stable policy environment, shows stable and slow growth in its collaborative performance.

4.2. Why Does the Synergistic Effect Exhibit a Spatially Clustered Distribution of “High in the Southeast and Low in the Northwest” Across Different Regions?

The σ-convergence analysis in this study reveals the temporal variation characteristics of spatial disparities among China’s regions. The seven major regions of China can be classified into three categories: significant convergence regions, slow convergence regions, and divergent regions. Specifically, Northeast China, East China, and Central China exhibit notable spatial convergence, with provincial development levels gradually aligning, categorizing them as significant convergence regions. Northwest China shows a relatively slow convergence trend, while Southwest China demonstrates weak convergence, reflecting a lag in balanced development and thus classifying them as slow convergence regions. In contrast, South China recorded the highest nationwide divergence value during the mid-term period, indicating significant disparities among its provinces, whereas North China experienced a marked increase in divergence in later stages, reflecting widening intra-regional differences—both regions are thus identified as divergent regions.
Recognizing that a single convergence indicator may obscure spatial heterogeneity, this study incorporates the Local Moran’s I Index for spatial clustering analysis to identify the significance of regional spatial aggregation patterns. Fujian and Jiangxi exhibit high–high clustering characteristics, indicating a high degree of similarity with neighboring provinces in the observed variables. In contrast, Qinghai and Xinjiang display low–low clustering features, reflecting their low-level consistency with adjacent regions. Notably, no “high–low” or “low–high” outlier clusters were detected, suggesting that spatial correlations between provinces and their surrounding areas are primarily characterized by coordinated variation rather than significant disparities.
Since the convergence analysis and agglomeration analysis reflect the different concepts of “whether the differences are narrowing” and “whether there is spatial dependence”, respectively, by considering the results of both analyses, it is found that although the Northeast and Central China regions show convergence in space, they have not formed local high-/low-value clusters, which to some extent reflects the characteristics of homogeneous development. However, the Northwest region shows agglomeration without convergence due to the existence of growth polarization.
The agglomeration characteristics of the synergistic effect among provinces and cities nationwide show significant spatial differences in the clustering of high and low values. This spatial distribution pattern is shaped by the combined influence of various factors, including natural conditions and resource endowments, economic development and industrial layout, population density and urbanization levels, and geographical location and external cooperation. In other words, it is driven by the triple forces of “nature, economy, and policy.” The high-value agglomeration (H-H) in the southeast is the result of the combined effects of favorable natural conditions, high economic levels, and strong policy and technological support. In contrast, the low-value agglomeration (L-L) in the northwest is constrained by resource shortages, extensive industrial practices, and lagging technology.
Water saving and carbon reduction synergy effect, as a key pathway to achieving the dual-carbon goals, is not only subject to the rigid constraints of water resource distribution but also relies on the transformation momentum provided by regional economic development levels. It is essential to explore the consistency between the synergy effect and the spatial distribution of water resources and economic benefits:
(1)
Partial Consistency and Significant Exceptions with Water Resource Distribution
High Synergy–High Water Resources Areas: Southern provinces such as the Yangtze River Delta (Jiangsu, Zhejiang) and the Pearl River Delta (Guangdong) have abundant water resources (Yangtze and Pearl River basins) and high synergy effect values.
Low Synergy–Low Water Resources Areas: The arid northwestern region (Xinjiang, Qinghai, Ningxia) has scarce water resources and long-term lowest synergy effect values nationwide.
High Synergy–Low Water Resources Areas: Municipalities directly under the central government like Beijing and Shanghai have water scarcity but maintain a high synergy effect through inter-regional water transfer and policy advantages.
Low Synergy–High Water Resources Areas: Some southwestern provinces (e.g., Yunnan, Guizhou) have abundant water resources but relatively low synergy effect values, indicating that water resources are not the sole determinant of the synergy effect.
(2)
High Consistency with Economic Benefit Distribution
High Synergy–High Economic Effect Areas: Eastern coastal economic powerhouses (Guangdong, Jiangsu, and Zhejiang) lead in both synergy effect and economic level. Economic agglomeration effects promote the cross-regional flow of resources, technology, and talent. The high value-added industries (finance and technology) in municipalities (Beijing and Shanghai) further reinforce the mutual enhancement of the economy and synergy.
Low Synergy–Low Economic Effect Areas: Economically lagging regions in the northwest (Qinghai and Xinjiang) and southwest (Guizhou) generally have low synergy effect values. Their weak economic foundations result in insufficient demand and capacity for collaboration.

4.3. Policy Implications

(1)
Formulating regionally differentiated policies based on heterogeneous synergistic effects
For regions with high synergistic effects (e.g., Beijing, Shanghai, and Guangdong), policies should further leverage their leading role in driving innovation resource spillover to neighboring areas, thereby enhancing regional collaborative development. In contrast, regions with low synergistic effects (e.g., Ningxia, Xinjiang, and Qinghai) require strengthened infrastructure development, optimized industrial layouts, and targeted policy support to attract talent and capital, ultimately improving their regional coordination capacity.
(2)
Targeting clustered regions as strategic breakthroughs, this study proposes differentiated approaches to enhance synergistic effect.
For high–high clusters (e.g., Fujian and Jiangxi), policy priorities should strengthen regional connectivity and amplify spillover effects through technology diffusion, talent mobility, and data-sharing platforms, thereby transforming spontaneous coordination into strategic pivots, while guarding against “siphon effects” that may excessively drain neighboring resources; for low–low clusters (e.g., Qinghai and Xinjiang), key measures include ecological value conversion, precision industrial upgrading, and cross-regional compensation mechanisms (e.g., “Western Water–Eastern Carbon” bilateral compensation) to break path dependence.
(3)
Focusing on key influencing factors to strengthen the convergence trend of synergistic effect
The convergence of water–carbon synergy is affected by technological maturity and compatibility, economic scale and industrial structure, natural and social conditions, and inter-regional cooperation. To enhance this convergence, multidimensional interventions are required across technology, policy, economics, and social dimensions. Technologically, priority should be given to developing integrated systems like photovoltaic drip irrigation and wastewater energy recovery, combined with digital platforms for dynamic resource allocation optimization. Policy-wise, it is crucial to design water–carbon bundled indicators and link water rights with carbon trading markets. Concurrently, water–carbon coupling models should be established to evaluate policy effectiveness while actively incorporating international best practices. Through data transparency, policy flexibility, and equity safeguards, the water–carbon synergy can evolve from fluctuation to stable convergence, achieving dual environmental and economic benefits.

4.4. Research Prospects

This study has preliminarily explored the comparative relationship between individual and collaborative water saving and carbon reduction performance at the national and provincial levels, the characteristics of changes in synergistic effect, and their spatial distribution. It aims to provide a scientific basis for formulating more effective water saving and carbon reduction policies. The future research directions and prospects are as follows:
(1)
Focus on intra-regional differences and explore effective models of collaborative water saving and carbon reduction efforts in different types of cities. There are significant differences in economic development levels, industrial structures, resource endowments, and environmental carrying capacities across regions, all of which can affect the performance of water saving and carbon reduction initiatives. Therefore, future research could analyze the collaborative effects of water saving and carbon reduction efforts based on different types of cities (such as industrial cities, tourist cities, and agricultural cities) and summarize effective models of collaborative water saving and carbon reducing efforts for different types of cities.
(2)
Conduct a systematic analysis of the specific driving factors behind the changes in the synergistic effect of water saving and carbon reduction efforts. The changes in synergistic effects are influenced by a variety of factors, including policy orientation, technological progress, public awareness, and market mechanisms. Future research can identify the key driving factors affecting the changes in synergistic effects through both quantitative and qualitative analyses, and explore how these factors interact with each other to jointly influence the synergistic effect of water saving and carbon reduction efforts.
(3)
Compare domestic and international management cases. By comparing successful cases of water saving and carbon reduction efforts both domestically and internationally, summarize the experiences and lessons learned in collaborative management from different countries and regions. Conduct comparative analyses in terms of policy design, implementation process, and effectiveness evaluation, and distill experiences and practices that can be referenced in China, providing new ideas and insights for China’s collaborative management of water saving and carbon reduction efforts.

5. Conclusions

Based on water saving and carbon reduction performance data at the national and regional levels from 2000 to 2021, this study systematically analyzed the temporal evolution patterns, spatial distribution characteristics, and convergence trends of the synergy effect, and explored its driving mechanisms and policy implications. The main conclusions are as follows:
(1)
The collaborative performance is significantly better than the individual performance, showing the characteristic of “1 + 1 > 2”.
At the national level, both the collaborative and individual performances in water saving and carbon reducing efforts show an upward trend. The average collaborative performance (0.212) is significantly higher than the individual performance (0.114). Moreover, the increase in collaborative performance is more pronounced in most regions, which reflects the high efficiency of collaborative promotion in integrating resources and achieving dual goals.
(2)
The temporal evolution of the synergistic effect in most provinces and cities shows a trend of fluctuating upward.
Nationally, although the synergistic effect value initially fluctuated significantly, it has been on a continuous upward trend since 2002, with the growth rate stabilizing after 2018. In different regions, from 2000 to 2021, the synergistic effect was significantly present and exhibited a similar evolution trend of first decreasing and then increasing as the national synergistic effect of water saving and carbon reduction efforts.
(3)
At the national level, the spatial convergence of the synergistic effect shows a “three-stage” change trend, and the convergence changes in different regions have different characteristics.
From 2001 to 2007, there were significant spatial distribution changes in the synergistic effect values, with high values shifting from the west to the east and from the north to the south. Between 2013 and 2020, the distribution of synergistic effect values tended to stabilize. Analyzing the spatial convergence of the synergistic effect at the national level, the provinces initially showed strong convergence, but later, with the rapid economic development, the spatial differences among different provinces gradually increased, and the convergence gradually weakened. Considering the regions separately, East China and Central China achieved the best convergence results (with a reduction of over 68%), while North China and South China showed significant differentiation, and Northwest China had slow convergence.
(4)
The spatial agglomeration distribution of the synergistic effect shows the characteristic of being “high in the southeast and low in the northwest.”
The southeastern coastal areas (such as Fujian and Jiangxi), with their developed economies, advanced technologies, and strong policy coordination, form a “high–high” agglomeration with significant demonstration effects. The northwestern regions (such as Qinghai and Xinjiang), constrained by resource shortages and extensive industrial practices, show a “low–low” agglomeration.

Supplementary Materials

The following supporting information can be downloaded at: https://www.mdpi.com/article/10.3390/w17131847/s1, This article has Additional Materials and they are presented in the Supplementary. Supplementary File: Water consumption.xlsx, Labor force.xlsx, GDP.xlsx, Energy consumption (water usage).xlsx, Energy consumption (10,000 tons of standard coal).xlsx.

Author Contributions

Conceptualization, J.Z.; methodology, H.L.; software, Z.L.; validation, Y.J. and W.M.; formal analysis, H.L.; investigation, J.Z.; resources, Z.L.; data curation, Y.J.; writing—original draft preparation, J.Z.; writing—review and editing, H.L.; visualization, H.L.; supervision, W.M.; project administration, J.Z. All authors have read and agreed to the published version of the manuscript.

Funding

This study was supported by the National Key Research and Development Program [2023YFC3206802].

Data Availability Statement

Data are contained within the article and Supplementary Materials.

Acknowledgments

We are grateful to the reviewers and the editor for their constructive suggestions, which have helped us a lot in improving the quality of the paper.

Conflicts of Interest

The authors declare no conflicts of interest.

References

  1. Liu, Z.; Deng, Z.; Zhu, B.Q.; Ciais, P.; Davis, S.J.; Tan, J.G.; Andrew, R.M.; Boucher, O.; Arous, S.B.; Canadell, J.G.; et al. Global patterns of daily CO2 emissions reductions in the first year of COVID-19. Nat. Geosci. 2022, 15, 615–620. [Google Scholar] [CrossRef]
  2. Hu, Q.F.; Chen, J.; Wang, H.J.; Su, X.; Zhang, G.R.; Liu, L. Synergistic Development of Water-saving and Energy under the Dual-carbon Goals. China Water Resour. 2024, 15, 39–44. [Google Scholar]
  3. Jin, Y.; Tang, X.; Feng, C.Y.; Mikael, H. Energy and water conservation synergy in China: 2007–2012. Resour. Conserv. Recycl. 2017, 127, 206–215. [Google Scholar] [CrossRef]
  4. Ayres, R.U.; Walter, J. The greenhouse effect: Damages costs and abatement. Environ. Resour. Econ. 1991, 1, 237–270. [Google Scholar] [CrossRef]
  5. Scovronick, N.; Budolfson, M.; Dennig, F.; Errickson, F.; Fleurbaey, M.; Peng, W.; Socolow, R.H.; Spears, D.; Wagner, F. The impact of human health co-benefits on evaluations of global climate policy. Nat. Commun. 2019, 10, 2095. [Google Scholar] [CrossRef]
  6. Huang, X.Y.; Srikrishnan, V.; Lamontagne, J.; Keller, K.; Peng, W. Effects of global climate mitigation on regional air quality and health. Nat. Sustain. 2023, 6, 1054–1066. [Google Scholar] [CrossRef]
  7. Wang, P.; Lin, C.K.; Wang, Y. Location-specific co-benefits of carbon emissions reduction from coal-fired power plants in China. Nat. Commun. 2021, 12, 6948. [Google Scholar] [CrossRef]
  8. Wang, T.Y.; Jiang, Z.; Zhao, B.; Gu, Y.; Liou, K.N.; Kalandiyur, N.; Zhang, D.; Zhu, Y.F. Health co-benefits of achieving sustainable net-zero greenhouse gas emissions in California. Nat. Sustain. 2020, 3, 597–605. [Google Scholar] [CrossRef]
  9. Tong, D.; Geng, G.N.; Zhang, Q.; Cheng, J.; Qin, X.Y.; Hong, C.P.; He, K.B.; Davis, S.J. Health co-benefits of climate change mitigation depend on strategic power plant retirements and pollution controls. Nat. Clim. Change 2021, 11, 1077–1083. [Google Scholar] [CrossRef]
  10. Wang, Y.H.; Wen, Z.G.; Lv, X.J.; Tao, Y.A.; Zhu, J.M. The spatial heterogeneity of synergy and trade-off linkages between carbon and air pollutant mitigations in China’s steel industry. J. Clean. Prod. 2023, 418, 138166. [Google Scholar] [CrossRef]
  11. Tan, Q.; Wen, Z.G.; Chen, J.J. Goal and technology path of CO2 mitigation in China’s cement industry: From the perspective of co-benefit. J. Clean. Prod. 2016, 114, 299–313. [Google Scholar] [CrossRef]
  12. Shi, X.H.; Huang, Z.N.; Dai, Y.T.; Du, W.Y.; Cheng, J.P. Evaluating emission reduction potential and co-benefits of CO2 and air pollutants from mobile sources: A case study in Shanghai, China. Resour. Conserv. Recycl. 2024, 202, 107347. [Google Scholar] [CrossRef]
  13. Zhong, L.; Liu, X.S.; Ao, J.F. Spatiotemporal dynamics evaluation of pixel-level gross domestic product, electric power consumption, and carbon emissions in countries along the belt and road. Energy 2022, 239, 121841. [Google Scholar] [CrossRef]
  14. Yu, S.; Zhang, S.; Zhang, Z.J.; Huo, Y.Z.; Liu, T.K. Evaluation of the synergistic control effect of atmospheric pollutants and greenhouse gases during the 14th Five Year Plan period in Beijing. J. Environ. Sci. 2022, 42, 499–508. [Google Scholar] [CrossRef]
  15. Tang, X.B.; Zhang, Y.; Cao, L.Z.; Zhang, J.M.; Chen, X.H. The spatiotemporal characteristics and impact mechanism analysis of the synergistic effect of pollution reduction and carbon reduction in China. Environ. Sci. Res. 2022, 35, 2252–2263. [Google Scholar] [CrossRef]
  16. Zhang, C.; Shi, D.; Li, P.F. Potential benefits of implementing inter provincial carbon emissions trading in China. Financ. Trade Econ. 2017, 38, 93–108. [Google Scholar]
  17. Steinbuks, J.; Narayanan, B.G. Fossil Fuel Producing Economies Have Greater Potential for Industrial Interfuel Substitution. Energy Econ. 2015, 47, 168–177. [Google Scholar] [CrossRef]
  18. Wakeel, M.; Chen, B.; Hayat, T.; Alsaedi, A.; Ahmad, B. Energy consumption for water use cycles in different countries: A review. Appl. Energy 2016, 178, 868–885. [Google Scholar] [CrossRef]
  19. Sowby, R.B.; Capener, A. Reducing carbon emissions through water conservation: An analysis of 10 major U.S. cities. Energy Nexus 2022, 7, 100094. [Google Scholar] [CrossRef]
  20. Valek, A.M.; Sušnik, J.; Grafakos, S. Quantification of the urban water-energy nexus in México City, México, with an assessment of water-system related carbon emissions. Sci. Total Environ. 2017, 590, 258–268. [Google Scholar] [CrossRef]
  21. Gu, Y.F.; Dong, Y.N.; Wang, H.T.; Arturo, K.; Xu, J.; Thomas, C.; Li, F.T. Quantification of the water, energy and carbon footprints of wastewater treatment plants in China considering a water−energy nexus perspective. Ecol. Indic. 2016, 60, 402–409. [Google Scholar] [CrossRef]
  22. Zhao, R.Q.; Yu, J.; Xiao, L.G.; Sun, J.; Luo, H.L.; Yang, W.J.; Chuai, X.W.; Jiao, S.X. Research on Carbon Emissions of Urban Water Systems Based on the Correlation of “Water-Energy-Carbon”. J. Geogr. Sci. 2021, 76, 3119–3134. [Google Scholar]
  23. Zhu, Y.X. Research on Energy Consumption Evaluation Method for the Whole Process of Social Water Cycle. Master’s Thesis, China Institute of Water Resources and Hydropower Research, Beijing, China, 2017. [Google Scholar]
  24. Lee, M.; Keller, A.A.; Chiang, P.C.; Den, W.; Wang, H.T.; Hou, C.H.; Wu, J.; Wang, X.; Yan, J.Y. Water-energy nexus for urban water systems: A comparative review on energy intensity and environmental impacts in relation to global water risks. Appl. Energy 2017, 205, 589–601. [Google Scholar] [CrossRef]
  25. Shrestha, E.; Ahmad, S.; Johnson, W.; Shrestha, P.; Batista, J.R. Carbon footprint of water conveyance versus desalination as alternatives to expand water supply. Desalination 2011, 280, 33–43. [Google Scholar] [CrossRef]
  26. Yang, W.Q.; Zhao, R.Q.; Zhang, Z.P.; Xiao, L.G.; Cao, L.H.; Wang, S.; Yang, Q.L. Research on Carbon Water Footprint Efficiency of Different Industries in Henan Province. J. Nat. Resour. 2019, 34, 92–103. [Google Scholar]
  27. Yan, M.Y. Research on China’s Industrial Structure Optimization Based on “Dual Peaks of Water and Carbon”. Master’s Thesis, China University of Petroleum, Beijing, China, 2020. [Google Scholar] [CrossRef]
  28. Ni, H.Z.; Zhao, J.; Peng, X.J.; Chen, G. Estimating the economic impact of large hydropower projects: A dynamic multi-regional computable general equilibrium analysis. Water Policy 2022, 24, 1343–1365. [Google Scholar] [CrossRef]
  29. Li, X.; Feng, K.S.; Siu, Y.L.; Hubacek, K. Energy-water nexus of wind power in China: The balancing act between CO2 emissions and water consumption. Energy Policy 2012, 45, 440–448. [Google Scholar] [CrossRef]
  30. Zhang, C.; Anadon, L.D.; Mo, H.; Zhao, Z.N.; Liu, Z. Water-carbon trade-off in China’s coal power industry. Environ. Sci. Technol. 2014, 48, 11082–11089. [Google Scholar] [CrossRef]
  31. Feng, K.S.; Hubacek, K.; Siu, Y.L.; Li, X. The energy and water nexus in Chinese electricity production: A hybrid life cycle analysis. Renew. Sustain. Energy Rev. 2014, 39, 342–355. [Google Scholar] [CrossRef]
  32. Ye, C.X.; Zhong, R.D.; Chen, X.H.; Jin, H.Y. Simulation of the strategic evolution process and interactions between stakeholders in water trading and carbon trading. J. Hydrol. 2023, 616, 128787. [Google Scholar] [CrossRef]
  33. Tan, Q.L.; Liu, Y.; Zhang, X.P. Stochastic optimization framework of the energy-water-emissions nexus for regional power system planning considering multiple uncertainty. J. Clean. Prod. 2020, 281, 124470. [Google Scholar] [CrossRef]
  34. Zhao, J.; Duan, J.J.; Han, Y.P.; Gao, F. Correlation between carbon emissions and water consumption in different industries in China: Spatial and temporal distribution characteristics and driving factors. J. Clean. Prod. 2023, 427, 139196. [Google Scholar] [CrossRef]
  35. Zhang, Q.; Wang, X.Z.; Xu, L.S.; Shen, J.L. Coupling Relationship and Analysis of Steel Process Resources Energy Carbon Emissions. Steel 2020, 55, 103–114. [Google Scholar] [CrossRef]
  36. Yang, R.P.; Wang, T.; Yang, L.; Li, L.P.; Wang, M. Research on Collaborative Promotion of Water Conservation and Carbon Reduction in the Industrial Sector of the Yangtze River Delta Region. Environ. Sci. Res. 2024, 12, 2622–2631.36. [Google Scholar] [CrossRef]
  37. Li, L.B.; Hu, J.L. Ecological total-factor energy efficiency of regions in China. Energy Policy 2012, 46, 216–224. [Google Scholar] [CrossRef]
  38. Lin, B.Q.; Liu, H.X. Is foreign trade conducive to improving energy and environmental efficiency? Taking China’s industrial sector as an example. J. Econ. Res. 2015, 50, 127–141. [Google Scholar]
  39. Chung, Y.H.; Fare, R.; Grosskopf, S. Productivity and Undesirable Outputs: A Directional Distance Function Approach. J. Environ. Manag. 1997, 51, 229–240. [Google Scholar] [CrossRef]
  40. Fukuyama, H.; Weber, W.L. A directional slacks-based measure of technical inefficiency. Socio-Econ. Plan. Sci. 2008, 43, 274–287. [Google Scholar] [CrossRef]
  41. Zhang, N.; Choi, Y. Total-factor carbon emission performance of fossil fuel power plants in China: A metafrontier non-radial Malmquist index analysis. Energy Econ. 2013, 40, 549–559. [Google Scholar] [CrossRef]
  42. Zhou, P.; Ang, B.W.; Wang, H. Energy and CO2 Emission Performance in Electricity Generation: A Non-radial Directional Distance Function Approach. Eur. J. Oper. Res. 2012, 221, 625–635. [Google Scholar] [CrossRef]
  43. Tian, Y.; Lin, Z.J. Coupling and Coordination of Agricultural Carbon Emission Efficiency and Economic Growth in Chinese Provinces. China Popul. Resour. Environ. 2022, 32, 13–22. [Google Scholar]
  44. Zhang, J.; Zhang, Y. Re estimation of China’s capital stock K. Econ. Res. J. 2003, 7, 35–43+90. [Google Scholar]
Figure 1. Time-varying graphs of individual water saving and carbon reduction performance.
Water 17 01847 g001
Figure 2. Individual and collaborative performance.
Water 17 01847 g002
Figure 3. The evolution of water saving and carbon reduction synergistic effect at the national and regional levels.
Water 17 01847 g003
Figure 4. Evolution of synergistic effect across 30 provinces and municipalities.
Water 17 01847 g004
Figure 5. Synergistic effect values by province/municipality in key years.
Water 17 01847 g005
Figure 6. Temporal trends of spatial convergence indices at national and regional levels.
Water 17 01847 g006
Figure 7. Local Moran’s I map of synergy effect.
Water 17 01847 g007
Disclaimer/Publisher’s Note: The statements, opinions and data contained in all publications are solely those of the individual author(s) and contributor(s) and not of MDPI and/or the editor(s). MDPI and/or the editor(s) disclaim responsibility for any injury to people or property resulting from any ideas, methods, instructions or products referred to in the content.

