Article

Characterization of Groundwater Dynamics and Their Response Mechanisms to Different Types of Compound Stress in a Typical Hilly Plain Area

1
College of Water Conservancy Engineering, Tianjin Agricultural University, Tianjin 300392, China
2
Tianjin Agricultural University-China Agricultural University Joint Smart Water Conservancy Research Center, Tianjin 300392, China
3
Tianjin Center, China Geological Survey, Tianjin 300170, China
4
College of New Energy and Environment, Jilin University, Changchun 130021, China
*
Author to whom correspondence should be addressed.
These authors contributed equally to this work.
Water 2025, 17(13), 1846; https://doi.org/10.3390/w17131846
Submission received: 8 May 2025 / Revised: 16 June 2025 / Accepted: 18 June 2025 / Published: 20 June 2025
(This article belongs to the Special Issue Soil and Groundwater Quality and Resources Assessment, 2nd Edition)

Abstract

Groundwater is a crucial source of water supply and an important ecological element globally. Research on the dynamic characteristics of groundwater and their causative mechanisms is fundamental to objectively evaluating groundwater resources and their sustainable utilization. Based on the large amount of hydrogeological data collected and analyzed in typical hilly plain areas, a multi-factor weighted comprehensive evaluation system (MFWCES) based on GIS was used to evaluate the response of groundwater dynamics to combined stress elements in Tangshan City. The study area is located in the plains and hilly regions of Tangshan City. The evaluation system was based on seven influencing factors, including hydraulic conductivity, soil media, aquifer thickness, depth of groundwater, land use type, extraction intensity of groundwater, and groundwater evaporation. The results of groundwater dynamics in the study area were obtained by weighted comprehensive evaluation, with their score size ranging from 2.4 to 12.7. The spatial distribution of groundwater dynamics was classified into four categories: rapid response (10.3–12.7), dual response to precipitation and anthropogenic extraction (9.6–10.3), delayed response (7.6–9.6), and strong superimposed response to human activities (2.4–7.6). The related conclusions will provide key references for regional water resource planning, ecological protection, and the development of differentiated groundwater management strategies under compound stress.

1. Introduction

In recent years, rapid social and economic growth coupled with deteriorating ecological conditions have steadily reduced global water availability, while the exploitation of inland water resources has intensified [1,2]. Because of shifting climate patterns and increasing human activities, coastal regions are increasingly threatened by groundwater-related environmental issues [3]. Groundwater is an essential resource that supports the livelihoods of over two billion people worldwide [4]. Due to its widespread distribution and protection beneath the vadose zone, it is relatively resistant to contamination [5], making it a vital water source for urban life, industry, and agriculture [6]. As an indispensable component of the hydrological cycle, groundwater recharge is primarily driven by precipitation, which encapsulates various factors influencing groundwater dynamics over time. In order to make more reasonable use of valuable groundwater resources and to protect groundwater, it is particularly important to master the dynamic laws of groundwater and study their dynamic characteristics and causes of formation.
The main sources of groundwater recharge include atmospheric precipitation infiltration, surface water infiltration, overflow recharge of adjacent aquifers, and agricultural irrigation water recharge, among which precipitation is the main factor affecting groundwater dynamics in most areas. The dynamics of groundwater in response to precipitation are crucial for regional groundwater balance and the storage of groundwater [7]. Analyzing the fluctuation patterns of groundwater in response to precipitation forms the basis for assessing and efficiently utilizing freshwater resources [8]. Relevant studies in Baotou [9], Salento [10], western Japan [11], and other typical areas with drought or lack of surface fresh water showed that the response of groundwater levels to variation in precipitation possesses a complicated correlation and a lag effect, and could not be well described by analyzing only macro annual variation trends in precipitation. Cui et al. [9] and Yin et al. [12] used the wavelet coherence method to investigate the response of groundwater depth to precipitation and found that the lag in groundwater depth changes in response to precipitation was affected by long-term precipitation. Russo et al. [13] and Wang et al. [14] developed a long-term evaluation framework from several years to several decades and revealed that the annual groundwater recharge reflected by groundwater level changes was significantly correlated with seasonal rainfall, such as precipitation and snowmelt, but that the response lag time might vary spatially and temporally due to aquifer lithology and groundwater exploitation intensity. Qi et al. [15] and Kellner et al. [16] conducted correlation and regression analyses based on decades of observational data, and the results indicated that, under intense precipitation patterns, the sensitivity of groundwater dynamics was higher, while its hysteresis was influenced by agricultural irrigation. Infiltration and groundwater recharge are mainly affected by the underlying surface conditions, such as the thickness of the infiltration zone, vegetation cover, and the modernization of agriculture and animal husbandry. Analyzing the dynamic patterns of groundwater and its response to precipitation is an important aspect of water resource utilization and protection. Previous studies on groundwater response to precipitation have often been limited to analyzing the relationship between precipitation and groundwater level changes in small areas or based on several decades of precipitation data. Rarely have these studies explored, from a macroscopic perspective, the correlation between precipitation infiltration and groundwater dynamics affected by combined geological conditions and anthropogenic disturbances. This study just makes up for this direction.
Groundwater dynamic patterns are not only related to precipitation, but also to other geographic and human activity factors. This study initially focused on analyzing the correlation between precipitation and groundwater dynamics. However, examining groundwater dynamics solely from the perspective of precipitation may lead to misleading conclusions regarding water resource utilization. Subsequently, this study integrates natural and anthropogenic factors into a unified evaluation framework by considering the combined effects of groundwater recharge and discharge. We investigate groundwater dynamic characteristics and underlying mechanisms under the joint influence of multiple factors—including hydraulic conductivity, soil media, aquifer thickness, groundwater depth, land use type, groundwater extraction intensity, and groundwater evaporation [17]. A multi-factor weighted comprehensive evaluation system (MFWCES) has been established to address this evaluation. Considering the impact of recent human activities, this comprehensive study examined the causes of groundwater dynamics under compound stresses. This investigation of groundwater dynamics in a typical hilly plain area lays the foundation for rational and sustainable utilization of regional groundwater resources [18], while also providing insights for ecological remediation and the prevention of geological disasters.

2. Study Area and Data

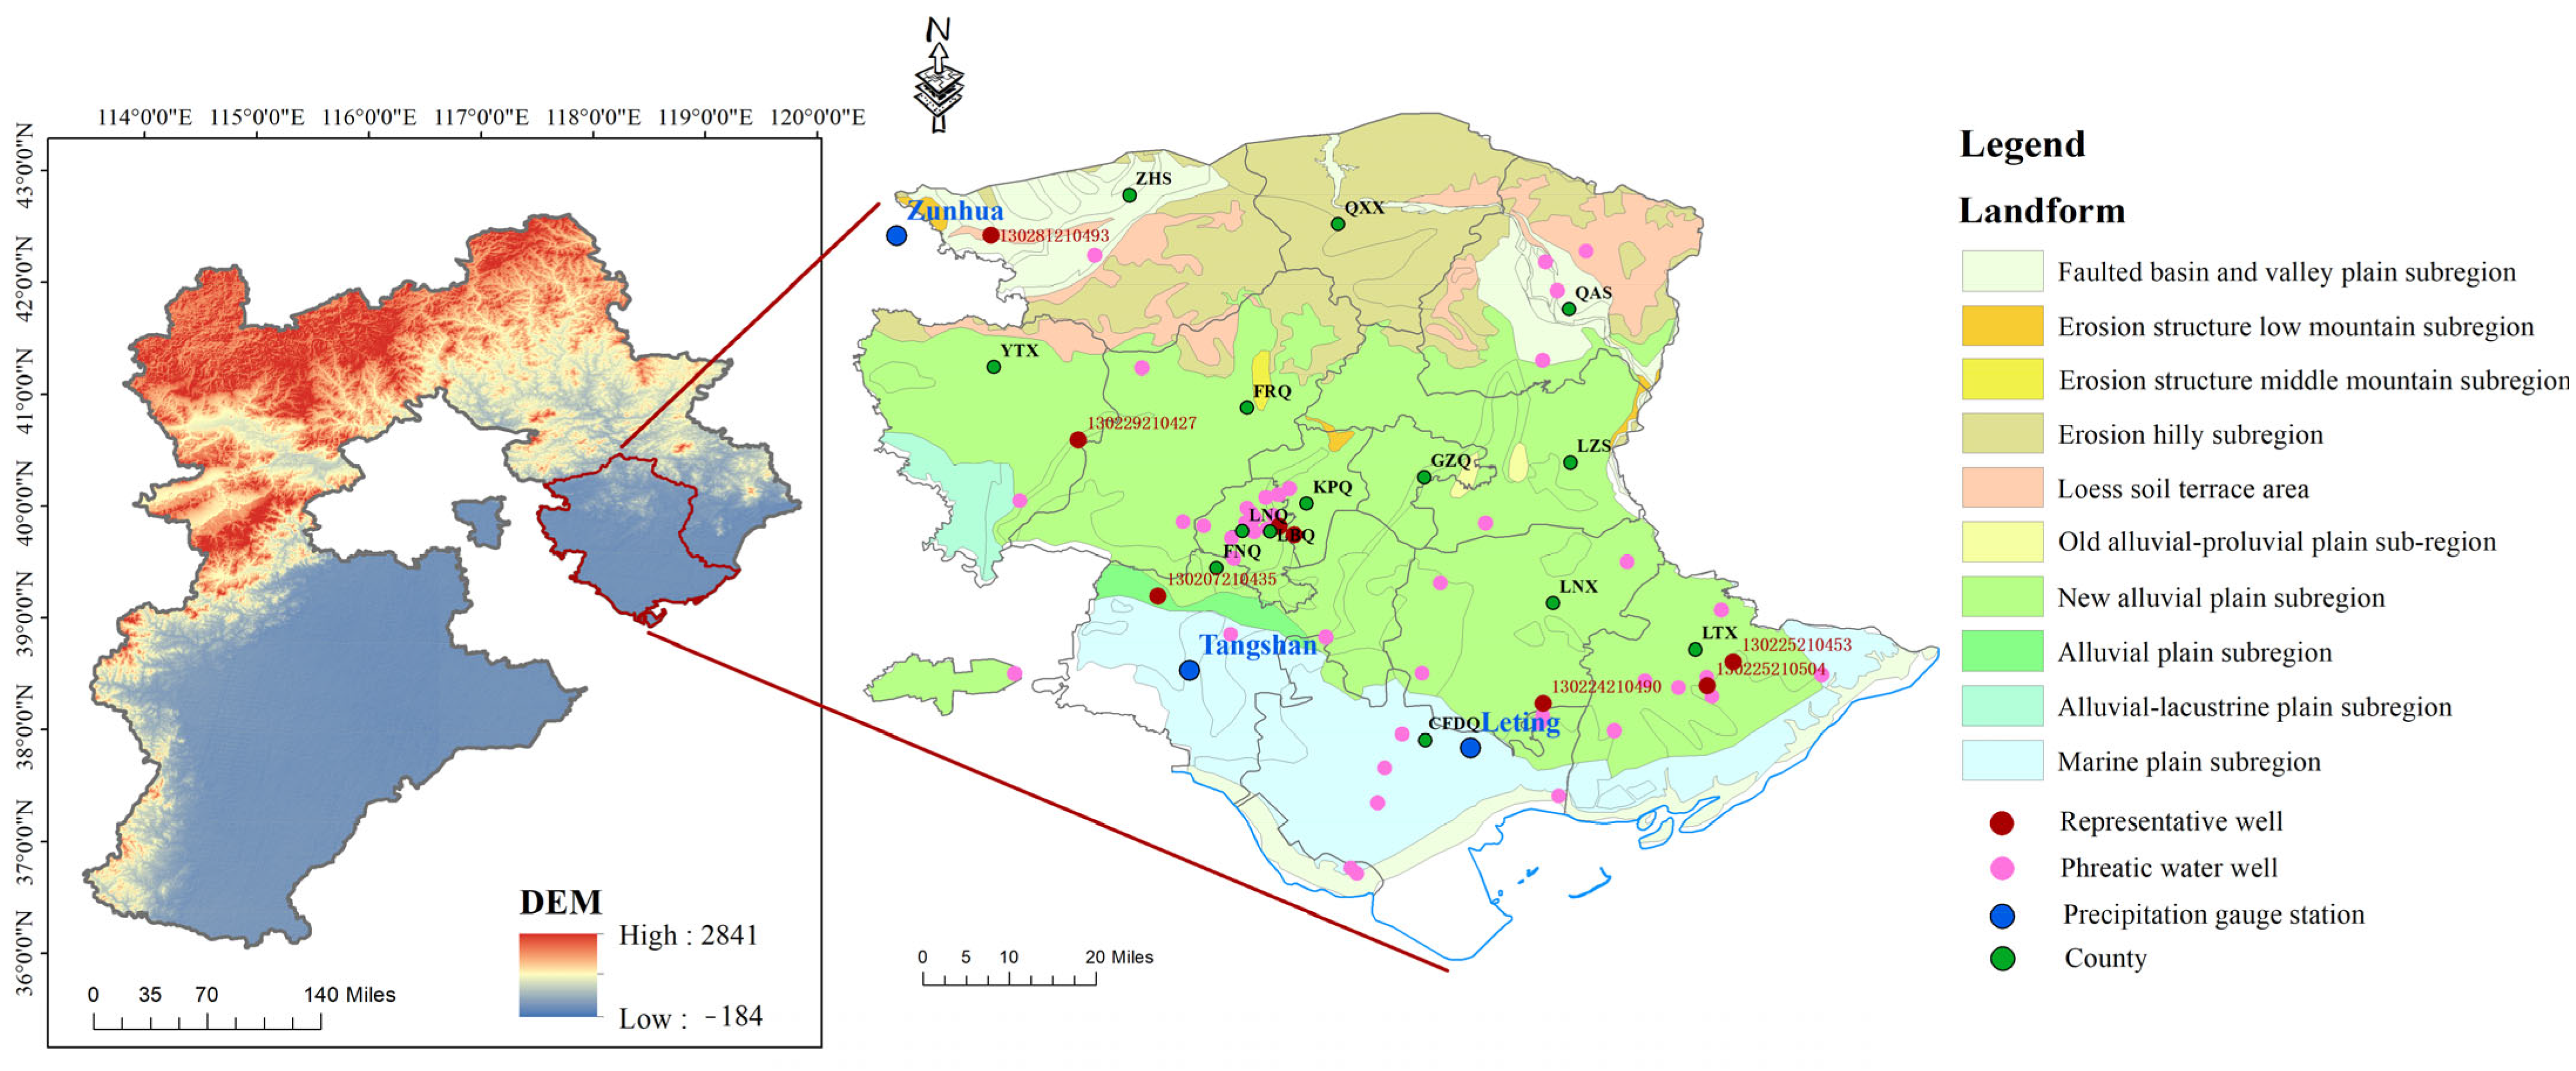
2.1. Location of Study Area

As shown in Figure 1, Tangshan City is situated in central Bohai Bay in China, between longitude 117°31′–119°19′ East and latitude 38°55′–40°28′ North. It is situated in the northeast of the North China Plain, with Hebei Province to the east, making Tangshan City a choke point of the North China–Northeast China corridor. Tangshan City covers a land area of 13,472 km2, consisting of 5131 km2 of mountainous terrain (38.09%) and 8341 km2 of plains (61.91%). The sea area is 4472 km2, with a coastline of 229.72 km. This study focuses on the plain and hilly areas of Tangshan City (the transitional region between plains and mountains), covering a total area of 12,925 km2.

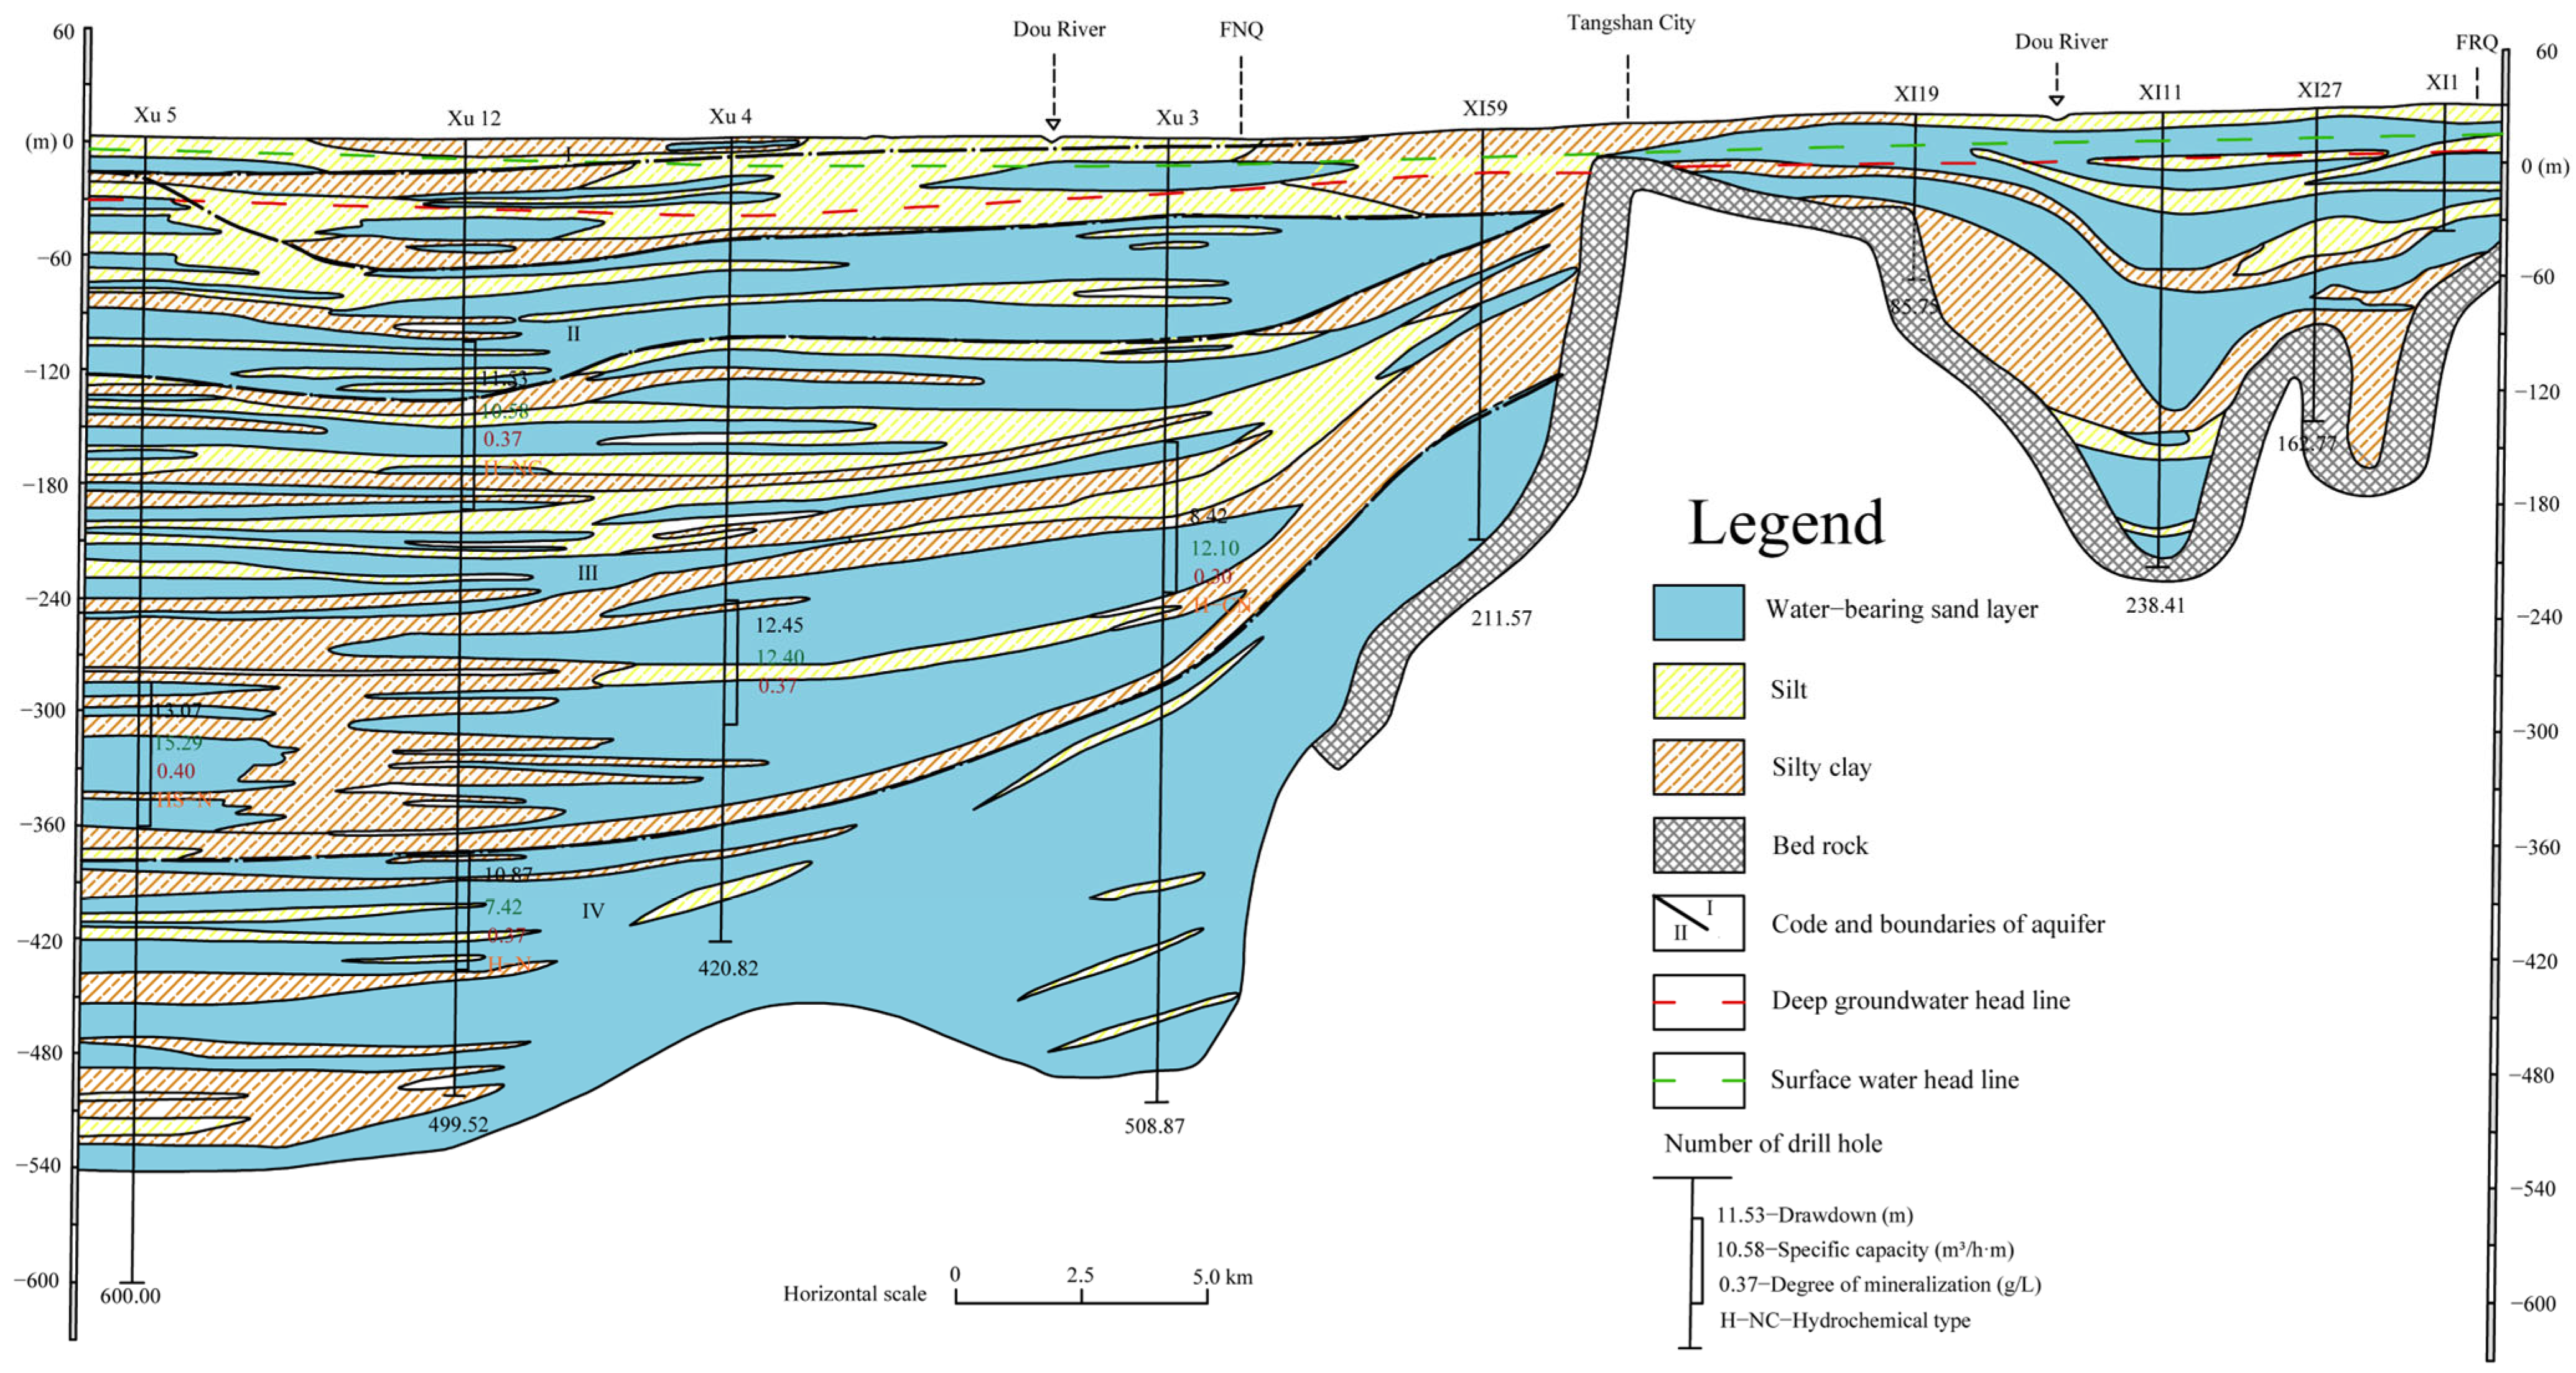
2.2. Hydrogeological and Meteorological Characteristics

Based on storage conditions and aquifer medium pore characteristics, groundwater in Tangshan City can be categorized into three types: pore water in loose rock, karst water in carbonate rock, and fissure water in bedrock. Pore water is mainly distributed in the Yanshan pre-mountain plains, coastal plains, mountain basins, and valley areas of the hilly area. The water is continuous and uniform in space, and the hydraulic connection within this system is better. Its main recharge sources include rainfall infiltration and river recharge, and the dynamic changes in shallow groundwater levels with the annual distribution of precipitation are obvious. Karst water-bearing rock groups are mainly distributed in the southern piedmont of Yanshan Mountain and hidden in the sloping plains in front of the mountains, intermontane basins, and other places. The water yield property of karst aquifers is generally strong but extremely uneven; in addition, there is obvious anisotropy in hydraulic connection [19]. The dynamic changes in karst water levels are characterized by large amplitude and rapid change. Fissure water is distributed in the hilly areas of northern Tangshan, and its abundance varies significantly across locations due to factors such as the nature of the fractures, their development characteristics, and recharge conditions. In the hilly and plain regions of Tangshan, fault structures are densely distributed; these fault zones not only act as barriers to water flow, but also serve as preferential conduits, resulting in a highly heterogeneous groundwater system [20]. The hydrogeological cross-section diagrams of FNQ and FRQ are presented in Figure 2.
The study area exhibits a diverse range of soil types, with loamy sand and cohesive clay being the most widely distributed. The stratigraphy reflects a complex depositional and tectonic history, progressing from ancient metamorphic rocks to shallow-marine carbonates of the early Paleozoic, followed by Mesozoic fluvial-lacustrine deposits, and finally transitioning into Quaternary unconsolidated sediments. Furthermore, Tangshan is located within the North China Plain, where long-term agricultural irrigation and industrial water demands have led to significant groundwater overextraction and land subsidence, causing pronounced hydrogeological disturbances [21]. The central part of the North China Plain has a flat topography with good stratigraphic continuity and a relatively homogeneous groundwater system, whereas Tangshan has a complex groundwater runoff due to the presence of fracture zones and earthquakes having occurred several times in history. In the southern coastal plain, there may be seawater intrusion into freshwater areas of the aquifer.
In the study area, there are three major river systems—the Luan River, the Jiyun River, and the Jidong Coastal Water System—with over 70 rivers in total. Among these, rivers with drainage areas exceeding 200 km2 include the Luanhe River, the Huanxiang River, the Dou River, the Sha River, and the Jiyun River.
Tangshan has a warm, temperate, semi-humid continental monsoon climate. Winters are relatively cold, with scarce precipitation and more northerly winds; summers are hot and humid, with concentrated rainfall and more southerly winds [22]. The highest temperature throughout the year reaches 40 °C (July), the lowest temperature reaches −26 °C (January), and the average temperature for many years is 10.6 °C. The average annual precipitation is 608.7 mm, while evaporation reaches 1509 mm.

3. Data and Methods

3.1. Data Sources

This study mainly analyzes the response characteristics of groundwater dynamics under the influence of precipitation and other compound factors. Precipitation data were primarily obtained from three precipitation gauge stations located in Zunhua, Tangshan and Leting (spanning January 2018 to August 2020). In the groundwater dynamics investigation, all 52 monitoring wells with complete basic information and containing long series of observation data for well-hole location projection were projected on the map. In each district and county-level administrative area, 1–2 monitoring points were selected as the object of analysis to ensure that the selected points were evenly distributed within the study area and were controlled and representative, and that the data were complete (spanning January 2018 to August 2020). Since the main objective of this study is to analyze the relationship between groundwater dynamics and precipitation, unconfined aquifer wells that directly receive recharge from precipitation were selected as the study object, and the main type of groundwater monitored was unconfined aquifers. A confined aquifer well was selected as the study object in the Xiaobeihai area, where there are no unconfined aquifer wells. In addition, the selected monitoring wells are shown in the topographic and geomorphic maps, indicating the geomorphic units in which the wells are located, trying to ensure that there are representative points in each geomorphic feature subdistrict. Some monitoring wells were selected as research objects according to the above principles, and their distribution locations are shown in Figure 1.
In evaluating the groundwater response to multiple compound factors, data collection was conducted for the study area based on information from hydrogeology reports, well drilling, and meteorological stations. The collected data included parameters such as precipitation, groundwater level, hydraulic conductivity, soil media, aquifer thickness, and groundwater depth. Land use data were obtained from the first Landsat-derived annual land cover product of China (CLCD); groundwater extraction data were calculated based on the Tangshan City Water Use Comprehensive Table; and phreatic evaporation data were sourced from the Tangshan evaporation stations.

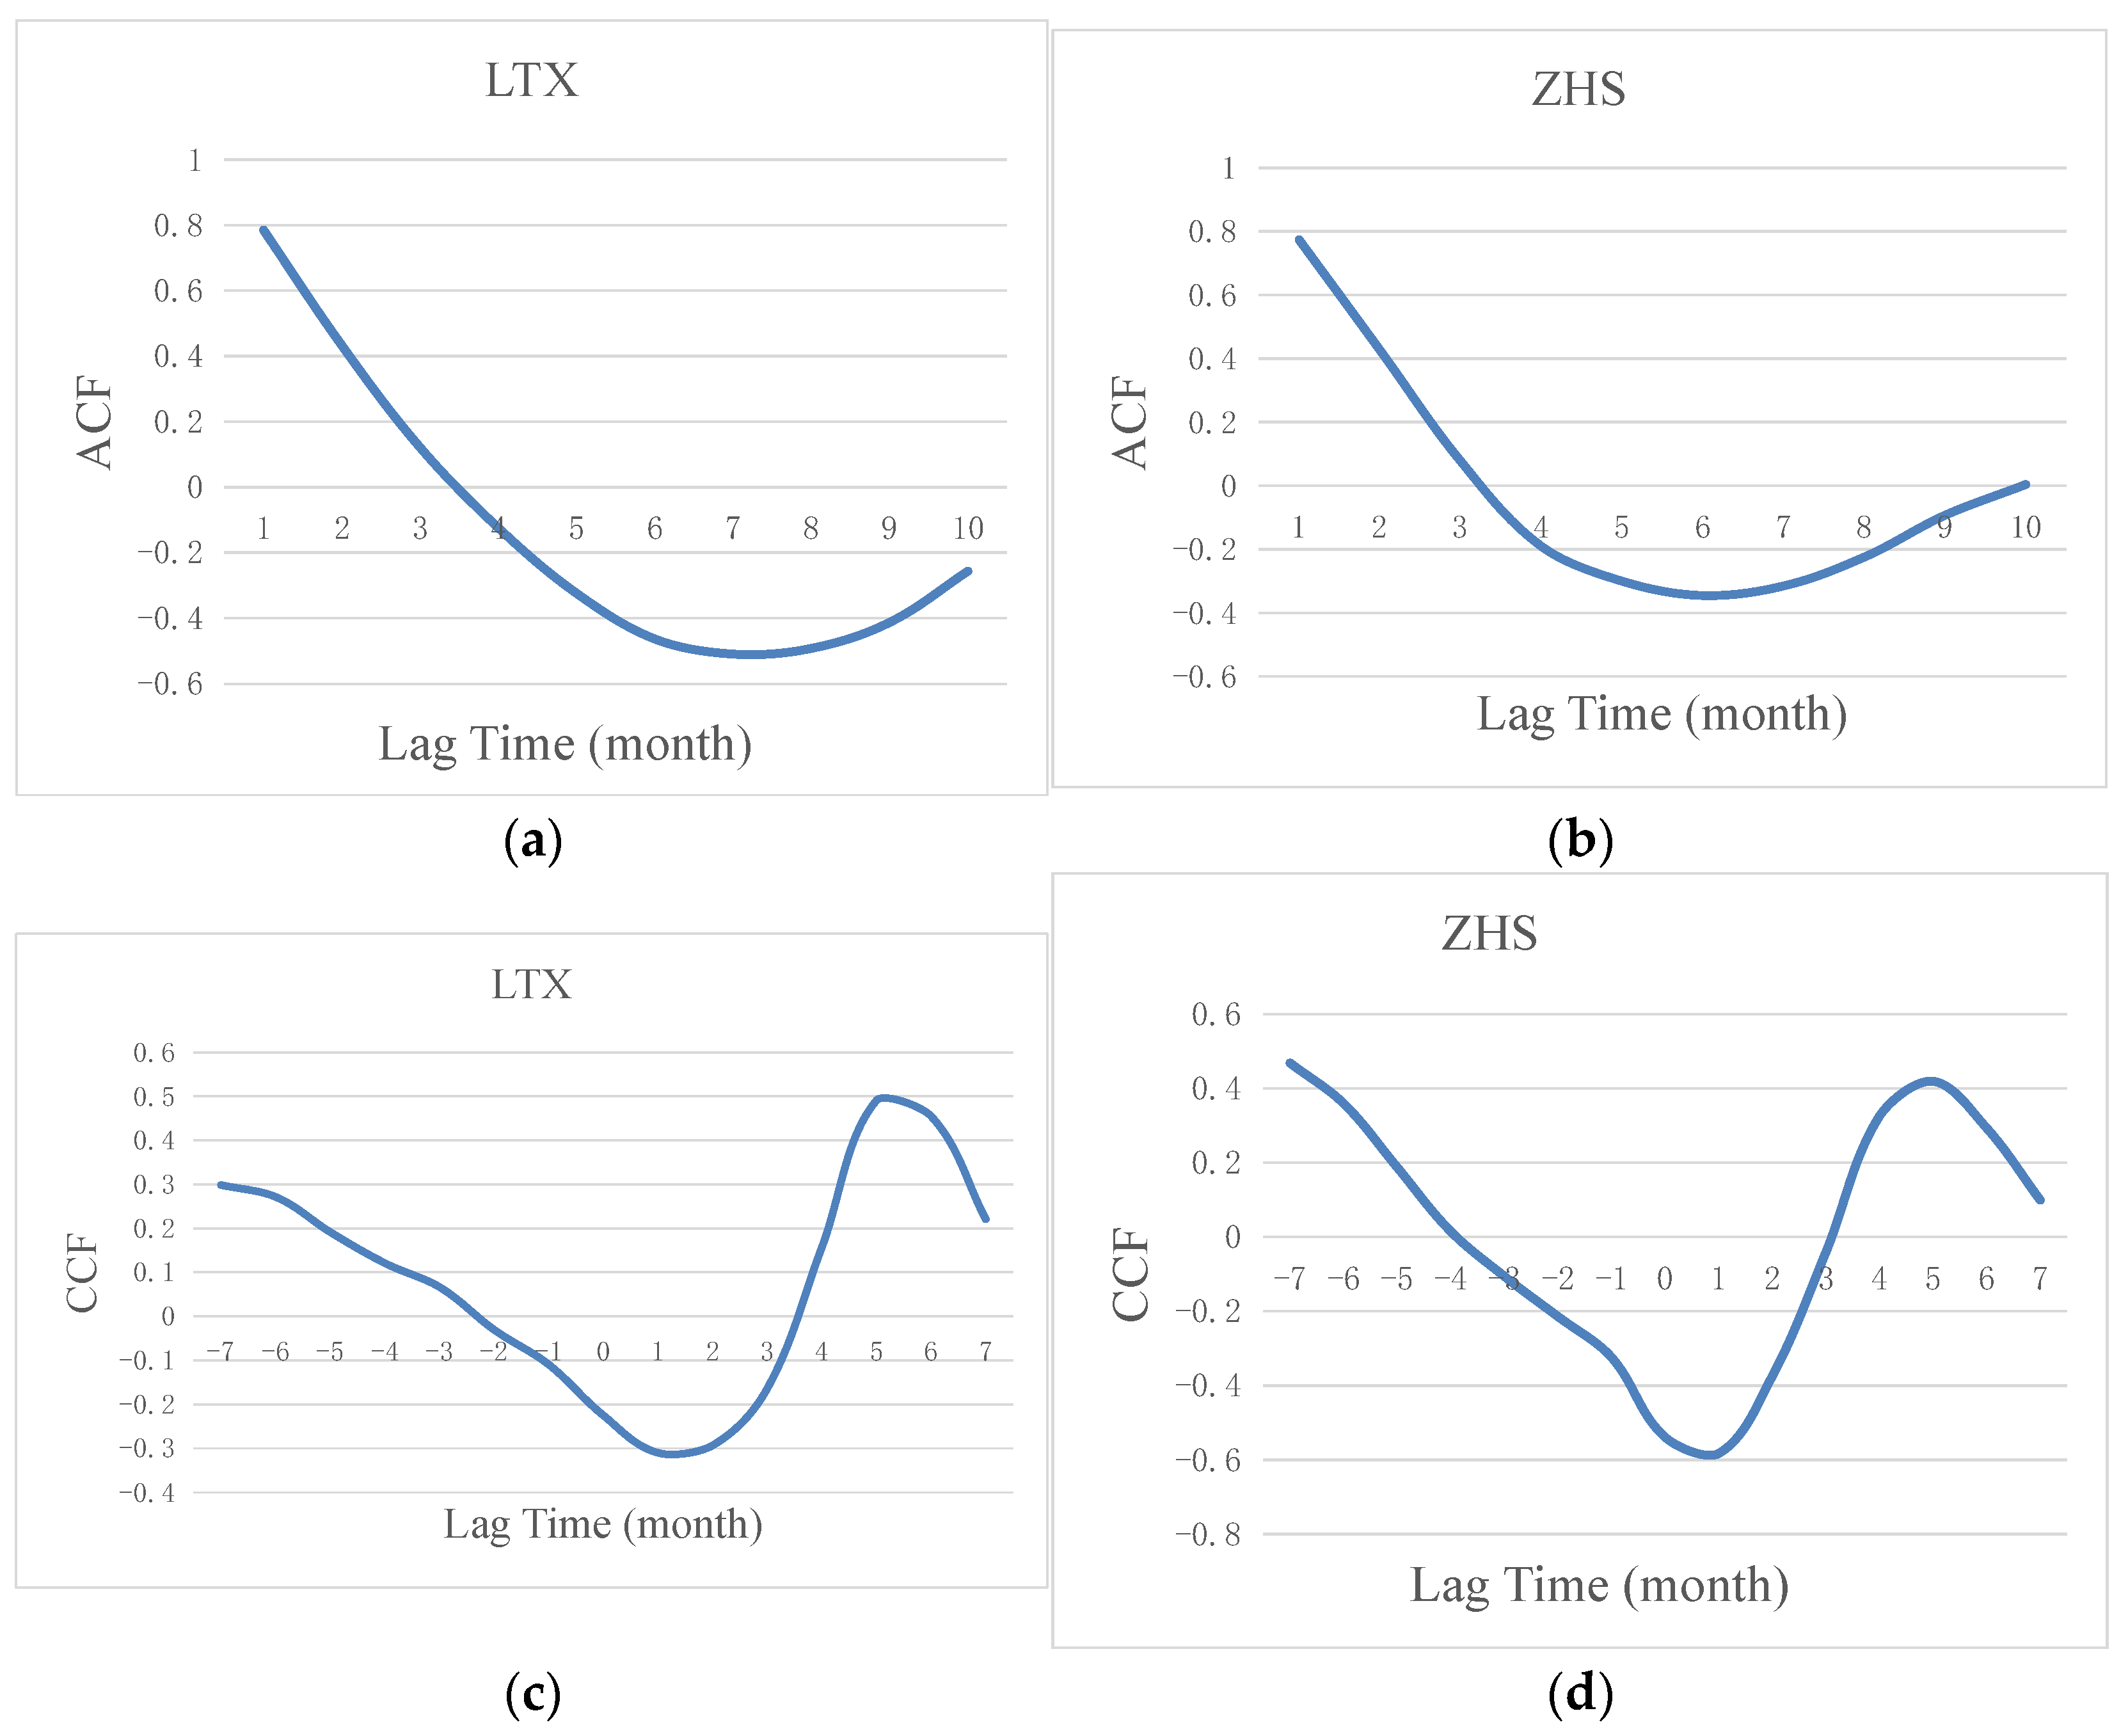
3.2. Correlation Analysis (Auto-Correlation and Cross-Correlation)

The auto-correlation function (ACF) r(k) can be used to identify repeating patterns in a sequence. It describes the correlation of a random signal at different times, essentially performing cross-correlation on the signal itself. The formula is as follows [19,23]:
r ( k ) = C ( k ) C ( 0 )
C ( k ) = 1 n t = 1 n k ( x t x ¯ ) ( x t + k x ¯ )
C ( 0 ) = 1 n t = 1 n ( x t x ¯ ) 2
where xt is the t-th observation, x ¯ is its sample mean, n is the length of the time series, k is the time lag, C(k) is the covariance function at lag k, C(0) is the zero-lag covariance, and r(k) is the auto-correlation coefficient. Equation (4) can be used to test whether the auto-correlation at lag k is significant [19,24].
r k > 2 n
The cross-correlation function (CCF) is used to measure the similarity between independent signals xt and yt at any two different times. It provides an indicator of whether the two signals are correlated in the frequency domain, linking the cross-spectrum between two measurement points with their respective auto-spectra, thereby determining the extent to which the output signal is derived from the input signal. The cross-correlation function is not an even function, and rxy (k) ≠ ryx (k).
r x y ( k ) = C x y ( k ) C x 2 ( 0 ) C y 2 ( 0 )
C x y ( k ) = 1 n t = 1 n k ( x t x ¯ ) ( y t + k y ¯ )
C x ( 0 ) = 1 n t = 1 n ( x t x ¯ ) 2
C y ( 0 ) = 1 n t = 1 n ( y t y ¯ ) 2
where xt is the t-th observation of the input sequence, yt is the t-th observation of the output sequence, x ¯ and y ¯ are the respective sample means, n is the length of the time series, Cxy(k) is the cross-covariance function between the input and output sequences, Cx(0) and Cy(0) are the variances of the input and output sequences, and rxy(k) is the cross-correlation function between the input and output sequences.

3.3. Evaluation of Groundwater Dynamic Impact Factors by GIS-Based Multi-Factor Weighted Comprehensive Evaluation System (MFWCES)

The groundwater response to precipitation is, to some extent, a reflection of fluctuations caused by net recharge. Therefore, the evaluation system considers both recharge and discharge factors. Factors such as hydraulic conductivity, soil media, aquifer thickness, groundwater depth, and land use type govern the rate and volume of groundwater recharge. On the discharge side, the primary factors include extraction intensity and phreatic evaporation. The MFWCES selects seven influencing factors, as outlined above, and utilizes GIS to conduct independent assessments of each factor. The vector maps are then converted into raster data, and the independent evaluation factors are superimposed using map algebra and the raster calculator function, ultimately yielding a comprehensive evaluation result for groundwater dynamics [22]. See the formula below for details.
M F W C E S i n d e x = W C L C + W S L S + W A L A + W D L D + W L U T L L U T W E I L E I W E L E
where W is the weight of factor, and L is the assessment levels.
The factors in formula (9) include: hydraulic conductivity (C), soil media (S), aquifer thickness (A), groundwater depth (D), land use type (LUT), groundwater extraction intensity (EI), and groundwater evaporation(E).
Regional groundwater storage serves as the “reservoir” for groundwater dynamics, with its variations influencing dynamic characteristics through hydrogeological conditions and human activities. Tangshan City, situated in the northeastern part of the densely populated North China Plain, suffers from severe groundwater overexploitation. Under the influence of the South-to-North Water Diversion Project, groundwater extraction emerges as the primary driver of groundwater level fluctuations [25]. Wang et al., using expert scoring methods, identified key factors affecting groundwater dynamics in the North China Plain, including topography and groundwater depth [26]. Permeability and soil lithology accurately reflect variations in regional rock types and pore structures. Additionally, Etuk et al. employed a multi-factor weighted overlay approach to delineate groundwater potential in regions characterized by complex geology, high population density, and water scarcity. Utilizing the Satty Analytic Hierarchy Process (AHP) in combination with expert judgment, weights were assigned to various factors, revealing that geological factors exert the greatest influence on groundwater dynamics (25%), while land use type contribute the least (5%), and soil media account for approximately 15% [27]. Based on the above research and the Guidelines for Groundwater Dynamics Analysis and Evaluation published by the Hydrology Society in 2023 [28]. The evaluation system filtrates seven independent factors from the numerous variables that influence groundwater dynamics for assessment, and the weighting assignments for each factor in our evaluation framework are presented in Table 1.
Each of the seven influencing factors mentioned above will be assigned an evaluation level, with scores ranging from 0.1 to 0.8, as detailed in Table 2. The score reflects the frequency of groundwater level fluctuations: the higher the score, the greater its impact on the comprehensive evaluation value, indicating a faster response of groundwater dynamics. On the contrary, a low score reflects a slow response of the factor to groundwater dynamics. The evaluation level of each factor increases with an increase in infiltration coefficient, particle size of soil media, groundwater extraction intensity, and groundwater evaporation and decreases with an increase in aquifer thickness and groundwater depth.

4. Results and Discussion

4.1. Results of the Correlation Analysis

Due to vegetation cover, surface soil moisture content, artificial influence, and other factors, groundwater buried in each region will be affected by precipitation factors to different degrees. To clarify the relationship between groundwater level response and precipitation in Tangshan, the correlation between observation wells and precipitation was analyzed. The correlation coefficient between each observation well and rainfall was calculated, and the cross-correlation between precipitation and groundwater level lag time, as well as the auto-correlation of groundwater level lag time, was plotted.
The degree of persistence and variability of groundwater systems can be characterized by auto-correlation analysis. Correlation analysis is widely used to assess the average response time between precipitation and groundwater. As a stochastic process, the stochastic dependence between groundwater levels and precipitation can be revealed by the cross-correlation function [29,30]. By using these two methods, we can more clearly understand how precipitation inputs affect groundwater dynamics at various timescales, thereby providing a critical basis for subsequent classification of groundwater dynamic types and investigation of their underlying mechanisms.
The auto-correlation function diagram of groundwater level is demonstrated in Figure 3a,b. When the lag time of groundwater level is 1 month, the auto-correlation of each point is relatively high, and the correlation average is more than 0.75, with a strong positive correlation. The correlation is generally relatively low at a lag time of 2 months, approximately 0.45, indicating a weak positive correlation. The rate of decline of the auto-correlation coefficient can be expressed in terms of the number of days it takes for it to fall from 0.8 to 0.2 [31]. It takes an average of 60–75 days for the auto-correlation coefficient of the water level at each point to fall to 0.2, with an overall trend of the correlation decreasing slowly with increasing lag time. This means that the groundwater level has a strong memory effect, as well as a strong ability to continuously respond to past precipitation, human activities, etc. This lag is attributable to prolonged groundwater extraction, which has increased the thickness of the vadose zone and thus extended the recharge delay [32]. In ZHS, the considerable groundwater depth and low aquifer permeability lead to longer recharge pathways and reduced percolation rates, resulting in a pronounced lag response of groundwater levels to precipitation.
The cross-correlation functions between groundwater levels and precipitation are displayed in Figure 3c,d. Negative correlations peak at lag times of 0–2 months, with the correlation approaching zero around 3–4 months after precipitation. In contrast, positive correlations reach a maximum at a lag of 5–6 months, indicating a significant manifestation of precipitation-induced groundwater recharge. This is because, in the initial period following precipitation, groundwater levels do not exhibit significant changes. Over time, precipitation gradually infiltrates and recharges groundwater, causing groundwater levels to begin rising. Hydrogeological conditions, human activities, meteorological conditions, and other elements will affect the correlation between groundwater level and precipitation. This shows that the response of groundwater level to precipitation in the plain and hilly areas of Tangshan City had a certain complexity.

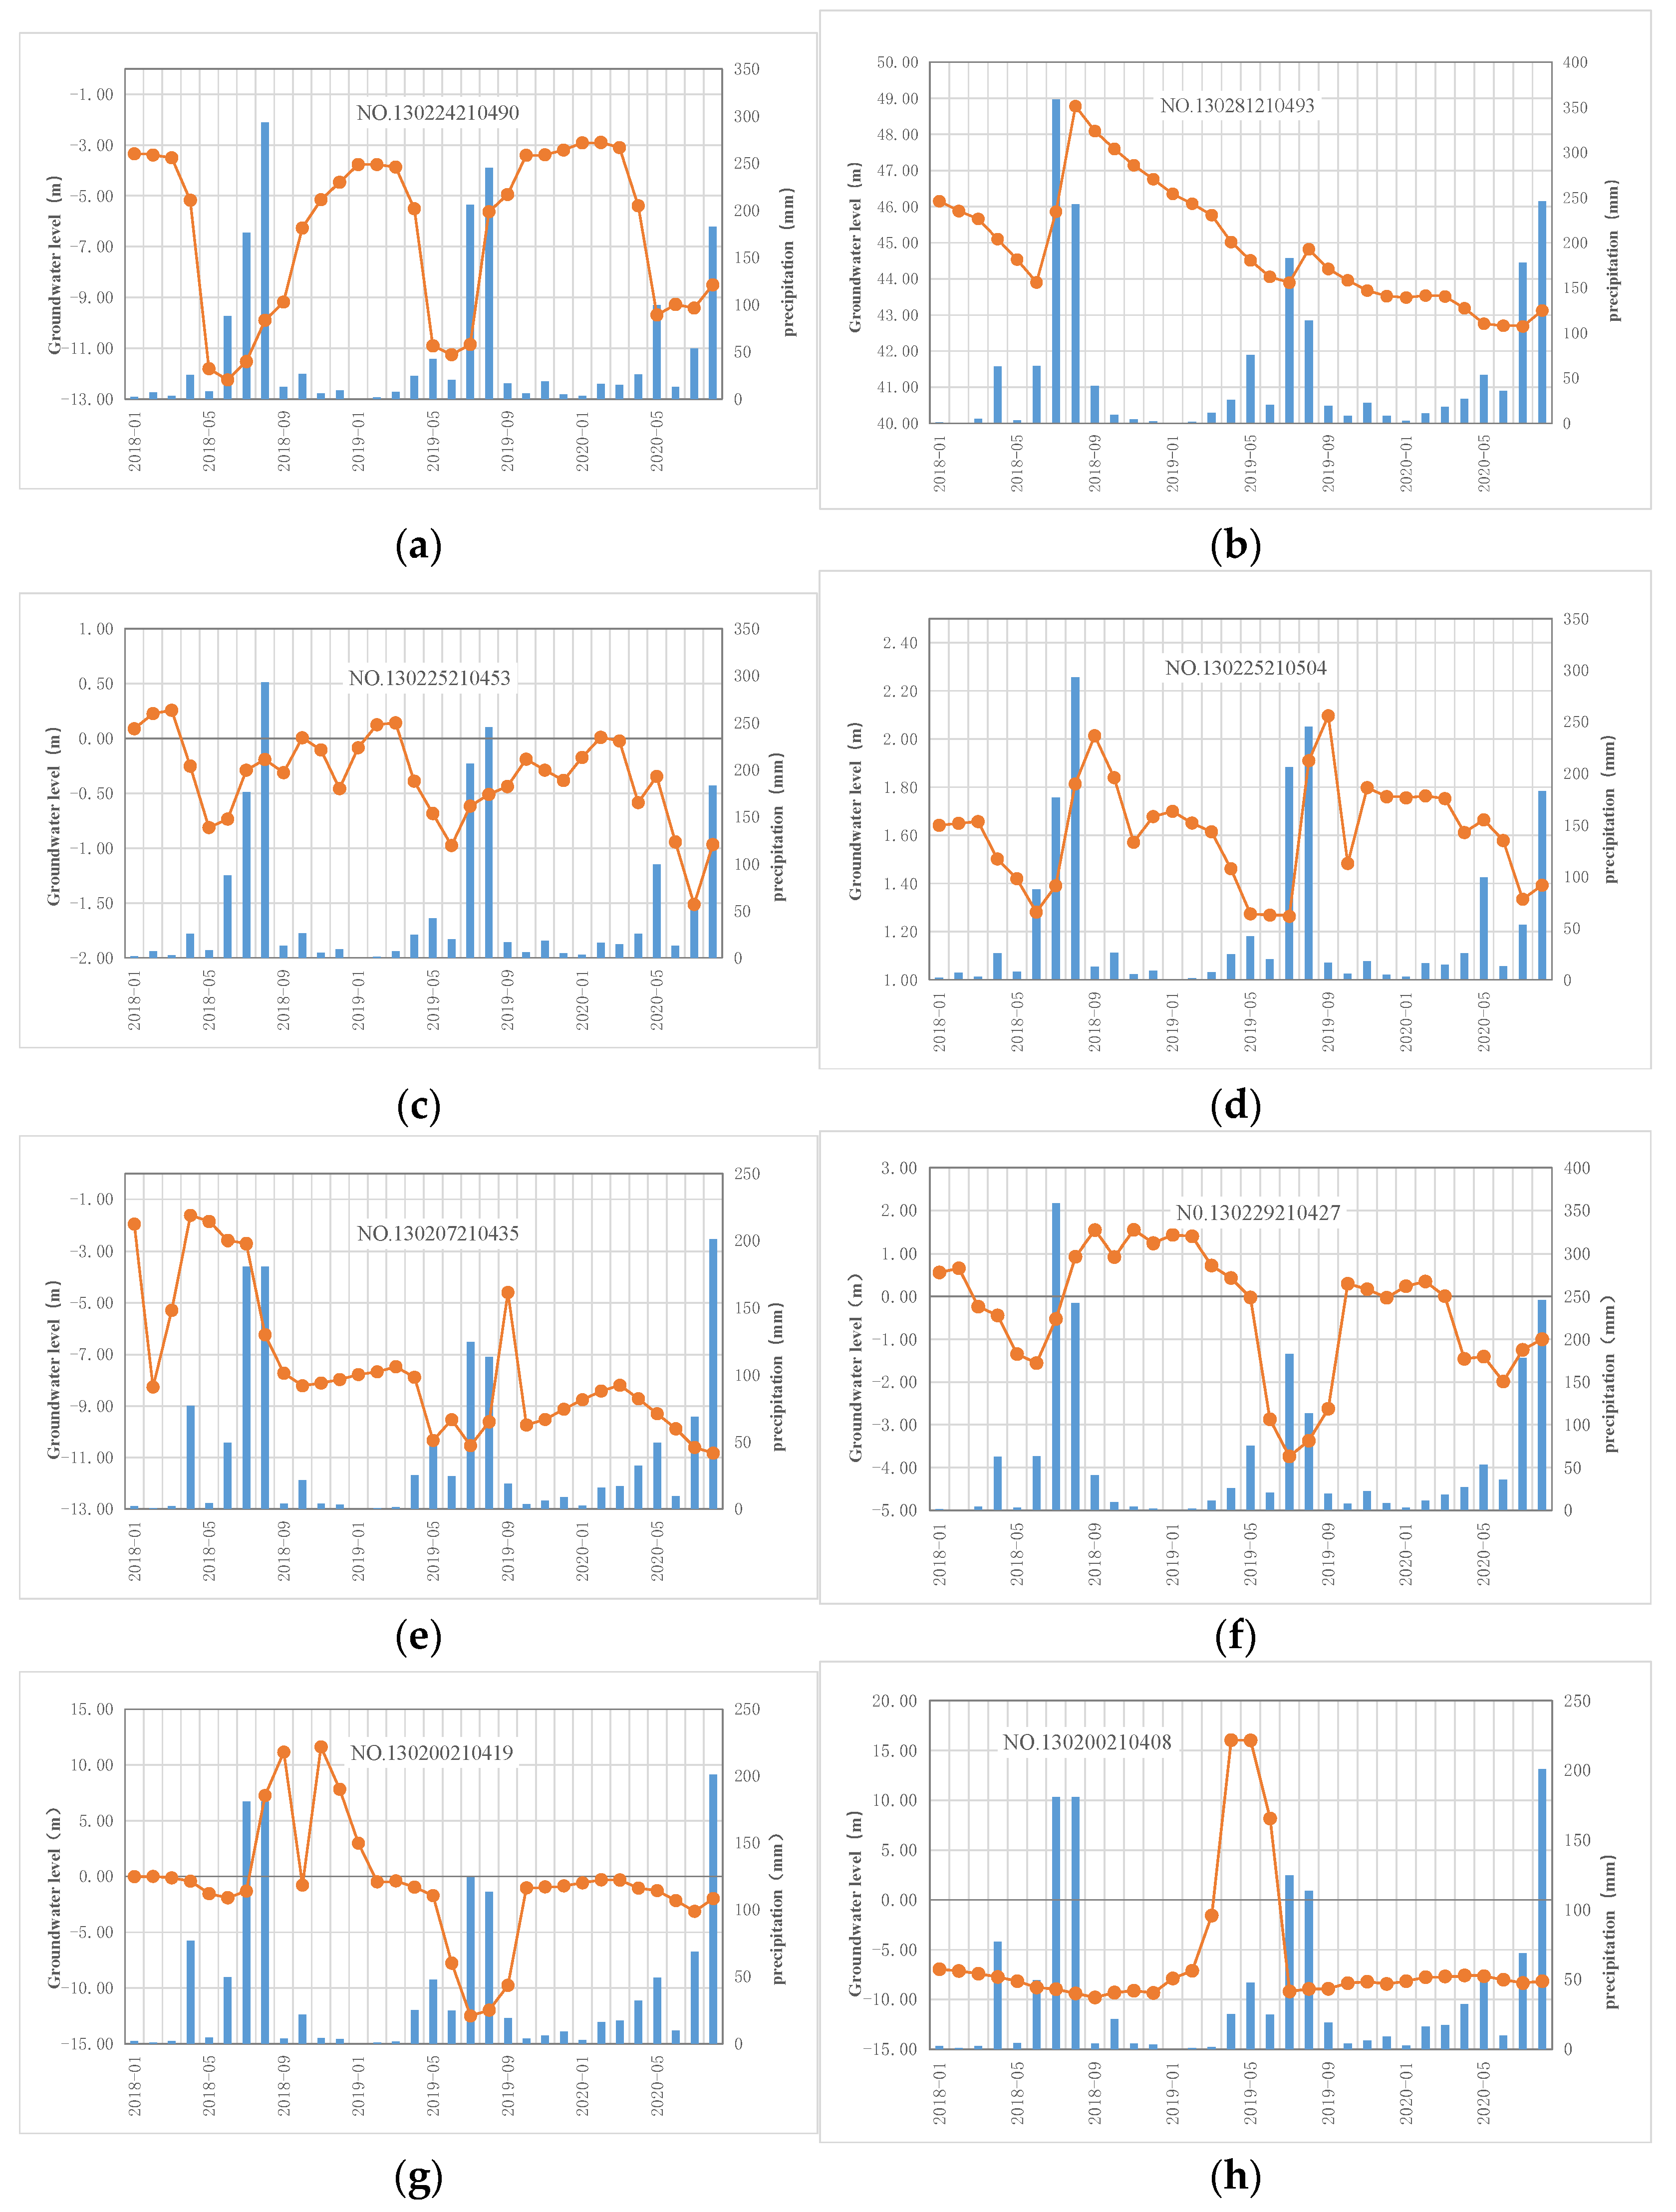
4.2. Results of the Groundwater Dynamics

Based on the selection and data processing from monitoring wells and rainfall stations, monthly average values of groundwater levels and precipitation were obtained from January 2018 to August 2020 (the specific data sources are shown in Table 3). Groundwater dynamic curves were plotted and classified according to fundamental theories of groundwater dynamics in “hydrogeology” and the aforementioned correlation analysis results. According to analysis of the curve characteristics, the main types of groundwater dynamics in the study area can be categorized as follows.
Precipitation-infiltration type: This type is widely distributed across the study area, primarily in regions where the aquifer is deeply buried and the vadose zone has good lithological permeability. The groundwater level varies with changes in precipitation, with its peak often coinciding with or slightly lagging behind peak precipitation. There is considerable intra-annual variation in groundwater levels, as illustrated in Figure 4a,b.
Runoff type: It is mainly distributed in regions with favorable groundwater runoff conditions and extensive recharge areas and where groundwater is deeply buried or the aquifer is covered by an aquitard. The groundwater shows gentle intra-annual variations, with a small annual fluctuation range, and the peak groundwater level generally lags behind peak precipitation, as illustrated in Figure 4c,d.
Irrigation-infiltration type: This type is distributed in irrigation areas with surface water irrigation, where the vadose zone soil has a certain degree of permeability, and the groundwater depth is not very large. During the agricultural irrigation period, groundwater levels show a clear upward trend, with the high water level period often extending for a prolonged duration within the year, as illustrated in Figure 4e,f.
Artificial exploitation type: It is mainly distributed in areas with intensive groundwater extraction, where groundwater dynamics vary significantly with changes in extraction activities. During peak precipitation seasons, the groundwater level either shows a minimal increase or even decreases. When the extraction volume exceeds the annual recharge of groundwater, a trend of continuous annual decline in groundwater levels is observed, as illustrated in Figure 4g,h.
An understanding of the sources of groundwater recharge, as well as seasonal or interannual flow variations characteristics, can be obtained through analysis of the above characteristics of groundwater dynamics. The future trend of groundwater level is reasonably predicted based on exploring the factors influencing groundwater dynamics under different hydrogeological, climatic, and anthropogenic influences. It provides a reference for groundwater monitoring, protection, development, and utilization and is of great significance for the timely detection of adverse changes such as saltwater intrusion into freshwater aquifers and groundwater pollution.

4.3. Dynamics Discussion of Impact Evaluation for Groundwater Dynamic Characterization

4.3.1. Factors Influencing the Dynamic Characterization of Groundwater

After analyzing the natural dynamic patterns of groundwater levels and precipitation, we can discern the seasonal and interannual variability of groundwater in the study area. This analysis underpins the subsequent investigation of groundwater dynamics in response to multiple influencing factors and serves as the basis for classifying groundwater response types. This section examines the primary driving factors influencing groundwater dynamics in the study area. Based on analysis of natural groundwater dynamics, it is evident that the groundwater dynamics in the study area, as a typical coastal region, are subject to the combined stress of hydrological conditions, geological factors, and human activities [33,34,35]. The MFWCES selects five influencing factors, including hydraulic conductivity, soil media, aquifer thickness, groundwater depth, and groundwater evaporation, from the natural influencing factors, as well as land use type and groundwater extraction intensity as human factors. Through GIS mapping, the scores for each influencing factor under individual effects are obtained. Subsequently, the natural and human factors are combined according to the weights pre-defined in Table 1 to investigate the groundwater dynamics under the stress of composite factors.
  • Hydraulic Conductivity
Hydraulic conductivity is an important geological and geotechnical property [36], which is a parameter to measure the strength of aquifer permeability, and the magnitude of the permeability coefficient mainly depends on the scale of connected voids in the aquifer [37]. When the hydraulic gradient is the same, the size of the hydraulic conductivity determines the size of the seepage rate of the aquifer. Typically, aquifers with larger voids have larger hydraulic conductivity and relatively faster seepage rates, with faster response to groundwater dynamics.
In the Tangshan plain area, aquifers are primarily composed of loose sediments with relatively uniform pore structures. Therefore, the collected borehole data are processed using interpolation, and the hydraulic conductivity is determined by combining the results with empirical values. In contrast, aquifers in the hilly areas are mainly fissured bedrock aquifers, where the degree of fissure development is uneven, making determination of the hydraulic conductivity more complex. First, the hilly aquifers are classified based on lithology and pore type. Then, pumping tests conducted in bedrock boreholes are used to determine the hydraulic conductivity by analyzing the relationship between water level drawdown and discharge. Finally, the hydraulic conductivity for different regions is imported into GIS, where the plain and hilly areas are stitched together, and values are assigned to each region according to their assessment levels.
The hydraulic conductivity in the study area was divided into three regions according to the topography, namely, the northern hilly region, the central pre-mountainous region, and the southern coastal region. The hydraulic conductivity of QXX, located in the northern mountainous area, is 0–10 m/d in most of the areas. From Figure 5a, it can be seen that the hydraulic conductivity of the central premontane plains shows a clear banded distribution with distinct levels, and the values are generally large, mostly higher than 20 m/d. Among them, the highest score of 0.8 is found at the junction of FRQ and KPQ, in the eastern part of GZQ and in the southern part of LZS, while the lowest value is concentrated within ZHS and QAS, with a rating of 0.4. The hydraulic conductivity in the southern marine plains is small, with most areas scoring 0.1–0.3.
2.
Soil Media
Infiltration of precipitation into the subsurface requires a certain response time, a process that depends heavily on the hydraulic conductivity of the soil [36], while the infiltration rate is controlled by the physical properties of the soil [38]. Therefore, soil media assessment levels are divided according to soil particle size as well as infiltration capacity. Specifically, soils with larger particle sizes are given higher recharge scores because of their high porosity and fast infiltration rate, which significantly accelerate precipitation infiltration and thus are more likely to raise the groundwater level. Soils with smaller particle sizes, such as silt or clay, are given lower recharge scores because of their high viscosity and low porosity, which prevent infiltration of precipitation to recharge groundwater.
The distribution of various soil media types in Tangshan City is relatively concentrated, among which sandy loam and clay loam are more widely distributed, as shown in Figure 5b. In the northern hilly areas, the topsoil layer is very thin, and most of the soil layer in QXX is missing, with a rating of 0.8. In the central part of the city, including LZS, LNX, LBQ, LNQ, and FNQ, most of the areas have a rating of 0.4 to 0.6, indicating that sandy loam and silt-sand are concentrated in these areas. The distribution in the coastal areas is dominated by clay loam and silt loam.
3.
Aquifer Thickness
For aquifers with relatively uniform water-bearing properties, their thickness is determined based on groundwater levels, the particle composition of loose rock formations revealed by drilling, and the lithological structure [39]. The thickness of bedrock aquifers should be determined by analyzing rock fractures and karst development revealed through drilling, combined with hydrogeological observations.
Based on the foregoing analysis of how aquifer thickness influences groundwater dynamics, this study further examines the spatial distribution and regional variability of aquifer thickness within the study area to elucidate the controlling role of thickness heterogeneity on groundwater behavior.
Aquifer thickness is one of the key factors influencing groundwater dynamics. Generally, thicker aquifers exhibit greater water storage capacity and support longer flow paths. With sufficient precipitation, the slower and more uniform seepage within thicker aquifers results in smaller water level fluctuations. This, in turn, helps to regulate water levels and minimizes seasonal variations. In contrast, thinner aquifers have limited recharge capacity and rely more heavily on precipitation. When precipitation occurs in concentrated bursts, flow velocities increase, resulting in more sensitive groundwater level changes.
The distribution of aquifer thickness across the study area is significantly influenced by sedimentary environments, geological structures, and fluvial deposition, resulting in considerable spatial variability. In the northern region near river channels, such as QAS and QXX, the aquifer thickness is generally less than 10 m, due to the effects of fluvial erosion and sedimentation. In the central alluvial plain, which is dominated by silt and fine sand deposits, aquifer thickness ranges from 25 to 35 m, corresponding to evaluation grade levels between 0.2 and 0.5. In the southern coastal region, aquifer thickness remains below 15 m. Across the entire study area, a few zones of relatively higher aquifer thickness are concentrated in ZHS, YTX, FRQ, and LZS.
4.
Depth of Groundwater
Generally, changes in groundwater depth affect the thickness of the vadose zone. If the vadose zone thickens, it delays and alters the process of precipitation infiltration recharging groundwater, causing the response rate of groundwater dynamics to lag [40].
The study area is located in the estuarine coastal zone, a transition zone connecting land and coastal ocean. The dynamics of groundwater depth in this area are influenced by the interaction between land and ocean [41]. Thus, different methods are applied to determine groundwater depth in Tangshan City’s plains and hilly areas. In plains and valleys, the depth of groundwater is determined by the Kriging interpolation method based on data collected from the survey with reference to the geological profile. For hilly areas with complex topography, groundwater depth is related to aquifer thickness. According to the range of buried depth, the buried depth parameter of groundwater in Tangshan City is divided into eight grades; the greater the depth of the groundwater is, the lower the rating. As can be seen from the Figure 5d, the shallow groundwater depth in Tangshan City presents an overall state of deepness in the north and shallowness in the south. In the northern hilly area, due to the higher topography and the thickness of the vadose zone, the depth of the groundwater is approximately 20 m, with assessment ratings ranging from 0.1 to 0.3, and locally the groundwater level exceeds 25 m. The average depth of groundwater in KPQ, LNQ, LBQ, FRQ, and northern FNQ in the central part of the city is 6–15 m. Most of the groundwater depths in the southern alluvial and marine plains are less than 2 m.
5.
Land use type
Groundwater recharge is regulated by the combined effects of climate change and anthropogenic activities [42], with land use type (LUT) serving as a critical intervention factor in the hydrological cycle [43]. Different land use types influence groundwater dynamics by modifying processes such as interception, infiltration, evapotranspiration, and surface runoff [44].
In this study, the LUT classification for the research area was derived from GlobeLand30 raster data through mosaicking and masking procedures. The study area encompasses seven land use types, among which cultivated land is the most widespread, followed by impervious surfaces, while bare land occupies the smallest area. In the early stages of agricultural cultivation, frequent mechanical tillage increases the proportion of large soil pores, temporarily enhancing soil permeability. However, as precipitation and freeze–thaw cycles act on the soil, pore heterogeneity increases, leading to spatial variability in the groundwater system’s response to precipitation [45]. With continued agricultural activities, degradation of the soil structure diminishes the soil’s water transport capacity, thereby weakening the groundwater response. In each administrative region, impervious surfaces are not only concentrated in certain areas, but also widely distributed in a fragmented pattern; for instance, in LBQ, impervious surfaces cover over 90% of the area. These artificial, impermeable surfaces predominantly generate surface runoff, reducing infiltration and resulting in the most delayed response to precipitation. Conversely, water bodies—primarily located in CFDQ—maintain a strong hydraulic connection with the groundwater system. Although fluctuations in the water levels of these water bodies can directly reflect the amount of precipitation received, the recharge process associated with them differs from the direct infiltration observed with bare land.
6.
Groundwater Extraction Intensity
Exploitation and utilization of groundwater alter its natural equilibrium, causing changes in permeability processes. Continuous groundwater extraction leads to declining water levels and also affects the response rate and effectiveness of groundwater dynamics in response to precipitation [46,47]. While extreme rainfall events may cause a rapid rise in groundwater levels, overextraction can offset such dynamic trends.
Groundwater extraction intensity is calculated as the ratio of the groundwater extracted in each county or district to the respective administrative area. The area of each administrative unit is determined using calculated fields in the attribute table of the geographic layers. Extraction intensity values are then assigned to administrative regions for evaluation. Analysis reveals that the northern and central parts of the region, characterized as alluvial plains, have better groundwater recharge conditions and higher water resource availability. As a result, extraction intensity in this area is higher than in the southern coastal zones. Within the study area, the highest groundwater extraction intensity is found in LBQ, due to its high population density and the concentration of industrial parks, which together result in significant water demand for both industrial production and residential use.
In regions suffering from groundwater overexploitation, water stress is primarily mitigated through strategies such as zoned management, water source substitution projects, agricultural water conservation, and land subsidence monitoring. In industrial clusters and coal-mining subsidence zones (e.g., FNQ and GZQ), groundwater extraction is regulated by designating prohibition and restriction zones, thereby banning or limiting the installation of new extraction wells. In agricultural irrigation areas, the promotion of canal-based water diversion facilitates partial replacement of groundwater with surface water. Moreover, in agricultural regions like YTX, the implementation of high-efficiency drip irrigation systems is encouraged to further conserve water resources.
7.
Groundwater Evaporation
Phreatic evaporation is evaluated assuming a critical depth of 6 m, with evaporation considered negligible for regions where the groundwater depth exceeds this threshold. The geographical coordinates of seven evaporation stations—Fengnan, Fengrun, Luan County, Tanghai, Laoting, Yutian, and Tangshan—were first imported into GIS to create an evaporation station layer. Then, a Thiessen polygon network covering the study area was generated, with the environment parameters predefined. This process identified the effective control area for each evaporation station. The phreatic evaporation coefficients were determined for each region based on the vadose zone media type and empirical values, ultimately yielding the phreatic evaporation volume.
Figure 5g illustrates that phreatic evaporation varies significantly across different areas of Tangshan. In the southern coastal plain, where the average groundwater depth is less than 4 m, evaporation is more sensitive to temperature variations. During summer, higher temperatures accelerate molecular motion, resulting in substantially increased phreatic evaporation. In contrast, the piedmont alluvial plains exhibit relatively deeper groundwater levels, leading to lower evaporation volumes.
According to the findings of the team’s previous studies on groundwater vulnerability in the region, groundwater vulnerability directly reflected the degree of groundwater susceptibility to external pollutants [22]; that is, it indirectly reflected the degree of change in groundwater dynamics, so there is a certain degree of duplication in the two studies in the selection of indicators.

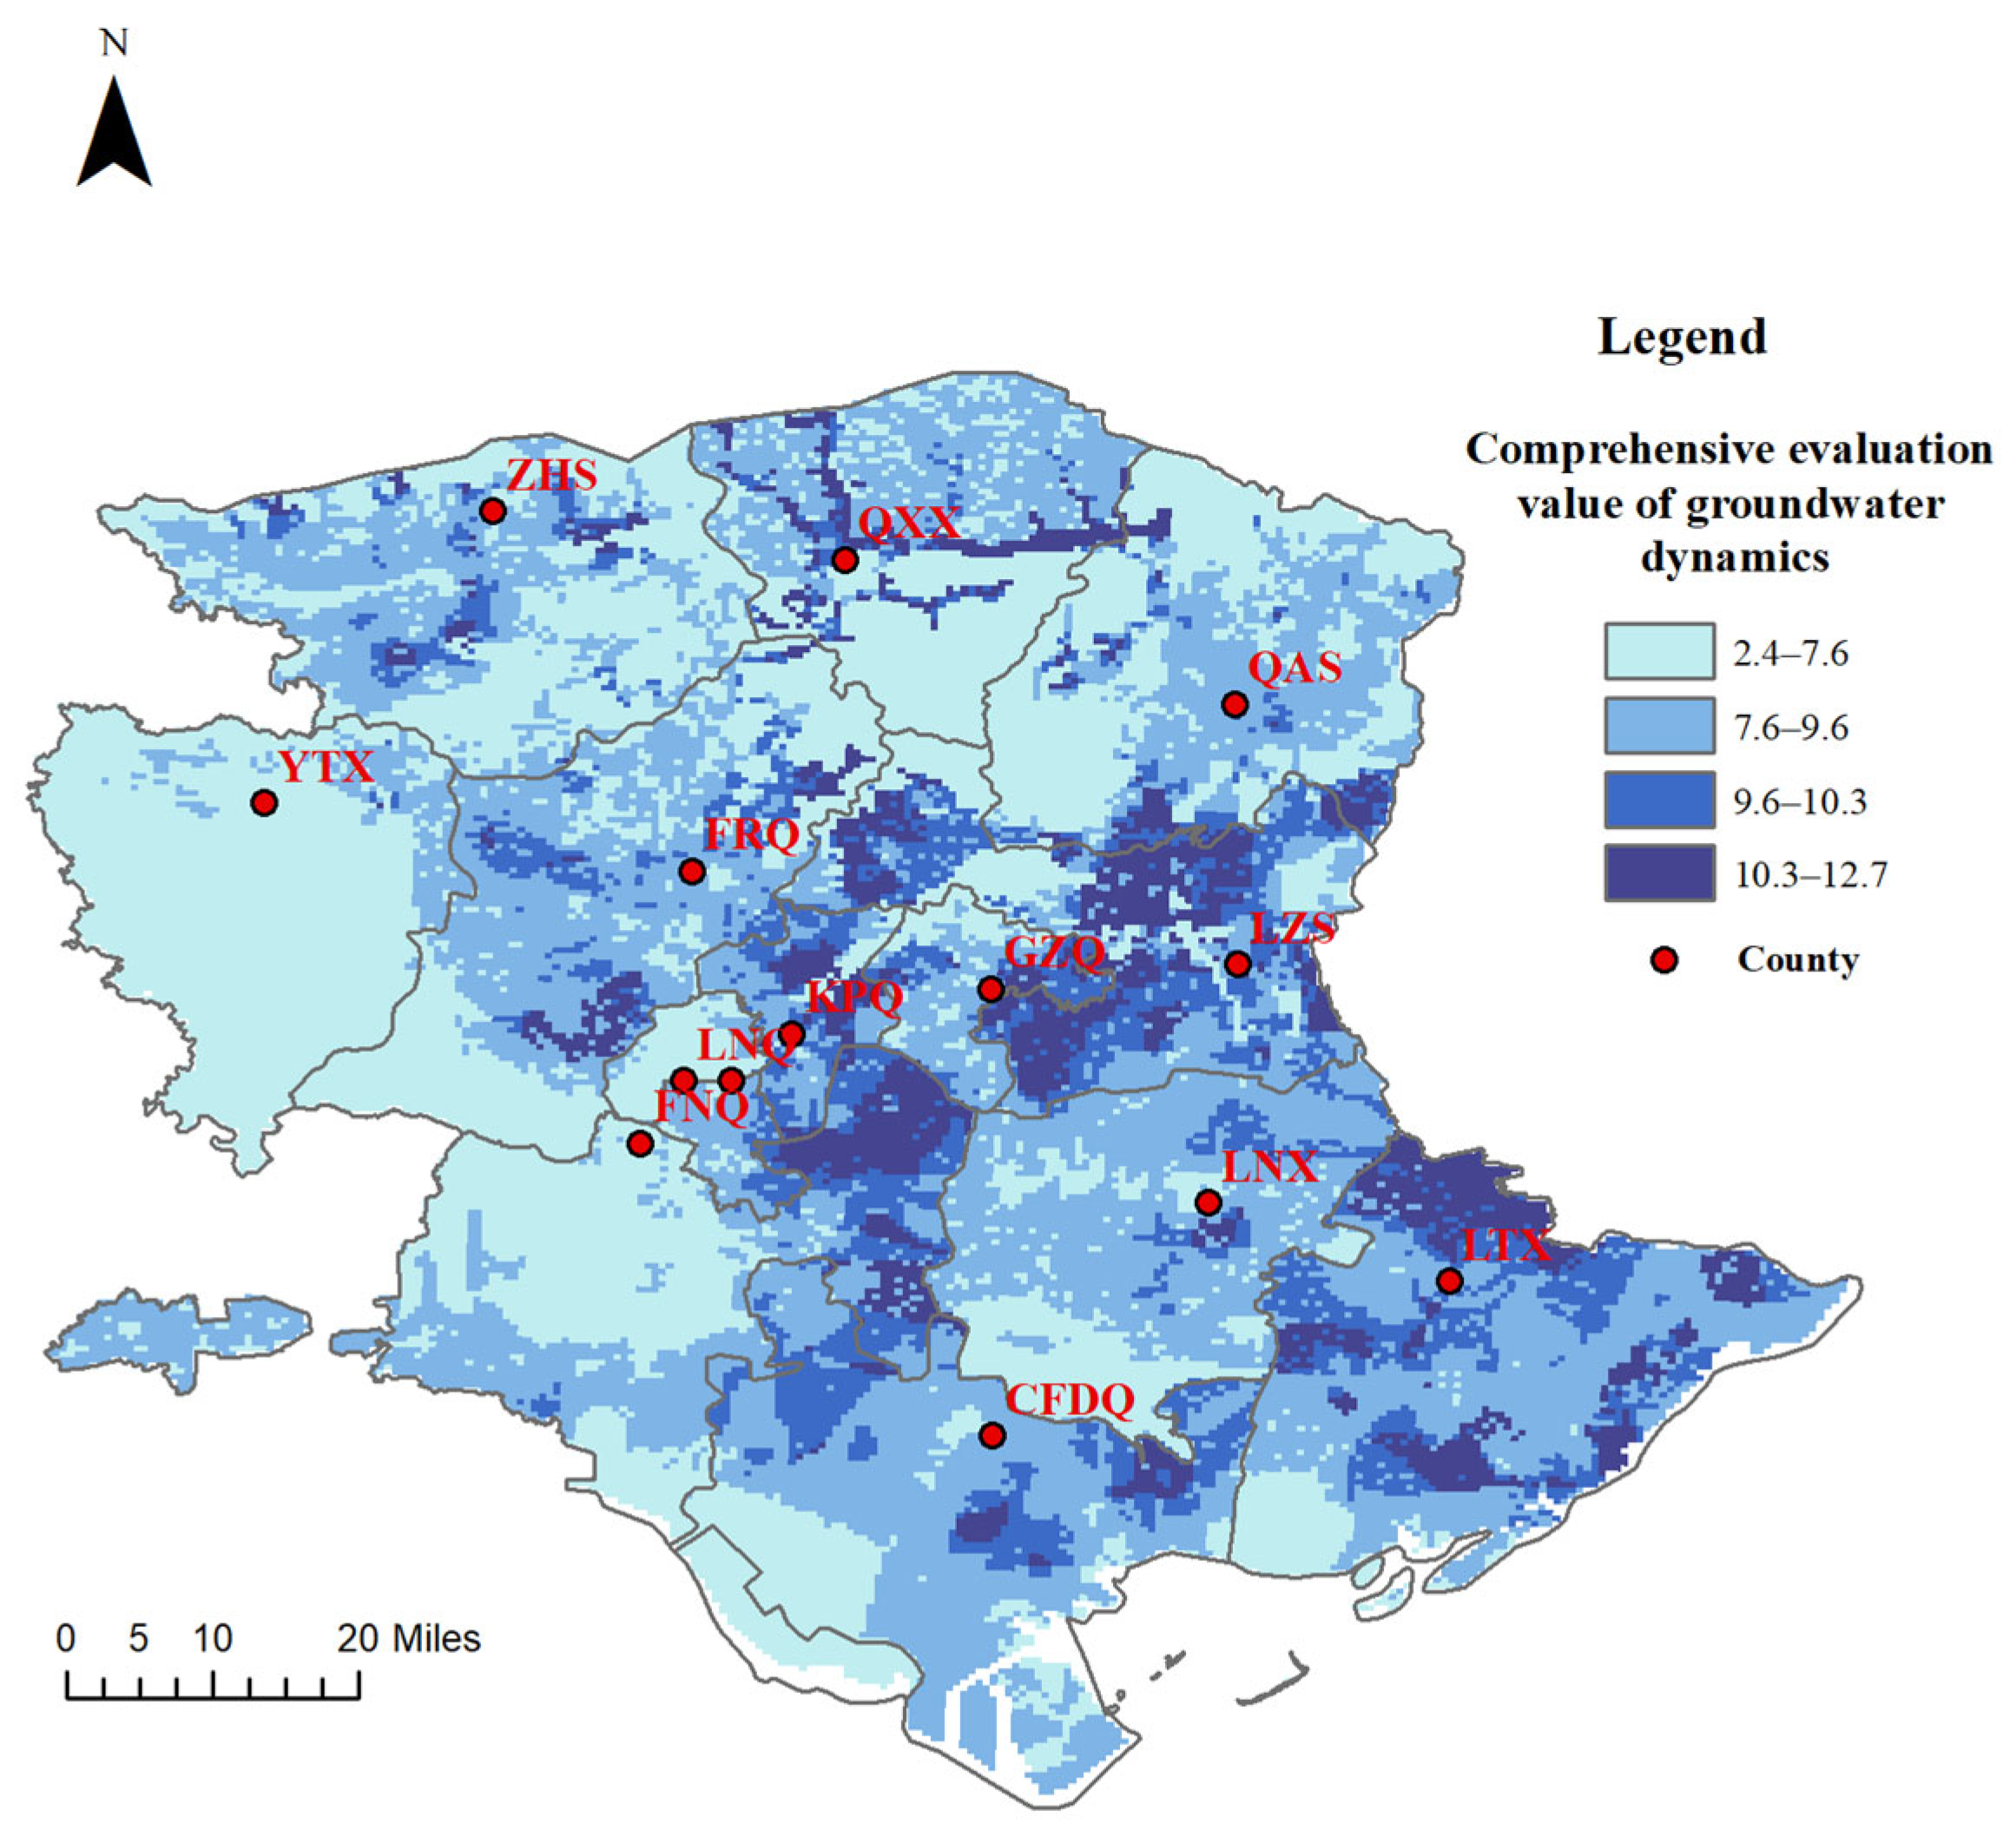
4.3.2. Results of the MFWCES-Based Evaluation of Groundwater Dynamics

Based on GIS and the study area profile, following the weighting requirements in the multi-factor weighted comprehensive evaluation system, the seven single-factor evaluation results were superimposed using the raster calculator function to obtain a comprehensive evaluation value of groundwater dynamics, with values ranging from 2.4 to 12.7. The obtained evaluation values are categorized into four types of response mechanisms, namely: rapid response (10.3–12.7), dual response to precipitation and anthropogenic extraction (9.6–10.3), delayed response (7.6–9.6), and strong superimposed response to human activities (2.4–7.6). Larger values represent a faster response of groundwater dynamics; conversely, smaller values indicates a relatively delayed response of groundwater dynamics. From Figure 6, the following conclusions can be obtained.
The areas with rapid response of groundwater dynamics to rainfall are mainly concentrated in LZS, KPQ, and the eastern part of FNQ. The hydraulic conductivity in these areas is large. In times of abundant rainfall, high precipitation and rapid infiltration of precipitation to recharge groundwater lead to a rise in the groundwater level. During the dry season, the amount of rainfall decreases significantly, so groundwater dynamics respond more quickly. Similarly, the valley plain area located in QXX responds quickly to rainfall because of the uniform and single lithological composition and rapid infiltration rate. In addition, there are other areas where such response mechanisms are distributed in small portions, e.g., the northern part of LTX. Regions of dual response to precipitation and anthropogenic extraction are scattered across the alluvial plain. The dynamic genesis of this type of groundwater is more complex, characterized by the interaction of natural recharge and anthropogenic discharge. Concentrated recharge from precipitation during the rainy season may temporarily mask the effects of mining; when precipitation is low during the dry season, extraction leads to an accelerated decline in water levels, and the combination of the two leads to fluctuations in water levels that depend on the dominant factors at different times of the year. Densely populated plains areas and agricultural cultivation lead to frequent tillage of the soil, which accelerates rainfall infiltration. To some extent, heavy groundwater extraction can also reduce the recharge efficiency of precipitation. In the southern regions of LNX and CFDQ, delayed-response mechanisms are predominantly distributed. The soils in these areas are primarily composed of loam and silt, characterized by low hydraulic conductivity and poor water transmissivity, which hinder recharge. CFDQ, situated near the coast, features low-lying terrain that facilitates moisture accumulation. The high local temperatures in this environment enhance evaporation, consuming part of the precipitation and causing a relatively delayed groundwater response to rainfall. The strong anthropogenic overlay response is characterized by groundwater level variations closely tied to human activities. This type of response is mainly observed in FNQ and YTX. In FNQ and YTX, where agriculture is prevalent, groundwater withdrawal for agricultural irrigation is the main reason for the lag in groundwater dynamics in response to precipitation.

4.4. Response Mechanisms and Validation of Groundwater Dynamic Characterization

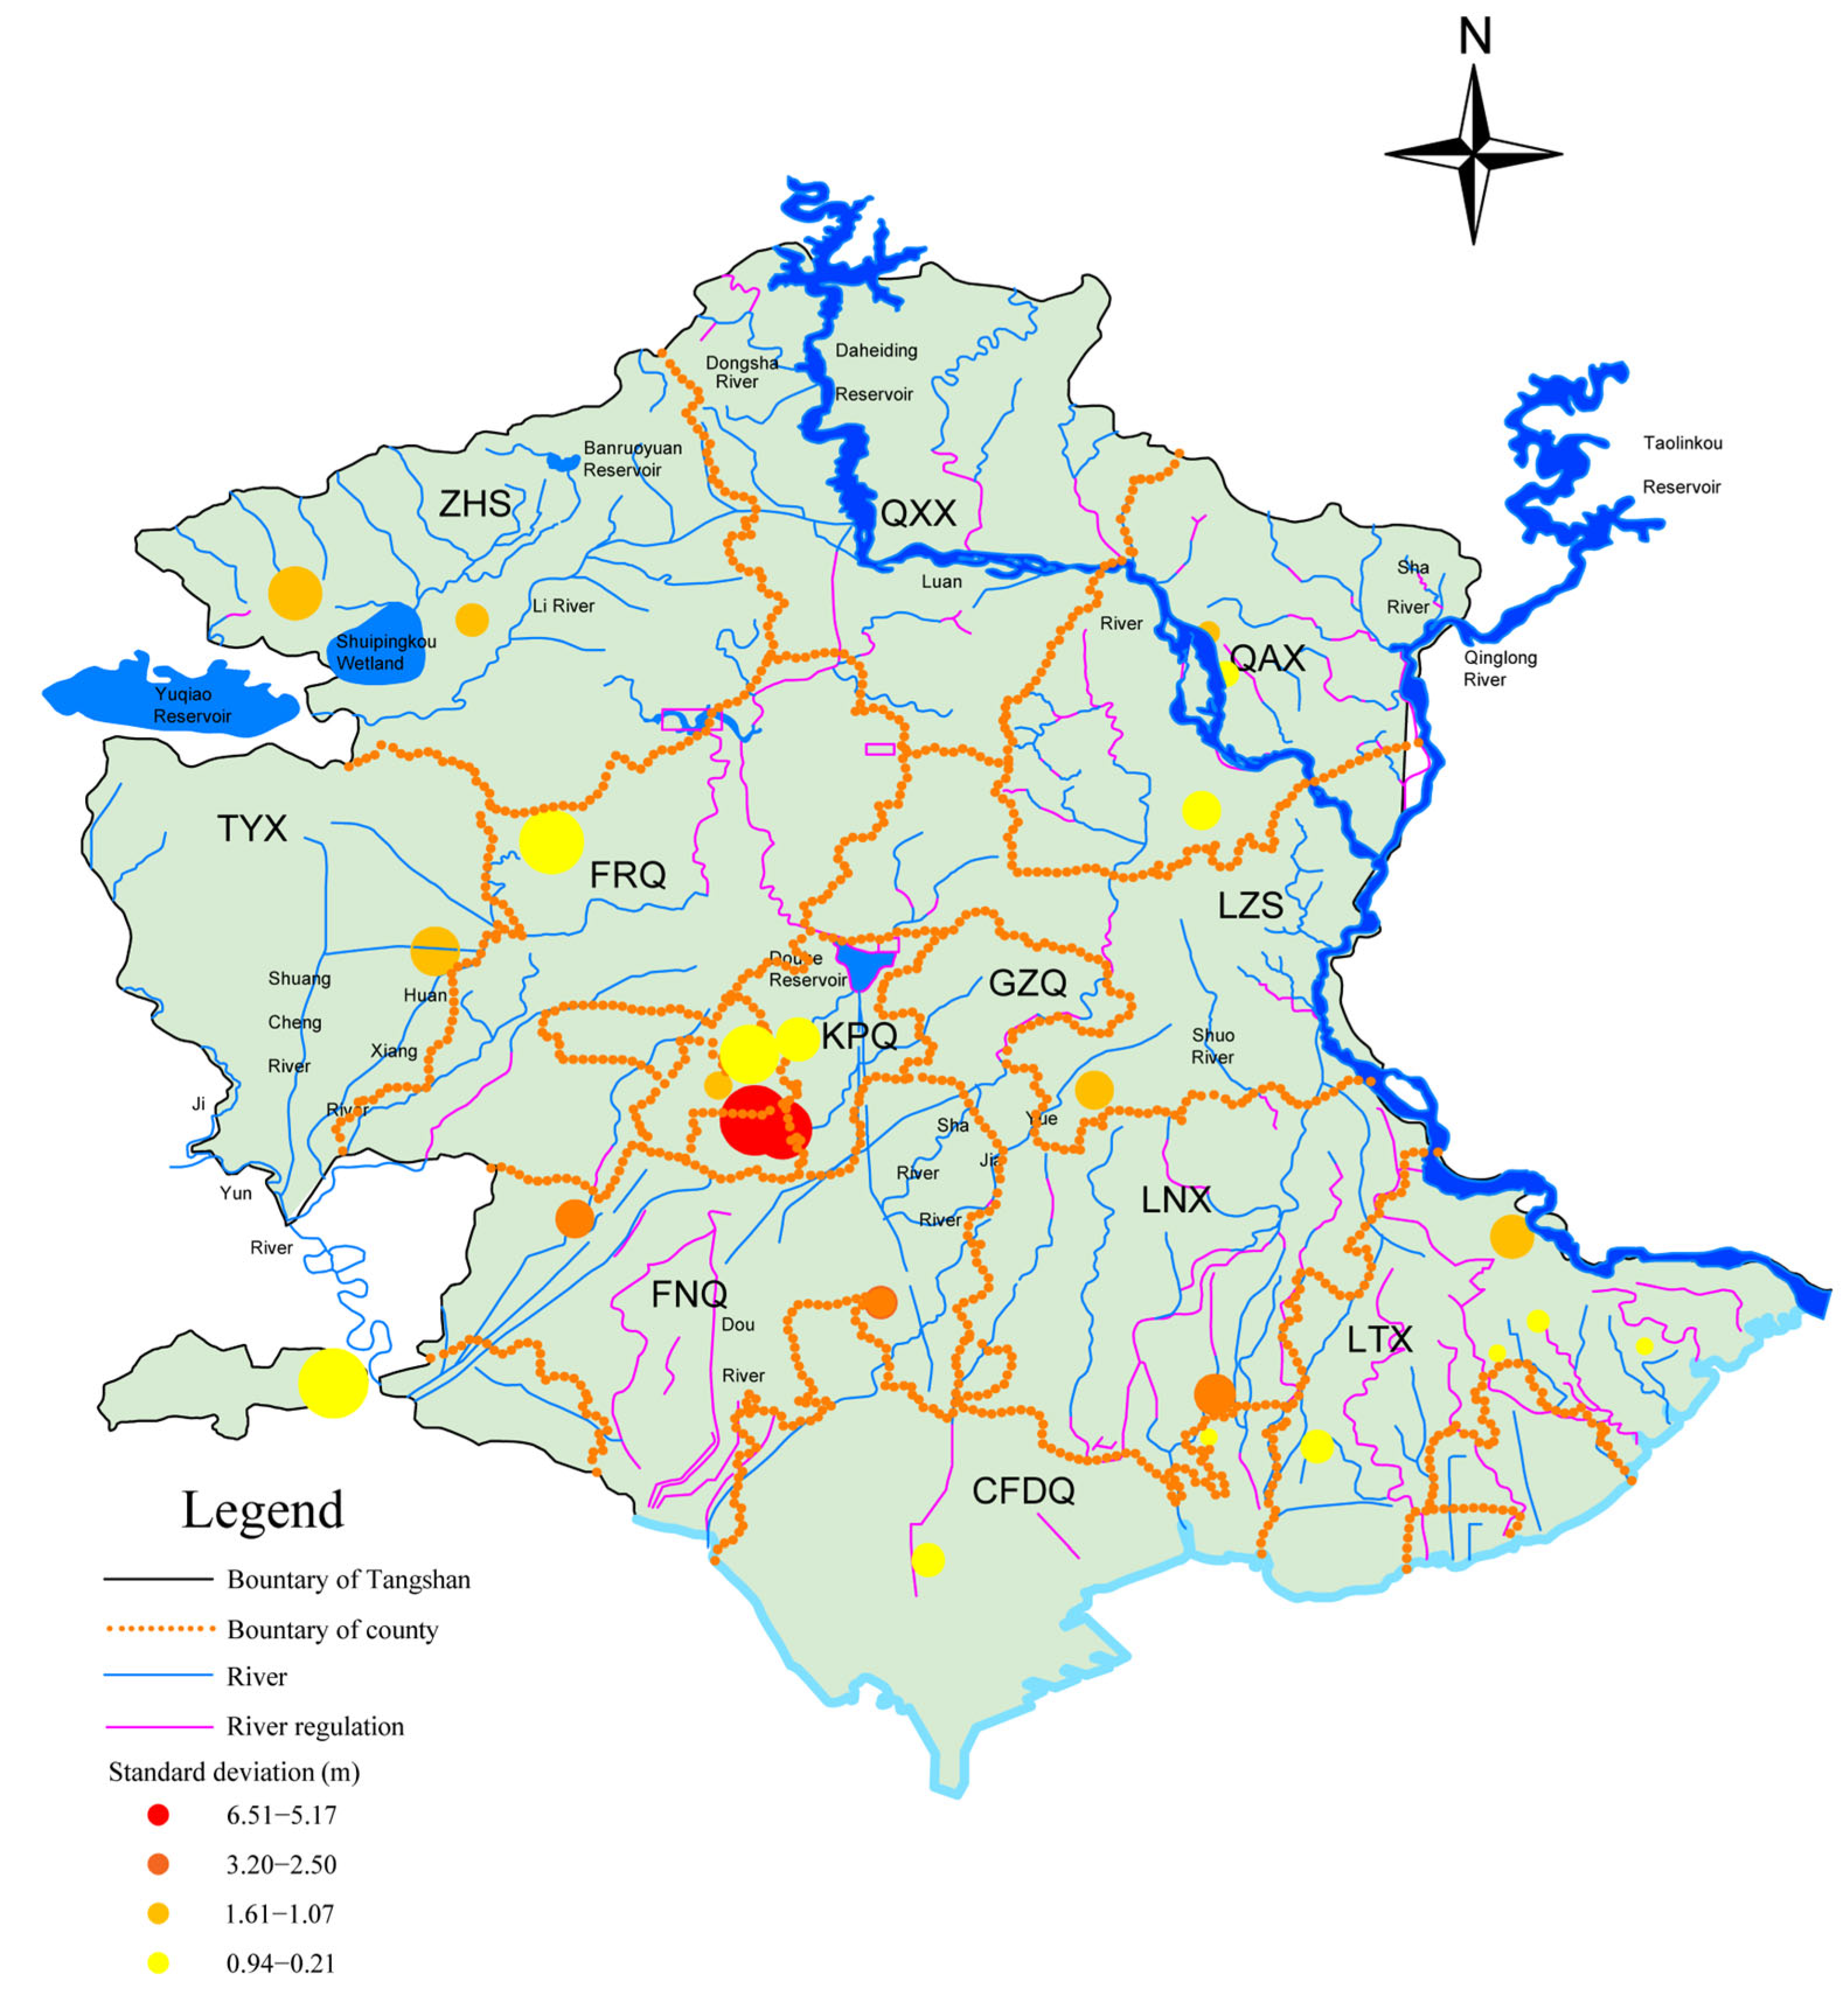
4.4.1. Impact of Hydraulic Engineering and Human Activities on Groundwater Dynamics

The spatial distribution characteristics of the impacts of the seven factors on the groundwater dynamics in this study area have been derived from previous studies. As a typical coastal area with dense population and rapid industrial development, the construction of water conservancy projects and the impacts of human activities also affect the dynamic changes of groundwater.
Niu et al. [48] explored the interactions among climate, human activities, and groundwater depth. It was concluded that anthropogenic variables were the main factors affecting shallow groundwater in urban areas with intensive human activities, while the influence of climate was gradually increasing in suburban areas. Li et al. [49] studied the response patterns of groundwater to its driving forces under the influence of human activities and found that areas with higher urbanization are more prone to groundwater depletion. Ahmed et al. [50] found that the trends in groundwater levels in five basins in Morocco were mainly related to groundwater extraction rates and rainfall. Lee et al. [51] assessed groundwater sustainability based on natural and anthropogenic factors and their spatio-temporal changes. They found that downstream groundwater wells were influenced by local human activities and recharged from upstream, causing a blurred relationship between precipitation and water levels.
Standard deviation, as the most commonly used indicator of the degree of statistical distribution in probability statistics, responds to the degree of dispersion of data within a group. In this study, the standard deviation in groundwater level was used to characterize the degree of response of groundwater dynamics to rainfall, which was more intuitive than exploring fluctuations in groundwater level with cumulative precipitation, cumulative groundwater level rise, and groundwater level variance. The data of groundwater depth of 24 wells for 32 months (January 2018 to August 2020) were counted, and the data for each well for 32 months were taken as a group to calculate the standard deviation of the groundwater level in each well, and the results were obtained: the standard deviation ranged from 0.21 to 6.51. The obtained results were divided into four parts, marked with dots according to a certain size and scale and differentiated by color, and plotted into the groundwater dynamic evaluation results of MFWCES and the two base maps of rivers and water conservancy projects.
The larger the standard deviation (the darker the color and larger the diameter of the dots), the faster the response of groundwater dynamics to precipitation, and vice versa: the lighter the color and smaller the diameter of the dots, the more lagging the response to precipitation. As can be seen in Figure 7, the red and orange dots are located in areas where water conservancy construction and human activities are more intensive. The northern mountainous areas has relatively little water conservancy construction, and the dots are lighter in color and smaller in diameter.

4.4.2. Response Mechanisms for Characterizing Groundwater Dynamics

Based on the correspondence between peak precipitation and the month of occurrence of the peak groundwater level, as well as the length of time that the high groundwater level continues to occur, we calculated dynamic characteristics, such as the amplitude of the water level variation during the year. The response relationship of groundwater dynamics to precipitation were categorized into four types: rapid response, precipitation–artificial mining dual response, delayed response, and strong superimposed response to human activities.
  • Rapid response
A rapid response is characterized by dynamics, and groundwater variability within the year is small, ranging from 1 to 5 m. Generally, peak precipitation occurred in August of each year, and the peak in groundwater levels occurred in September of each year; the peak in groundwater levels would have a rapid response to peak precipitation. The lowest value of precipitation occurred in January of each year, and the lowest value for groundwater levels occurred in February-May of each year. Influenced by the characteristics of groundwater runoff and drainage of different geomorphic types and the regulating effect of the vadose zone on groundwater evaporation, the response of low groundwater values to low precipitation values in different regions presented different characteristics.
2.
Precipitation–artificial mining dual response
The dynamic of the precipitation–artificial mining dual response is characterized by the fact that the general groundwater level does not show a significant response relationship with precipitation. The groundwater level will drop significantly during the period of artificial mining and will rise rapidly after the end of mining. When the amount of exploitation is greater than the annual recharge of groundwater, negative equilibrium of groundwater occurs, and the groundwater level decreases year by year.
3.
Delayed response
The dynamic characteristics of delayed response show that the variation of groundwater within the year was large, ranging from 2 to 10 m. Generally, peak precipitation occurs in August of each year, while the peak in the groundwater level occurs in February of the following year; thus, there is a six-month response period for the peak groundwater level to follow peak precipitation. The lowest value of precipitation occurs in January of each year, and the lowest value of groundwater level occurs in May–July of each year; the response period of the low values of both is also about half a year. In different areas, the groundwater level will start to fall during the two agricultural irrigation periods of March-May and May-July, followed by a period of high groundwater levels for about four consecutive months.
4.
Strong superimposed response to human activities
The dynamics of strong superimposed response to human activities characterize a groundwater level that is closely related to human activities. Human activities change the natural dynamics of groundwater by adding new sources of recharge or new destinations for discharge [49]. During the dry season, April-June, when precipitation is low and recharge from precipitation is insufficient, groundwater needs to be extracted for agricultural irrigation, resulting in lowering of the groundwater level. During the rainy season, July-September, when precipitation increases and less water is used for agriculture, the depth of the groundwater rises.

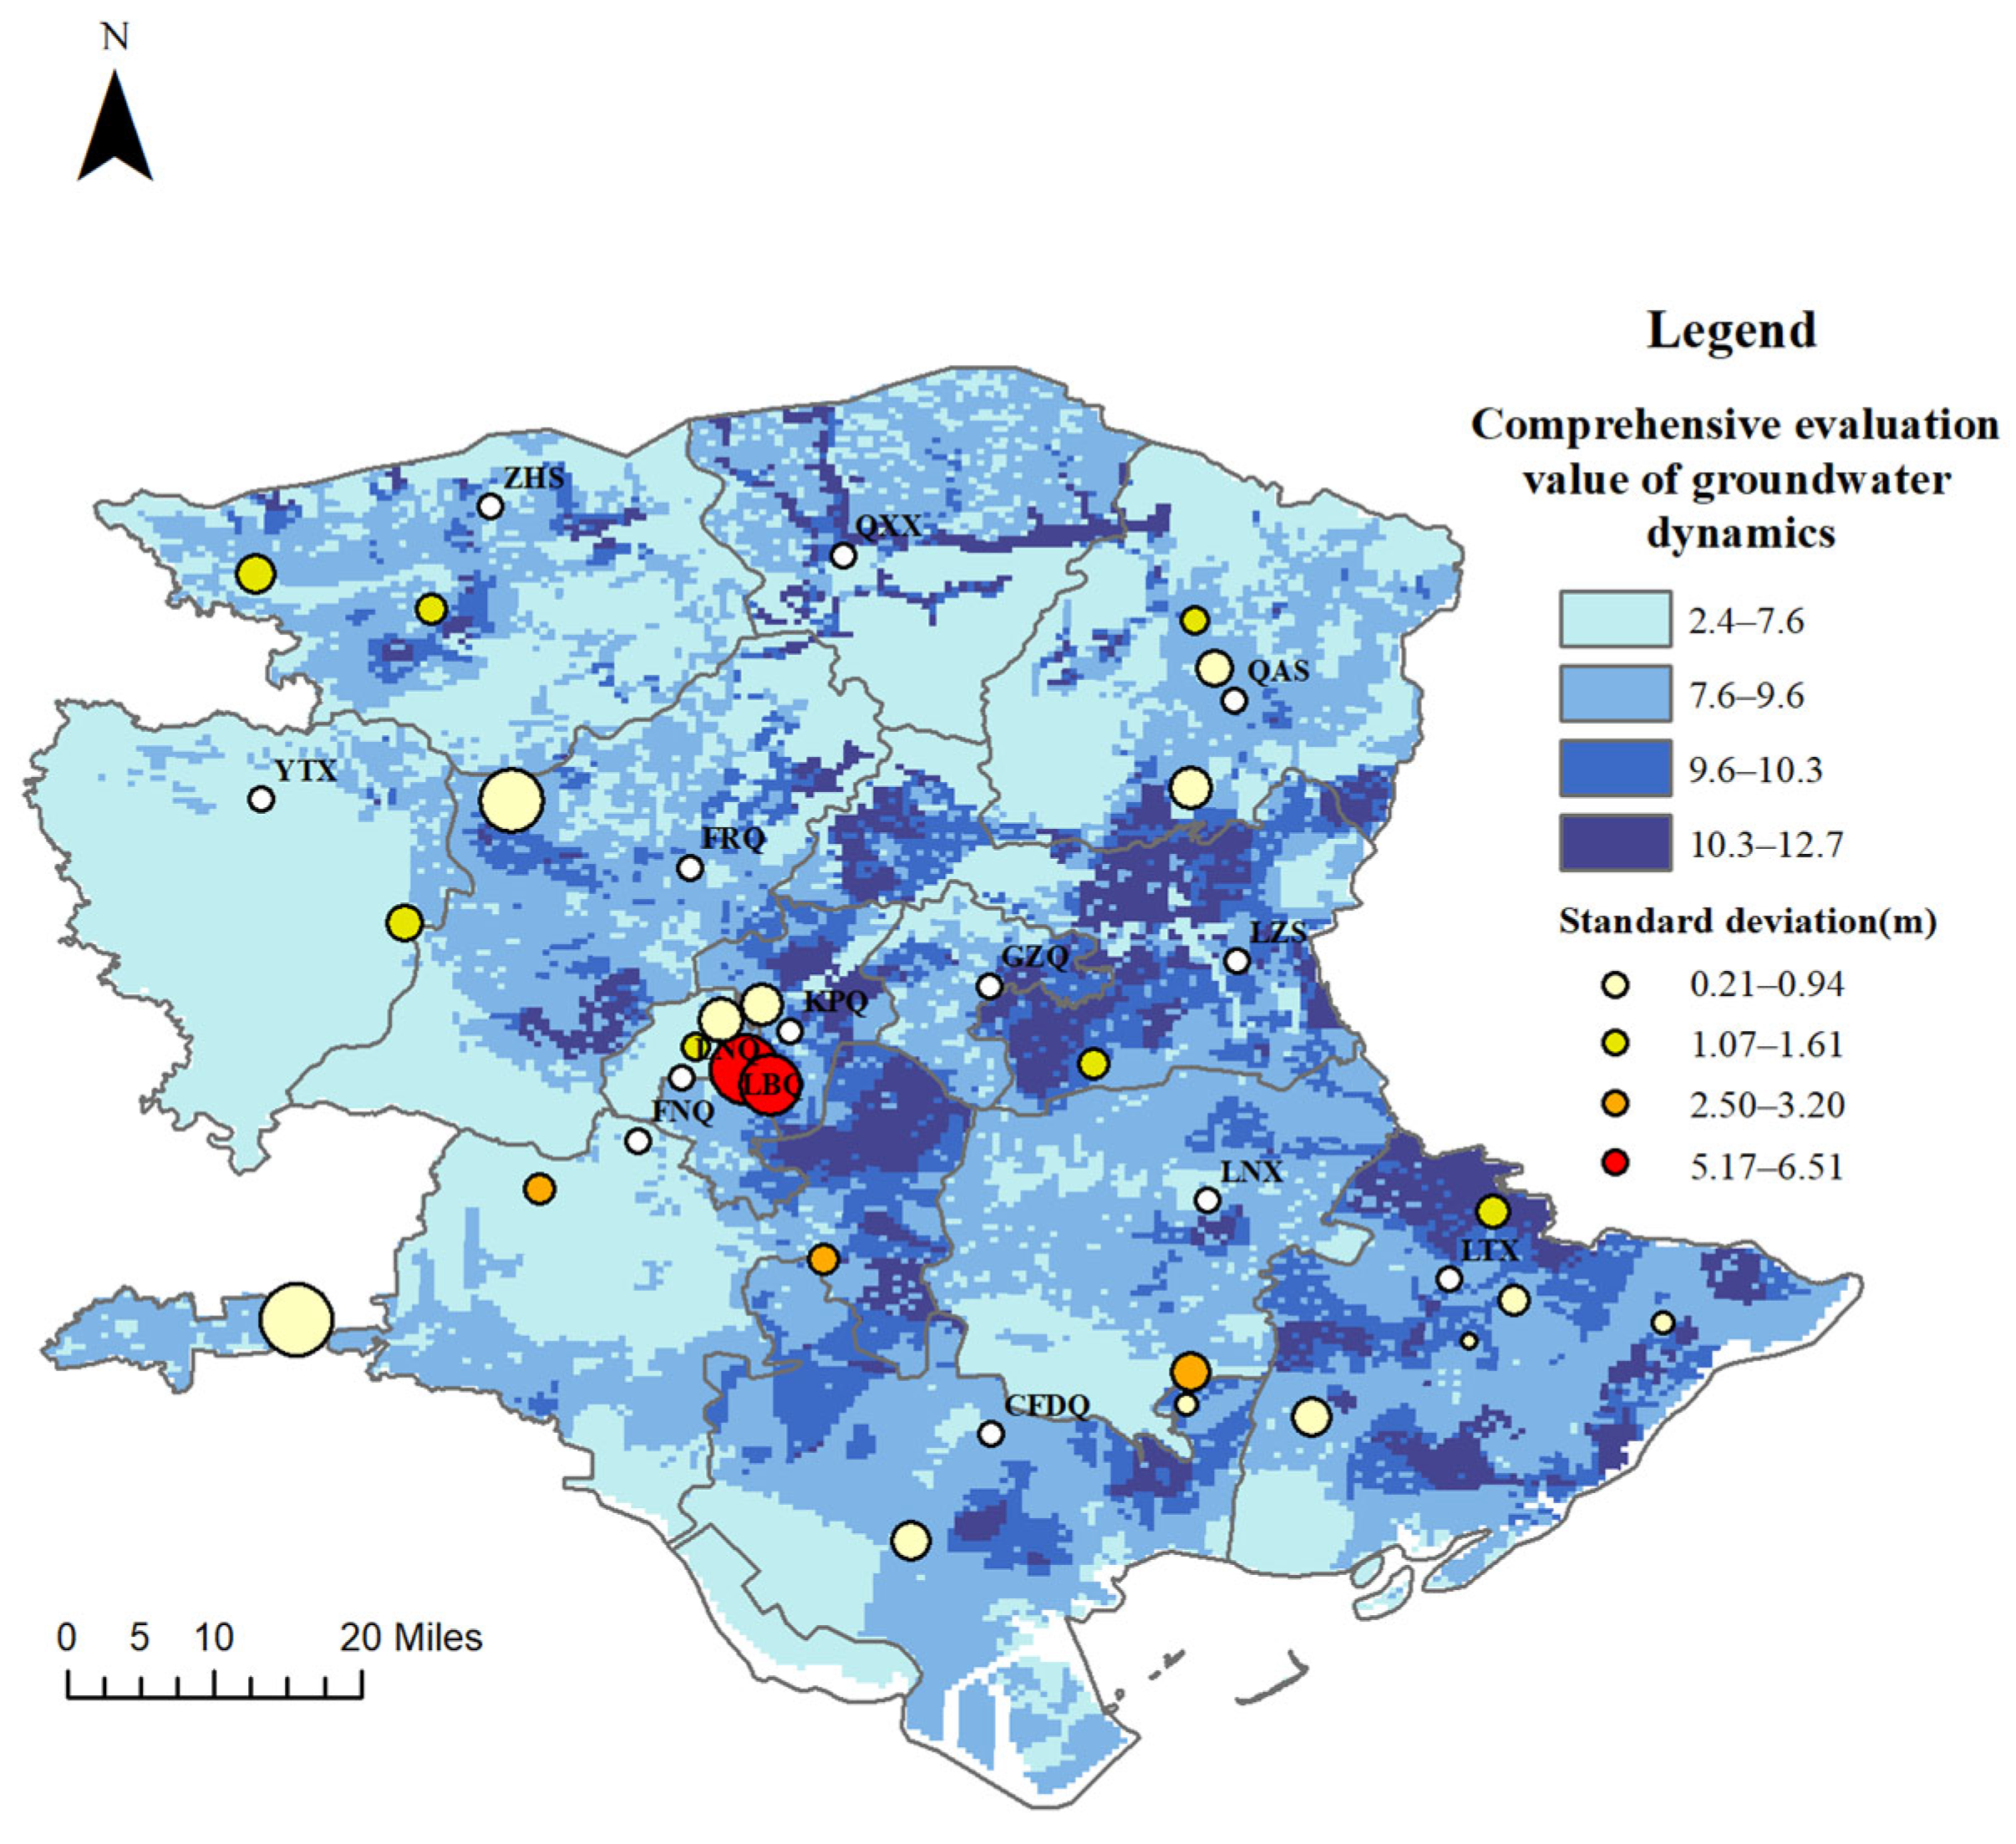
4.4.3. Response Mechanism and Validation of Groundwater Dynamic Characterization

Natural factors (including precipitation and depth of groundwater), as well as land use type and other human activities, had a significant impact on groundwater dynamics [49]. Hydraulic conductivity, soil media type, etc. fluctuate groundwater levels by affecting the infiltration capacity and rate of rainfall. Topography and depth of groundwater reflect some of the topographic and geomorphological features, which can have an impact on groundwater dynamics. In addition, human activities will also cause some damage to the balance of natural groundwater and disturb the groundwater dynamics. MFWCES comprehensively considered seven major factors, such as aquifer thickness, assigned different weights to them according to their impacts on changes in the groundwater level, and superimposed the evaluation scores of the seven factors, so as to obtain a comprehensive evaluation value that can objectively respond to the characteristics of changes in groundwater dynamics. Based on the comprehensive evaluation values, combined with the temporal relationship between peak precipitation and peak groundwater levels, groundwater level variation patterns, human activities, and hydraulic engineering construction, the response of groundwater dynamics to precipitation is classified into four types.
In Figure 8, the color and diameter of the dots represent the standard deviation of the groundwater level; the larger the standard deviation is, the more significant the change in groundwater dynamics throughout the year. The standard deviation threshold of groundwater in this region ranged from 0.21 to 6.51 m. From the overall spatial distribution characteristics, most of the points with large standard deviation fall in the areas with a high MFWCES index, and the correlation can reach more than 60%. The correlation is more ambiguous in other areas due to climate and other unconsidered factors. After verification, the data are accurate, and the method is reasonable.

4.5. Future Monitoring and the Long-Term Sustainability of Groundwater Supplies

Sustainable management of groundwater resources is of paramount importance; however, current management measures may significantly lag behind the rate of aquifer depletion, especially in the severely over-exploited North China Plain. The MFWCES model developed in this study does not incorporate key factors such as drainage line density, indicating that the evaluation framework requires further refinement. In addressing complex nonlinear groundwater dynamics, machine learning techniques—particularly ensemble methods like random forest—show substantial potential [52]. An integrated approach that combines the evaluation framework, machine learning-based hydrological models, and both in situ and remote sensing data can estimate parameters that are otherwise difficult to measure directly, thereby providing reliable information for sustainable economic and hydrological management [53]. Currently, methodologies for studying changes in groundwater storage are constrained by limitations in data resolution, temporal span, and model uncertainty; as a result, the overall complexity, local precision, and long-term applicability of the conclusions require further verification [54]. Future research should integrate higher-resolution remote sensing data, field monitoring, and policy analysis to support the development of more precise sustainable management strategies.

5. Conclusions

In this study, a typical hilly plain area is used as a case study to investigate the dynamic characteristics and response mechanisms of groundwater under compound stress. Supported by well observation data and other geological datasets, the analysis—which integrates mathematical statistics, correlation analysis, and a GIS-based multi-factor weighted comprehensive evaluation system (MFWCES)—yields the following conclusions:
(1)
The auto-correlation coefficient of the groundwater level decreased from 0.8 to 0.2 in 60–75 days on average, and the correlation decreased slowly with an increase in lag time. The cross-correlation analysis of groundwater level and precipitation showed that, when the lag time was between 0 and 7 months, the cross-correlation coefficient changed from a weak negative correlation to no correlation to a weak positive correlation.
(2)
According to the characteristics of the groundwater dynamic curve and the results of the correlation analysis, the dynamic type of groundwater in Tangshan City was classified into four categories: precipitation-infiltration type, runoff type, irrigation-infiltration type, and artificial exploitation type.
Precipitation-infiltration type: Strong seasonal variation, with groundwater peaks aligned with or lagging 1–3 months behind precipitation peaks.
Runoff type: The changes throughout the year are relatively stable. The peak of the groundwater level often occurs later than the peak of rainfall.
Irrigation-infiltration type: Clear response during irrigation periods, reflecting agricultural water use.
Artificial exploitation type: Significant fluctuations driven by intensive groundwater extraction in plain areas.
(3)
The results of the GIS-based evaluation of MFWCES groundwater dynamics had a score size ranging from 2.4 to 12.7. Combining the two main categories of influencing factors of groundwater dynamics––natural factors and human activities––the response relationship of groundwater dynamics to precipitation was classified into four categories: rapid response (10.3–12.7), dual response to precipitation and anthropogenic extraction (9.6–10.3), delayed response (7.6–9.6), and strong superimposed response to human activities (2.4–7.6). Finally, the evaluation results were validated using the standard deviation of the groundwater level. The standard deviation was calculated to be in the range of 0.21 to 6.51. After validation, it was found that wells with relatively large standard deviations fell in areas with a high MFWCES evaluation index value. Moreover, the impact of water conservancy construction and human activities is particularly significant in LBQ, KPQ, LNX, and FNQ, while tides increase the periodicity of the dynamics. This study’s classification of groundwater dynamic response types, together with its quantitative assessment of groundwater reactions to precipitation, offers a novel perspective for regional water resource planning, ecological protection, and the development of differentiated groundwater management strategies under compound stress.

Author Contributions

Q.Z.: writing—original draft; M.Z. (Meng Zhang): writing—review and editing; W.J.: writing—review and editing; Y.H.: data; F.C.: software; M.Z. (Mucheng Zhang): investigation. All authors have read and agreed to the published version of the manuscript.

Funding

This study was supported by the National Key Research and Development Program of China (No. 2023YFD1900802-01) and the National Natural Science Foundation of China (No. 41907149).

Data Availability Statement

All the data in this manuscript are derived from field surveys, reports, and references.

Conflicts of Interest

The authors declare no conflicts of interest.

Appendix A

Table A1. Abbreviations and full names of administrative region.
Abbreviation of Administrative RegionFull Name of Administrative Region
ZHSZunhua Shi
QXXQianxi Xian
QASQianan Shi
YTXYutian Xian
FRQFengrun Qu
KPQKaiping Qu
GZQGuzhi Qu
LZSLuanzhou Shi
LBQLubei Qu
LNQLunan Qu
FNQFengnan Qu
LNXLuannan Xian
CFDQCaofeidian Qu
LTXLeting Xian

References

  1. Satoh, Y.; Kahil, T.; Byers, E.; Burek, P.; Fischer, G.; Tramberend, S.; Greve, P.; Flörke, M.; Eisner, S.; Hanasaki, N.; et al. Multi-model and multi-scenario assessments of Asian water futures: The Water Futures and Solutions (WFaS) initiative. Earth’s Future 2017, 5, 823–852. [Google Scholar] [CrossRef]
  2. Van Camp, M.; Mtoni, Y.; Mjemah, I.C.; Bakundukize, C.; Walraevens, K. Investigating seawater intrusion due to groundwater pumping with schematic model simulations: The example of the Dar es Salaam coastal aquifer in Tanzania. J. Afr. Earth Sci. 2014, 96, 71–78. [Google Scholar] [CrossRef]
  3. Sun, Y.; Xu, S.; Wang, Q.; Hu, S.; Qin, G.; Yu, H. Response of a Coastal Groundwater System to Natural and Anthropogenic Factors: Case Study on East Coast of Laizhou Bay, China. Int. J. Environ. Res. Public Health 2020, 17, 5204. [Google Scholar] [CrossRef]
  4. Schreiner-McGraw, A.P.; Ajami, H. Delayed response of groundwater to multi-year meteorological droughts in the absence of anthropogenic management. J. Hydrol. 2021, 603, 126917. [Google Scholar] [CrossRef]
  5. Sheng, Y.; Wang, G.; Zhao, D.; Hao, C.; Liu, C.; Cui, L.; Zhang, G. Groundwater Microbial Communities Along a Generalized Flowpath in Nomhon Area, Qaidam Basin, China. Groundwater 2018, 56, 719–731. [Google Scholar] [CrossRef]
  6. Giordano, M. Global groundwater? Issues and solutions. Annu. Rev. Environ. Resour. 2009, 34, 153–178. [Google Scholar] [CrossRef]
  7. Ahmad, S.; Liu, H.; Günther, A.; Couwenberg, J.; Lennartz, B. Long-term rewetting of degraded peatlands restores hydrological buffer function. Sci. Total Environ. 2020, 749, 141571. [Google Scholar] [CrossRef]
  8. Alfio, M.R.; Pisinaras, V.; Panagopoulos, A.; Balacco, G. Groundwater level response to precipitation at the hydrological observatory of Pinios (central Greece). Groundw. Sustain. Dev. 2024, 24, 101081. [Google Scholar] [CrossRef]
  9. Cui, Y.; Liao, Z.; Wei, Y.; Xu, X.; Song, Y.; Liu, H. The Response of Groundwater Level to Climate Change and Human Activities in Baotou City, China. Water 2020, 12, 1078. [Google Scholar] [CrossRef]
  10. Balacco, G.; Alfio, M.R.; Fidelibus, M.D. Groundwater Drought Analysis under Data Scarcity: The Case of the Salento Aquifer (Italy). Sustainability 2022, 14, 707. [Google Scholar] [CrossRef]
  11. Jin, G.; Shimizu, Y.; Onodera, S.; Saito, M.; Matsumori, K. Evaluation of drought impact on groundwater recharge rate using SWAT and Hydrus models on an agricultural island in western Japan. Proc. IAHS 2015, 371, 143–148. [Google Scholar] [CrossRef]
  12. Yin, X.; Shu, L.; Wang, Z.; Lu, C.; Liu, B. Time-frequency analysis of groundwater depth variation based on the ICA-WTC composite method. J. Hydrol. 2023, 617, 128914. [Google Scholar] [CrossRef]
  13. Russo, T.A.; Lall, U. Depletion and response of deep groundwater to climate-induced pumping variability. Nat. Geosci. 2017, 10, 105–108. [Google Scholar] [CrossRef]
  14. Wang, D.; Li, P.; He, X.; He, S. Exploring the response of shallow groundwater to precipitation in the northern piedmont of the Qinling Mountains, China. Urban Clim. 2023, 47, 101379. [Google Scholar] [CrossRef]
  15. Qi, P.; Zhang, G.; Xu, Y.J.; Wang, L.; Ding, C.; Cheng, C. Assessing the Influence of Precipitation on Shallow Groundwater Table Response Using a Combination of Singular Value Decomposition and Cross-Wavelet Approaches. Water 2018, 10, 598. [Google Scholar] [CrossRef]
  16. Kellner, E.; Hubbart, J.A. Land use impacts on floodplain water table response to precipitation events. Ecohydrology 2018, 11, e1913. [Google Scholar] [CrossRef]
  17. Jiang, W.; Sheng, Y.; Shi, Z.; Guo, H.; Chen, X.; Mao, H.; Liu, F.; Ning, H.; Liu, N.; Wang, G. Hydrogeochemical characteristics and evolution of formation water in the continental sedimentary basin: A case study in the Qaidam Basin, China. Sci. Total Environ. 2024, 957, 177672. [Google Scholar] [CrossRef]
  18. Schiavo, M. Probabilistic delineation of subsurface connected pathways in alluvial aquifers under geological uncertainty. J. Hydrol. 2022, 615, 128674. [Google Scholar] [CrossRef]
  19. Meng, Q.; Xing, L.; Liu, L.; Xing, X.; Zhao, Z.; Zhang, F.; Li, C. Time-lag characteristics of the response of karst springs to precipitation in the northern China. Environ. Earth Sci. 2021, 80, 348. [Google Scholar] [CrossRef]
  20. Fronzi, D.; Mirabella, F.; Cardellini, C.; Caliro, S.; Palpacelli, S.; Cambi, C.; Valigi, D.; Tazioli, A. The Role of Faults in Groundwater Circulation before and after Seismic Events: Insights from Tracers, Water Isotopes and Geochemistry. Water 2021, 13, 1499. [Google Scholar] [CrossRef]
  21. Tian, Y.; Yang, Y.; Bao, Z.; Song, X.; Wang, G.; Liu, C.; Wu, H.; Mo, Y. An Analysis of the Impact of Groundwater Overdraft on Runoff Generation in the North China Plain with a Hydrological Modeling Framework. Water 2022, 14, 1758. [Google Scholar] [CrossRef]
  22. Zhang, Q.; Shan, Q.; Chen, F.; Liu, J.; Yuan, Y. Groundwater Vulnerability Assessment and Protection Strategy in the Coastal Area of China: A GIS-Based DRASTIC Model Approach. Appl. Sci. 2023, 13, 10781. [Google Scholar] [CrossRef]
  23. Dai, X.; Xie, Y.; Liao, A.; Wang, C.; Lin, J.; Wu, J. Quantifying hydrological responses to monsoon-controlled precipitation across the soil-groundwater-stream continuum with long-term high-frequency hydrometric monitoring. Hydrol. Process. 2024, 38, e15089. [Google Scholar] [CrossRef]
  24. Royer-Carenzi, M.; Hassani, H. Deviations from Normality in Autocorrelation Functions and Their Implications for MA(q) Modeling. Stats 2025, 8, 19. [Google Scholar] [CrossRef]
  25. Li, W.; Bao, L.; Yao, G.; Wang, F.; Guo, Q.; Zhu, J.; Zhu, J.; Wang, Z.; Bi, J.; Zhu, C.; et al. The analysis on groundwater storage variations from GRACE/GRACE-FO in recent 20 years driven by influencing factors and prediction in Shandong Province, China. Sci. Rep. 2024, 14, 5819. [Google Scholar] [CrossRef] [PubMed]
  26. Wang, S.; Song, X.; Wang, Q.; Xiao, G.; Liu, C.; Liu, J. Shallow groundwater dynamics in North China Plain. J. Geogr. Sci. 2009, 19, 175–188. [Google Scholar] [CrossRef]
  27. Etuk, M.N.; Igwe, O.; Egbueri, J.C. An integrated geoinformatics and hydrogeological approach to delineating groundwater potential zones in the complex geological terrain of Abuja, Nigeria. Model. Earth Syst. Environ. 2023, 9, 285–311. [Google Scholar] [CrossRef]
  28. China Hydrology Society. Guidelines for Groundwater Dynamics Analysis and Evaluation; China Institute of Water Resources and Hydropower: Beijing, China, 2023. [Google Scholar]
  29. Zhong, X.; Gong, H.; Chen, B.; Zhou, C.; Xu, M. Study on the evolution of shallow groundwater levels and its spatiotemporal response to precipitation in the Beijing Plain of China based on variation points. Ecol. Indic. 2024, 166, 112466. [Google Scholar] [CrossRef]
  30. Duvert, C.; Jourde, H.; Raiber, M.; Cox, M.E. Correlation and spectral analyses to assess the response of a shallow aquifer to low and high frequency rainfall fluctuations. J. Hydrol. 2015, 527, 894–907. [Google Scholar] [CrossRef]
  31. Tirogo, J.; Jost, A.; Biaou, A.; Valdes-Lao, D.; Koussoubé, Y.; Ribstein, P. Climate Variability and Groundwater Response: A Case Study in Burkina Faso (West Africa). Water 2016, 8, 171. [Google Scholar] [CrossRef]
  32. Cao, G.; Scanlon, B.R.; Han, D.; Zheng, C. Impacts of thickening unsaturated zone on groundwater recharge in the North China Plain. J. Hydrol. 2016, 537, 260–270. [Google Scholar] [CrossRef]
  33. Richardson, C.M.; Davis, K.L.; Ruiz-González, C.; Guimond, J.A.; Michael, H.A.; Paldor, A.; Moosdorf, N.; Paytan, A. The impacts of climate change on coastal groundwater. Nat. Rev. Earth Environ. 2024, 5, 100–119. [Google Scholar] [CrossRef]
  34. Chala, D.C.; Quiñones-Bolaños, E.; Mehrvar, M. An integrated framework to model salinity intrusion in coastal unconfined aquifers considering intrinsic vulnerability factors, driving forces, and land subsidence. J. Environ. Chem. Eng. 2022, 10, 106873. [Google Scholar] [CrossRef]
  35. Zuecco, G.; Rinderer, M.; Penna, D.; Borga, M.; van Meerveld, H.J. Quantification of subsurface hydrologic connectivity in four headwater catchments using graph theory. Sci. Total Environ. 2019, 646, 1265–1280. [Google Scholar] [CrossRef]
  36. Kim, B.; Roh, G.; Lee, J.; Yoon, J.; Lee, J. Characterizing the hydraulic conductivity of soil based on the moving average of precipitation and groundwater level using a regional database. AQUA–Water Infrastruct. Ecosyst. Soc. 2023, 72, 1459–1473. [Google Scholar] [CrossRef]
  37. Lorenzo-Lacruz, J.; Garcia, C.; Morán-Tejeda, E. Groundwater level responses to precipitation variability in Mediterranean insular aquifers. J. Hydrol. 2017, 552, 516–531. [Google Scholar] [CrossRef]
  38. Corona, C.R.; Ge, S.; Anderson, S.P. Water-table response to extreme precipitation events. J. Hydrol. 2023, 618, 129140. [Google Scholar] [CrossRef]
  39. Nair, A.M.; Prasad, K.R.; Srinivas, R. Groundwater vulnerability assessment of an urban coastal phreatic aquifer in India using GIS-based DRASTIC model. Groundw. Sustain. Dev. 2022, 19, 100810. [Google Scholar]
  40. Cai, Y.; Huang, R.; Xu, J.; Xing, J.; Yi, D. Dynamic Response Characteristics of Shallow Groundwater Level to Hydro-Meteorological Factors and Well Irrigation Water Withdrawals under Different Conditions of Groundwater Buried Depth. Water 2022, 14, 3937. [Google Scholar] [CrossRef]
  41. Luo, F.; Wang, D.; Tian, X.; Bi, X.; Zheng, Q.; Zhou, Z.; Tang, Z. Estuarine groundwater level response to and recovery from extreme precipitation events: Typhoon Lekima in the Yellow River Delta. J. Hydrol. 2024, 632, 130918. [Google Scholar] [CrossRef]
  42. Siddik, M.S.; Tulip, S.S.; Rahman, A.; Islam, M.N.; Haghighi, A.T.; Mustafa, S.M.T. The impact of land use and land cover change on groundwater recharge in northwestern Bangladesh. J. Environ. Manag. 2022, 315, 115130. [Google Scholar] [CrossRef] [PubMed]
  43. Pinsri, P.; Shrestha, S.; Kc, S.; Mohanasundaram, S.; Virdis, S.G.P.; Nguyen, T.P.L.; Chaowiwat, W. Assessing the future climate change, land use change, and abstraction impacts on groundwater resources in the Tak Special Economic Zone, Thailand. Environ. Res. 2022, 211, 113026. [Google Scholar] [CrossRef]
  44. Yifru, B.A.; Chung, I.-M.; Kim, M.-G.; Chang, S.W. Assessing the Effect of Land/Use Land Cover and Climate Change on Water Yield and Groundwater Recharge in East African Rift Valley using Integrated Model. J. Hydrol. Reg. Stud. 2021, 37, 100926. [Google Scholar] [CrossRef]
  45. Chandrasekhar, P.; Kreiselmeier, J.; Schwen, A.; Weninger, T.; Julich, S.; Feger, K.-H.; Schwärzel, K. Why We Should Include Soil Structural Dynamics of Agricultural Soils in Hydrological Models. Water 2018, 10, 1862. [Google Scholar] [CrossRef]
  46. Wang, L.; Jia, B.; Xie, Z. How climate change and groundwater extraction will shape the global terrestrial water cycle pattern. J. Hydrol. 2024, 641, 131780. [Google Scholar] [CrossRef]
  47. Wakode, H.B.; Baier, K.; Jha, R.; Azzam, R. Impact of urbanization on groundwater recharge and urban water balance for the city of Hyderabad, India. Int. Soil Water Conserv. Res. 2018, 6, 51–62. [Google Scholar] [CrossRef]
  48. Niu, X.Y.; Lu, C.P.; Zhang, Y.; Zhang, Y.; Wu, C.C.; Saidy, E.; Liu, B.; Shu, L.C. Hysteresis response of groundwater depth on the influencing factors using an explainable learning model framework with Shapley values. Sci. Total Environ. 2023, 904, 166662. [Google Scholar] [CrossRef]
  49. Li, H.; Hou, E. Groundwater dynamic response mechanism and quantity vulnerability assessment under the influence of human activities. Environ. Sci. Pollut. Res. 2020, 27, 22046–22064. [Google Scholar] [CrossRef]
  50. Ahmed, M.; Aqnouy, M.; El Messari, J.S. Sustainability of Morocco’s groundwater resources in response to natural and anthropogenic forces. J. Hydrol. 2021, 603, 126866. [Google Scholar] [CrossRef]
  51. Lee, J.M.; Kwon, E.H.; Woo, N.C. Natural and Human-Induced Drivers of Groundwater Sustainability: A Case Study of the Mangyeong River Basin in Korea. Sustainability 2019, 11, 1486. [Google Scholar] [CrossRef]
  52. Agarwal, V.; Akyilmaz, O.; Shum, C.K.; Feng, W.; Yang, T.-Y.; Forootan, E.; Syed, T.H.; Haritashya, U.K.; Uz, M. Machine learning based downscaling of GRACE-estimated groundwater in Central Valley, California. Sci. Total Environ. 2023, 865, 161138. [Google Scholar] [CrossRef] [PubMed]
  53. Deines, J.M.; Kendall, A.D.; Butler, J.J.; Basso, B.; Hyndman, D.W. Combining Remote Sensing and Crop Models to Assess the Sustainability of Stakeholder-Driven Groundwater Management in the US High Plains Aquifer. Water Resour. Res. 2021, 57, e2020WR027756. [Google Scholar] [CrossRef]
  54. Rodell, M.; Velicogna, I.; Famiglietti, J.S. Satellite-based estimates of groundwater depletion in India. Nature 2009, 460, 999–1002. [Google Scholar] [CrossRef] [PubMed]
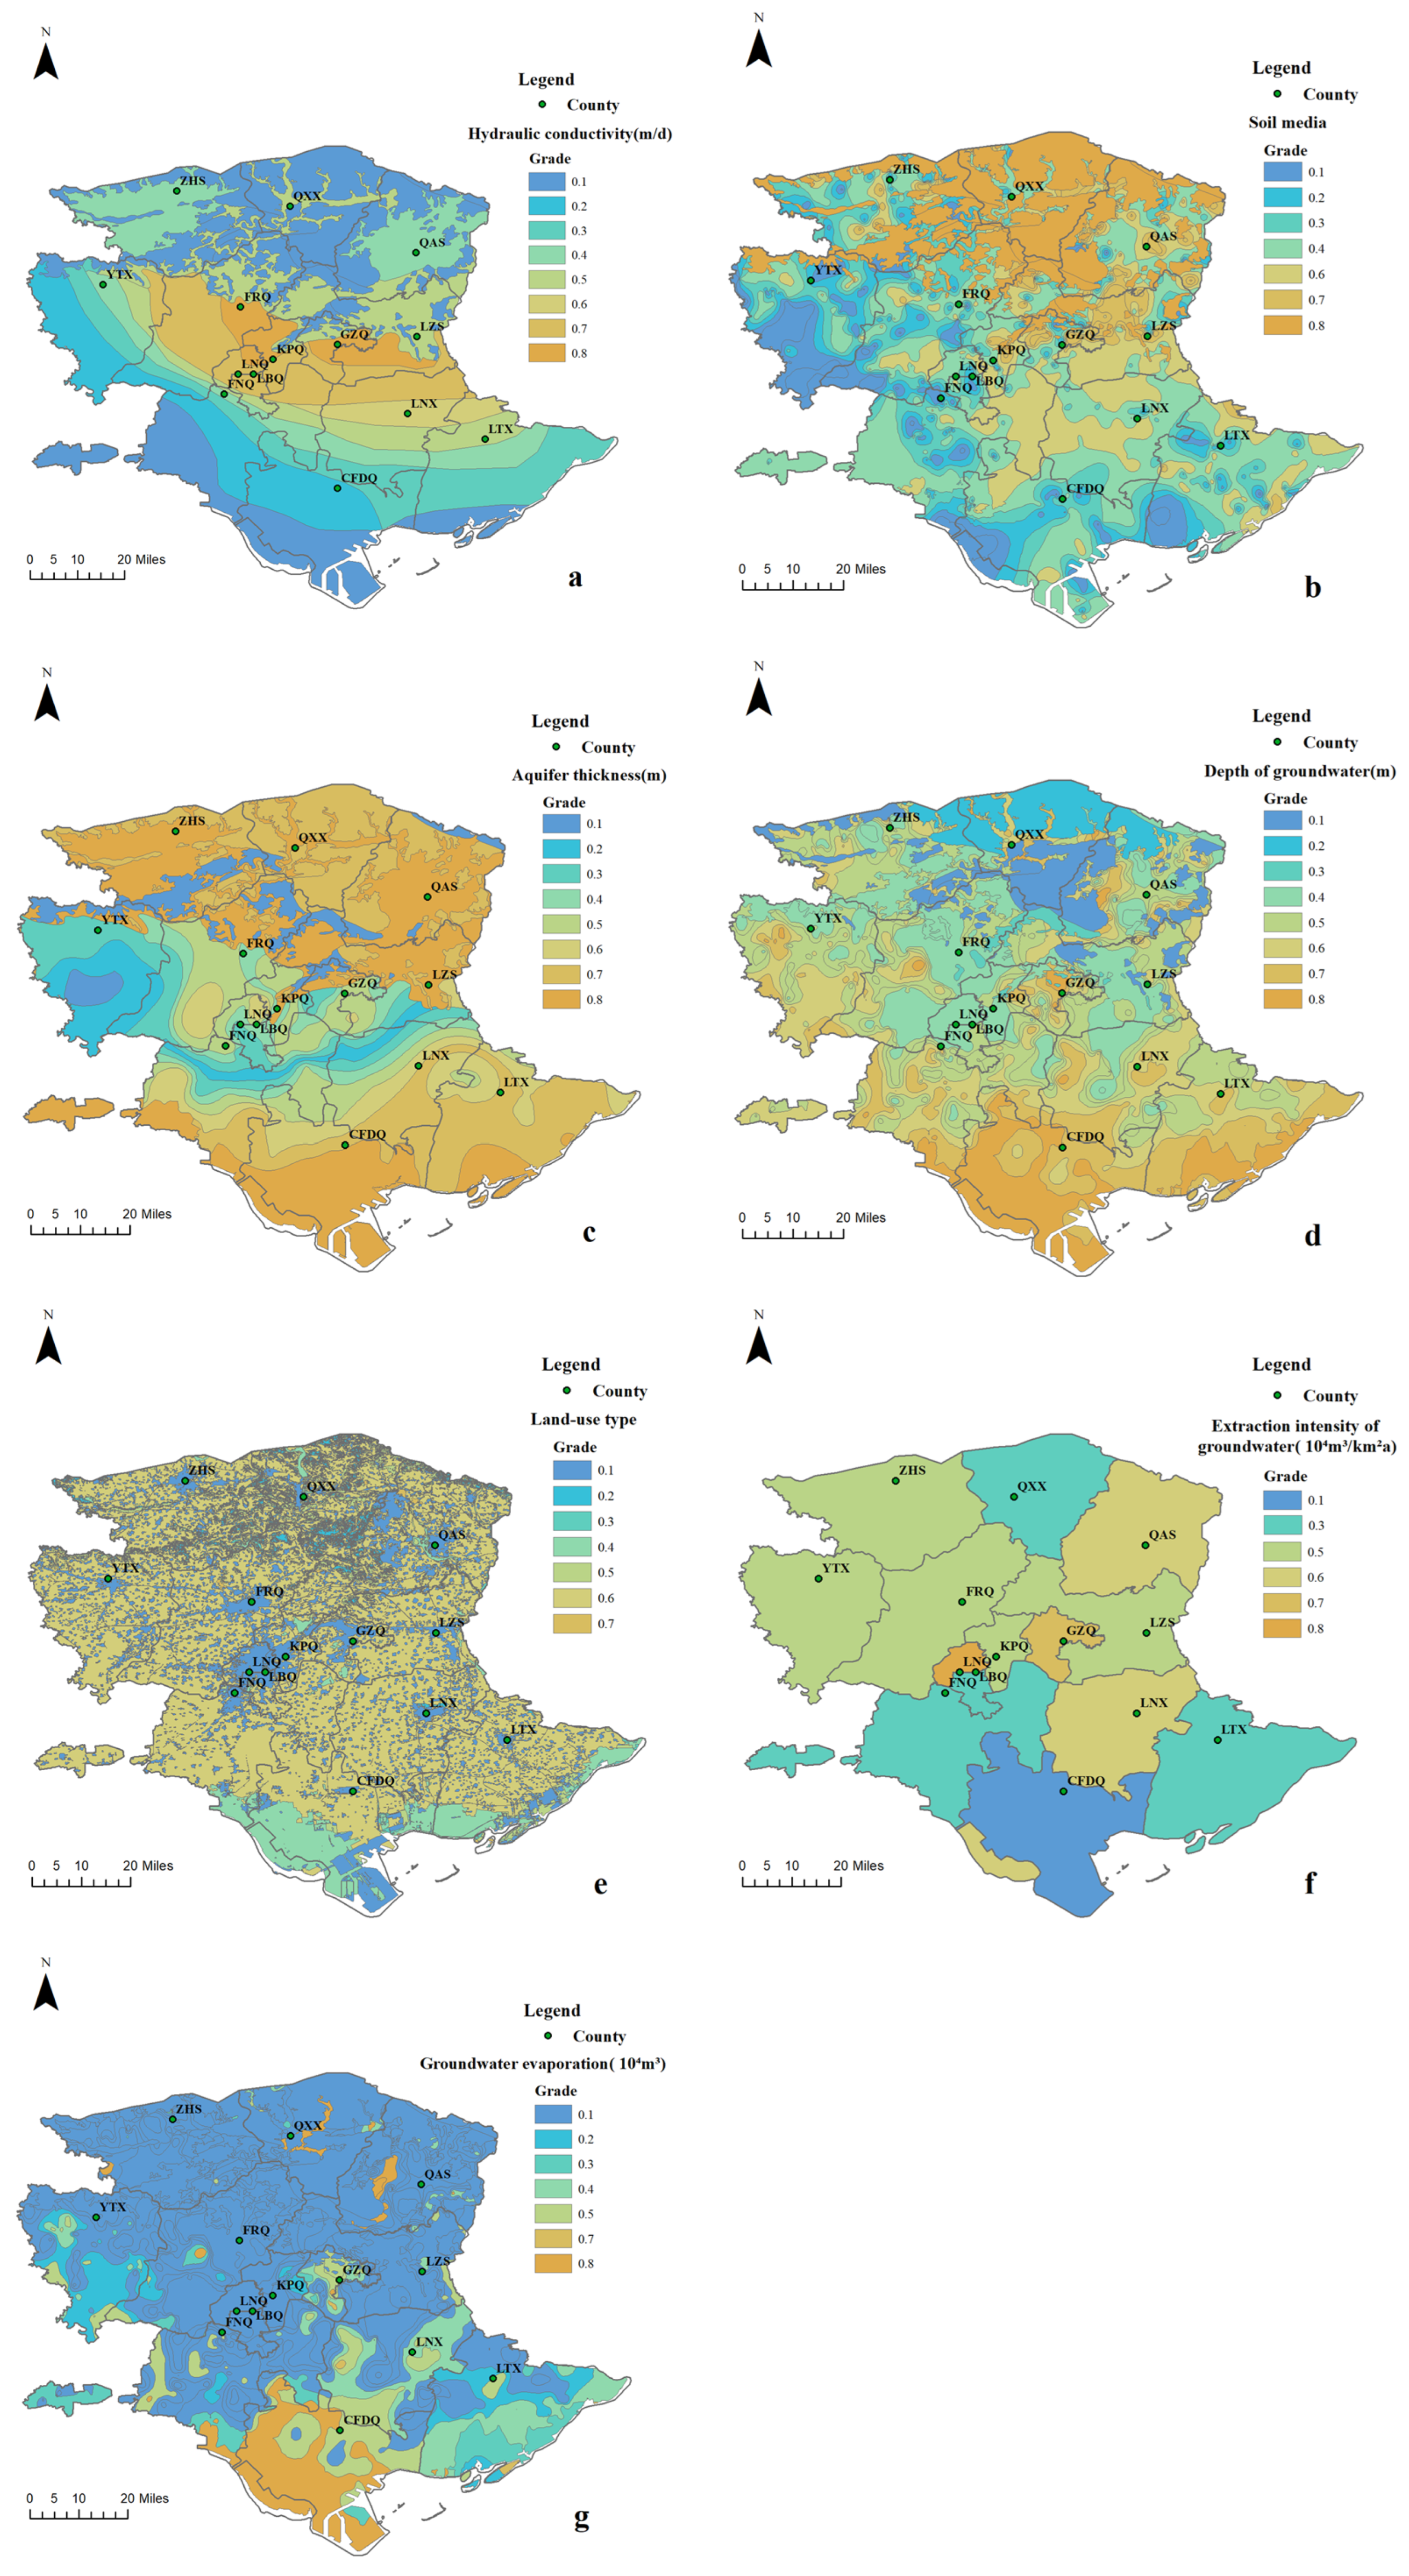
Figure 1. The location of the study area. The figure on the right depicts the hydrogeologic zoning of the study area. Green dots indicate the locations of administrative districts (All the county in the Figure 1 are presented in their abbreviations. For the correspondence between the full names and the abbreviations, please refer to Table A1), red and pink dots denote the observation wells from which water level data were collected, and the blue line delineates the coastline of the study area.
Water 17 01846 g001
Figure 2. Aquifer profile hydrogeological cutaway view of FNQ and FRQ.
Water 17 01846 g002
Figure 3. Correlation analysis diagram. Correlation maps for monitoring wells at LTX and ZHS were generated. Figures (a,b) illustrate the groundwater level autocorrelation functions, whereas Figures (c,d) present the correlation functions between groundwater level and precipitation.
Water 17 01846 g003
Figure 4. Maps of the basic types of groundwater dynamics. Temporal variations in groundwater levels and precipitation were mapped for representative wells during the period from January 2018 to August 2020. (a,b) Precipitation-infiltration type (c,d) Runoff type (e,f) Irrigation-infiltration type (g,h) Artificial exploitation type. In the above picture, blue color represents precipitation, and orange color represents the depth of groundwater.
Water 17 01846 g004
Figure 5. Results from the single-factor evaluation. Figures (ag) present the evaluation results of groundwater dynamics under the isolated influence of each of the seven factors (hydraulic conductivity, soil media, aquifer thickness, depth of groundwater, land use type, groundwater extraction intensity, groundwater evaporation) incorporated into the MFWCES.
Water 17 01846 g005
Figure 6. Graph of the evaluation results based on MFWCES. A comprehensive evaluation of groundwater dynamics, integrating seven indicators, produced scores ranging from 2.4 to 12.7. Higher scores indicate a more pronounced groundwater response to precipitation.
Water 17 01846 g006
Figure 7. Map of major watersheds and hydraulic engineering. Bold blue lines delineate the study area’s coastline, dark blue lines represent the major watersheds, pink lines indicate significant hydraulic projects, and circles denote the standard deviation in groundwater levels.
Water 17 01846 g007
Figure 8. Distribution of groundwater level standard deviations and MFWCES index values. The figure combines the results of the comprehensive evaluation of groundwater dynamics and the standard deviation of groundwater levels.
Water 17 01846 g008
Table 1. Introduction to the MFWCES and the weights assigned to them. Table 1 presents the seven indicators incorporated into the evaluation system. The second column provides a concise description of each indicator, while the third column lists the respective weights assigned in the evaluation framework.
FactorsIntroductionWeight
Hydraulic conductivityMeasures the aquifer’s permeability to determine the flow rate within the aquifer.6
(C)
Soil mediaSoil particle size is related to infiltration rate.5
(S)
Aquifer thicknessAquifer thickness is obtained by combining borehole data with groundwater depth.4
(A)
Groundwater depthGroundwater depth is the distance from the surface to the phreatic water table, which influences the migration time of precipitation.6
(D)
Land use typeLand use type represent the natural and artificial distribution of features on the Earth’s surface. It affects the spatial and temporal dynamics of groundwater systems.2
(LUT)
Extraction intensity of groundwater Groundwater extraction intensity is used to measure the rationality of groundwater development and utilization, as it can weaken the recharge effect of precipitation on groundwater.5
(EI)
Groundwater evaporationAn increase in phreatic evaporation depletes groundwater, leading to a decline in groundwater levels. There exists a critical depth beyond which evaporation effectively ceases and can be considered negligible.3
(E)
Table 2. Factors in the MFWCES and their assessment levels. Each indicator in the evaluation system is assigned a distinct evaluation level, with a corresponding score ranging from 0.1 to 0.8 that reflects the magnitude of its impact on groundwater dynamics.
FactorsAssessment Levels
0.10.20.30.40.50.60.70.8
C (m/d)[0, 12](12, 20](20, 30](30, 35](35, 40](40, 60](60, 80]>80
Sclay loamsilt loamloamsandy loamswelling or condensing claysilt-sand/fine sandgravel-cobble/medium sand/coarse sandthin layer or missing
A (m)>40(35, 40](30, 35](25, 30](20, 25](15, 20](10, 15]≤10
D (m)>25(20, 25](15, 20](10, 15](6, 10](4, 6](2, 4]≤2
LUTartificial surfacesforestwetlandwater bodiesgrasslandcultivated landbare land
EI(104 m3/km2 a)≤2(2, 4](4, 6](6, 8](8, 10](10, 12](12, 15]>15
E(104 m3)≤1000(1000, 8000](8000, 12,000](12,000, 20,000](20,000, 90,000](90,000, 110,000](110,000, 160,000]>160,000
Table 3. Sources of primary data and their time span.
DataSource of DataTime Span
groundwater levelGroundwater data were obtained from actual monitoring wells, the locations of which have been projected in Figure 1.January 2018 to August 2020
precipitationPrecipitation data were obtained from three precipitation gauge stations located in Zunhua, Tangshan, and Leting.January 2018 to August 2020
Disclaimer/Publisher’s Note: The statements, opinions and data contained in all publications are solely those of the individual author(s) and contributor(s) and not of MDPI and/or the editor(s). MDPI and/or the editor(s) disclaim responsibility for any injury to people or property resulting from any ideas, methods, instructions or products referred to in the content.

