Article

Evaluating the Influence of Water Quality on Clogging Behavior in Drip Irrigation Emitters: A CT Imaging Study

1
College of Water Resources and Civil Engineering, China Agricultural University, Beijing 100083, China
2
School of Water Conservancy and Transportation, Zhengzhou University, Zhengzhou 450000, China
*
Author to whom correspondence should be addressed.
Water 2025, 17(7), 1065; https://doi.org/10.3390/w17071065
Submission received: 6 March 2025 / Revised: 28 March 2025 / Accepted: 1 April 2025 / Published: 3 April 2025
(This article belongs to the Special Issue China Water Forum 2024)

Abstract

:
Applying poor-quality water in drip irrigation has become increasingly common to address agricultural water scarcity. However, emitter clogging remains a critical challenge that limits the widespread adoption of this technology. Currently, the mechanism of emitter clogging under poor-quality water conditions remains insufficiently explored. This study investigates the distribution and accumulation of clogging substances within drip irrigation emitters under three water conditions: saline water, Yellow River water, and a 1:1 mixture of both, at clogging degrees of 5%, 20%, and 50% (i.e., the flow rate reaches 95%, 80%, 50% of the rated flow). The results showed that when clogging reached 20%, Yellow River water led to the highest clogging volume (i.e., the total volume of clogging substance in the flow channel, 1.77 mm3), while at 50%, saline water resulted in the highest clogging volume (5.11 mm3), while the use of blended water improved the clogging situation. Under different water conditions, clogging substances mainly formed on the upstream and downstream faces of the flow channel, accounting for 23.9–31.8% and 9.3–32.4% of the total volume, respectively. With higher clogging levels, the proportion of clogging substances on the downstream face increased significantly, while other areas showed minimal change. The volume of clogging substances was more pronounced at the front of the flow channel than at the back across the entire length, except at the 20% clogging degree for Yellow River water. At 5% clogging, the largest difference in clogging volume was observed with Yellow River water, while at 50%, the largest difference occurred with blended water. This research provides critical insights into the impact of poor-quality water on emitter clogging and suggests that the use of blending water, gradually varying channel structure, and increasing the arc of clogging faces can effectively alleviate clogging and enhance drip irrigation efficiency.

1. Introduction

Global freshwater resources are depleting due to poor water management and pollution, and water quality is declining, failing to meet the rising demand for agricultural use [1]. Consequently, the utilization of unconventional water sources, including saline water, reclaimed water, and high-sediment water, is becoming increasingly prevalent to fulfill agricultural water demand [2,3,4]. The sixth longest river in the world is the Yellow River. The region is characterized by a scarcity of freshwater resources, with high-sediment and saline waters also being widely distributed. Efficient use of these unconventional sources is key to addressing regional water shortages [5,6]. Drip irrigation is among the most effective methods for utilizing unconventional water sources in agriculture [7].
As a core component of drip irrigation system, emitters feature narrow flow channels (0.5–1.2 mm) and complex structures make them vulnerable to clogging from impurities like particles, microorganisms, and ions in poor-quality water [8,9,10,11]. Developed countries often have better water quality, resulting in relatively less research on irrigation using high-sand water. In China, the Yellow River is characterized by high sediment concentration, fine particle size and slow sedimentation rate, making the implementation of sedimentation and filtration techniques challenging and expensive [12,13]. Even with filtration and sedimentation measures, fine particles from high-sand water like the Yellow River water can still enter the flow channels, so they can be discharged directly through the emitter flow channels [14,15]. Furthermore, the Yellow River Basin contains over 13 billion m3 of saline water suitable for agricultural irrigation [16,17]. However, using saline water in agricultural irrigation may cause soil secondary salinization and contamination of groundwater [18]. Long-term use may increase maintenance costs, lead to soil hardening, etc. [19,20].
Numerous academics have conducted extensive research on water source filtration, clogging substances composition analysis, the control of electromagnetic fields, and the use of nanobubbles, etc., but the clogging still exists. The core to resolving this issue lies in optimizing flow channel design [15,21,22,23,24,25,26]. Comprehending the location of clogging in the emitter is essential for such optimization. With the rapid development of modern precision measurement techniques, many scholars have visualized the flow channels of irrigation using advanced measurement methods such as the vertical scanning white-light interference profilometer, Fourier-transform infrared spectroscopy, and field emission scanning electron microscopes (FESEM) to visualize the flow channels of emitters [27,28,29]. Nevertheless, these techniques only capture local details and often require destructive sampling, which could affect the distribution and structure of clogging substances [26,30]. Industrial Computed Tomography (ICT), with its high-resolution and non-destructive imaging characteristics, has been successfully applied to the imaging of clogging substances in the flow channels of different types of emitters and emitters at different lateral positions in drip irrigation system [31,32,33,34], which has the ability to solve the in situ characterization of the flow channels of emitters. However, ICT technology still faces challenges of high costs and cumbersome sample staining processes at present.
However, due to the fact that the spatial distribution of clogging substances in the emitter under different water source conditions is still unknown. Therefore, industrial computed tomography (ICT) was employed in this study to scan emitters with three types of water sources and three degrees of clogging, and to acquire the locational distribution of clogging substances. The study clarified the distribution of clogging substances on several faces and across the flow channels’ whole length under different water source conditions. This study offers theoretical guidance for managing clogging in drip irrigation systems that cause clogging d and for applying saline water, Yellow River water, and blending water in agricultural drip irrigation.

2. Materials and Methods

2.1. Water Quality Testing and Experimental Setup

2.1.1. Water Source Conditions

The compound clogging experiment of drip irrigation system emitters was carried out at the Ulanbuhe Irrigation Experiment Station, Dengkou, Bayannur, Inner Mongolia, China. This study considered mixing saline water and Yellow River water in a 1:1 ratio as irrigation water source (named Blending Water) can reduce sediment concentration and salt concentration, improve soil permeability, enhance soil moisture retention, and improve the ability of crop roots to absorb moisture [17,35]. The water sources were the Yellow River water from the Wushen Canal in Inner Mongolia’s Hetao Irrigation District (named YR), local saline water at the experimental station (named SW), and the blending water (named BW). Measured water quality parameters are detailed below in Table 1.

2.1.2. Experimental Setup

A sand filter and disk filter combination were installed at the system’s head. The system operated at 0.1 MPa pressure. The laterals were laid over 15 m, with a lateral flushing device installed at the system’s endpoint. The system operated for 9 h daily, flushed every 60 h at 0.45 m/s velocity. The experiment ran for a total of 840 h (Figure 1a).
The emitters used in the drip irrigation clogging experiments adopted non-pressure compensating labyrinth flow channel emitters, with a drip irrigation tape diameter of 16 mm. The distance between emitters on the lateral tubes was set at 30 cm. The internal dimensions of the emitters’ flow channels were 22.4 mm × 0.7 mm × 0.61 mm (length × width × depth), with a 1.6 L/h flow rate. When the “entire lateral” drip irrigation emitter’s flow rate decreased to 95%, 80%, and 50% of the rated flow rate, the lateral section containing the emitter under test was cut from the middle of the lateral tube. Additionally, the flow channels were segmented into some structural units (Figure 1a) to better analyze the distribution of clogging substances in the emitter flow channels, with each unit categorized into five surfaces: the top (TF), substrate (SF), upstream (UF), downstream (DF), and root face (RF) (Figure 1b). Meanwhile, along the internal water flow path of the emitters, the 1–4 structural units of the flow channels were defined as the front (F), and the 5–8 structural units were defined as the back (B). The areas of different faces are listed in Table 2.

2.2. Industrial Computed Tomography (ICT) Technology

Industrial computed tomography (ICT) was used in this study to analyze clogging distribution in emitter flow channels. ICT involves irradiating an object with energy waves (X-rays, gamma rays, etc.) to produce a series of cross-sectional images. By measuring the energy values after passing through the object and utilizing post-processing computer software (VGStudio MAX 2.2) to generate an undistorted 3D model of the object [36]. Since the materials of the emitters and the clogging substances exhibit similar X-ray absorption properties, requiring staining of the clogging substances is required before scanning to distinguish clearly between the two to achieve high-quality imaging. As described by Davit [37], a contrast agent was introduced into the emitters’ samples by injecting a staining solution (contrast agent mixed with BaSO4 suspension (0.33 g/mL) and KI solution (0.1 g/mL)). After staining, the clean water flushed the emitters’ samples. Subsequently, the flushed emitters’ samples were air-dried and stored in isolation (Figure 1c).
Afterwards, the emitter samples were positioned at the center of the ICT scanner (Xview X5000|X-ray; Producer, NSI; South Diamond Lake, MN, USA), with the following specific parameters as follows: tube voltage: 25 kV to 225 kV; tube current: 0 mA to 3 mA; tube voltage regulation division 0.1 kV; tube current regulation division 0.1 mA; microfocus ≥ (6 × 6) μm; collimator manually or electrically adjustable to meet the needs of CT scanning and VCT scanning for radiation beams; slice thickness collimator (0–5 mm) manually or electrically adjustable; minimum FOD 6.5 mm; minimum detection capability < 3 um. The obtained ICT images were input into the computer, and the ICT images of the samples were reconstructed using VGStudio MAX 2.2, generating a 3D model of the emitters. By adjusting the grayscale threshold of the emitters’ sample models, segmented the emitters, clogging substances and air, and the volume of the clogging substances in the 3D emitter models was quantified.

2.3. Evaluation Indicators for the Spatial Distributions of Clogging Substances

Using VGStudio Max 2.2, clogging volume in emitter flow channels under varying water sources can be measured. Other evaluation parameters include (1) the mean thickness of clogging substances on the face, denoted as T ; (2) volume fraction of clogging substances, denoted as Φ V ; (3) clogging substance ratio on various faces, denoted as W . Within a structural unit of the flow channel, there are 5 faces (Figure 1c), including a top face, a substrate face, two upstream faces, two downstream faces, and two root faces.

2.3.1. Mean Thickness of Clogging Substances T

Taking the upstream face of i -th structural unit as an example, the T of clogging substances on the top face is determined by Equation (1):
T u i = V u i S u i
where T u i is the mean thickness of clogging substances on the upstream face of i -th structural unit in the emitter sample, measured along the water flow direction;
T u i represents the average clogging thickness on the upstream face of the i -th structural unit, measured along the flow direction;
V u i denotes the clogging substances volume on the upstream face of the i -th structural unit;
S u i denotes the upstream face area of the i -th unit.
The thickness of a specific face (e.g., upstream face) across the entire flow channel (including all structural units) is evaluated by the weighted average of the thicknesses of each face, as shown in Equation (2):
T u = T u 1 × S u 1 + T u 2 × S u 2 + T u l × S u l S u 1 + S u 2 + S u l
where T u is the weighted mean thickness of clogging substances on the upstream face of each structural unit;
T u 1 , T u 2 , T u l and S u 1 , S u 2 , S u l represent the mean thicknesses and the surface areas of clogging substances on the upstream face within the first, second and final units, respectively.

2.3.2. Volume Fraction of Clogging Substances Φ V

The volume fraction Φ V i of the i -th unit is determined by the following Equation (3):
Φ V i = V i V i × 100 %
where Φ V i represents the clogging volume fraction in the i -th unit;
V i and V i are the clogging substance volume and the structural unit volume, respectively, along the flow direction in the i -th unit.
The volume fraction over multiple units is a weighted average, as shown in Equation (4):
Φ V = Φ V 1 V 1 + Φ V 2 V 2 + Φ V l V l V 1 + V 2 + V 3 + V l
where Φ V represents the clogging volume fraction across multiple units; Φ V 1 , Φ V 2 , Φ V l and V 1   V 2   V l represent the clogging volume fractions and the volumes in the first, second, and final units, respectively.

2.3.3. Ratio of Clogging Substances W

The clogging ratio on different faces is given as the percentage of the clogging volume on a specific face relative to the total clogging volume within the entire flow channel. This ratio quantifies the distribution of clogging across different faces of the flow channel.
It is calculated as the ratio of a given face’s clogging volume relative to the total clogging volume across all faces in the flow channel, as shown in Equations (5) and (6):
W V u = V u V × 100 %
V = V t + V s + V u + V d + V r
where W V u represents the clogging ratio on the upstream face, with similar methods applied to other faces; V denotes the clogging volume in the entire area; V t ,   V s , V u , V d , and V r denote the total clogging volumes on the top, substrate, upstream, downstream, and root face of flow channel.

3. Results and Analysis

3.1. Apparent Morphology of Clogging Substances in Emitter Flow Channels

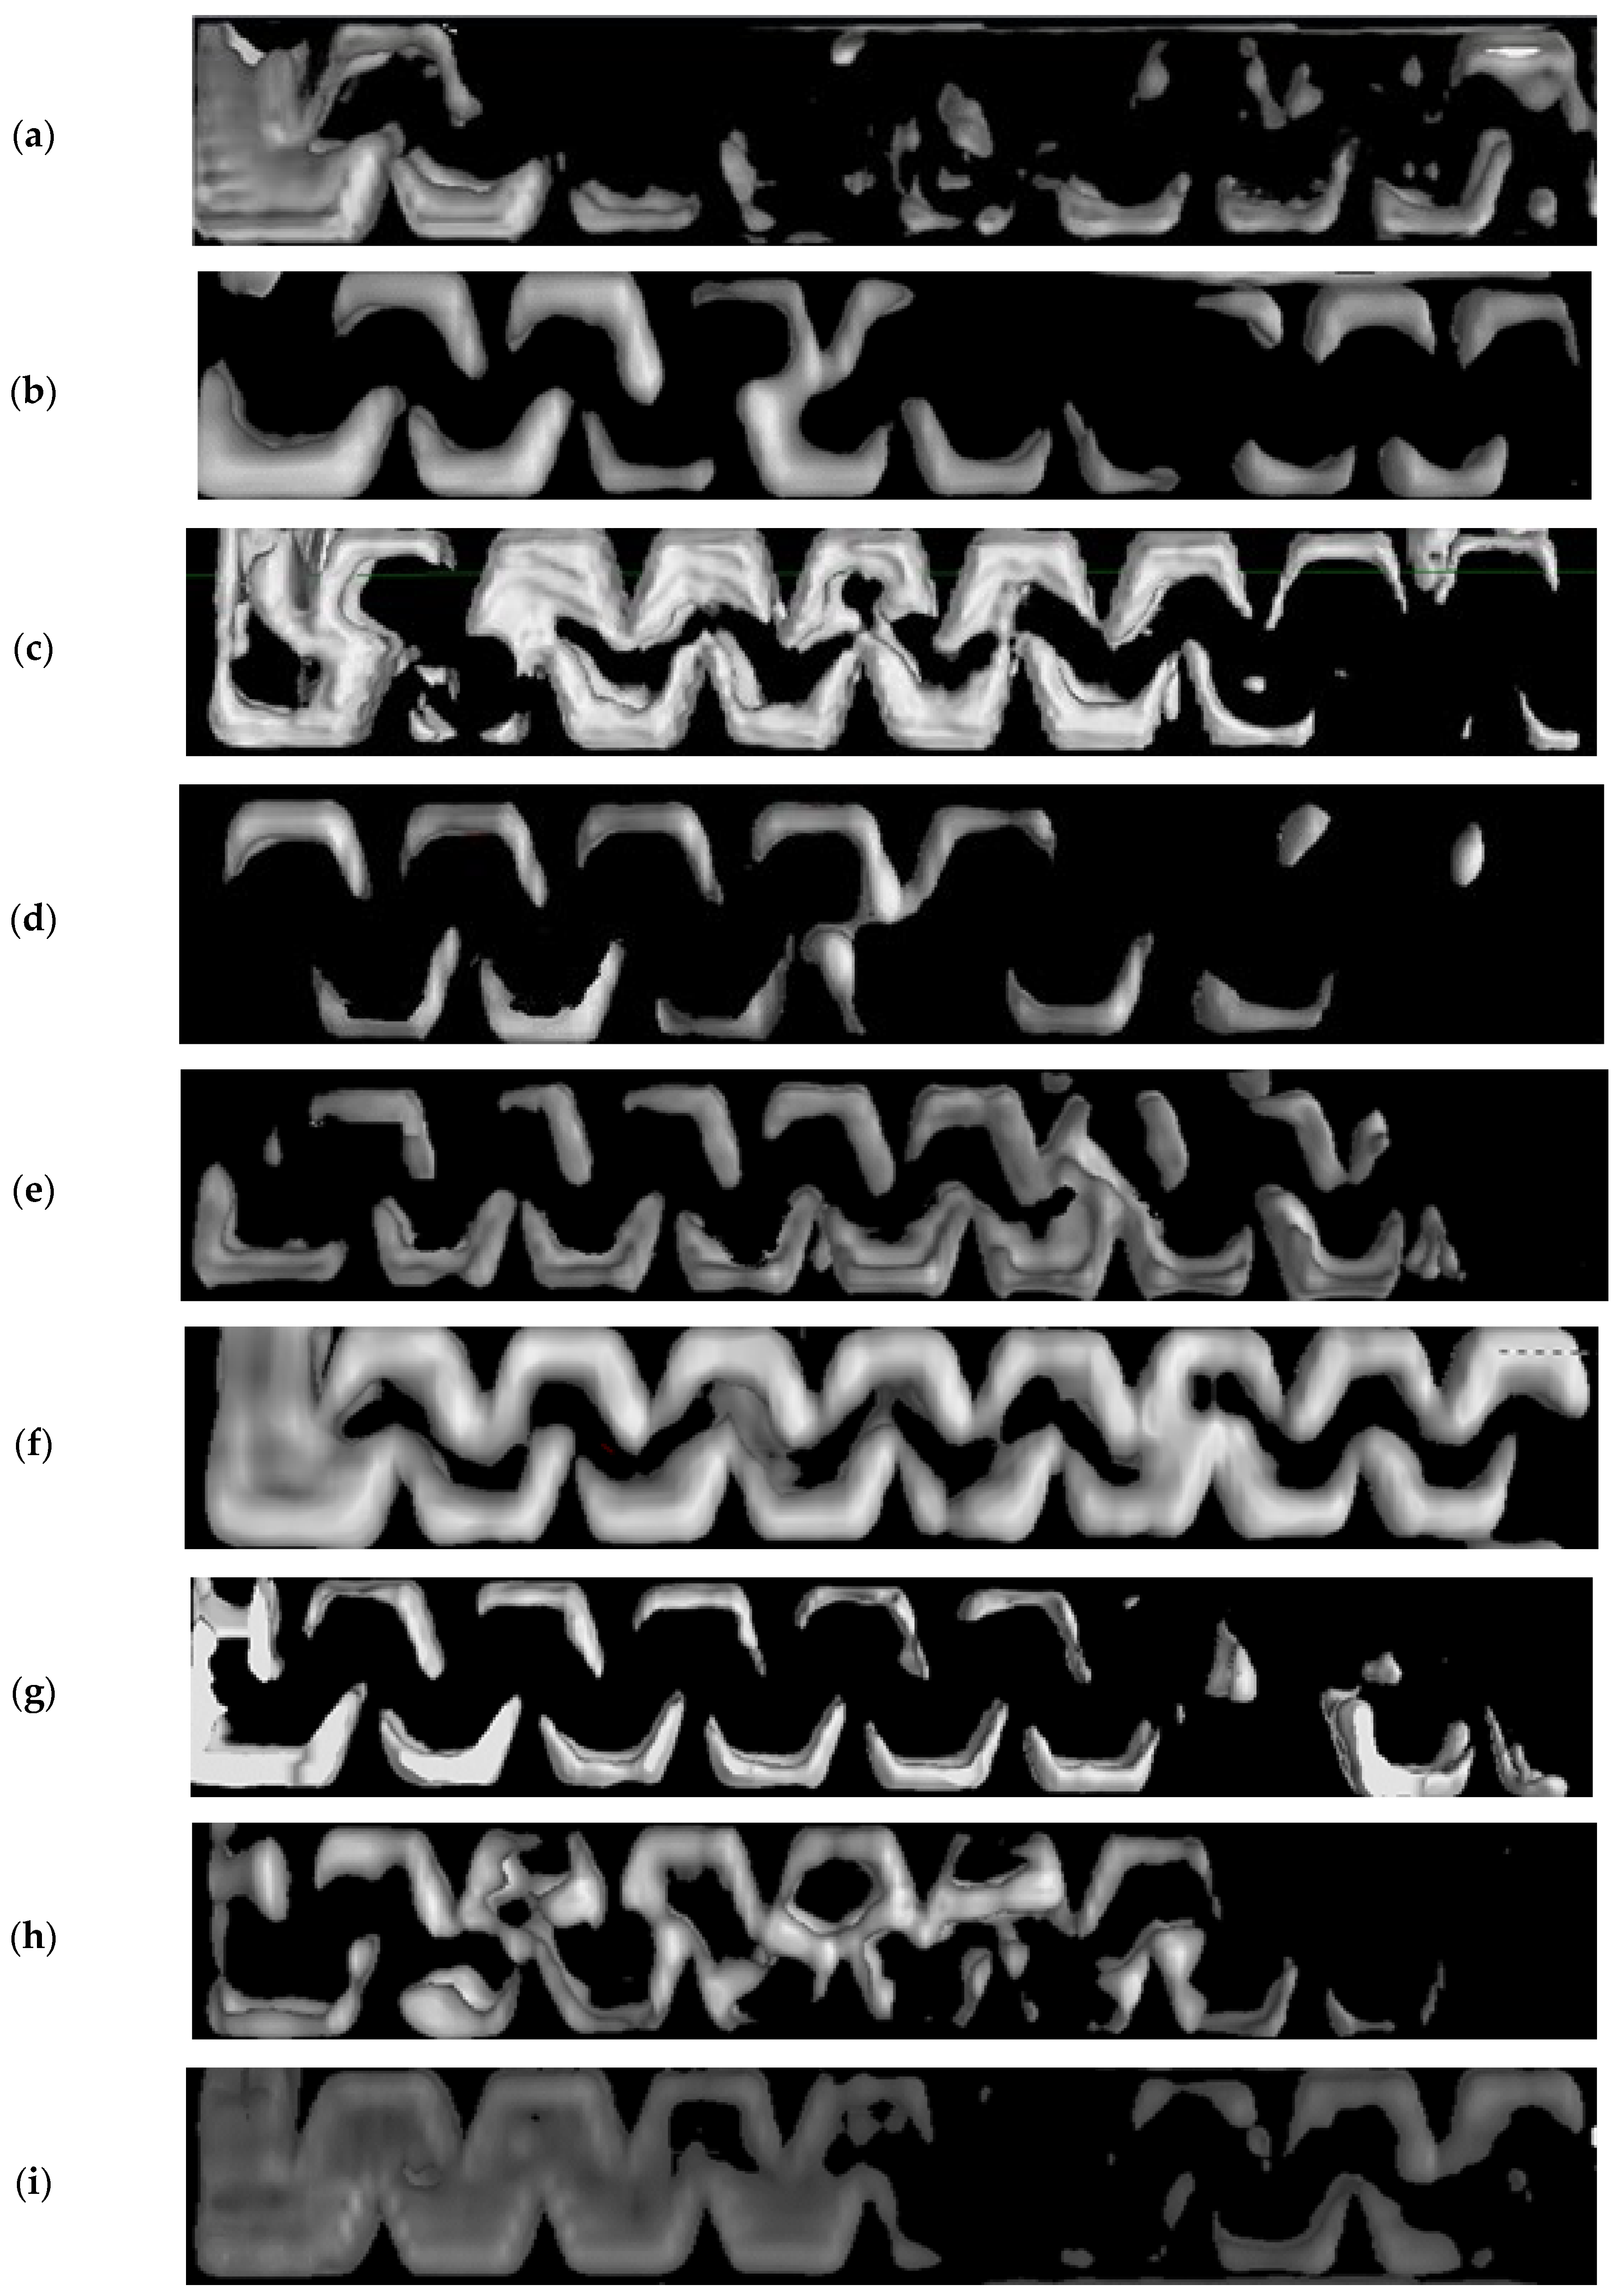
The spatial distribution of clogging in SW, YR, and BW shows a clear increase with clogging severity increases. At 5% clogging severity, the clogging substances of the emitter within the SW-based drip irrigation system were distributed unevenly along the flow channel, primarily accumulating at the front, while YR and BW were distributed uniformly. In addition, at 50% clogging severity, the clogging substances with SW and YR had a main flow area throughout the flow channel length (Figure 2). For different faces, at clogging severities of 5% and 20%, clogging substances mainly gathered on the upstream and root faces of the flow channel. While the degree of clogging reached 50%, clogging substances mainly accumulated on the downstream and root faces. As the clogging degree increased from 20% to 50%, there was a more rapid increase in clogging substances on the downstream face.

3.2. Distribution of Clogging Substances Under Different Water Sources

3.2.1. Distribution of Clogging Substances Within Structural Units of Emitter Flow Channels

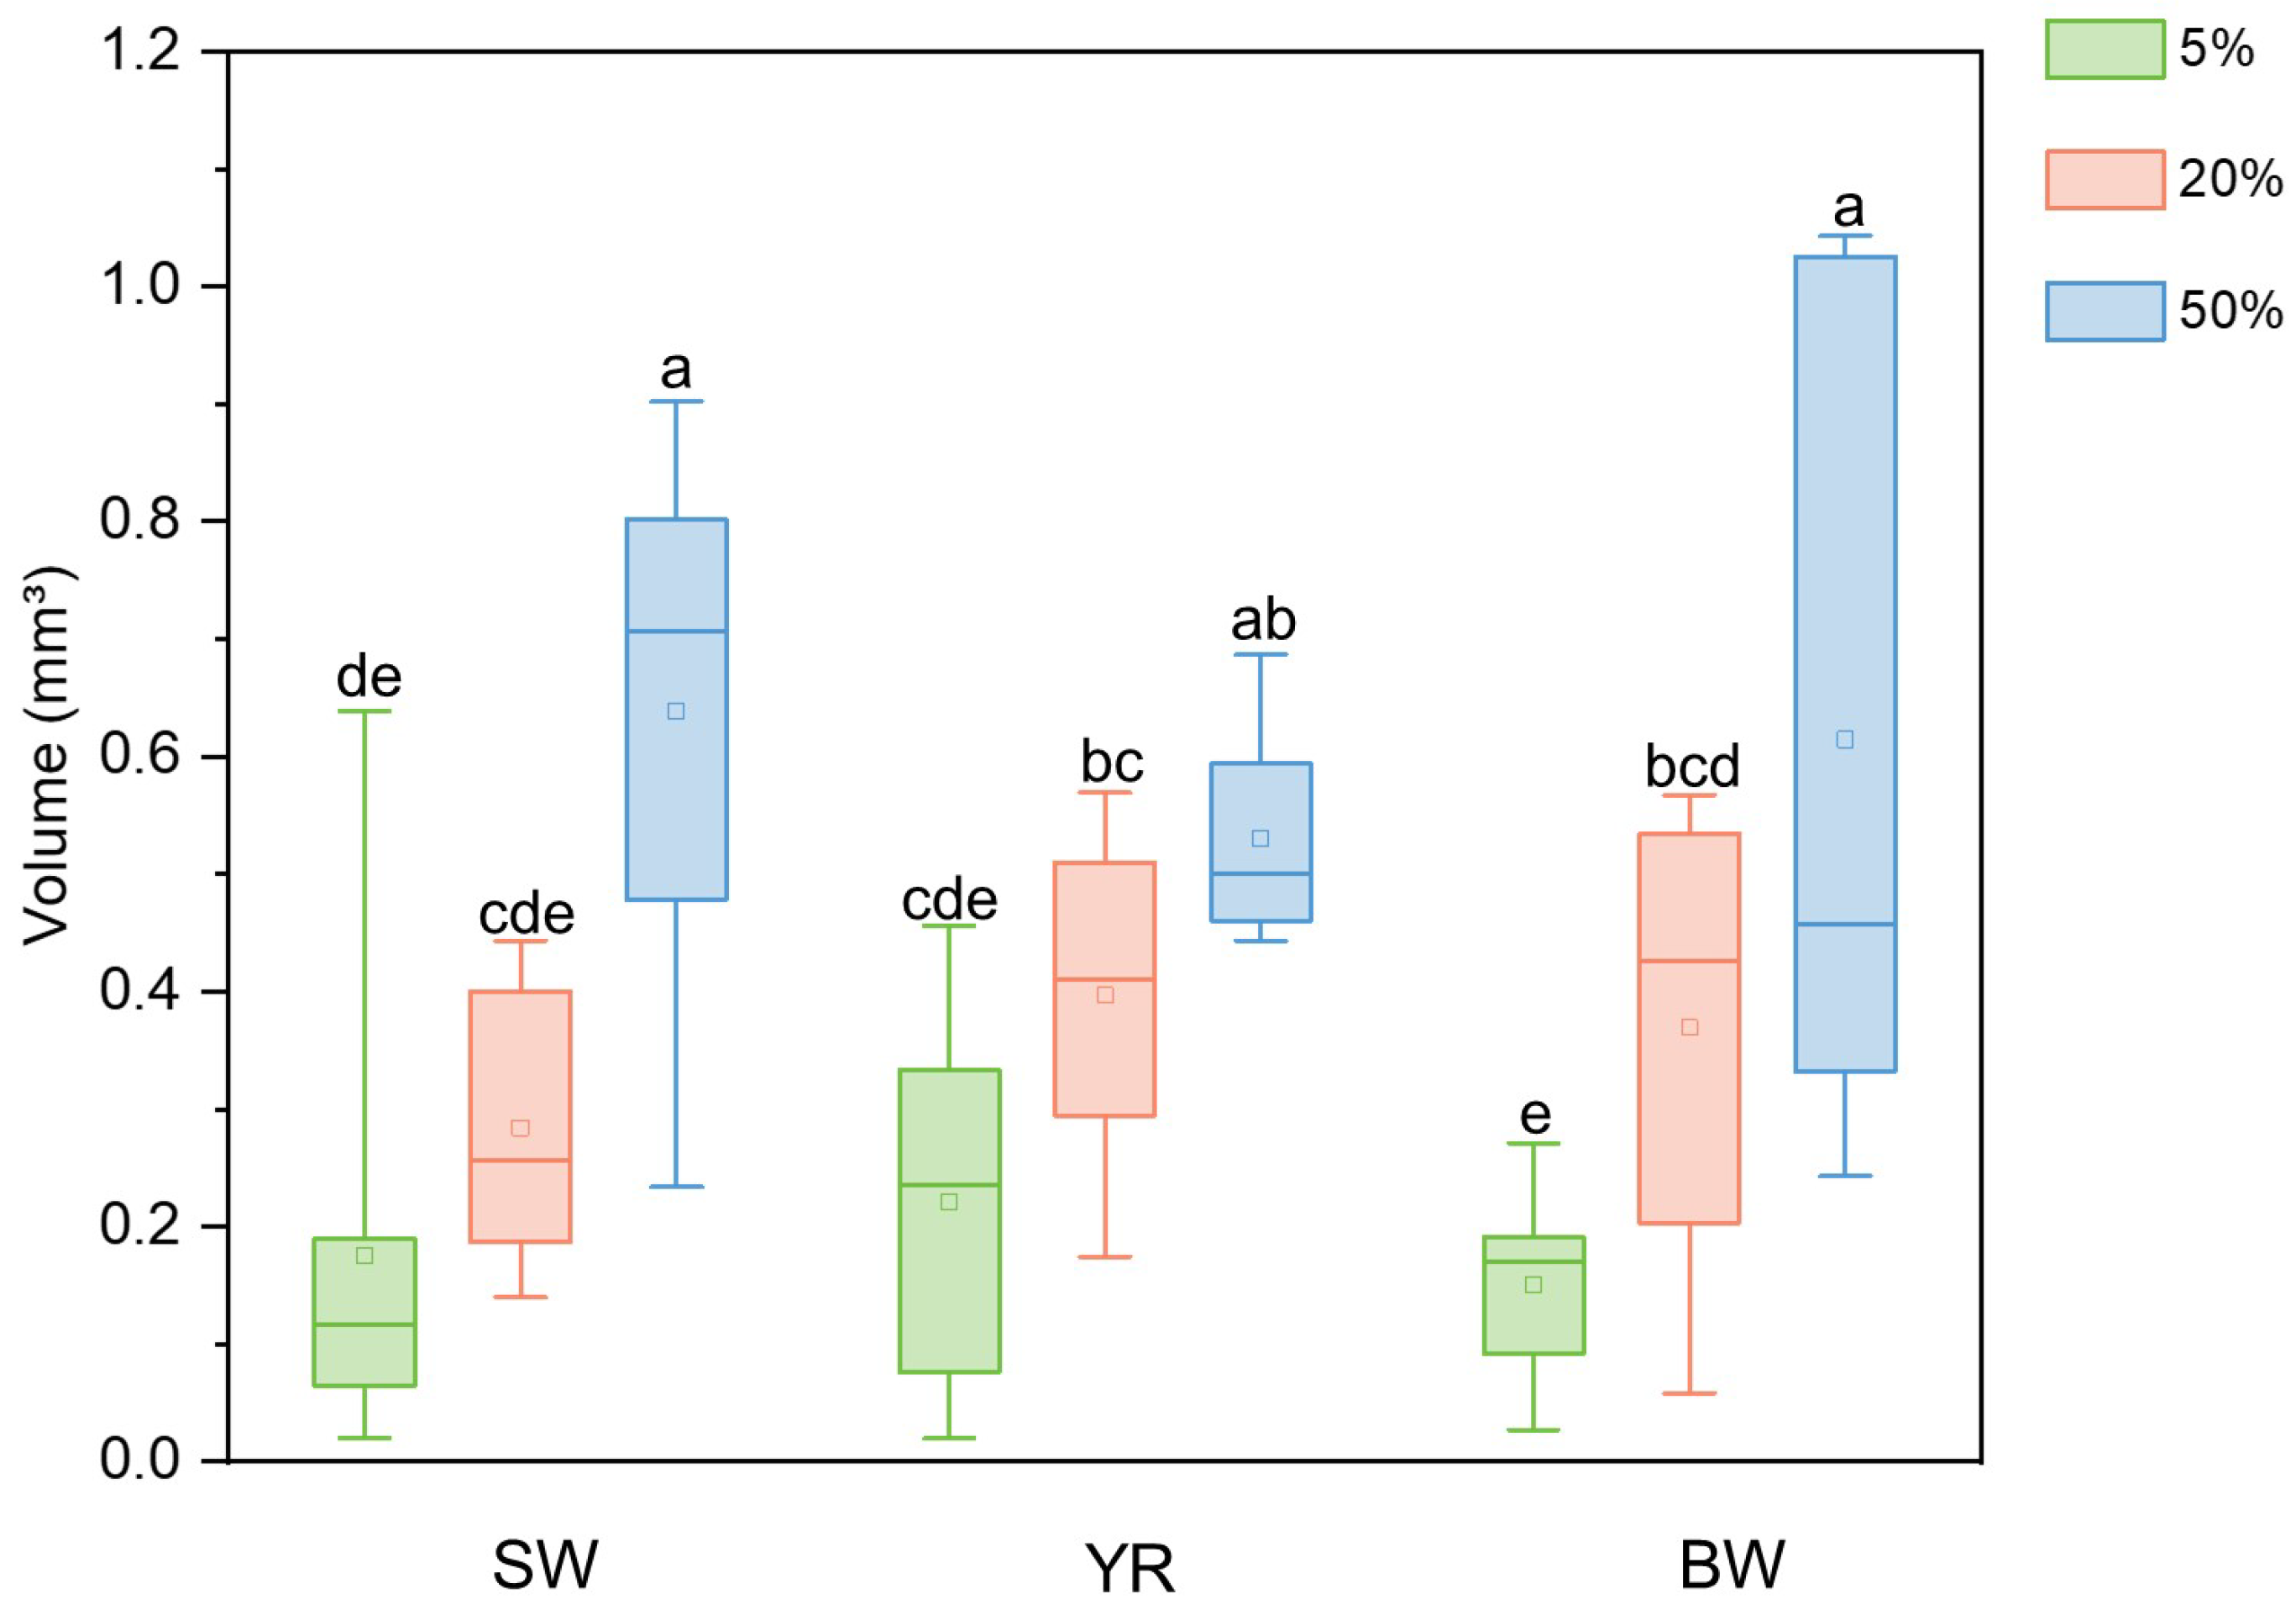
Overall, there was an increase in both the volume and mean thickness of clogging substances with increasing clogging severity under different water sources. As clogging severity increased, the total clogging volumes within the emitter flow channels for SW, YR and BW were 1.40 mm3, 2.27 mm3, and 5.11 mm3 (for SW); 1.77 mm3, 3.17 mm3, and 4.24 mm3 (for YR); 1.21 mm3, 2.95 mm3, and 4.91 mm3 (for BW), respectively. The clogging volume fractions in the flow channels were 12.89%, 20.91%, and 47.05% (for SW); 16.28%, 29.23%, and 39.05% (for YR); and 11.11%, 27.19%, and 45.26% (for BW), respectively.
The degree of clogging ranged from 5% to 20%, and the total clogging volumes in emitter flow channels under SW, YR, BW increased by 62.14%, 79.54%, and 144.77%, respectively. For the degree of clogging ranging from 20% to 50%, the total clogging volumes under SW, YR and BW increased by 125.02%, 33.60%, and 66.48%, respectively. It was observed that with increasing clogging severity, the volume increment of clogging substances within emitters of drip irrigation systems using SW was larger, while the volume increments for YR and BW were smaller. At clogging severities of 5%, 20%, and 50%, the volume of clogging substances within each structural unit of emitter flow channels under SW, YR, and BW ranged from 0.02 to 0.90 mm3, 0.02 to 0.69 mm3, and 0.03 to 1.04 mm3, respectively. The mean thickness varied between 2.68 μm and 120.76 μm, 2.65 μm and 91.91 μm, 3.62 μm and 139.63 μm, respectively. No significant differences were found in clogging volume among the three water sources, but the volume of clogging substances at 50% clogging degree was significantly higher than those at 5% and 20% (p < 0.05, Figure 3).

3.2.2. Distribution of Clogging Substances of Emitter Flow Channels on Different Faces

In general, SW, YR, and BW showed consistent patterns for different surfaces of the internal emitter flow channels. With the increase in clogging degree, there was a certain increase in clogging substances on each face, especially the clogging mean thickness on the downstream face. The maximum clogging volumes accumulated on the upstream face and downstream face, while the maximum mean thickness mostly appeared on the root face. The minimum volume and mean thickness of clogging substances were mainly found on the top and substrate face.
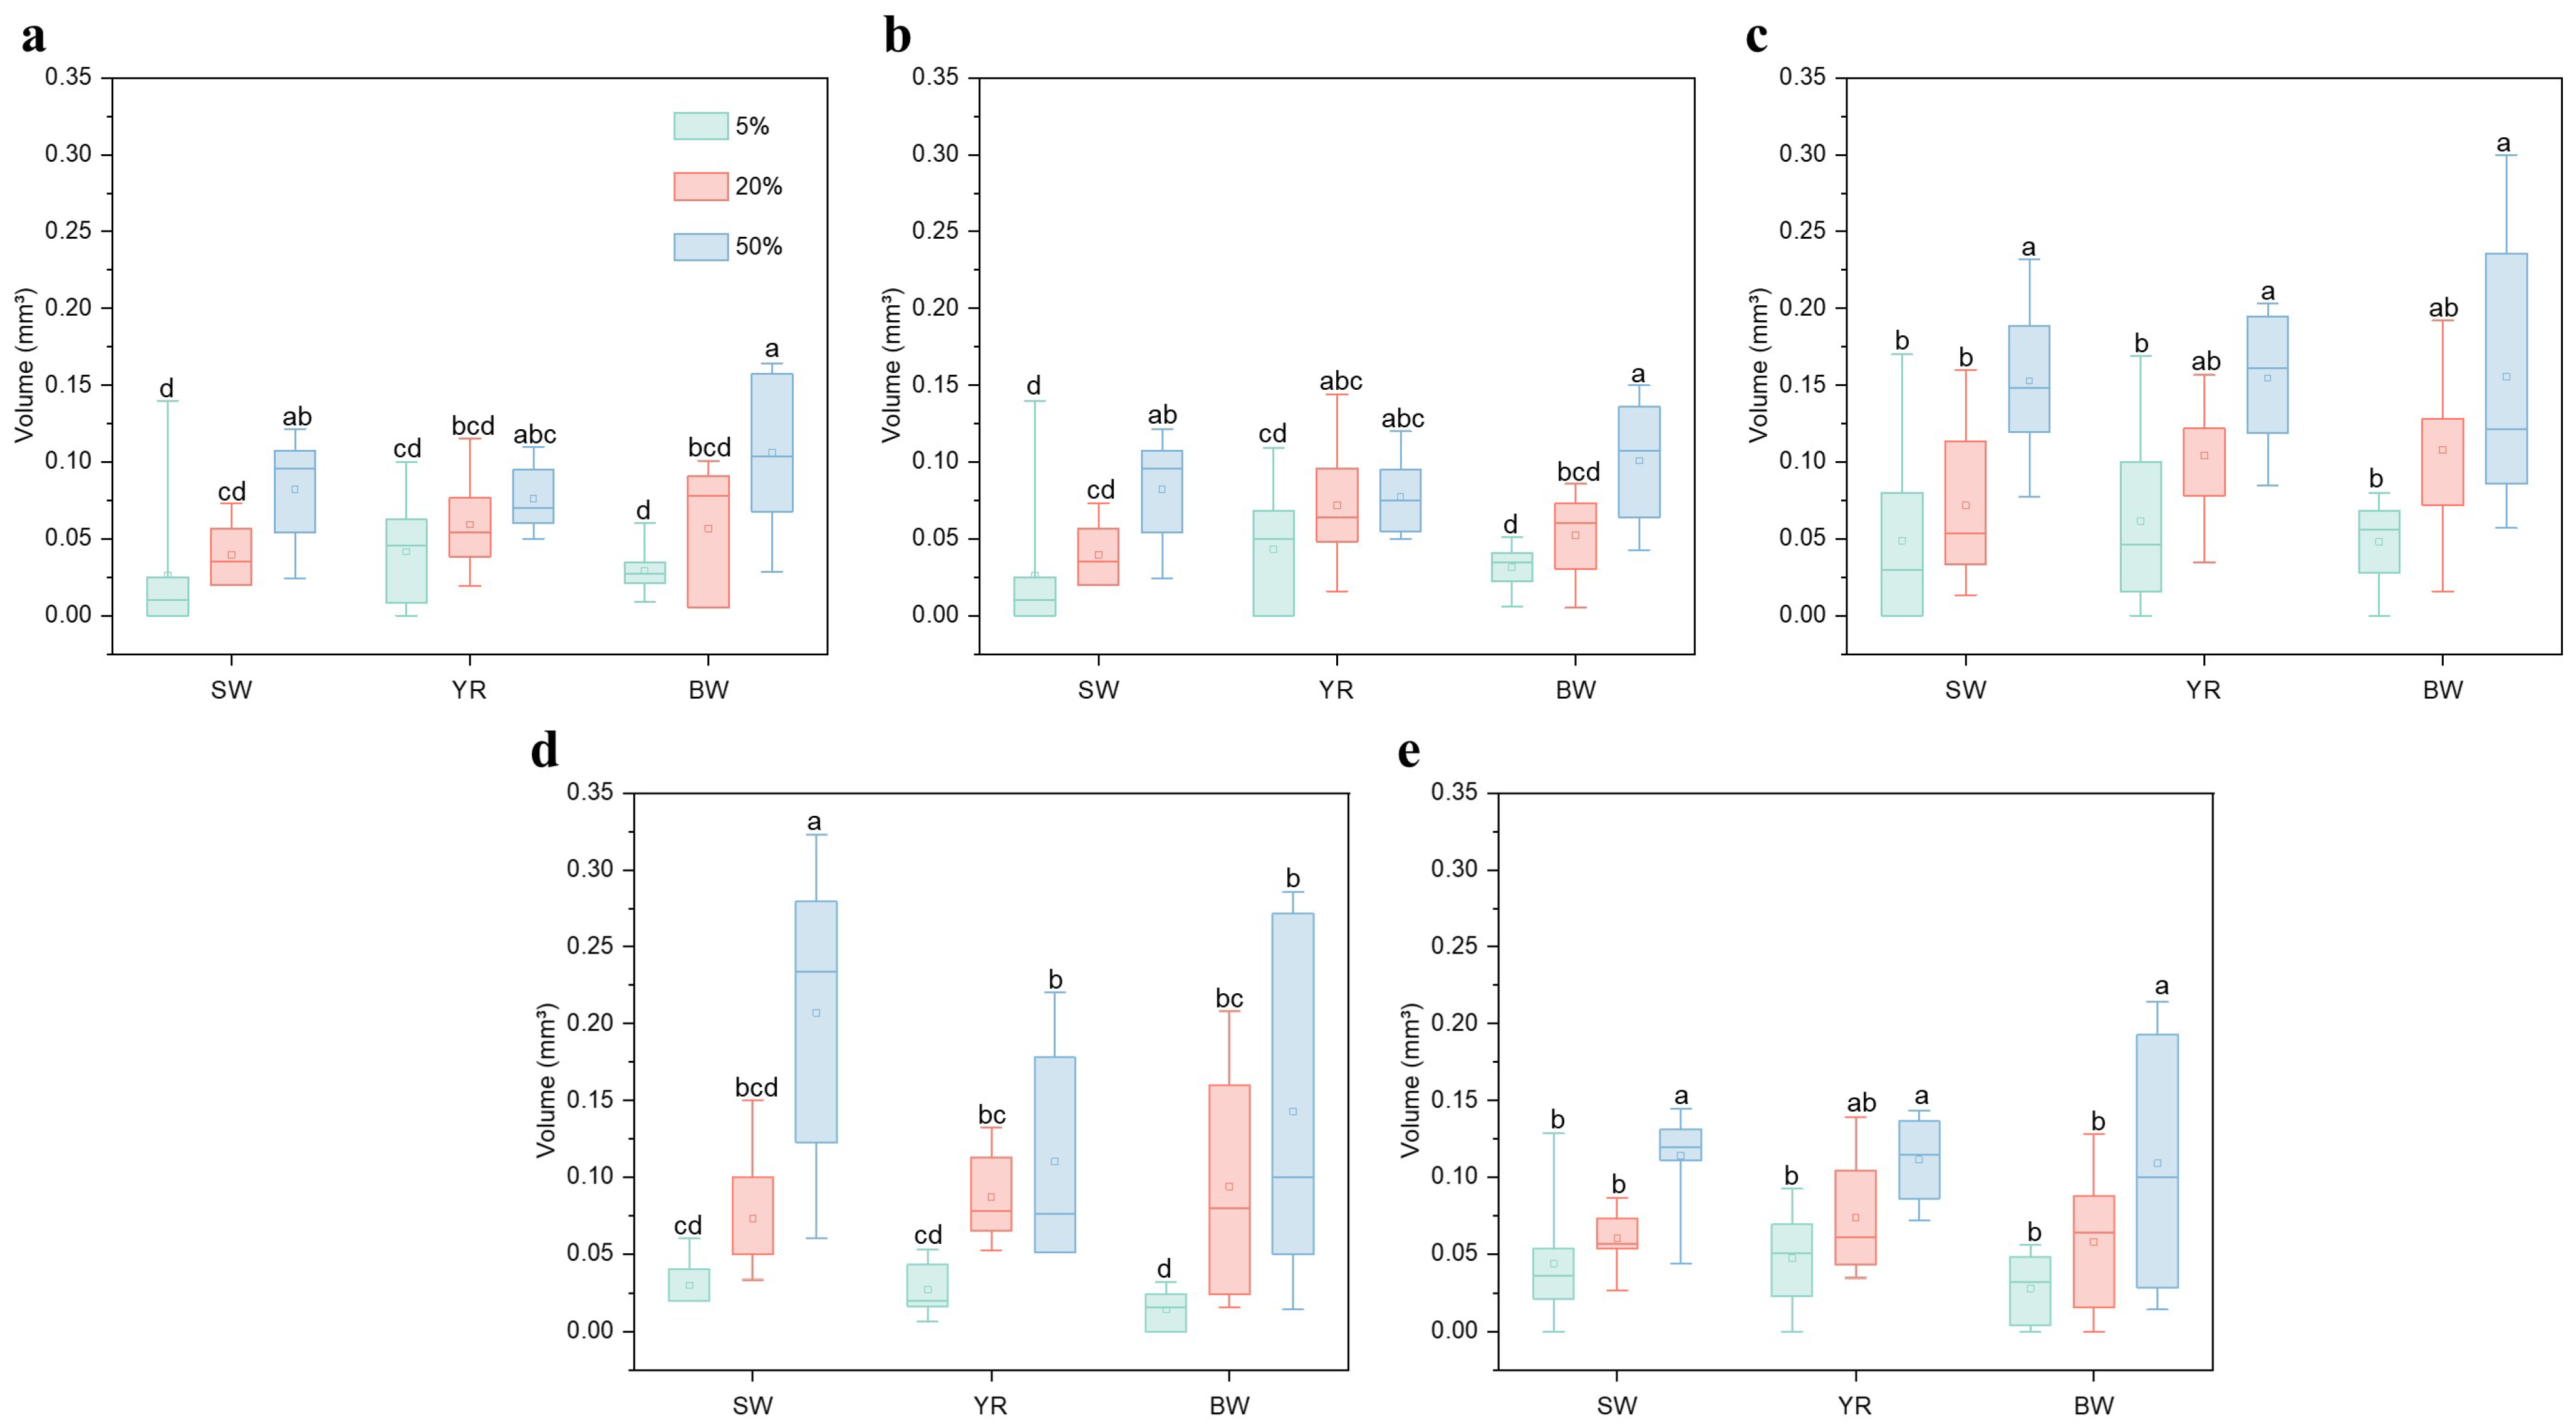
At 5% clogging severity, the three water sources all showed the highest clogging volume on the upstream face, with values of 0.049 mm3, 0.062 mm3, and 0.048 mm3, respectively. SW had the minimum volume on the top face and substrate face, and YR and BW had the minimum volumes on the downstream face, which were below 0.030 mm3. At 20% clogging severity, the three water sources all exhibited relatively large volumes on the upstream face and downstream face, varying between 0.072 mm3 and 0.108 mm3. A reduced amount of clogging substances was found on the top and substrate faces, which were below 0.060 mm3. At 50% clogging severity, the situation was similar to that at 20%, the largest volume of clogging substances under three kinds of water quality appeared in the downstream face, upstream face, and upstream face, respectively, ranging from 0.155 to 0.207 mm3. While a smaller volume of clogging substances was observed on the top and substrate faces, which was below 0.110 mm3 (p < 0.05, Figure 4). At 50% clogging severity, the clogging volume on all surfaces under SW and BW were significantly higher than those at the degree of 5%, while there was no significant difference between the volume of clogging substances on each face under different clogging degrees (p < 0.05, Figure 4).
For SW, YR, and BW, the larger volumes of clogging substances were all located on the upstream face, accounting for 23.9–31.8% of the total volume of clogging substances on the five faces. Therefore, it was crucial to prioritize controlling the buildup of clogging substances on the upstream face. With increasing clogging severity, the clogging volume ratio on downstream face increased to a certain extent under the three water sources. When the degree of clogging was 5%, the clogging volume ratio on the downstream face ranging from 9.29% to 17.14%. At clogging severities of 20% and 50%, the ratio ranging from 20.79% to 32.41%. In contrast, the clogging volume ratios on the top face and substrate faces were relatively lower, ranging from 12.91% to 19.40% and 12.91% to 20.90%, respectively. At 50% clogging severity, the volume of clogging substances on the downstream face under SW was notably greater than that observed under YR and BW (p < 0.05, Figure 4d), whereas the clogging substances volume showed no significant differences on each face among other water sources (p < 0.05, Figure 4).
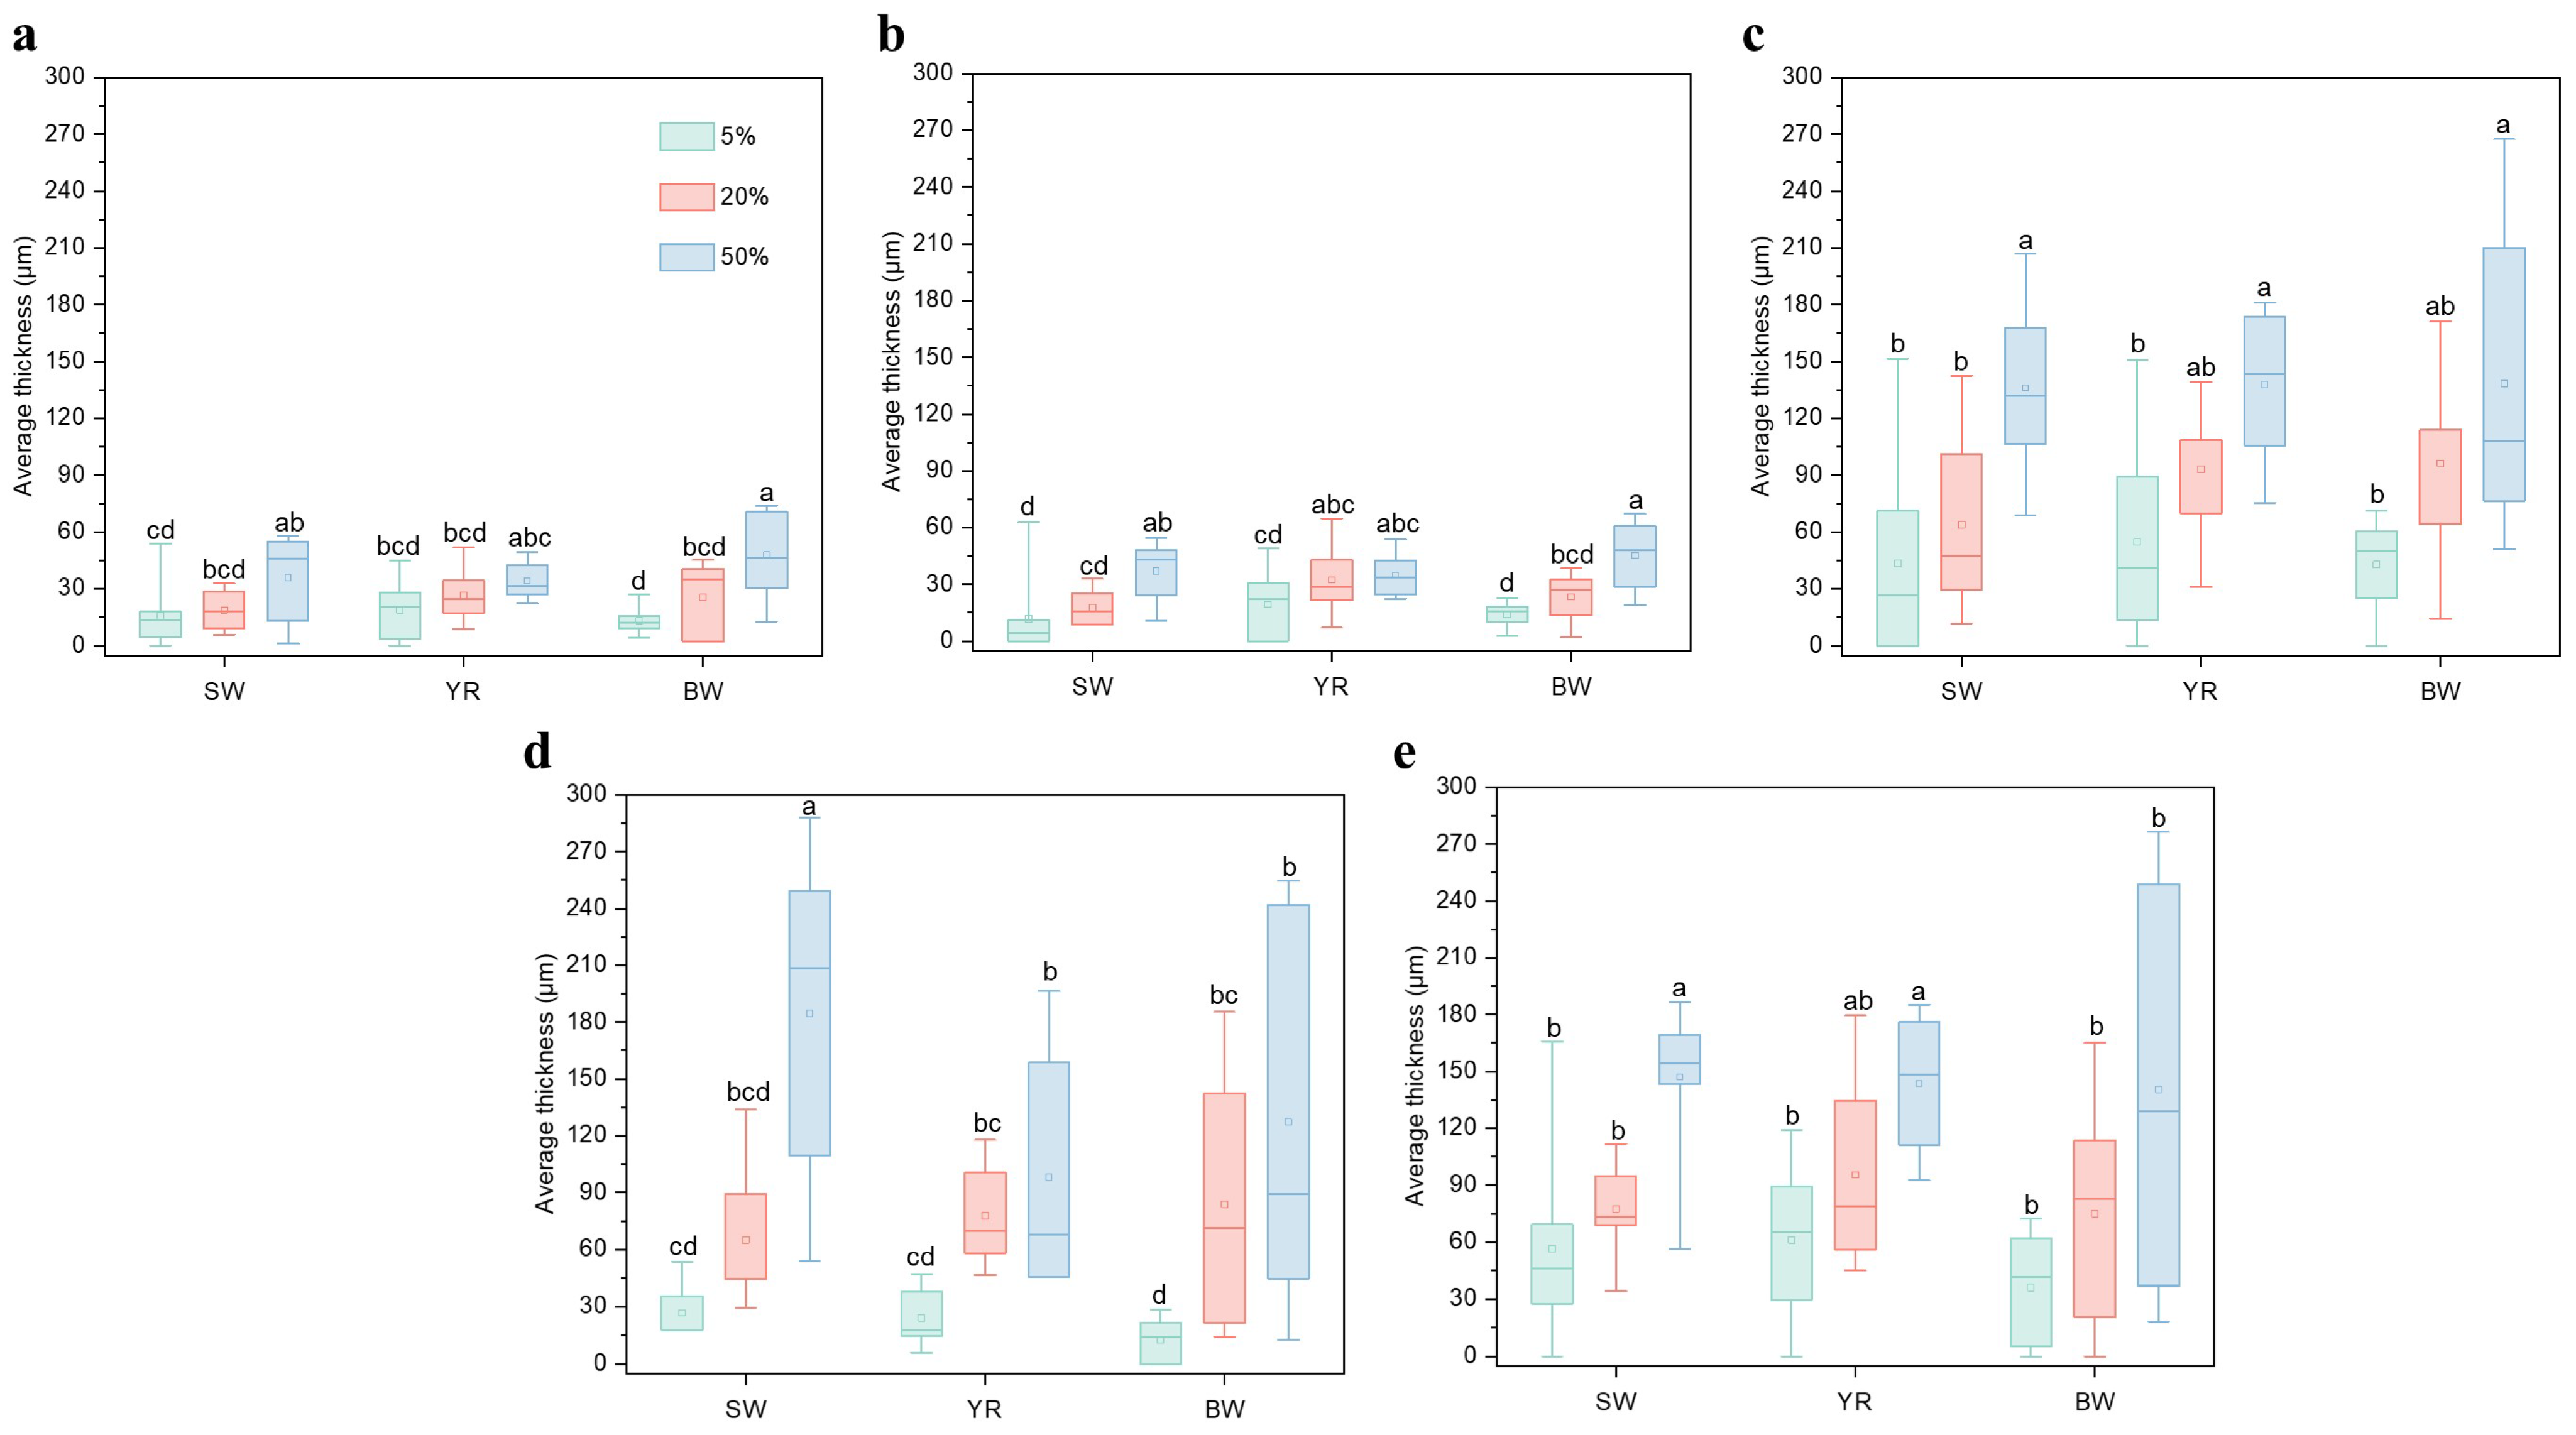
As for the mean thickness of clogging substances (Figure 5), all water sources exhibited larger thicknesses of clogging substances on the upstream face and root face when the degree of clogging reached 5%, ranging from 43.45 to 56.44 μm (for SW), 54.85 to 61.03 μm (for YR), 42.78 to 36.12 μm (for BW), respectively. Smaller thicknesses were observed on the top, substrate and downstream faces, all below 27 μm. At 20% clogging severity, all water sources showed larger thicknesses on the upstream, downstream and root faces, with maximum values appearing on the root face (SW, 77.40 μm), root face (YR, 95.35 μm), and upstream face (BW, 96.26 μm), respectively. While smaller thicknesses were distributed on the top face and substrate face, all below 35 μm. At 50% clogging severity, the thicknesses on the upstream, downstream, and root faces were still larger, with maximum values appearing on the downstream face (SW, 184.47 μm), root face (YR, 143.60 μm), and root face (BW, 140.52 μm), respectively. Smaller thicknesses were observed on the top face and substrate face, all below 50 μm. At 50% clogging severity, the mean thicknesses of clogging substances on all five faces under SW and BW were significantly higher than those at clogging degree of 5%. And there was no significant difference in the mean thickness of clogging substances on each face under different clogging degrees (p < 0.05, Figure 5).
Under the conditions of SW and YR, the maximum mean thicknesses of clogging substances were observed on the downstream face and root face, ranging from 56.44 to 184.47 μm and 61.03 to 143.60 μm, respectively. The minimum thicknesses were observed on the top face and substrate face, ranging from 11.80 to 37.04 μm and 18.73 to 34.83 μm, respectively. Under the condition of BW, the maximum thickness occurred on the upstream face at the clogging degrees of 5% and 20%, and on the root face at the clogging degree of 50%. The minimum thickness initially occurred on the downstream face, and it occurred on the top face and substrate face at 20% clogging severity. During the whole clogging experiment period, the mean thickness of the root face was relatively large, and the volume value was medium. This was due to the small face area of the root face, resulting in a smaller volume occupied by a certain thickness of clogging substances (Table 2). Additionally, the clogging mean thickness on the downstream face under the condition of SW at a clogging degree of 50% was significantly higher than that under YR and BW (p < 0.05, Figure 5d). No significant difference was found in the mean thickness of clogging substances on each face among different water sources (p < 0.05, Figure 5).
Figure 6 shows the proportion of clogging substance volume on the five faces under different water sources. It was evident that as clogging severity increased, the proportion of the downstream face had a significant increase. The volume proportion of the upstream face was larger, accounting for 23.93–31.84%, and the volume proportions of the top face and substrate face were smaller, accounting for 12.91–20.90%. At 5% clogging severity, clogging substances were primarily located in the upstream and root faces, and the distribution on the downstream face increases with the increase in the clogging degree.

3.3. The Distribution of Clogging Substances in the Direction of Water Flow

Figure 7 presents the clogging average volume within flow channel structural units with different clogging degrees under SW, YR, and BW with increasing flow channel length. A clear upward trend was observed in the clogging volume in the structural units for SW, YR, and BW. Moreover, the clogging volume at the front of the flow channel was mostly greater than that at the back, ranging from 51.4% to 113.8% (for SW), −12.8% to 284.0% (for YR), and 88.0% to 184.4% (for BW), respectively. At 20% clogging severity, the volume of the YR was an exception, and the front of the volume was smaller than the back, but the difference was not large.
With the clogging degree increases, the clogging volume increment at the front edge of the flow channel had been increasing compared with that at the back under the conditions of SW and BW. However, when the degree of clogging was 20% and 50%, there was no significant variation accumulation in clogging volume between the front and back under YR.
For different water sources, the difference between the front and back regions of flow channel under SW was more obvious. At a clogging degree of 20%, the clogging volume in the front was considerably higher than back (p < 0.05, Figure 7a). For YR, the difference was relatively uniform, with the volume at the front significantly higher than that at the back under clogging degree of 5% (p < 0.05, Figure 7b). The difference between the front and back of the emitter under BW was obvious, and the clogging volume in the front was considerably higher than in the back when the clogging degree reached 5% and 50% (p < 0.05, Figure 7c).

4. Discussion

Nowadays, freshwater resources are extremely limited, and the widespread use of SW and YR can effectively mitigate freshwater scarcity [17]. However, Yellow River water is characterized by fine sediment particle size and high viscosity, and the biofilm is attached to the majority of sediment particles [37]. Saline water is rich in calcium ions, magnesium ions, and other substances that are prone to form chemical precipitation and cause clogging [38,39]. Blending water can reduce the sediment concentration and mineralization degree in the water and can effectively alleviate the formation of clogging substances [17]. Therefore, this study conducted in situ nondestructive testing of clogging substances in the flow channels of drip irrigation emitters under three water conditions. The clogging spatial distribution under different water source conditions was obtained in this study. It can be revealed intuitively that the distribution pattern of clogging substances along the flow channel was less uniform under the condition of saline water and there were obvious scour traces of the main flow area. Conversely, the clogging distribution throughout the flow channel was more uniform under the condition of Yellow River water and there were obvious scour traces of the main flow area as well. Meanwhile, under the condition of blending water, the clogging substances distribution along the flow channel was less uniform.
When the clogging degree was 5%, both the total volume and maximum thickness of clogging substances in BW were lower than those in YR and SW. When the clogging degree was 20%, the volume value was shown as follows: SW < BW < YR. When the degree of clogging reached 50%, the volume value was shown as follows: YR < BW < SW. It can be seen that BW at the initial stage of clogging can effectively reduce the clogging volume. In the later stage of clogging, the drawbacks of the two water sources could be balanced at a middle level, which was better than the worst case (Figure 4). Clogging accumulation at the front of flow channels was more pronounced under the conditions of Yellow River and blending water conditions. This is attributed to the higher concentration of suspended particles in Yellow River water and the blending water conditions, which rapidly settle in the vortex area (i.e., the area between upstream face and the root face of emitter) of several units located at the front of the flow channel after entering the emitter [13]. The clogging substances under the different water sources were concentrated at the upstream face, root face, and corners, then gradually growing into other areas. This is similar to previous research that a higher clogging concentration was detected around the corners of emitter flow channels [40,41]. Some scholars propose removing these corners while preserving only the main channel area [42]. While this method effectively controls clogging substances, it decreases the vortex region and labyrinth flow channel’s dissipation capacity [21]. Moreover, this study also observed that the severity of emitter clogging tends to alleviate with the direction of water flow. Under different conditions of water source, the distributions were consistent, showing that there was a greater clogging accumulation at the front of the flow channel compared to the back. The clogging volume difference between the front and back grew as the clogging degree increased. This phenomenon may be attributed to the movement of solid particles, mineral components, and other impurities in poor-quality water, which affects the growth of clogging substances [43,44]. With the direction of the water flow, the probability of contact between water impurities and the structural units is observably decreased, leading to a higher abundance of clogging substances at the front of the flow channel [32,45]. However, the formation and removal of clogging substances were frequent, and they are prone to move to subsequent structural units, resulting in certain randomness in the volume of clogging substances within each structural unit.
Across different faces, the volume and mean thickness of clogging substances exhibited consistent patterns across the three water sources. It was shown that with the increase in clogging degree, both the volume and mean thickness of clogging substances on each face had a certain increase. A higher accumulation of clogging substances was observed on the upstream, downstream, and root faces, while less on the top face and substrate face. The clogging volume on the top and substrate faces was relatively low, showing minor fluctuations. This phenomenon is likely due to the relatively small width-depth ratio of the emitter. It can be found from the direct morphology that most areas on the top face and substrate face were located within the main flow area, making it difficult to deposit clogging substances. Because the distribution of clogging substances on the top face and substrate face mainly occurred outside the main flow zone and the position of the main flow zone changed little with the change in time, the distribution of clogging substances changed little as well. Conversely, the volume of clogging substances on the downstream face was medium but the mean thickness was large, which is caused by the small surface area of the downstream face. The increase in clogging substance volume on the downstream face was the most obvious, and the volume ratio value of clogging substances on the downstream face was low but later increased. This is because the downstream face experiences relatively less shear force from nearby faces, which faster growth of clogging substances on this face. Additionally, the volume ratio value of clogging substances on the upstream face was highest and relatively stable (Figure 6). This is primarily due to more intense collisions between particles inside the emitter flow channel and the upstream face, leading to a more abundant formation of clogging substances on this face.
However, due to the complex characteristic of emitter flow channel, which involves turbulence, particle deposition, and shear forces. It is difficult to fully reveal the clogging mechanism through ICT imaging alone, and different types of emitters may have their own unique clogging mechanisms [34]. Therefore, combined with numerical simulation, the hydraulic characteristics in the flow channel can be studied more deeply and the flow channel design can be optimized. In recent years, there have been studies using the method of combining experiment and numerical simulation to analyze the flow characteristics and clogging mechanism of drip irrigation emitters [31,33]. The combination of the two methods provides a reliable basis for the flow channel design. In the future, our research can be further extended to various flow channel structures, utilizing a combination of experiments and simulations to explore the effects of different design parameters and operating conditions on anti-clogging, thereby optimizing emitter design and enhancing the operational efficiency of drip irrigation systems.
In general, the emitter exhibits more clogging on the front of the flow channel, the downstream, upstream and root faces, leading to greater uncertainty in emitter clogging, which negatively affects irrigation uniformity in the drip irrigation system. These areas also have a pivotal function in dissipating energy within labyrinth-type emitter flow channels. In the design process of the emitter flow channel, a gradually varying channel structure can be considered to reduce the accumulation of clogging substances in the front section (from large to small along the direction of the flow). Additionally, it can be considered to increase the arc of the upstream and downstream faces to form a vortex, which helps clean the flow channel and consequently reduces the deposition of clogging substances.

5. Conclusions

Industrial computed tomography was used in this study to characterize the spatial distribution of clogging substances in drip irrigation emitters under saline water, Yellow River water, and blending water conditions. The findings indicate that blending water significantly reduced clogging volume in the early stages of clogging and continued to mitigate clogging as severity increased. The upstream and downstream faces exhibited the greatest clogging volume, while the root face showed the largest thickness. The least clogging occurred on the top and substrate faces. With the increase in clogging severity, the clogging volume on the downstream face rose significantly, while the volume on the upstream face remained relatively stable. Additionally, the study found that the clogging volume decreased as the length of the flow channel increased. Therefore, this study suggests that using blending water, incorporating a gradually varying channel structure, and increasing the arc of the upstream and downstream faces can help reduce the accumulation of clogging substances in the emitter. This research provides valuable insights into clogging behavior under different water qualities and supports the application of saline and high-sediment water in agricultural drip irrigation systems.

Author Contributions

Conceptualization, Y.X. and P.H.; methodology, Y.X. and P.H.; software, Y.Y.; formal analysis, S.L.; data curation, Y.Y. and Y.X.; writing—original draft preparation, Y.Y.; writing—review and editing, Y.Y., Y.X., P.H. and S.L.; visualization, Y.Y.; supervision, Y.X. and S.L.; project administration, Y.X. and S.L. All authors have read and agreed to the published version of the manuscript.

Funding

This study research was funded by the National Key Research Project (2023YFD1900803) and the National Natural Science Foundation of China (U2443211, 52209074).

Data Availability Statement

The raw data supporting the conclusions of this article will be made available by the authors on request.

Acknowledgments

We thank the anonymous reviewers for their constructive comments.

Conflicts of Interest

The authors declare no conflicts of interest.

Abbreviations

The following abbreviations are used in this manuscript:
ICTIndustrial Computed Tomography
SWsaline water
YRYellow River water
BWblending water
Ffront
Bback

References

  1. Boretti, A.; Rosa, L. Reassessing the projections of the world water development report. NPJ Clean Water 2019, 2, 15. [Google Scholar] [CrossRef]
  2. Gosling, S.N.; Arnell, N.W. A global assessment of the impact of climate change on water scarcity. Clim. Change 2016, 134, 371–385. [Google Scholar] [CrossRef]
  3. Yazdandoost, F.; Noruzi, M.M.; Yazdani, S.A. Sustainability assessment approaches based on water-energy Nexus: Fictions and nonfictions about non-conventional water resources. Sci. Total Environ. 2021, 758, 143703. [Google Scholar] [CrossRef]
  4. Karimidastenaei, Z.; Avellán, T.; Sadegh, M.; Kløve, B.; Haghighi, A.T. Unconventional water resources: Global opportunities and challenges. Sci. Total Environ. 2022, 827, 154429. [Google Scholar] [CrossRef]
  5. Skaggs, R.K. Drip irrigation in the desert: Adoption, implications, and obstacles. Agric. Water Manag. 2000, 43, 125–142. [Google Scholar] [CrossRef]
  6. Qiu, X.; Wang, J.; Wang, H.; Wang, C.; Sun, Y.; Li, G. Elimination of clogging of a biogas slurry drip irrigation system using the optimal acid and chlorine addition mode. Agriculture 2022, 12, 777. [Google Scholar] [CrossRef]
  7. Wan, S.; Kang, Y.; Wang, D.; Liu, S.P.; Feng, L.P. Effect of drip irrigation with saline water on tomato (Lycopersicon esculentum Mill) yield and water use in semi-humid area. Agric. Water Manag. 2007, 90, 63–74. [Google Scholar] [CrossRef]
  8. Nakayama, F.S.; Bucks, D.A. Water quality in drip/trickle irrigation: A review. Irrig. Sci. 1991, 12, 187–192. [Google Scholar] [CrossRef]
  9. Liu, L.; Niu, W.; Guan, Y.; Wu, Z.; Ayantobo, O.O. Effects of urea fertigation on emitter clogging in drip irrigation system with muddy water. J. Irrig. Drain. Eng. 2019, 145, 04019020. [Google Scholar] [CrossRef]
  10. Wang, H.; Ling, G.; Wang, W.; Hu, X.; Gao, X. A Prediction Model of Labyrinth Emitter Service Duration (ESD) under Low-Quality (Sand-Laden Water) Irrigation. Water 2022, 14, 1690. [Google Scholar] [CrossRef]
  11. Pei, Y.; Li, Y.; Liu, Y.; Zhou, B.; Shi, Z.; Jiang, Y. Eight emitters clogging characteristics and its suitability Under on-site reclaimed water drip irrigation. Irrig. Sci. 2014, 32, 141–157. [Google Scholar] [CrossRef]
  12. Puig-Bargués, J.; Lamm, F.R. Effect of flushing velocity and flushing duration on sediment transport in microirrigation driplines. Trans. ASABE 2013, 56, 1821–1828. [Google Scholar] [CrossRef]
  13. Zhang, W.; Lv, C.; Zhao, X.; Dong, A.; Niu, W. The influence mechanism of the main suspended particles of Yellow River sand on the emitter clogging—An attempt to improve the irrigation water utilization efficiency in Yellow River basin. Agric. Water Manag. 2021, 258, 107202. [Google Scholar] [CrossRef]
  14. He, X.; Wu, P.; Zhang, L.; Wei, Y.; Liu, X.; Yang, F.; Zhou, W. Microporous ceramic emitter: A drip irrigation emitter suitable for high-sediment water. J. Water Process Eng. 2024, 67, 106169. [Google Scholar] [CrossRef]
  15. Li, Y.K.; Zhou, B.; Yang, P. Research advances in drip irrigation emitter clogging mechanism and controlling methods. J. Hydraul. Eng. 2018, 49, 103–114. [Google Scholar] [CrossRef]
  16. Chen, S.F.; He, X.L.; Wang, Z.F. Development of research on drip irrigation of saline water. Water Sav Irrig. 2010, 2, 6–9, (In Chinese with English Abstract). [Google Scholar]
  17. Wang, T.; Guo, Z.; Kuo, C.T. Effects of mixing Yellow River water with brackish water on the emitter’s clogging substance and solid particles in drip irrigation. SN Appl. Sci. 2019, 1, 1269. [Google Scholar] [CrossRef]
  18. Ding, B.; Bai, Y.; Guo, S.; He, Z.; Wang, B.; Liu, H.; Zhai, J.; Cao, H. Effect of irrigation water salinity on soil characteristics and microbial communities in cotton fields in Southern Xinjiang, China. Agronomy 2023, 13, 1679. [Google Scholar] [CrossRef]
  19. Slama, F.; Zemni, N.; Bouksila, F.; De Mascellis, R.; Bouhlila, R. Modelling the impact on root water uptake and solute return flow of different drip irrigation regimes with brackish water. Water 2019, 11, 425. [Google Scholar] [CrossRef]
  20. Qadir, M.; Quillérou, E.; Nangia, V.; Murtaza, G.; Singh, M.; Thomas, R.J.; Drechsel, P.; Schmid, E.; Donaj, D.; Noble, A.D. Economics of salt-induced land degradation and restoration. Nat. Resour. Forum. 2014, 38, 282–295. [Google Scholar] [CrossRef]
  21. Feng, J.; Li, Y.; Wang, W.; Xue, S. Effect of optimization forms of flowpath on emitter hydraulic and anti-clogging performance in drip irrigation system. Irrig. Sci. 2018, 36, 37–47. [Google Scholar] [CrossRef]
  22. Lv, C.; Zhang, E.; Gan, H.; Niu, W.; Ali, S.; Dong, A.; Zhang, W.; Sun, D. Aerated drip irrigation increased the emitter clogging risk of the Yellow River water drip irrigation. Irrig. Drain. 2023, 72, 3–20. [Google Scholar] [CrossRef]
  23. Zaiyu, L.; Yan, M.; Hao, G.; Shihong, G.; Yanqun, Z.; Guangyong, L.; Feng, W. The hydraulic performance and clogging characteristics of a subsurface drip irrigation system operating for five years in the North China plain. Agric. Water Manag. 2025, 307, 109217. [Google Scholar] [CrossRef]
  24. Benlouali, H.; Karmal, I.; Cherif Harrouni, M.; Ghanbaja, J.; Frascari, D.; Hamdani, M.; Choukr-Allah, R. Characterization of clogging deposits in an irrigation pipeline and effect of post-aeration on clogging potential of tertiary-treated wastewater. Water Sci. Technol. 2021, 83, 309–321. [Google Scholar] [CrossRef]
  25. Shi, K.; Zhangzhong, L.; Han, F.; Zhang, S.; Guo, R.; Yao, X. Reducing emitter clogging in drip fertigation systems by magnetization technology. Sustainability 2023, 15, 3712. [Google Scholar] [CrossRef]
  26. Petit, J.; Ait-Mouheb, N.; García, S.M.; Metz, M.; Molle, B.; Bendoula, R. Potential of visible/near infrared spectroscopy coupled with chemometric methods for discriminating and estimating the thickness of clogging in drip-irrigation. Biosyst. Eng. 2021, 209, 246–255. [Google Scholar] [CrossRef]
  27. Li, G.B.; Li, Y.K.; Xu, T.W.; Liu, Y.Z.; Jin, H.; Yang, P.L.; Zhang, F.S.; Tian, Z.F. Effects of average velocity on the growth and surface topography of biofilms attached to the reclaimed wastewater drip irrigation system laterals. Irrig. Sci. 2012, 30, 103–113. [Google Scholar] [CrossRef]
  28. Yuan, H.; Wang, Y.; Sun, Z.; Shi, N.; Li, B.; Ma, C.; Xiao, Y.; Li, Q.; Li, Y. Increasing iron use efficiency by controlling emitter clogging in drip irrigation systems. Agric. Water Manag. 2023, 290, 108601. [Google Scholar] [CrossRef]
  29. Ribeiro, M.D.; Azevedo, C.A.D.; Santos, D.B.D.; Szekut, F.D.; Klein, M.R.; Reis, C.F. Optical microscopy and SEM for identifying clogging material in a drip irrigation system. Rev. Caatinga 2018, 31, 997–1007. [Google Scholar] [CrossRef]
  30. Petit, J.; García, S.M.; Molle, B.; Bendoula, R.; Ait-Mouheb, N. Methods for drip irrigation clogging detection, analysis and understanding: State of the art and perspectives. Agric. Water Manag. 2022, 272, 107873. [Google Scholar] [CrossRef]
  31. Yao, Y.; Shen, Y.; Ma, C.; Zhang, K.; Li, J.; Xiao, Y.; Li, Y. Spatial distribution of clogging substances in drip irrigation emitters fed with reclaimed water. Irrig. Sci. 2024, 42, 239–251. [Google Scholar] [CrossRef]
  32. Ma, C.; Li, M.; Hou, P.; Wang, X.; Sun, Z.; Li, Y.; Zhang, K.; Yao, Y.; Li, Y. Biofilm dynamic changes in drip irrigation emitter flow channels using reclaimed water. Agric. Water Manag. 2024, 291, 108624. [Google Scholar] [CrossRef]
  33. Ramachandrula, V.R.; Kasa, R.R.; Torris, A. Micro-Computed Tomography (µCT) Study of Clogging in Long-Used Strip and Cylindrical Drip Emitters. J. Inst. Eng. India Ser. A 2023, 104, 167–174. [Google Scholar] [CrossRef]
  34. Chiffre, L.; Carmignato, S.; Kruth, J.; Schmitt, R.; Weckenmann, A. Industrial applications of computed tomography. CIRP Ann. Manuf. Technol. 2014, 63, 655–677. [Google Scholar] [CrossRef]
  35. Wang, T.; Dai, X.; Zhang, T.; Xin, C.; Guo, Z.; Wang, J. Formation and microbial composition of biofilms in drip irrigation system under three reclaimed water conditions. Water 2022, 14, 1216. [Google Scholar] [CrossRef]
  36. Davit, Y.; Debenest, G.; Quintard, M. Multiple-scale analysis of transport in porous media with biofilms. In AIP Conference Proceedings; American Institute of Physics: College Park, MD, USA, 2010; Volume 1254, Issue 1, pp. 175–180. [Google Scholar] [CrossRef]
  37. Wang, W.; Xu, F.; Zhou, B.; Feng, J.; Li, Y. Structural and fractal characteristics of biofilm attached on surfaces of sediments in Yellow River for drip irrigation. J. Drain Irrig. Mach. Eng. 2014, 32, 914–920, (In Chinese with English Abstract). [Google Scholar] [CrossRef]
  38. Zhou, L.; Wei, C.; Yang, P.; Li, Y.; Zhangzhong, L.; Su, Y.; Ren, S.; He, X. Effects of saline water with different concentrations of calcium and magnesium ions on emitter clogging in drip irrigation integrated water–fertilizer system. Irrig. Drain. 2024, 73, 16–28. [Google Scholar] [CrossRef]
  39. Zhangzhong, L.; Yang, P.; Ren, S.; Li, Y.; Liu, Y.; Xia, Y. Chemical clogging of emitters and evaluation of their suitability for saline water drip irrigation. Irrig. Drain. 2016, 65, 439–450. [Google Scholar] [CrossRef]
  40. Lequette, K.; Ait-Mouheb, N.; Wéry, N. Hydrodynamic effect on biofouling of milli-labyrinth channel and bacterial communities in drip irrigation systems fed with reclaimed wastewater. Sci. Total Environ. 2020, 738, 139778. [Google Scholar] [CrossRef]
  41. Qian, J.; Horn, H.; Tarchitzky, J.; Chen, Y.; Katz, S.; Wagner, M. Water quality and daily temperature cycle affect biofilm formation in drip irrigation devices revealed by optical coherence tomography. Biofouling 2017, 33, 211–221. [Google Scholar] [CrossRef]
  42. Li, Y.; Liu, H.; Yang, P.; Wu, D. Analysis of tracing ability of different sized particles in drip irrigation emitters with computational fluid dynamics. Irrig. Drain. 2013, 62, 340–351. [Google Scholar] [CrossRef]
  43. Shen, Y.; Puig-Bargués, J.; Li, M.; Xiao, Y.; Li, Q.; Li, Y. Physical, chemical and biological emitter clogging behaviors in drip irrigation systems using high-sediment loaded water. Agric. Water Manag. 2022, 270, 107738. [Google Scholar] [CrossRef]
  44. Yang, B.; Wang, F.; Wang, J.; Wang, C.; Qiu, X. Numerical simulation and optimization of the inlet structure of dentiform emitters in drip-irrigation systems. Biosyst. Eng. 2024, 246, 183–190. [Google Scholar] [CrossRef]
  45. Wang, H.; Wang, J.; Wang, C.; Wang, S.; Qiu, X.; Sun, Y.; Li, G. Characterization of labyrinth emitter-clogging substances in biogas slurry drip irrigation systems. Sci. Total Environ. 2022, 820, 153315. [Google Scholar] [CrossRef]
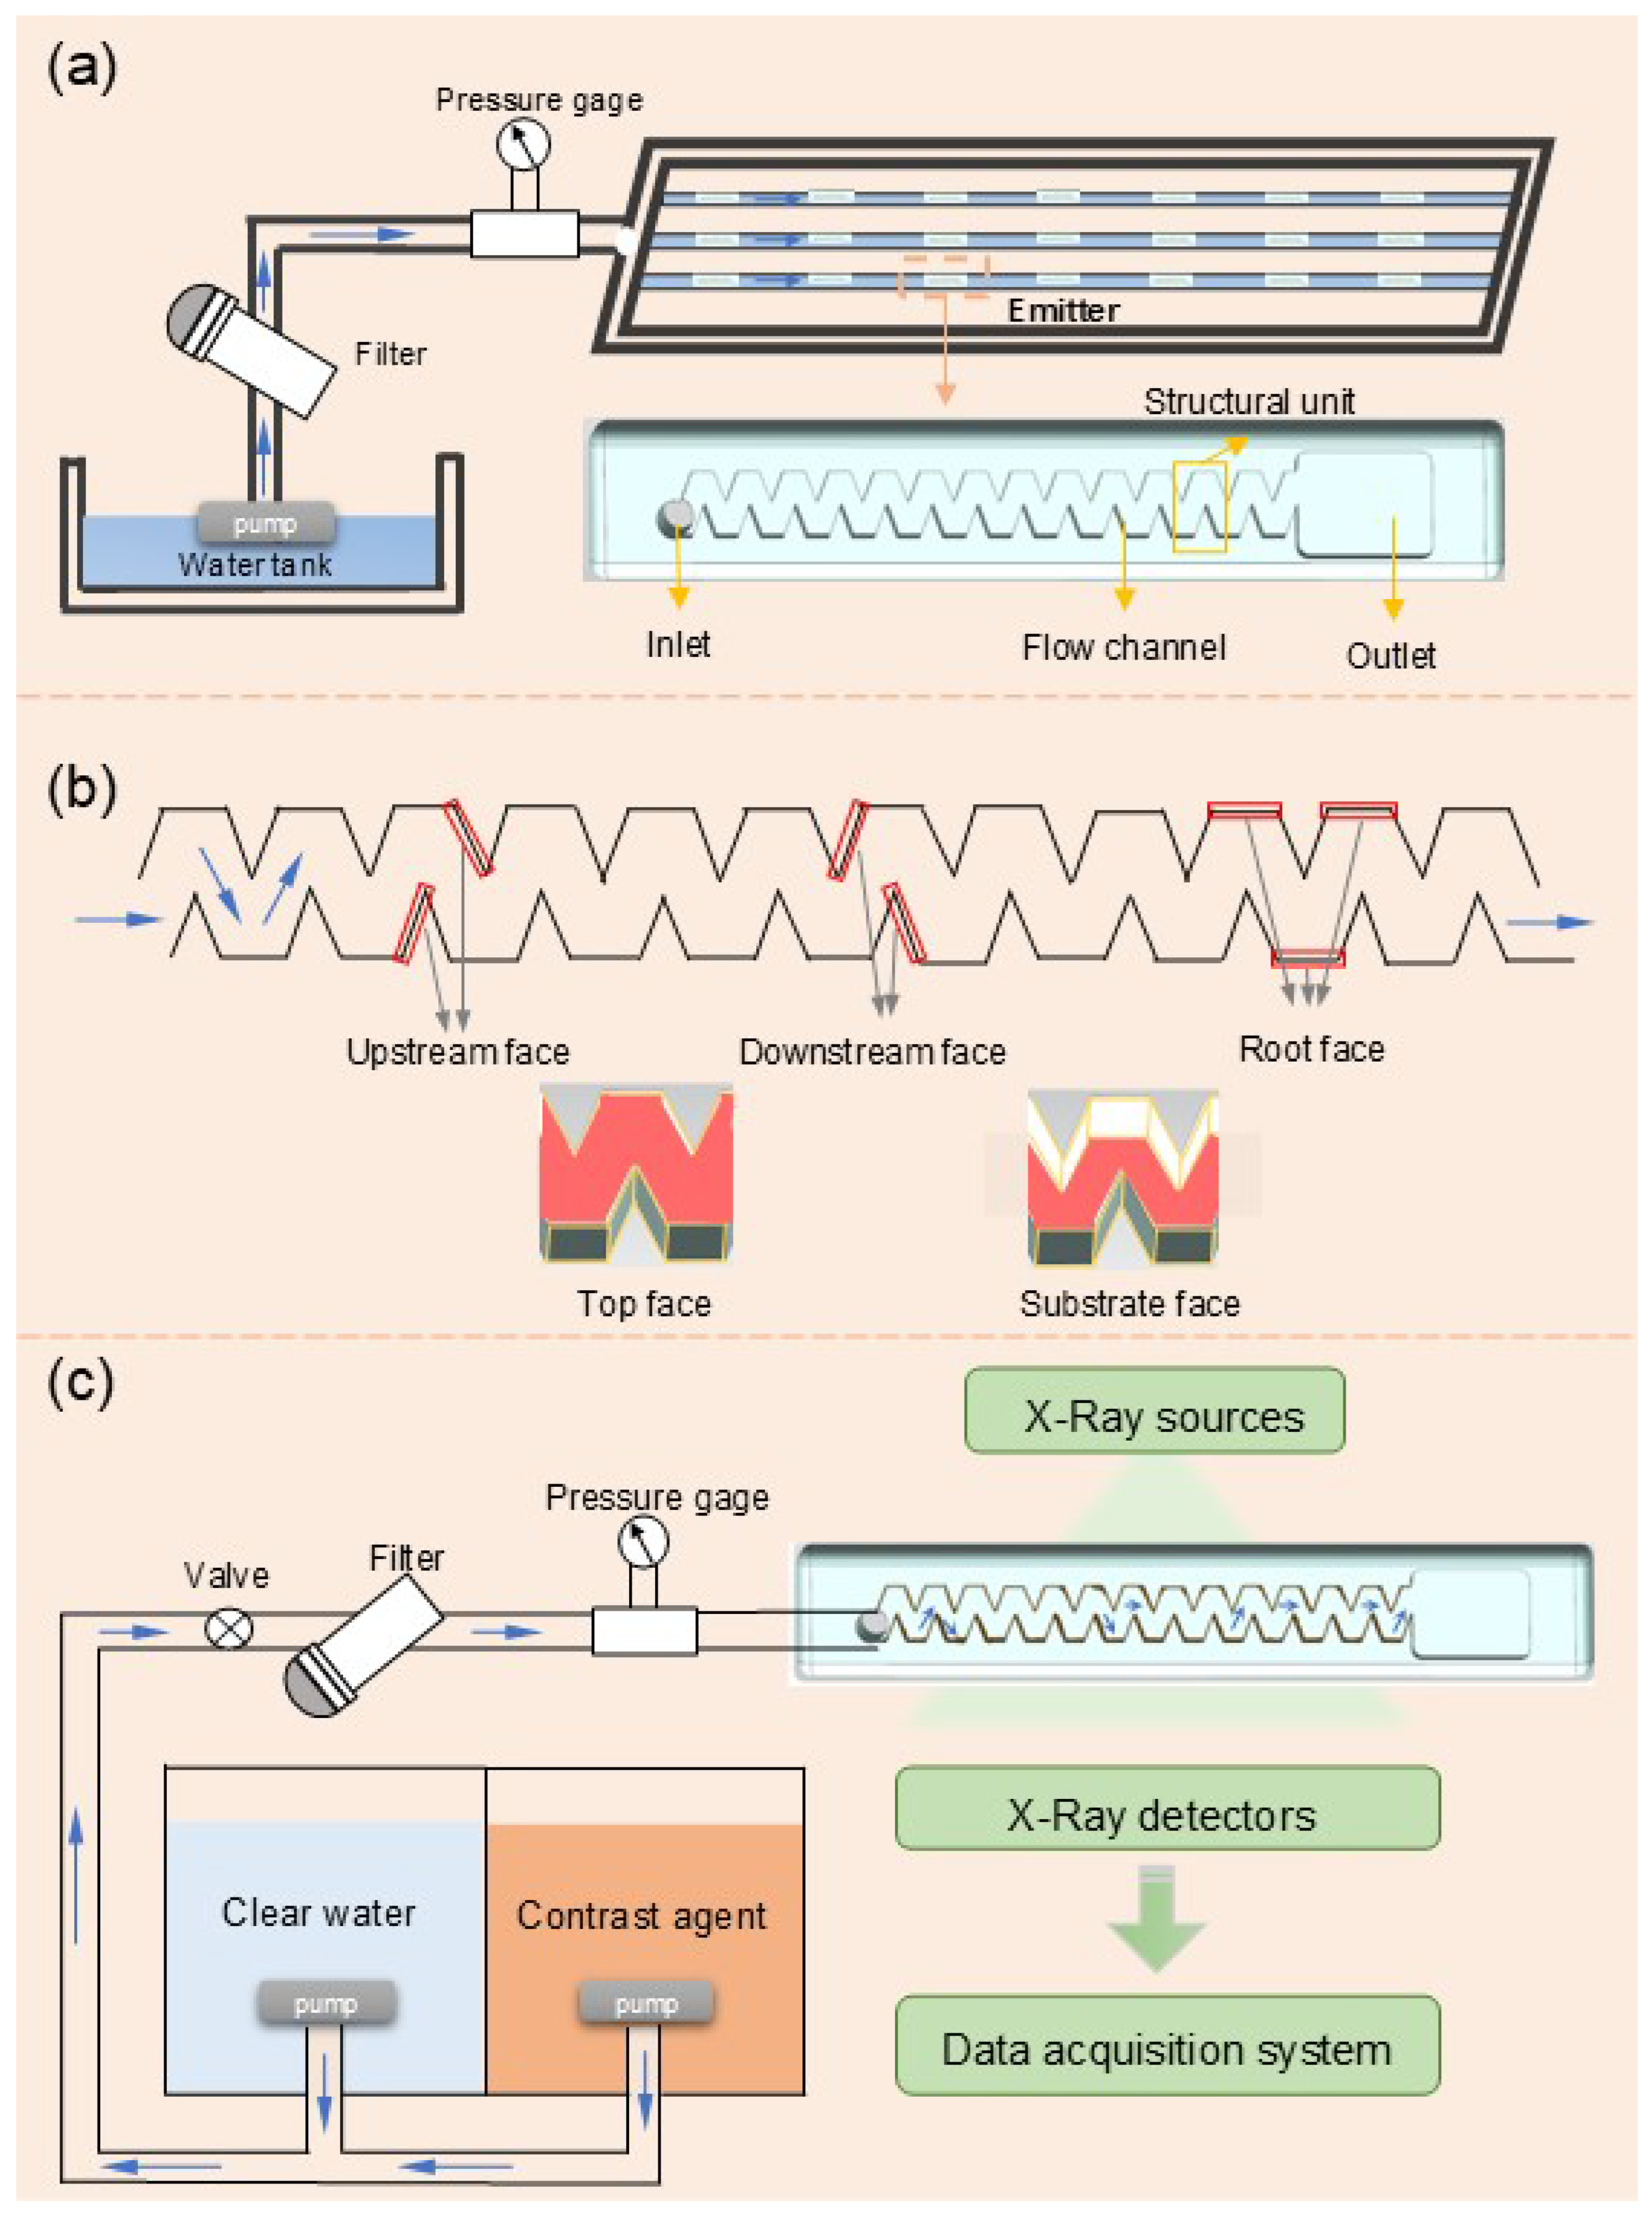
Figure 1. Non-destructive clogging substance observations and emitter structural representation. (a) Drip irrigation emitter clogging experimental device and the structure of the emitter. Different water sources were injected into the water tank for clogging experiments to obtain samples under different water source conditions, and the structure of the emitter was divided into similar structural units. Blue arrows in the emitter channel indicate flow direction of water. (b) The red regions refer to the five faces in the structural unit. (c) Non-destructive clogging substances observation in emitters imaged by industrial computed tomography, with the brown portion in the emitter flow channels representing the attached clogging substances. The entire system involves the staining of clogging substances inside the emitters and the ICT imaging process.
Water 17 01065 g001
Figure 2. Three-dimensional morphology of clogging substances in the emitter flow channel. (ac) represent the results in the saline water for 5%, 20% and 50% of clogging degree, respectively. (df) represent the results in the Yellow River water for 5%, 20%, and 50% of clogging degree, respectively. (gi) represent the results in the blending water for 5%, 20%, and 50% of clogging degree, respectively.
Water 17 01065 g002
Figure 3. The total volume of clogging substances under different water sources at different degrees of clogging. The letters above the boxplots indicate significant analysis, and the letters a–e represent the average values from small to large. Groups that did not have the same letter indicate that there were significant differences between the groups (p < 0.05), whereas groups that had the same letter indicate that the differences were not significant. In the box, the transverse line represents the median value line, and the square represents the average value. The up and down transverse line represent the maximum and minimum values, respectively.
Water 17 01065 g003
Figure 4. (ae) represent the clogging substances volume in various faces under different water sources for 5%, 20%, and 50% of clogging degree, respectively. (ae) represent the top face, substrate face, upstream face, downstream face, and root face of the emitter, respectively. SW, YR, and BW represent the saline water, Yellow River water, and blending water. The letters above the boxplots indicate significant analysis, and the letters a–d represent the average values from small to large. Groups that did not have the same letter indicate that there were significant differences between the groups (p < 0.05), whereas groups that had the same letter indicate that the differences were not significant. In the box, the transverse line represents the median value line, and the square represents the average value. The up and down transverse line represent the maximum and minimum values, respectively.
Water 17 01065 g004
Figure 5. (ae) represent the clogging substances mean thickness in various faces under different water sources for 5%, 20%, and 50% of clogging degree, respectively. (ae) represent the top face, substrate face, upstream face, downstream face, and root face of the emitter, respectively. SW, YR, and BW represent the saline water, Yellow River water and blending water. The letters above the boxplots indicate significant analysis, and the letters a–d represent the average values from small to large. Groups that did not have the same letter indicate that there were significant differences between the groups (p < 0.05), whereas groups that had the same letter indicate that the differences were not significant. In the box, the transverse line represents the median value line, and the square represents the average value. The up and down transverse line represent the maximum and minimum values, respectively.
Water 17 01065 g005
Figure 6. Volume proportion of clogging substances in different faces. SW, YR, and BW represent the saline water, Yellow River water, and blending water. TF, SF, UF, DF, and RF represent the top face, the substrate face, the upstream face, the downstream face, and the root face.
Water 17 01065 g006
Figure 7. Distribution of clogging substances with the water flow direction. (ac) represent the volume of clogging substances under the saline water (SW), Yellow River water (YR), and blending water (BW). The 1–4 structural units of the flow channels were defined as the front and the 5–8 structural units were defined as the back. * and ** represent significant (p < 0.05) and extremely significant (p < 0.01); and NS indicates not significant.
Water 17 01065 g007
Table 1. Water quality parameters during the experiment in the Yellow River basin.
Water SourcepHSuspended Solids
mg/L
Specific Conductance
μm/cm
Mineralization of Water
mg/L
CODCr
mg/L
BOD5
mg/L
Total Phosphorus
mg/L
Total Nitrogen mg/LCalcium
mg/L
Magnesium
mg/L
SW9.2<59460476024.84.20.162.04321127
YR7.7417964836.81.70.061.4854.725.7
Table 2. The areas of different faces within emitter.
The Top FaceThe Substrate FaceThe Upstream FaceThe Downstream FaceThe Root Face
2.2248 mm22.2248 mm20.561 mm20.561 mm20.3876 mm2
Disclaimer/Publisher’s Note: The statements, opinions and data contained in all publications are solely those of the individual author(s) and contributor(s) and not of MDPI and/or the editor(s). MDPI and/or the editor(s) disclaim responsibility for any injury to people or property resulting from any ideas, methods, instructions or products referred to in the content.