Article

Water-Richness Evaluation of Sandstone Aquifer Based on Set Pair Analysis Variable Fuzzy Set Coupling Method: A Case Study on Bayangaole Mine, China

1
Shandong Provincial Coal Geological Planning, Exploration and Research Institute, Ji’nan 250104, China
2
Inner Mongolia Huangtaolegai Coal Co., Ltd., Ordos 017000, China
3
College of Earth Science and Engineering, Shandong University of Science and Technology, Qingdao 266590, China
4
College of Energy and Mining Engineering, Shandong University of Science and Technology, Qingdao 266590, China
*
Author to whom correspondence should be addressed.
Water 2025, 17(12), 1826; https://doi.org/10.3390/w17121826
Submission received: 13 May 2025 / Revised: 9 June 2025 / Accepted: 13 June 2025 / Published: 19 June 2025
(This article belongs to the Topic Human Impact on Groundwater Environment, 2nd Edition)

Abstract

The Jurassic aquifer in Northwest China is the key aquifer for mine water filling, which is significant due to its loose structure, large porosity, strong rock permeability, and fracture development characteristics. In addition, the water richness in space is extremely uneven, and many coal mine roof water inrush events are closely related to it. A case of evaluation of water-richness of the roof sandstone in the 3-1 coal seam of the Bayangaole minefield was analyzed in depth, and the evaluation index system is established based on lithology and structural characteristics. Specifically, the evaluation indexes are under the influence of the influencing factors of lithology, the density of fault intersection endpoints, and the density of fault scale and the strength of folds as the influencing factors of structure. On this basis, the set pair analysis-variable fuzzy set coupling evaluation method is introduced to form a targeted water-rich evaluation model of a roof sandstone aquifer. By using the coupling method of set pair analysis and variable fuzzy set, a targeted evaluation model is formed to realize the organic integration of indicators. Through the comprehensive analysis of the relative zoning of water abundance and the data from the borehole pumping (drainage) test, the distribution of water abundance grade in the study area is clarified.

1. Introduction

In the process of coal mine production, mine water disaster is the main threat to coal mine production. Among them, the flood caused by the coal seam roof aquifer is a common form of disaster [1,2,3,4]. Coalfield areas in various periods in China are generally developed in clastic rock aquifers such as sandstone and conglomerate in coal-bearing strata. During the mining activities, the roof strata are prone to cracks. When such cracks are connected, they can form a water conduction path, prompting the water of the roof aquifer to flow into the mining area, causing sudden large-scale floods [5,6]. The aquifer in the fracture zone is directly filled with water, and its water abundance directly affects the storage and emission of roof water [7]. Under the background of mine water prevention and control work, it is an urgent challenge to predict and evaluate the water abundance of the coal seam roof aquifer reasonably and effectively. Thus, it is of practical guiding significance for mine safety production to evaluate the water abundance of the aquifer in the sandstone range of coal seam roofs.
At present, the evaluation methods of water abundance of coal seam roof aquifers in China are mainly divided into three categories [8]: First, based on the unit water inflow data, the classification is directly based on the ‘Coal Mine Water Prevention and Control Rules’. This method is the most accurate, but it requires a large number of hydrological borehole data to support it, and in the mining process, the number of boreholes required for pumping tests is limited and unevenly distributed [9]. The second is to use geophysical methods such as the transient electromagnetic method, high-resolution direct current method, and audio-frequency electric perspective method, but geophysical methods are often costly and cannot avoid the diversity of geophysical results [10,11,12]. The third is the multi-factor comprehensive analysis method. The analysis and evaluation of the water yield property of aquifers is the premise of water inrush prediction and prevention. There are many complex factors affecting the water yield property of aquifers. The degree of influence of one factor depends on its spatial distribution, regional hydrogeological conditions, and the distribution of other variables considered. Under different hydrogeological conditions, the degree of influence of the same factor is also different, and various factors interact with each other. Thus, it is not easy to establish a unified evaluation model [13,14,15,16].
In recent years, based on the traditional hydrogeological analysis framework, many scholars have systematically discussed the hydrogeological characteristics of water-filled rock strata by combining multiple methods, aiming to deeply understand the water-rich differences and their internal correlations under different hydrogeological backgrounds and physical fields. By comparing and complementing different hydrogeological and physical field characteristics, they used the multi-factor geoscience information superposition principle to improve prediction accuracy and comprehensiveness. In this context, a variety of technical methods have been comprehensively applied to the evaluation of the water richness of water-bearing strata, including but not limited to fuzzy clustering evaluation, fuzzy mathematics theory, multi-factor superposition analysis methods, and multi-physical property detection technology. Wu et al. [17] innovatively proposed a weight determination strategy combining the entropy weight coefficient method and principal component analysis method. They constructed a set of aquifer water abundance prediction models, which provided a new perspective for weight reorganization. Wu et al. [18] focused on key factors such as sandstone thickness, sand-mudstone combination characteristics, and structural development degree. They carried out detailed classification and zoning of aquifer water richness through cluster analysis, which further deepened the application of the fuzzy clustering evaluation method based on single-factor analysis. Han et al. [19] introduced the fuzzy analytic hierarchy process to determine the weight of each factor on the water richness of the aquifer. They applied the data management and spatial analysis functions of GIS to calculate and evaluate the water richness of the study area. Based on set pair analysis and the variable fuzzy set coupling method, Han et al. [20] constructed a water-rich evaluation model of the Zhiluo Formation aquifer. They comprehensively considered its water-richness from the perspective of lithology and structure. Yu et al. [21] used the AHP model to determine the weight of each factor, combined with Surfer‘s information fusion and data processing functions, analyzed the main control factors after normalization, established a water-rich evaluation model, and finally divided the aquifer into water-rich zones. With the help of the powerful spatial information processing ability of GIS, Wu et al. [14] quantitatively processed the graphic information of various geological elements, quantified the qualitative geological factors through the analytic hierarchy process (AHP), and calculated the influence weight of each factor on water abundance. Finally, combined with the spatial composite superposition function of GIS and the calculation results of AHP, the comprehensive evaluation of water richness is realized, and the evaluation results are presented in the form of intuitive maps.
Based on the above research, the application of a multi-factor comprehensive evaluation method under the condition of a complex index realizes the effective evaluation of the water-richness of roadway surrounding rock, and the subjective and objective coupling weighting method has become a hot topic in academia in recent years. In order to solve the limitation of a single evaluation method and combine the advantages of expert experience and objective law of data, this paper chooses the roof sandstone of No. 3-1 coal seam in Bayangaole Mine Field as the research object, focusing on the lithologic characteristics and structural level to screen the evaluation index of water abundance, and quantifies the influence intensity of lithologic characteristics on water abundance through the lithologic influence index. The set pair analysis and variable fuzzy set coupling method are used to determine the weight of each evaluation index from the subjective and objective dimensions. Then, the set pair analysis-variable fuzzy set coupling model is constructed to analyze and evaluate the water richness of the study area. In addition, this method is compared with the multi-source information fusion water-rich partition based on the entropy weight coefficient method to demonstrate the scientificity and effectiveness of the proposed method fully.

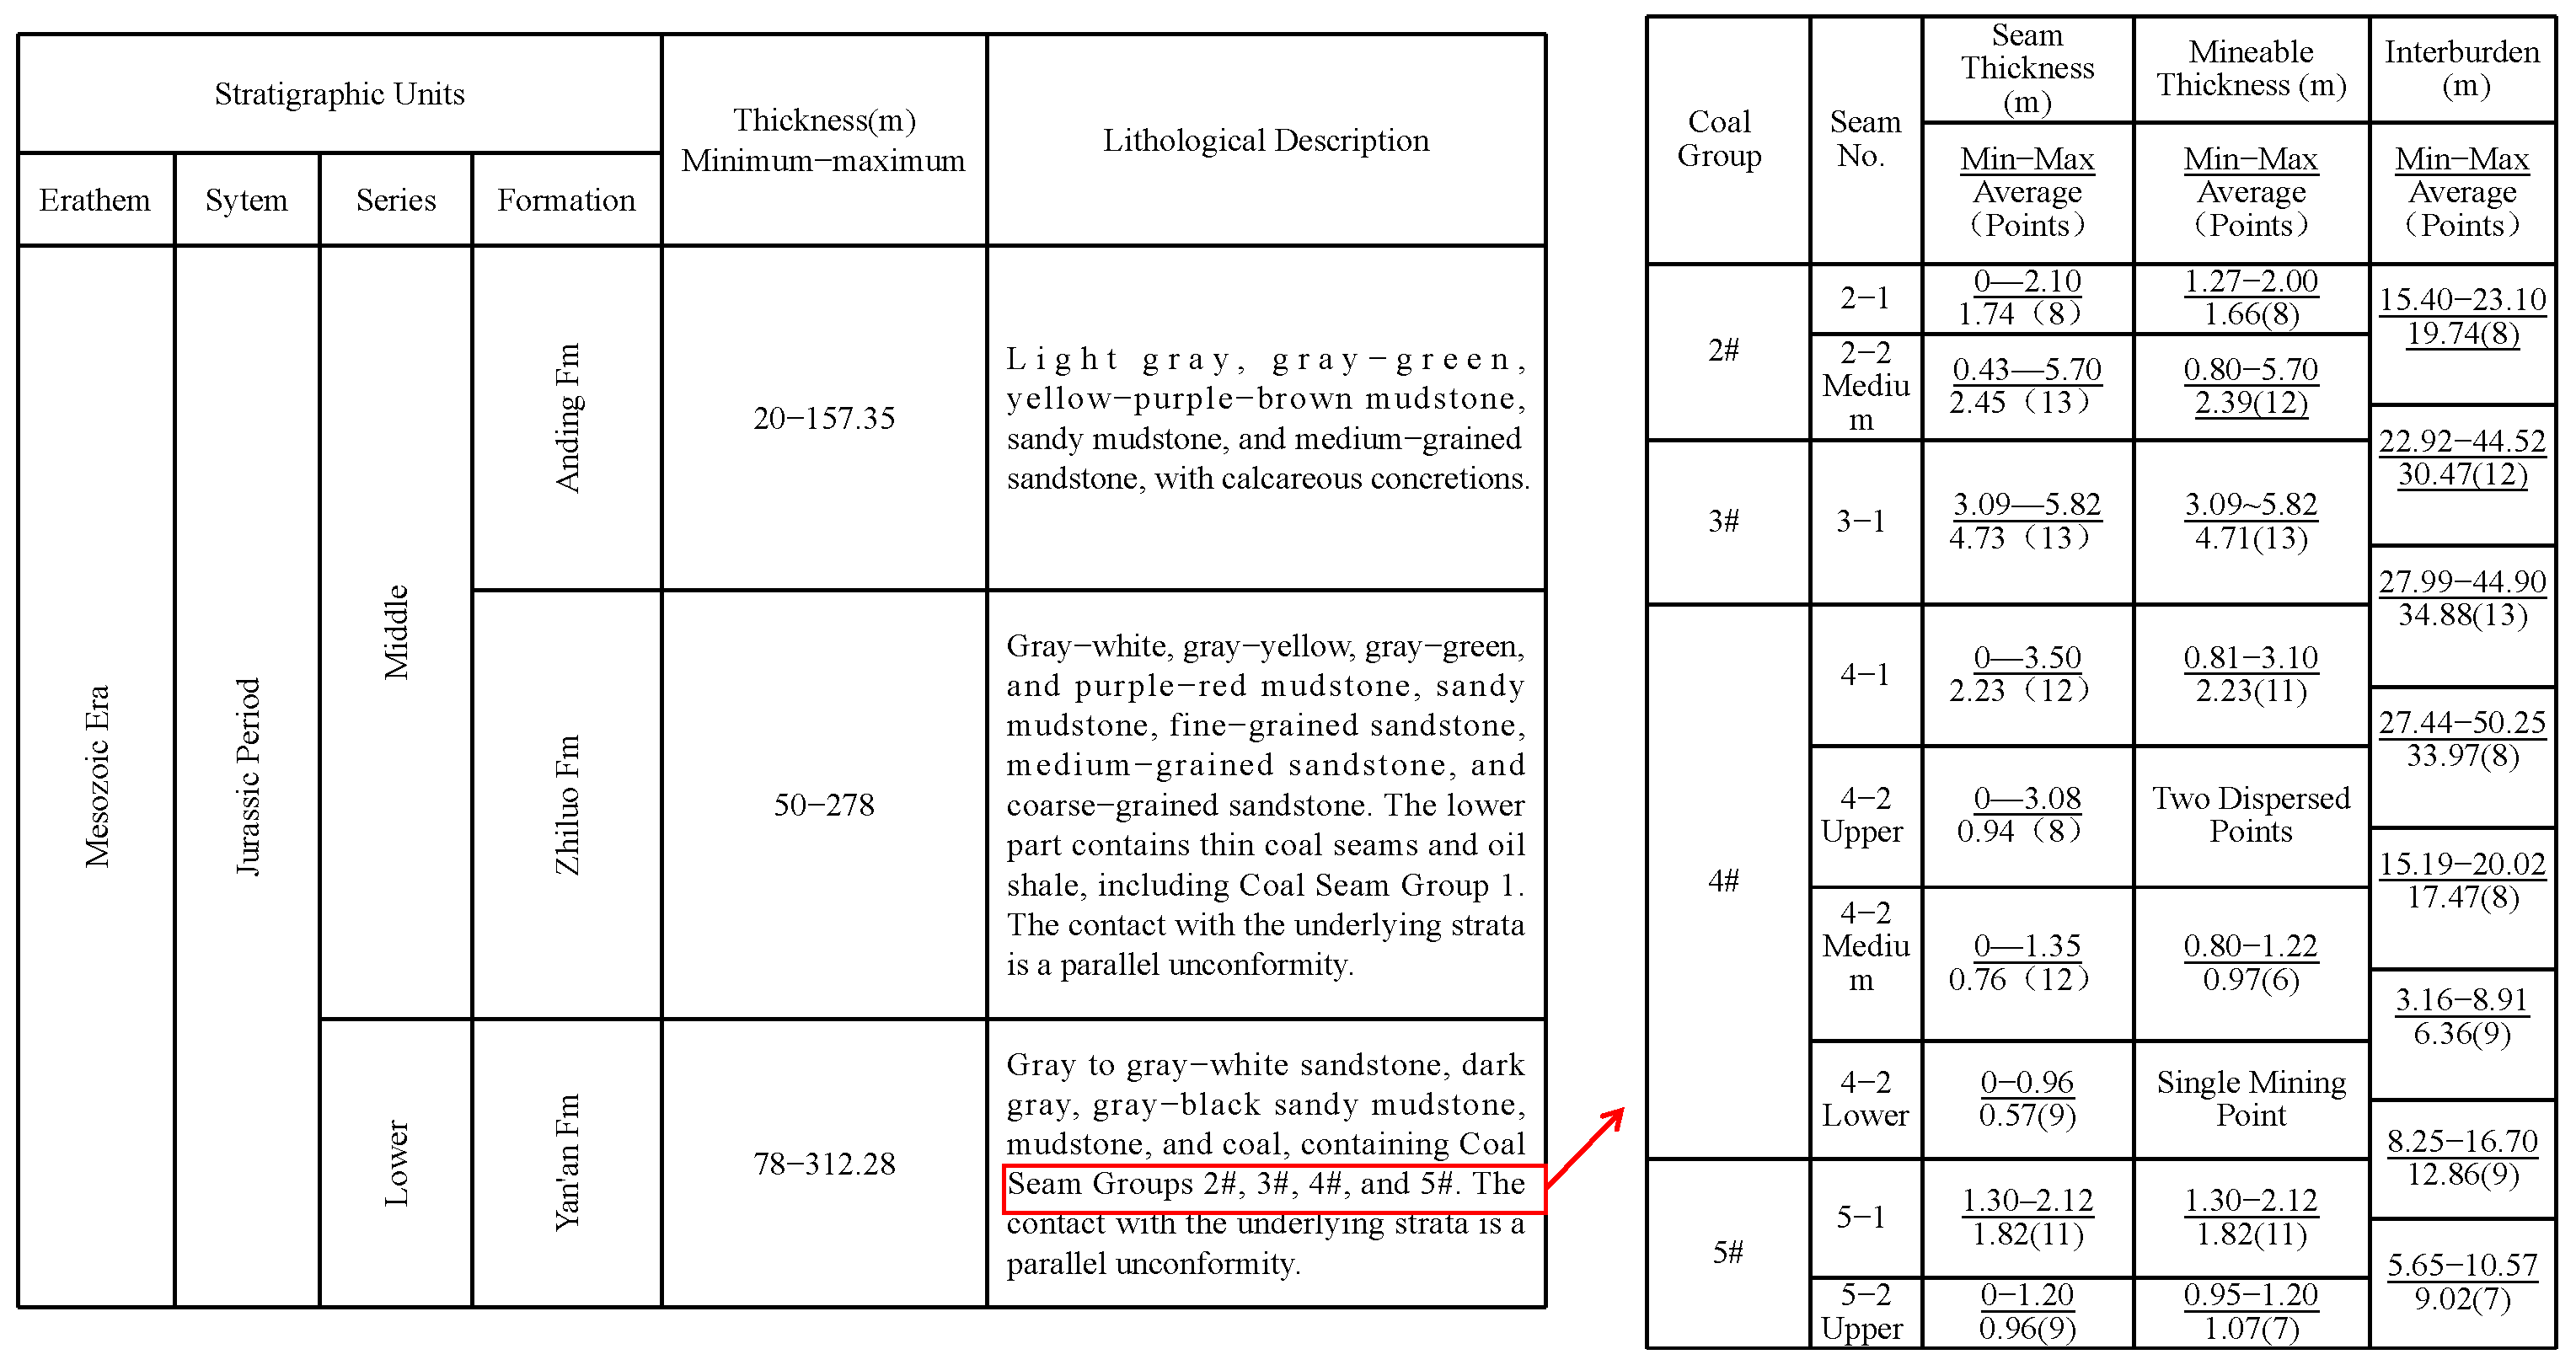
2. Geological Survey of the Study Area

The research area is located in Wushen Banner, Ordos City, Inner Mongolia Autonomous Region. The total area of Bayangaole Mine is 64.7019 km2, the geological resource reserves are 1.018 billion tons, the mine design production capacity is 4 million tons/year, and the shaft is developed. The strata in the mine are as follows from bottom to top: Upper Triassic Yanchang Formation (T3y), Middle-Lower Jurassic Yan‘an Formation (J1-2y), Middle Jurassic Zhiluo Formation (J2z), Anding Formation (J2a), Lower Baiya System Zhidan Group (K1zh), Quaternary Upper Pleistocene Malan Formation (Q3m), and Holocene (Q4). Among them, the Jurassic Yan‘an Formation is coal-bearing strata. There are up to 18 layers of coal in the minefield, and 9 layers are relatively stable and comparable. Among them, 7 main coal seams can be mined; that is, 3-1 coal seam is a stable coal seam that can be mined in the whole region, and 2-1, 2-2, 4-1, and 5-1 are relatively stable coal seams that can be mined in the whole region and most of them. There are two secondary minable coal seams: 4-2 middle and 5-2 upper coal seams are locally recoverable unstable coal seams; there are two layers of unminable coal seams, namely 4-2 upper and 4-2 lower coal seams (Figure 1).
The Bayangaole Mine, located in the Hujierte mining area of Wushen Banner, is an integral part of the hydrogeological unit within the Ordos Plateau region of the Inner Mongolia Autonomous Region. The regional hydrogeological conditions are influenced by a combination of factors, including climate, topography, lithology, geological structures, surface water bodies, neotectonic activities, and anthropogenic impacts. The mine experiences a dry to semi-arid continental plateau climate. The highest recorded temperature is +36.6 °C, while the lowest reaches −27.9 °C. Annual precipitation averages 396.0 mm, predominantly occurring during July, August, and September. The average annual evaporation rate is 2534.2 mm, which is approximately 5 to 12 times greater than the annual precipitation. Wind speeds typically range from 2.6 to 5.2 m/s, with maximum gusts reaching 24 m/s. The frost period spans from October to April of the following year, with a maximum frost depth recorded at 1.71 m over multiple years. The mean annual aridity index is 6.40, with an average humidity coefficient of 0.16. Sandstorm events can last up to 50 days per year. Hydrogeologically, since the Cambrian period, the sedimentary cover of the Ordos Basin is generally classified into three major aquifer systems: (1) The Cambrian–Ordovician carbonate karst aquifer system; (2) the Carboniferous–Jurassic clastic fractured and overlying loose porous aquifer system; and (3) the Cretaceous clastic porous-fractured aquifer system. The Bayangaole Mine is situated in the northern Ordos Basin, on the eastern flank of the Ordos Plateau, within the Ulanmulun River–Wuding River groundwater subsystem, specifically in the Subainaor–Hongjianaozi system, which is part of the Cretaceous clastic porous-fractured aquifer system.
As shown in Figure 2, the Bayangaole mine is located in the geotectonic division of the Dongsheng uplift area of the Ordos platform syncline in the North China platform. Its structural characteristics are generally characterized by a monoclinic structure that tends to the northwest, and the specific pointing angle is between 300 and 320°. The dip angle of the stratum is kept in the range of 1–3°. Although there is a certain degree of change in the direction and tendency of the stratum, the change range is relatively small. In the direction of the strike, a wide and gently undulating topography was observed. It is worth noting that no significant large-scale faults or fold structures were identified in this area.
The 3-1 coal seam of the main coal seam is stable in mine. There is no large geological structure found in the mine. The dip angle of the stratum is gentle, the buried depth of the coal seam is large, and there is no coal seam outcrop on the surface. Through the analysis of geological and hydrogeological conditions in the study area and combined with the exposed conditions of underground drainage boreholes, the buried depth of the 3-1 coal floor is 610.62 m~626.17 m, and the floor elevation is about +650.76~+660.74 m. The roof of 3-1 coal is siltstone and mudstone, and the floor is siltstone and mudstone. The elevation of the 2-1 coal floor is +732.46~+739.87 m, and the distance from the 3-1 coal roof is 73.86~79.33 m. The roof of 2-1 coal is medium-grained sandstone, fine-grained sandstone, and sandy mudstone, and the floor is siltstone, sandy mudstone, and mudstone. The development height of the 3-1 coal roof caving zone is 38.7 m, and the development height of the water-conducting fracture zone is 126 m. The distance between the 3-1 coal roof and the bottom of the Zhiluo Formation is about 90 m. The height of the ‘two zones’ has developed to the lower part of the Zhiluo Formation, and it is determined that the Zhiluo Formation aquifer is the direct water-filled aquifer for the mining of the 3-1 coal mine. Considering the hydrogeological conditions of the mine, there may be an aquifuge of siltstone, mudstone, or sandy mudstone at the bottom of the Zhiluo Formation or the top of the Yan’an Formation. The aquifuge in the mine is relatively continuous and relatively stable, which is suitable for roof aquifuge in coal seam mining. However, due to the high influence of the water-conducting fracture zone during the mining of the 3-1 coal seam, there is a possible risk of caving in the roof aquiclude, which not only affects the hydraulic connection between the aquifers but also has a significant impact on the prediction of mine water inflow and mining activities. This study reveals the existence of aquifers in the third section of the Yan’an Formation and sandstone aquifers in the Zhiluo Formation in the roof sandstone of the 3-1 coal seam, and their hydrological characteristics are crucial to ensure the safe mining of the 3-1 coal seam.

3. Water-Rich Control Factors

Aquifer water abundance refers to the ability of rock strata to give water, which is mainly determined by the recharge, storage, and water conductivity of the aquifer. Sedimentation and diagenesis affect the effective porosity of sandstone, and tectonism affects the development of fissures, thus determining the water abundance of the aquifer [22,23]. Based on the change of each factor with the spatial domain and its influence on the water abundance of the aquifer, combined with the hydrogeological characteristics of the study area, this paper selects three aspects of lithology and rock structure and fault and fold and constructs a more comprehensive evaluation index system for the water abundance of the roof sandstone aquifer of the 3-1 coal seam in the Bayangaole mine field.

3.1. Lithology and Rock Structure

In order to evaluate the water-richness of the sandstone aquifer in the 3-1 coal roof more effectively, this paper selects three evaluation factors, such as sandstone lithology coefficient (P), sand-mud interaction layer (Nsm), and lithology equivalent thickness (Meh), and constructs a ‘lithology’-influenced index (LII) to quantitatively describe the lithology and structural combination characteristics of the coal roof and its influence on water-richness of the aquifer [20,24].
(1) Sandstone lithology coefficient (P)
The sandstone content is defined as the ratio of the cumulative thickness of coarse, medium, and fine sandstones to the total thickness of the strata in the study area, which reveals the relative abundance and water permeability of sandstone components in the rock structure in this area. The larger the ratio is, the higher the proportion of rock sandstone in the area is, and the stronger the water richness is.
(2) Sand-mud interbedded layers (Nsm)
The number of sand-mud alternating layers is defined as the frequency of alternating occurrence of sandstone layers and mudstone layers in specific geological layers, which significantly affects the permeability of aquifers. The higher number of sand-mud interbedded layers usually indicates a stronger water isolation performance; that is, the mobility of water in this layer is limited.
(3) Lithologic equivalent thickness (Meh)
Sandstone thickness, as one of the key parameters to evaluate the water-rich strength of aquifers, is positively correlated with water-bearing capacity; that is, the thicker the sandstone layer, the more significant its water-richness. This paper focuses on sandstones of different grain sizes (coarse, medium, and fine). By comprehensively analyzing their porosity and permeability, the concept of sandstone equivalent thickness (Meh) is introduced. In order to realize the conversion from the actual thickness of sandstone to the equivalent thickness, we use the porosity ratio as the key conversion coefficient. The calculation formula is as follows:
M e h = M c + k 1 M m + k 2 M f
where, Mc, Mm, and Mf are the true thicknesses of coarse sandstone, medium sandstone, and fine sandstone, respectively, m; k1 is the equivalent coefficient of medium sandstone thickness conversion; k2 is the equivalent coefficient of fine sandstone thickness conversion.
According to the SY/T6385-2019 standard, the porosity of sandstone with different grain sizes in the roof sandstone of the coal seam in the study area was quantitatively evaluated. The specific data are shown in Table 1. Using coarse sandstone as a reference (set as reference value 1), the equivalent conversion coefficient of medium sandstone and fine sandstone is derived. According to the analysis, the average porosity of coarse sandstone, medium sandstone, and fine sandstone is 18.92%, 15.13%, and 11.35%, respectively. Based on this data, the calculated equivalent conversion coefficients are k1 = 0.8 and k2 = 0.6.
Among the above three indices, there is a positive correlation between sandstone lithology coefficient (P) and sandstone equivalent thickness and water richness, and there is a negative correlation between sand-mud interbedded layers and water richness. Considering the influence of each index, the lithology influence index (Lid) is established.
L i d = M e h P N s m
The lithology influence index (Lid) is used as a quantitative evaluation index of the influence of lithology on the water abundance of the aquifer, and the relationship between the influencing factors is established, which is convenient for analysis and calculation.

3.2. Structure

Geological structure is an important index affecting the water abundance of the roof sandstone aquifer. At present, there are many research results that directly determine the water abundance of aquifers by affecting lithology, fracture development, structural deformation, and other factors.

3.2.1. Faults

From the three aspects of rock mass integrity, fault scale, and fault complexity, two evaluation indices of fault endpoint density (DF) and fault scale density (DS) are selected to evaluate the fault quantitatively.
The study area was divided into 752 grid units using 300 m × 300 m square, and the following indicators were statistically analyzed. The grid division is shown in Figure 3.
(1) Fault intersection endpoint density (DF)
The density of fault intersection endpoints refers to the total number of fault intersection points and endpoints per unit area, which is expressed in Equation (3). The intersection of the fault is an area where the ground stress is concentrated. At the same time, at the intersection of the fault, the integrity of the rock mass is destroyed, which enhances the permeability and water storage space of the sandstone, thus improving the potential of groundwater storage. The greater the number of fault intersections per unit area, the stronger the water-rich capacity.
D F = N 1 + N E S
where DF is the density of fault intersections in the grid unit, number /km2; n1 and NE are the number of intersection points and end points of faults in the grid unit, respectively. S is the area of the unit grid unit, taking 0.09 km2.
(2) Fault scale density (DS)
The fault scale density refers to the sum of the product of the extension length of all faults per unit area and its drop, which is expressed by Equation (4). This index comprehensively considers the fault drop, fault extension length, and number of faults and can reflect the scale of faults and the complexity of their development to a certain extent. In the area with a larger fault scale and denser development, more water storage space will be generated, which greatly enhances the water richness.
D S = 1 S i = 1 n H i l i
where, DS is the fault scale density; n is the total number of faults in the grid unit; Hi is the drop of the ith fault in the grid element, m; li is the extension length of the ith fault in the grid element, m.

3.2.2. Folds

Because the dip angle of the coal seam in the study area is gentle and the fold extension span is large, the horizontal fold strength is selected as the fold axis index, and the horizontal fold strength index describes the horizontal complexity of the fold. Equation (5) considers the horizontal projection of the wrinkle length on the grid boundary and the actual length of the wrinkle.
H F = d 0 d 1 d 1 × 100 %
where, HF-fold strength index in horizontal direction; d0—the actual length of the fold in the grid cell; m; d1—The projection length of the fold in the horizontal direction, m.

4. Set Pair Analysis—Variable Fuzzy Set Coupling Evaluation Model

4.1. Set Pair Analysis

Set Pair Analysis is a theoretical tool for the systematic analysis of uncertainties caused by ambiguity, randomness, mediation, and incomplete information [25,26]. The core of this method is to quantify and evaluate the inherent uncertainty in the objective world and regard it as a unified whole of the same degree, different degree, and opposite degree (i.e., the ‘same, other, and opposite’ system) and realize dialectical analysis and mathematical processing through the use of connection degree. At present, set pair analysis has gradually become an important research focus to solve the problem of uncertain systems and has shown wide application potential and value in many fields, such as water resources management, water environment protection, physics, and mathematics [27,28,29].
In a specific problem category, a pair of sets is constructed. This process involves the combination of two related sets. The correlation between these two sets can be explained by the quantitative evaluation of the three dimensions of identity, difference, and opposition in the deterministic and uncertain systems. The calculation formula of the connection degree μ is as follows:
μ = S N + F N i + R N j = a + b i + c j
where, S is the same characteristic number of two sets; N is the total characteristic number of the set; S/N is the same degree, denoted by a; R is the opposite characteristic number; R/N is the opposite degree, denoted by c; F = NSR, F/N is the degree of difference, expressed as b; where a, b, c ∈ [0, 1], and a + b + c = 1; i is the coefficient of difference, and j is the coefficient of oppositeness.

4.2. Variable Fuzzy Set Theory

Chen, based on the theoretical framework of dialectics of nature on the contradiction of motion, combined with fuzzy set theory, creatively constructed the concepts of relative membership degree and relative membership function, thus forming variable fuzzy set theory [29,30,31]. The core of this theory lies in two quantitative indicators—relative membership and relative difference. In the theoretical system of variable fuzzy sets, relative membership degree and relative difference degree play a key role, respectively, and their definitions are as follows: For a fuzzy concept A on the universe U, for any element u, uU in U, at any point on the continuous number axis of the relative membership function, the relative membership degree with attractive property A is expressed as μA(u), and the relative membership degree with repulsive property Ac is expressed as 0 ≤ μA(u) ≤ 1, 0 ≤ μ A c ( u ) ≤ 1, μA(u) + μ A c ( u ) = 1. DA(u) is defined as the relative difference between u and A. This definition aims to quantitatively evaluate the degree of difference shown by the element u in the relationship with A, thus deepening the understanding of the attribute cognition of the elements in the fuzzy set. Among them
D A ( u ) = μ A ( u ) μ A c ( u )

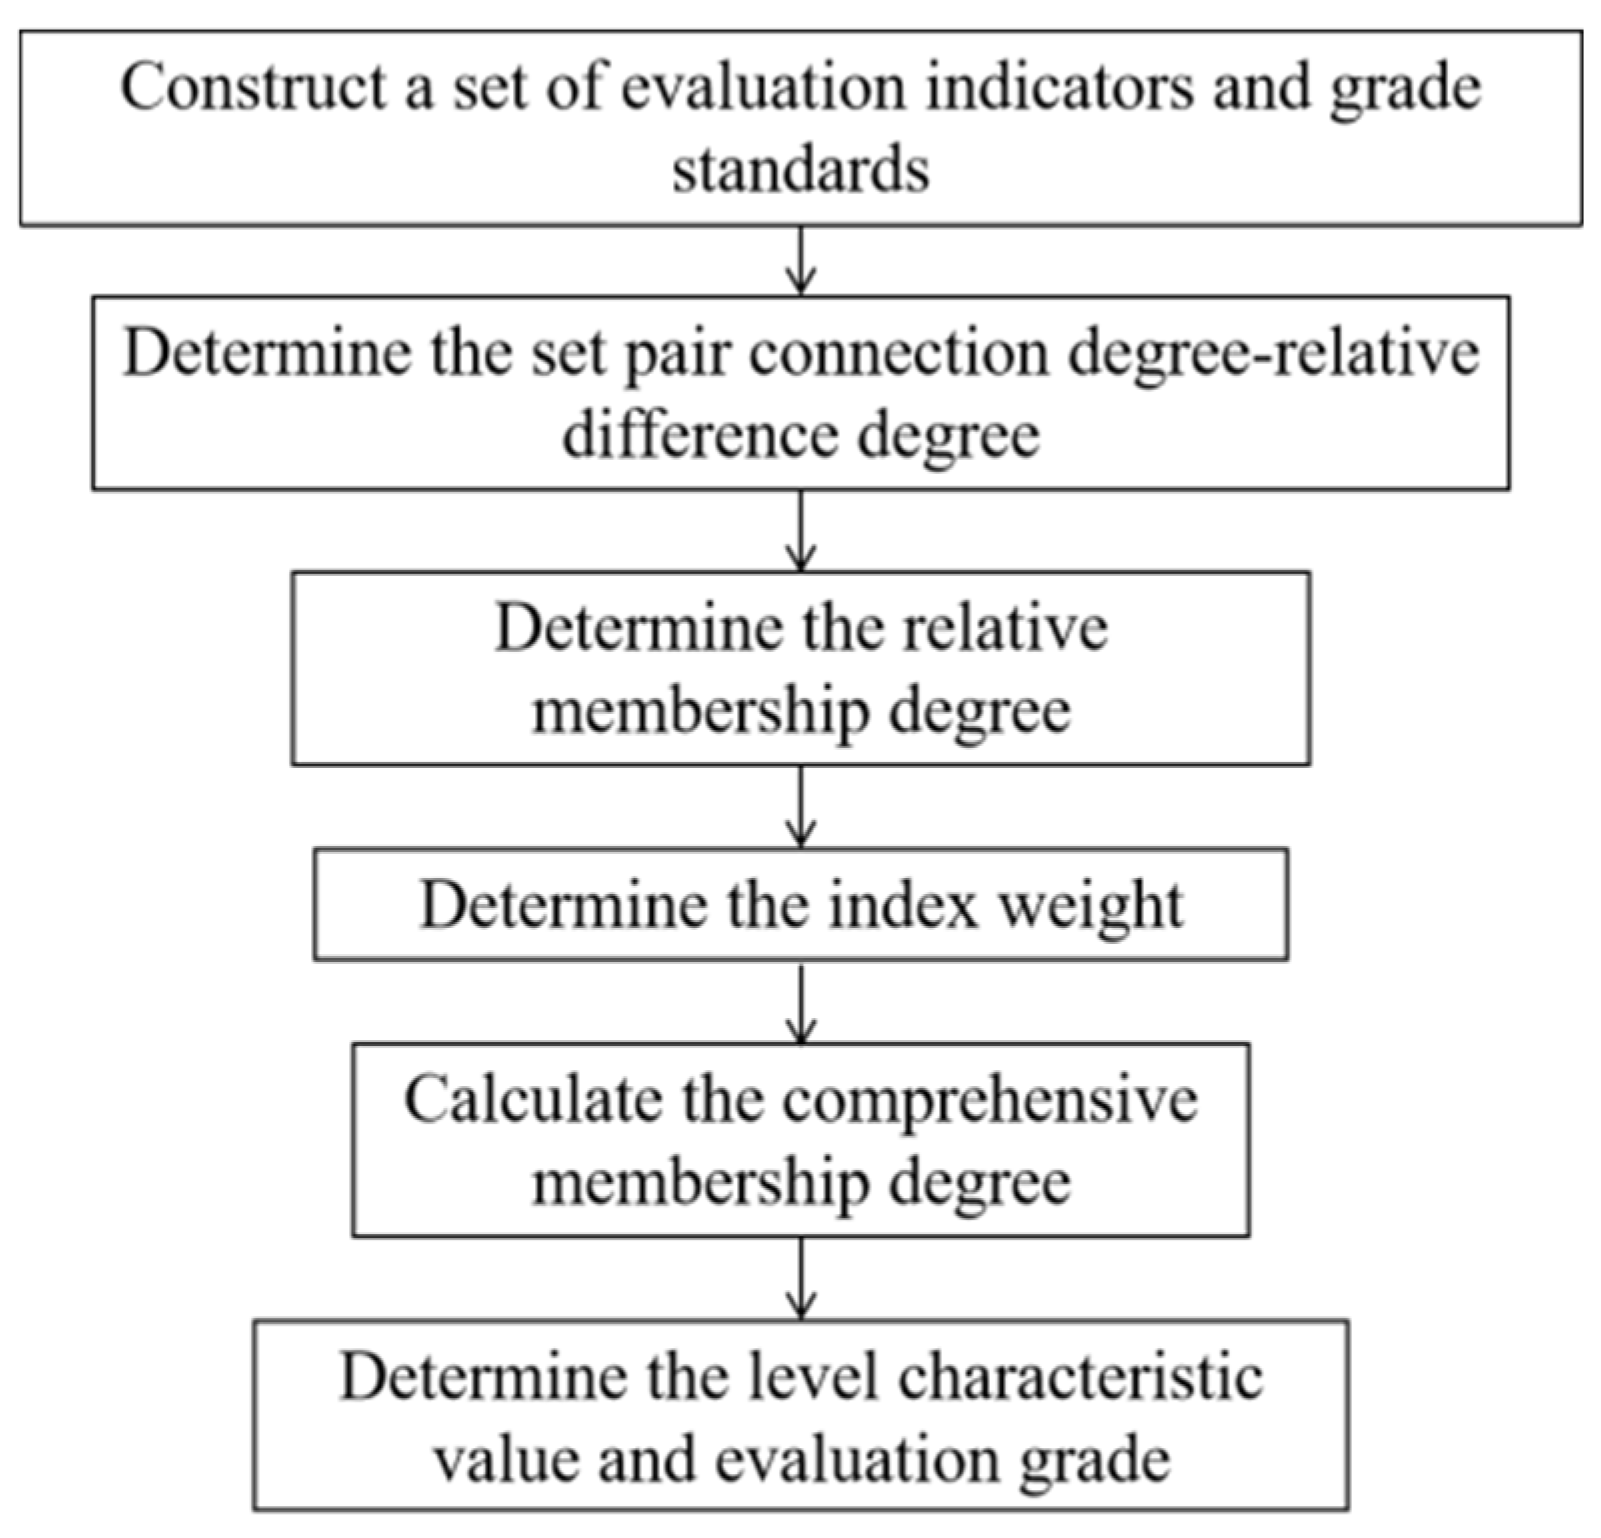
4.3. Set Pair Analysis—Variable Fuzzy Set Coupling Evaluation Method

This paper presents an integrated approach that combines Set Pair Analysis (SPA) with the Variable Fuzzy Set (VFS) coupling evaluation method. SPA offers a structured framework for analyzing the identity, difference, and opposition relationships that commonly arise in complex systems. It provides a foundation for systematically addressing dualities and contradictions among influencing factors. The VFS coupling evaluation further enriches this framework by introducing fuzzy logic and adaptable parameters, thereby enhancing the flexibility and responsiveness of the evaluation process.
At the core of SPA is the identification and modeling of opposing relationships inherent in the evaluation problem. By constructing a set pair model, the method effectively illustrates the relative strengths and weaknesses among different factors, offering a clear and comprehensive basis for subsequent decision-making. The VFS method complements this by overcoming the limitations of traditional fuzzy set theory, particularly its inability to accommodate dynamic and uncertain evaluation conditions. It allows membership functions to adjust in response to changes in contextual variables, thereby more accurately capturing the uncertainty and complexity of real-world evaluation scenarios. This adaptability enhances both the accuracy and reliability of the results [32,33]. The integration of SPA and VFS forms a comprehensive evaluation system that not only captures opposing relationships but also handles uncertainty in a flexible and rigorous manner. This coupling approach proves particularly advantageous in fields such as complex system assessment, risk analysis, and decision support. By using the SPAs core metric—the connection degree—as the difference degree in the VFS model; the method minimizes information loss and produces more robust and insightful evaluation outcomes.
In summary, the combined use of SPA and the variable fuzzy set coupling evaluation method enhances the systematicness, adaptability, and precision of the evaluation process, making it especially suitable for complex and uncertain decision-making environments. The detailed procedure of this method is illustrated in Figure 4.
(1) Establish an evaluation index system and grade standard. A set pair A = (Q, W) is formed by the set Q composed of the evaluation value of each influencing factor index and the evaluation standard W of each index, where
Q = ( q 11 , q 12 , q 22 , , q n 2 , q 1 n , q 2 n , , q m n )         W = ( X 01 , X 02 , , X 0 n , X 11 , X 12 , , X 1 n , , X m 1 , X m 2 , , X m n )
where, qmn is the m-th evaluation value under the n-th index; Xmn is the boundary value of the evaluation standard corresponding to the n-th evaluation index.
(2) The difference degree in set pair analysis is divided into excellent and bad, and the opposition degree is subdivided into excellent and bad, and the multiple connection degree is obtained:
u = a + ( b 1 + b 2 ) i + ( c 1 + c 2 ) j = a + b 1 i + + b 2 i + c 1 j + + c 2 j
where
a + b 1 + b 2 + c 1 + c 2 = 1 ; i + [ 0 , 1 ] ;   i [ 1 , 0 ] ;   j + = { 0 , 1 } ;   j = 1
For example, it is assumed that there are five evaluation levels, and the third level is the optimal level. According to Equation (8), when the index evaluation value qn is within the range of the third level, it indicates that the index evaluation value has an identity, a = 1, b1 = b2 = c1 = c2 = 0; when the index evaluation value qn is within the range of adjacent grades, that is, within the second and fourth grades, the index evaluation value can be divided into excellent and inferior. The superior side is regarded as excellent, and its value is recorded as b1. The closer qn is to the third evaluation grade, the larger a is and the smaller b1 is. Far away from the superior side is regarded as inferior, and its value is recorded as b2. The farther away from the third level, the smaller a is and the larger b1 is. When the index evaluation value qn is within the interval of the interval, that is, within the first and fifth grades, the index evaluation value can be divided into superior and inferior. At this time, the superior side is regarded as superior and inferior, and its value is recorded as c1. The closer the qn is to the third evaluation grade, the larger a and b1, and the smaller c1; far away from the superior side is considered to be inferior, and its value is recorded as c2, a, b2 are smaller, and c2 is larger.
The evaluation model of water richness of sandstone aquifer in coal seam roof is the smaller, the better [34,35]; that is, the smaller the index evaluation value, the weaker the water richness. The single index connection μkn between the evaluation value qn and the evaluation grade k of the water-rich influencing factor index is established as follows. In this paper, according to the actual situation of the model and the principle of equal distribution of the difference coefficient and the opposition coefficient in the analysis theory, i+ = 0.5, i = −0.5; at the same time, refer to the special value method of coefficient, select j+ =0, j = −1. The calculation formula is
μ 1 n = 1                 q n X 1 n q n 1 2 q n X 1 n q n         q n [ X 1 n , X 2 n ] X 1 n q n 1 2 q 2 n X 1 n q n q n X 2 n q n q n [ X 2 n , X 5 n ]     μ 2 n = X 2 n X 1 n X 2 n q n + 1 2   X 1 n q n X 2 n q n         q n [ X 0 n , X 1 n ) 1                   q n [ X 1 n , X 2 n ) X 2 n X 1 n q n X 1 n 1 2 q n X 2 n q n X 1 n          q n [ X 2 n , X 3 n ) X 2 n X 1 n q n X 1 n 1 2 X 3 n X 2 n q n X 1 n q n X 3 n q n X 1 n q n [ X 3 n , X 5 n ] μ 3 n = X 3 n X 2 n X 3 n q n + 1 2   X 3 n X 1 n X 3 n q n          q n [ X 0 n , X 1 n ) X 3 n X 2 n X 3 n q n + 1 2   X 2 n q n X 3 n q n          q n [ X 1 n , X 2 n ) 1                    q n [ X 2 n , X 3 n ) X 3 n X 2 n q n X 2 n 1 2 q n X 3 n q n X 2 n          q n [ X 3 n , X 4 n ) X 3 n X 2 n q n X 2 n 1 2 X 4 n X 3 n q n X 2 n q n X 4 n q n X 2 n q n [ X 4 n , X 5 n ] μ 4 n = X 4 n X 3 n X 4 n q n + 1 2   X 3 n X 2 n X 4 n q n          q n [ X 0 n , X 2 n ) X 4 n X 3 n X 4 n q n + 1 2   X 3 n q n X 4 n q n          q n [ X 2 n , X 3 n ) 1                    q n [ X 3 n , X 4 n ) X 4 n X 3 n q n X 3 n 1 2 q n X 4 n q n X 3 n          q n [ X 4 n , X 5 n ) μ 5 n = X 5 n X 4 n X 5 n q n + 1 2   X 4 n X 3 n X 5 n q n + X 3 n q n X 5 n q n          q n [ X 0 n , X 3 n ) X 5 n X 4 n X 5 n q n + 1 2   X 4 n q n X 5 n q n          q n [ X 3 n , X 4 n ) 1                    q n [ X 4 n , X 5 n )
where μkn is the degree of connection between the evaluation value under the nth evaluation index and the k evaluation grade.
It can be seen from the calculation that the closer μkn is to 1, the higher the consistency between the index evaluation value and the evaluation grade k, the stronger the ‘same’ relationship between the two, and vice versa.
(3) Determine the relative membership. Using the above-mentioned relative difference degree of variable fuzzy sets, it can be seen from the variable fuzzy set evaluation theory that the relative membership degree of the index evaluation value belonging to the fuzzy evaluation grade k is
η k n = 1 + μ k n 2
(4) Determine the index weight. In this paper, the entropy weight method is used to assign the weight of each index. The basic idea is to determine the objective weight according to the size of the index variability. The greater the degree of variation, the smaller the entropy value, and the greater the weight. The specific steps are as follows:
① In order to make the data more comparable and objective, the data of each evaluation index are standardized, and the range standardization formula is adopted in this paper.
q m n = q m n q n min q n max q n min
In the formula, qmn is the result value of the mth evaluation standard corresponding to the nth evaluation index; qnmin and qnmax are the minimum and maximum values under the nth evaluation index, respectively.
② Calculate the information entropy of each index. According to the definition of information entropy in information theory, the entropy value of a set of data are
H n = 1 l n k n = 1 k z m n ln z m n z m n = y m n / n = 1 k y m n   ( m = 1 , 2 , , M ; n = 1 , 2 , , k )
In the formula, Hn is the entropy of the nth index; zmn is the proportion of the index value of the mth item under the nth index; ymn is the index value of the mth item under the nth index.
③ Determine the weight of each index.
According to the calculation formula of information entropy, the information entropy of each index is calculated as H1, H2, …, Hk. The weight of each index is calculated by information entropy:
w n = ( 1 H n ) / n = 1 k ( 1 H n )
(5) Calculate the comprehensive membership degree.
v k = F ( w n , η k n ) = 1 + n = 1 N [ w n ( 1 η k n ) ] p n = 1 N ( w n η k n ) p a p 1
Among them, α is the optimization criterion parameter, α = 1 is the least squares criterion, and α = 2 is the least squares criterion; p is the distance parameter, p = 1 is the Hamming distance, and p = 2 is the Euclidean distance. α and p are collectively referred to as variable model parameters, and there are usually four combinations: ① α = 1, p = 1; ② α = 1, p = 2; ③ α = 2, p = 1; ④ α = 2, p = 2.
(6) Determine the level of characteristic value and evaluation grade. The relationship between the variable fuzzy recognition models under the four parameter combinations is an important feature of the variable fuzzy recognition method. For each evaluation index, four groups of comprehensive membership degree vectors can be calculated by four different combination types of variable model parameters. By using Equation (16), the four groups of comprehensive membership degree vectors are normalized, and the comprehensive membership degree vector Vk under any evaluation point can be obtained:
V k = v k / k = 1 5 v k
Finally, using the cumulative sum of the product of the comprehensive membership vector V and the corresponding evaluation grade, the characteristic value H of the water-rich level of the aquifer to be evaluated under the four model parameters is obtained, and the stability of the distinctive value of the level is analyzed. Finally, the water-rich level of the aquifer is determined.
H = k = 1 K ( V k k )

5. Evaluation of Water Abundance of Roof Sandstone Aquifer in Bayangaole 3-1 Coal Field

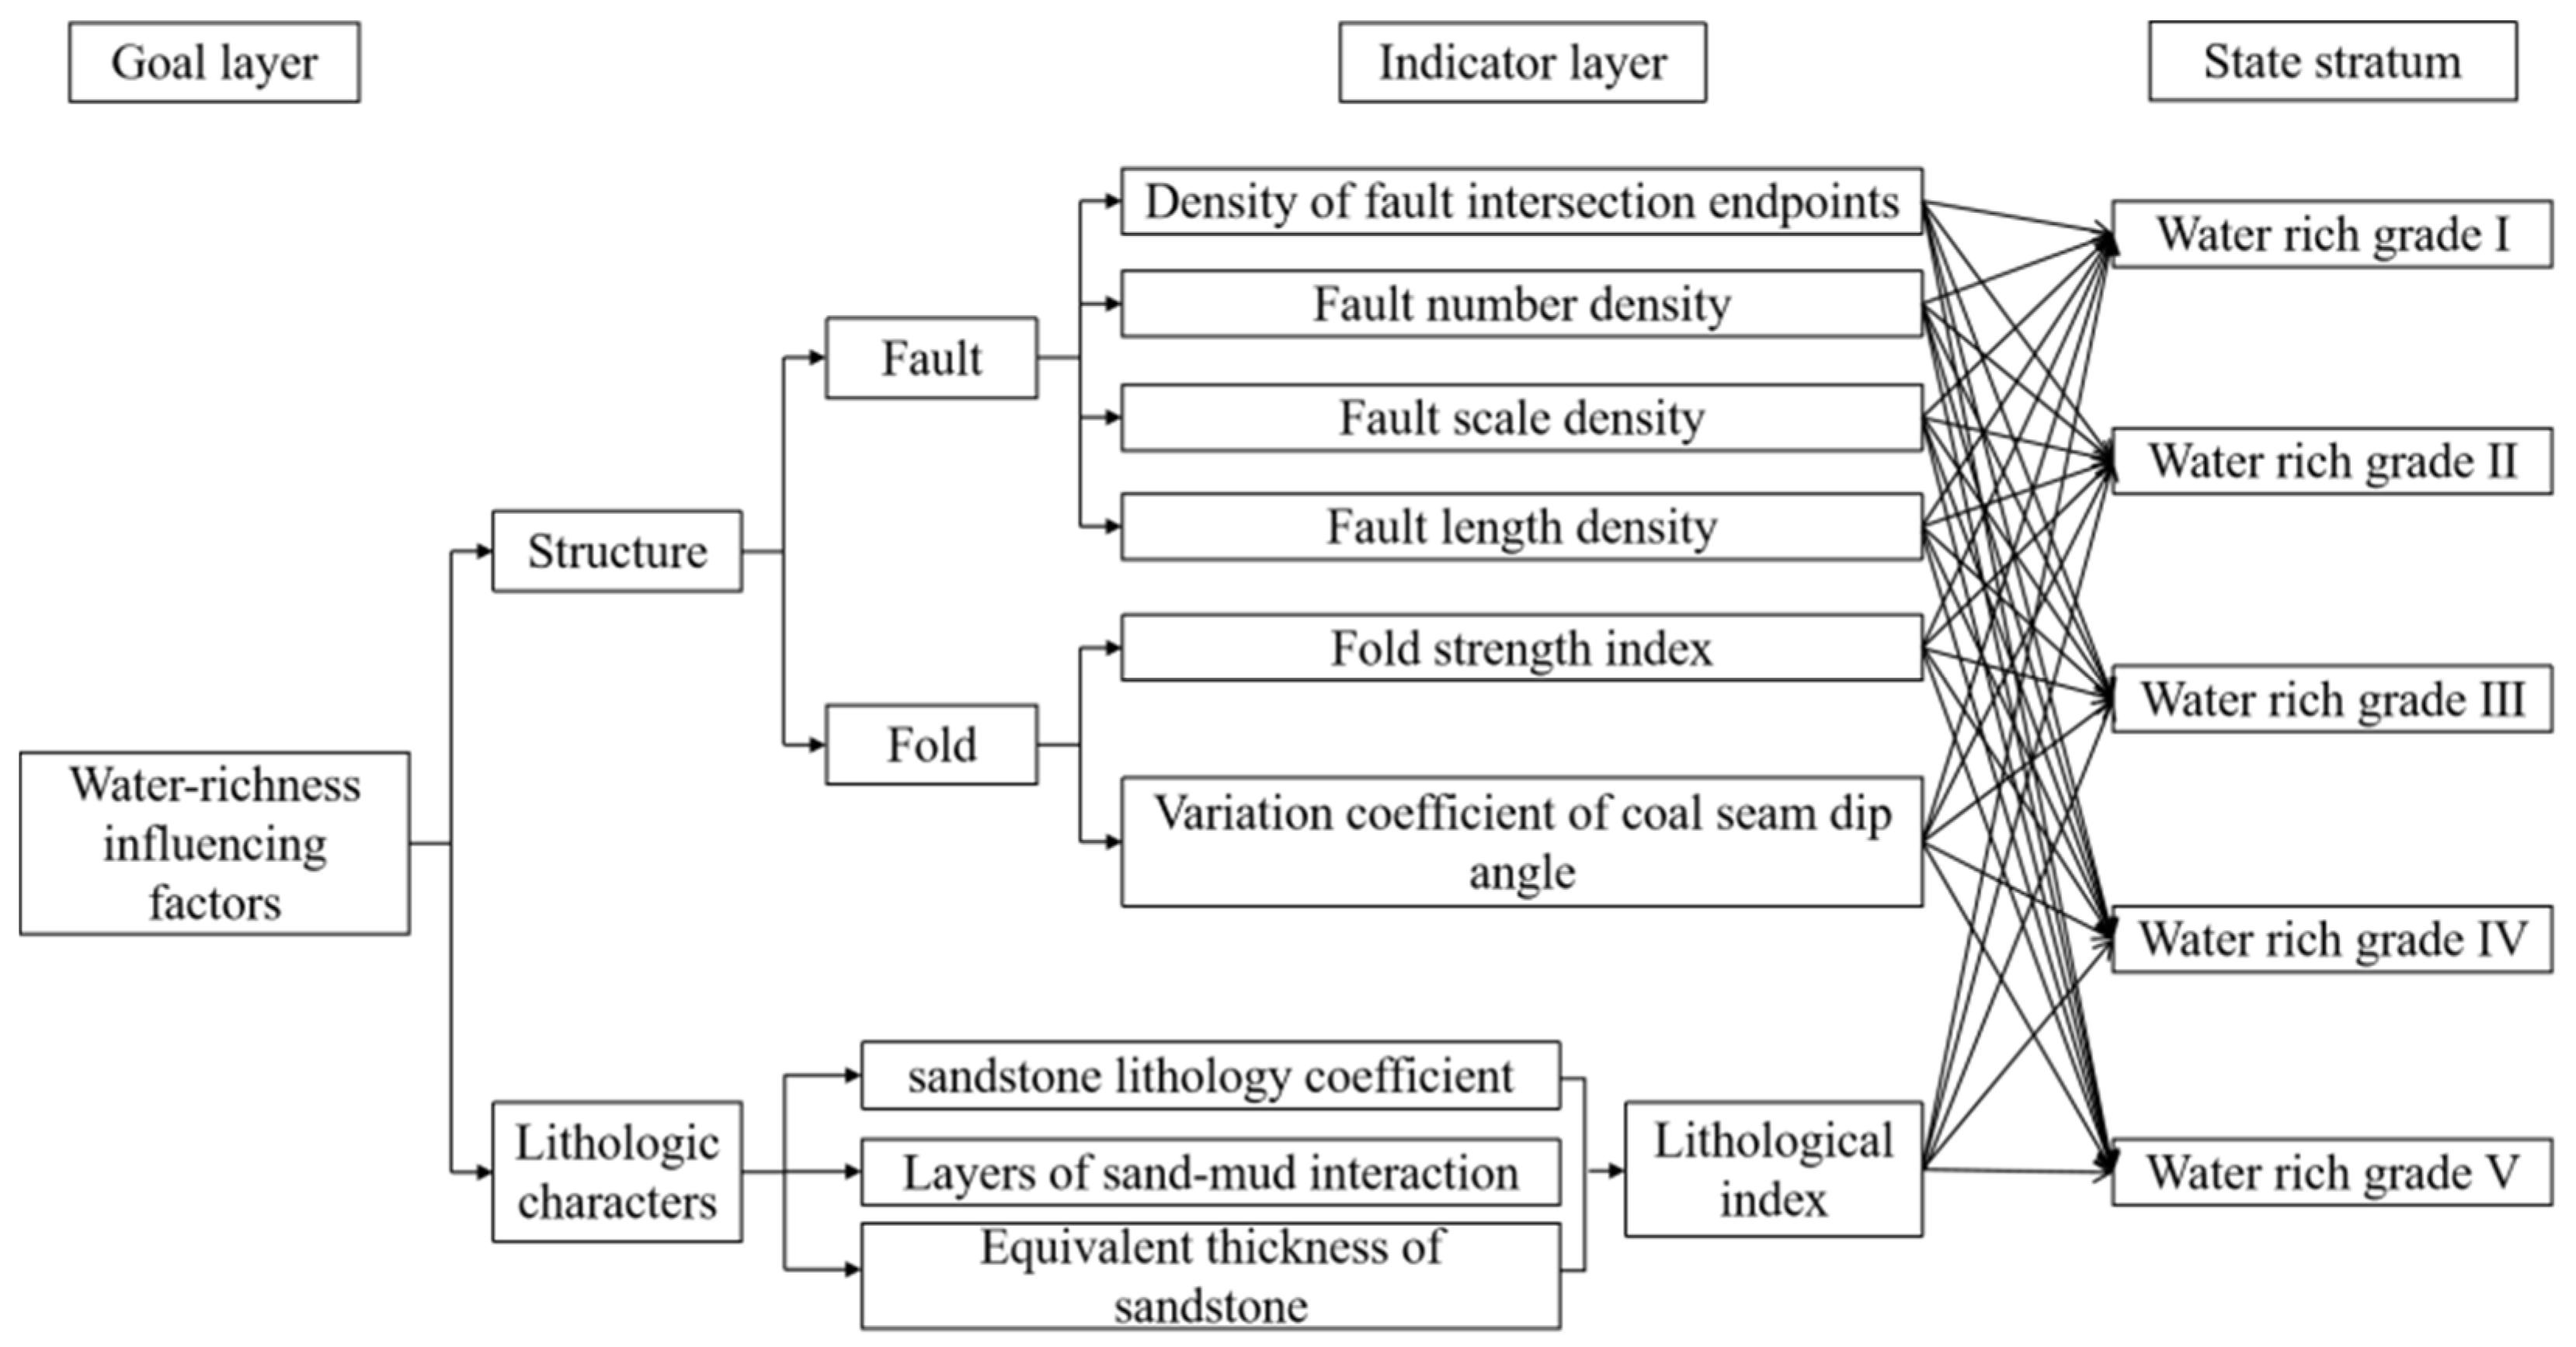
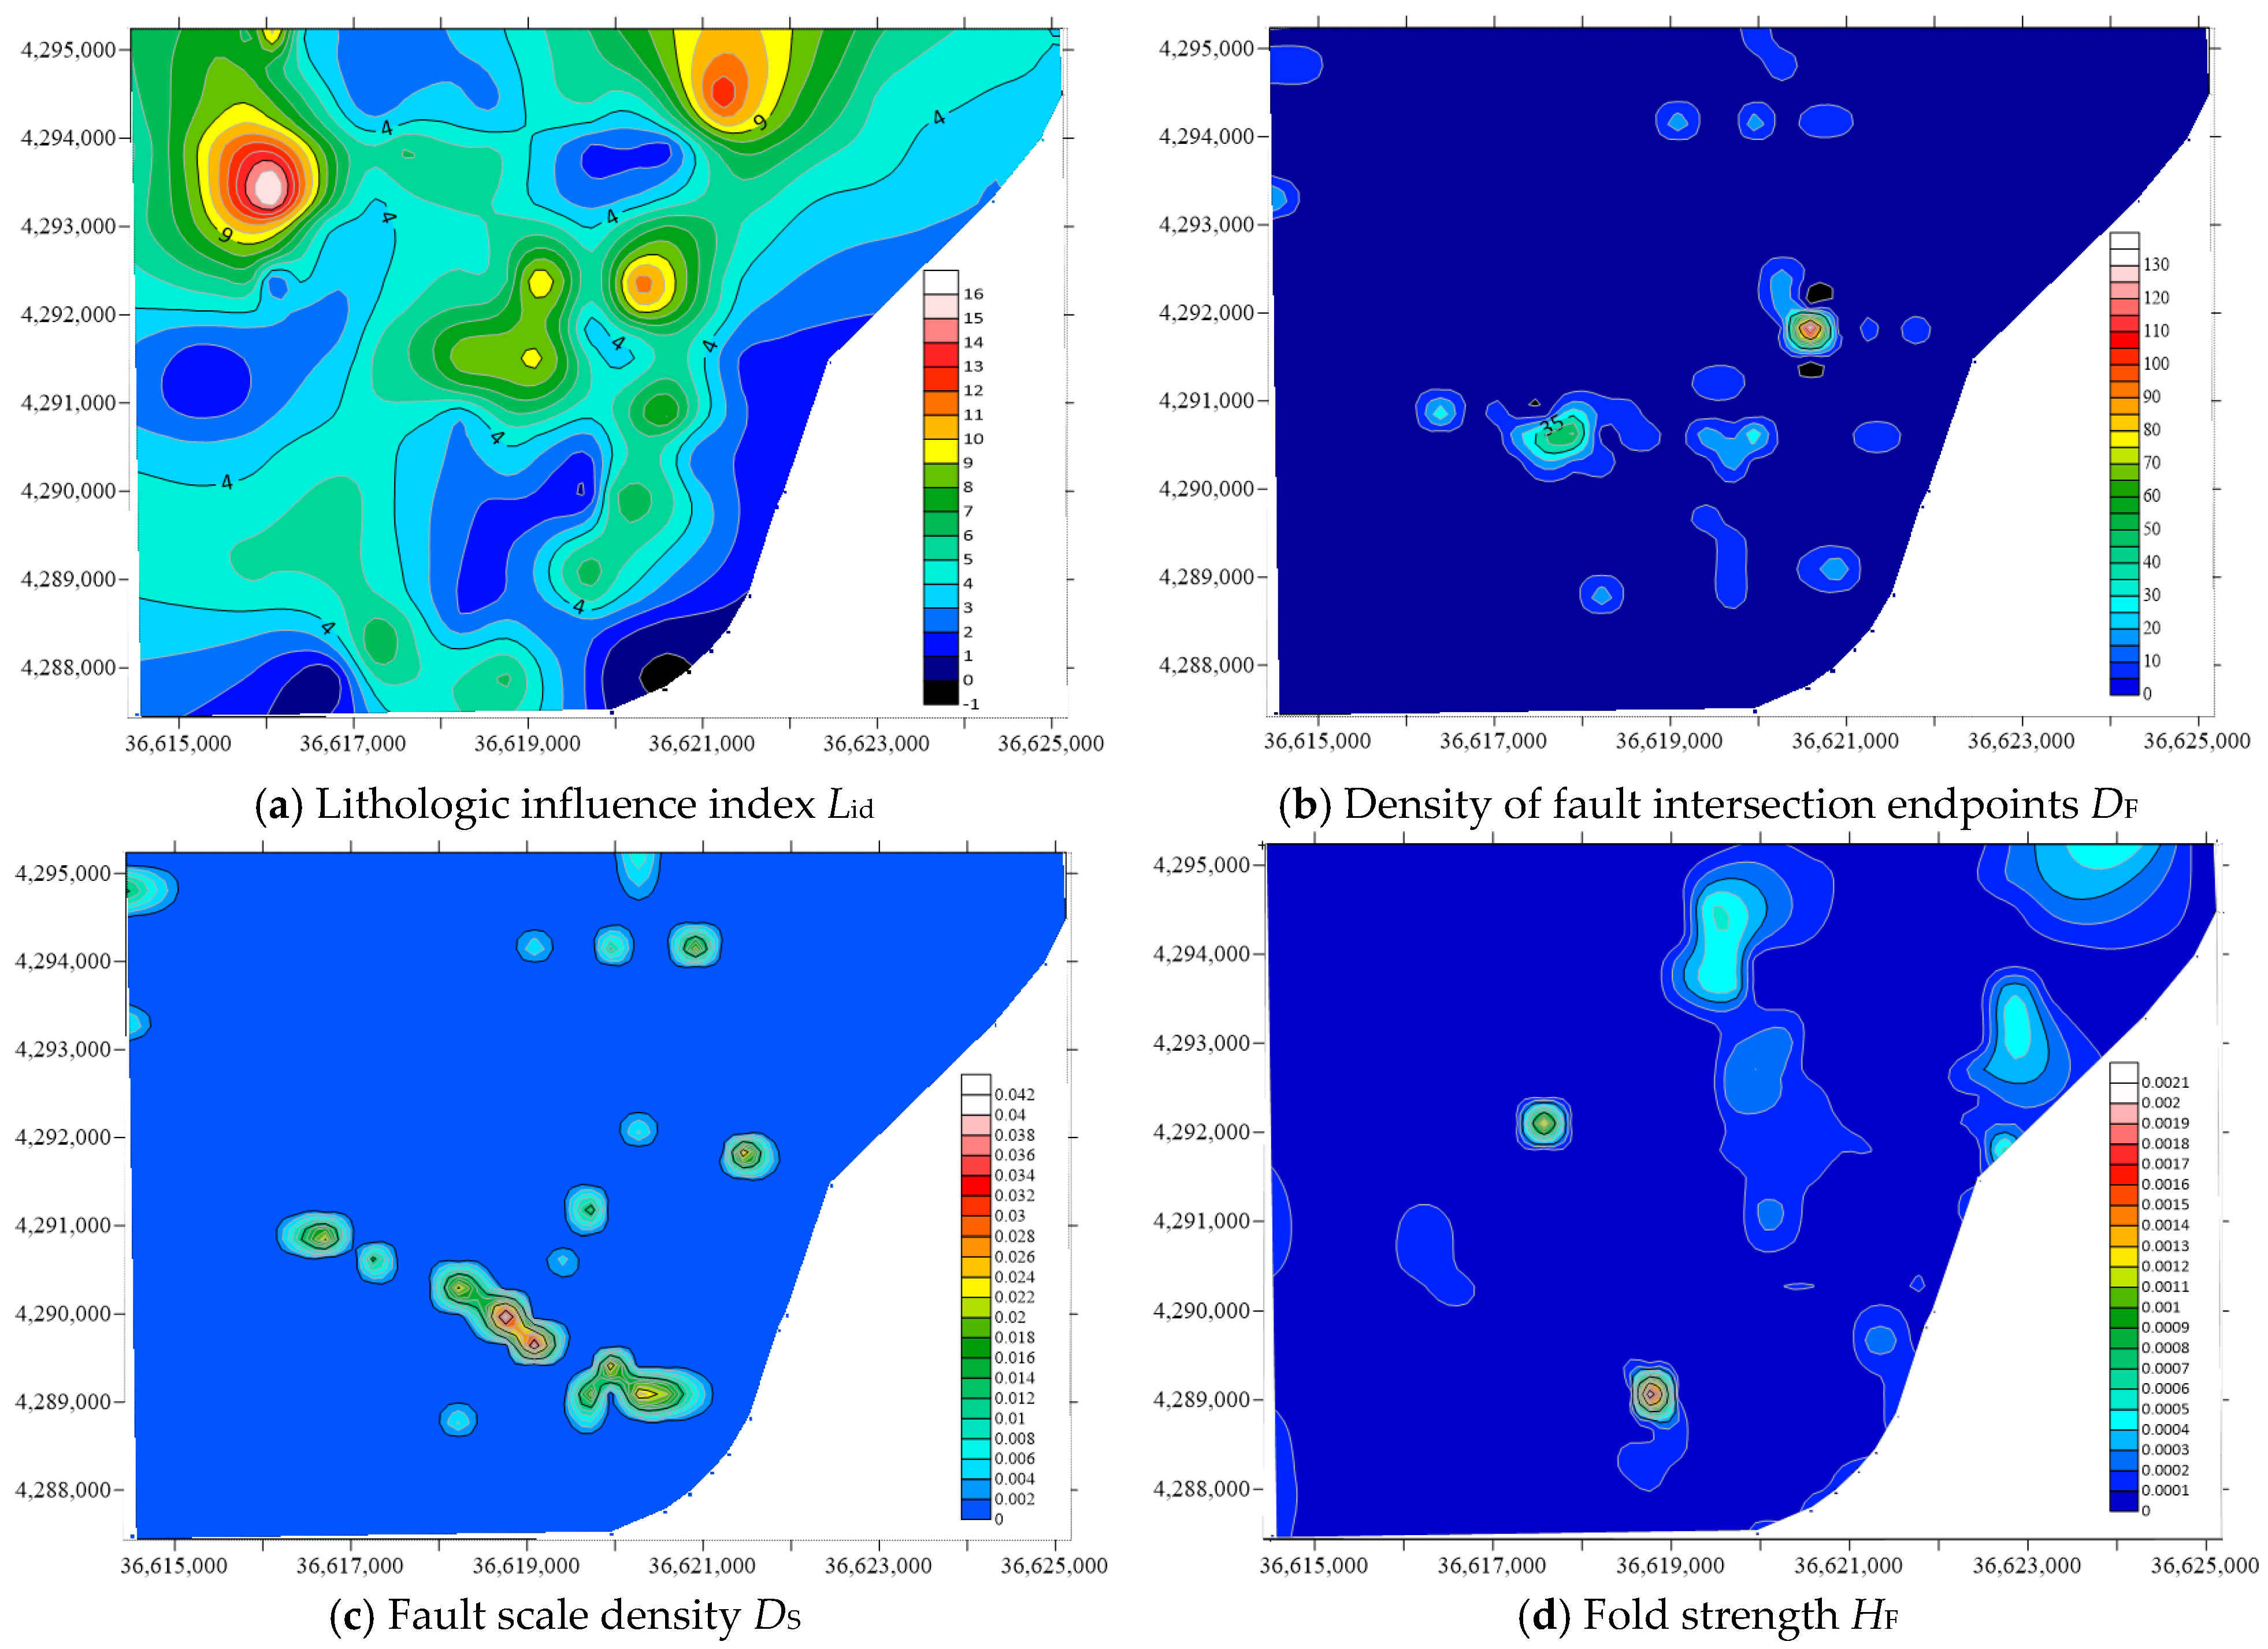
5.1. Indicator Selection

In this paper, the four key indicators of lithology influence index, fault intersection endpoint density, fault scale density, and fold strength are selected to predict the water content of sandstone. Through the integration of set pair analysis and variable fuzzy sets, a comprehensive evaluation model is constructed to quantify the influence of these factors on the water abundance of sandstone. The hierarchical structure model is shown in Figure 5.

5.2. Evaluation Index Value Standard

In the process of comprehensive evaluation of aquifer water abundance, the weighted comprehensive scoring method, fuzzy logic method, and other statistical methods are usually used to integrate the above evaluation indexes. Due to the diversity of geological background and hydrological conditions, there are differences in the evaluation grades of water richness in different situations. The water abundance grade determined by the current multi-factor fusion method is only relative, and there is no unified and referable evaluation grade classification standard. In view of this, this paper sets a threshold based on the corresponding index at the trough of the index frequency histogram and quantitatively divides the water-rich grade into five grades of water-rich grade I to V. Specifically, the larger the index value, the better the water richness, and the specific division criteria are shown in Table 2.
It is worth noting that in the study area (752 cells), the fault index of most areas is 0, indicating that these areas lack significant fault activity. Only a few cells (44 fault-intersection density cells and 37 fault-scale density cells, respectively) show fault-related indices. Aiming at the density of fault intersections, the grade assignment method is used to subdivide the values into eight grades of 0, 2.5, 5.5, 7.5, 10, 12.5, 15, and 17.5 to quantify their distribution characteristics. As for the evaluation of fault scale density, 0 is first classified into a single interval, and the remaining four intervals are divided according to the average principle of each non-zero index from the minimum to the maximum so as to construct a more detailed evaluation system.

5.3. Determination of the Weight of the Evaluation Index

With regard to the determination of weights, traditional methods tend to adopt a single strategy. The subjective weighting method focuses on the intrinsic meaning of indicators and effectively reflects the preferences of decision-makers. However, its objectivity is relatively insufficient. On the contrary, the objective weighting rule is based on a solid mathematical theory foundation but may ignore the direct participation of decision-makers and specific situational considerations [36,37,38]. Thus, this paper adheres to the principles of objectivity, comprehensiveness, and quantitative and qualitative analysis and innovatively integrates the entropy weight coefficient method and subjective experience assignment method in the objective weighting method to construct a comprehensive weight system. It is found that the water abundance of the aquifer is affected by the combination of rock type and structural characteristics. During the mining process of the mining face, the water inflow in the fault-intensive area increases significantly. By collecting detailed data on the boreholes after the mining of the coal seam working face, we compared the maximum water inflow of the working face with faults and without faults but similar rock properties in the mining area. The maximum water inflow of the former is 275 m3/h, while the latter is only 82.5 m3/h. It is generally believed that there is a positive relationship between the water abundance of the aquifer and the water inflow of the working face. Thus, the weight values of the lithologic index and the structural index are set to 0.7 and 0.3, which reflects their relative importance in determining the water abundance of the aquifer.
According to the entropy weight coefficient method, the weight of each evaluation index of the constituent class is calculated. Specifically, the relative importance of each index in the evaluation system is quantified by this method. The specific evaluation index weights are shown in Table 3.

5.4. Water-Richness Evaluation Results and Verification

Combined with drilling data and structural data, a thematic map of water-rich evaluation of specific factors (Figure 6) was compiled. After the grid operation is realized in Surfer software, the evaluation values of each grid node are extracted, and then the correlation between the evaluation value of the influencing factor index and the evaluation criterion set is established. Through Equations (15)–(17), under the setting of the parameters of the four-variable fuzzy set models, the normalized comprehensive membership vector V of the water abundance of the roof sandstone in the study area and the eigenvalue H of the water abundance level of the aquifer are calculated. This process reveals the variation range of the water abundance grade of the aquifer to be evaluated under the four model parameters and analyzes the stability of the eigenvalues.
According to the calculation results of comprehensive membership degree, it is found that the distribution trend of all levels is consistent and shows good stability, and then the average characteristic value H ¯ of aquifer water abundance under four different model parameters is obtained. To generate a continuous spatial representation of the results, the average characteristic value H of aquifer water richness was calculated and interpolated using the Kriging interpolation method in Surfer software. This geostatistical approach accounts for spatial autocorrelation and provides reliable estimates at unsampled locations. The resulting isoline map of the average characteristic value H (Figure 7) delineates the water-rich zones across the study area. It can be seen from the figure that the average eigenvalue of water richness evaluation ( H ¯ is mainly concentrated in the [2,4] interval of 1~5 levels. For the value of 2 ≤ H ¯ < 3, it belongs to the [2,3] interval of 1~5 levels, and the evaluation level should be the third level, that is, water richness level III; for the value of 3 ≤ H ¯ < 4, it belongs to the [3,4] interval in the 1~5 level, and the evaluation level should be the fourth level, that is, the water-rich grade IV.
According to the ‘coal mine water prevention and control rules’, the water abundance of the aquifer is graded according to the q value of the unit water inflow of the borehole, which is divided into four grades: Weak, medium, strong, and extremely strong. The unit water inflow of S1-2, S8-1, and S10-1 in the pumping test of the roof sandstone aquifer in the study area is 0.0243 L/s·m, 0.0063 L/s·m, and 0.00055 L/s·m, respectively, which are all less than 0.1 L/s·m. The three boreholes are all located in the water-rich grade II area with characteristic value 2.5 < H ¯ < 3, so the water-rich grade II area corresponds to the weak water-rich area; the unit water inflows of boreholes S1-1, S8-3, and S8-2 are 0.2514 L/s·m, 0.8925 L/s·m, and 0.5829 L/s·m, respectively, which are greater than 0.1 L/s·m and less than or equal to 1 L/s·m. These three boreholes are all located in the water-rich grade III area with characteristic value 3 < H ¯ < 3.4. Thus, the water-rich grade III area corresponds to the middle water-rich area; the unit water inflow of the S5-1 borehole is 1.308 L/s·m, which is greater than 1 L/s·m, corresponding to the water-rich grade IV area with 3.4 ≤ H ¯ < 3.5, so the water-rich grade IV area with 3.4 ≤ H ¯ < 3.5 corresponds to the strong water-rich area.
The evaluation results of water richness show that the overall water richness of the study area is weak, and most of the areas are weak water-rich areas, located in the south and east; the medium water-rich area is mainly located in the northeast and northwest of the study area; the area with strong water richness is located in the northwest of the study area.

5.5. Comparison of Methods

By using the intuitionistic fuzzy analytic hierarchy process and entropy weight method to quantify subjective and objective weights, respectively, combined with the principle of game theory, the comprehensive weight assignment is carried out. This strategy aims to overcome the limitations of the single weight distribution method and ensure that the weight setting is more scientific and reasonable. With the help of the variable fuzzy set method, especially the effective integration of data information through the relative membership function, this method can accurately capture and deal with the interaction between various indicators and significantly improve the stability and reliability of the evaluation results. In spite of this, the setting of the difference function in the variable fuzzy set may still have some subjectivity. The set pair analysis theory provides a more intuitive and comprehensive evaluation perspective by revealing the relationship between the evaluation object and the index level. The water-rich evaluation model of roof sandstone based on set pair analysis-variable fuzzy set theory proposed in this paper is based on the accurate calculation of the weight of the evaluation index by the entropy weight coefficient method.
In order to explore the accuracy of the designed water-richness evaluation model, it is compared with the previous water-richness evaluation model based on the multi-information fusion evaluation method. In past research practice, when using the strategy of multi-source information fusion to evaluate water abundance, the evaluation model is usually constructed by assigning weights to each index and simply summing up. Based on the weight value calculated by the entropy weight coefficient method mentioned above, a comprehensive evaluation model of multi-information integration based on the entropy weight coefficient method is established. The specific expressions are as follows:
E = 0.7Lid + 0.04336DF + 0.04342DS + 0.21322HF
where, E water-rich index; Lid, DF, DS, and HF were the standardized values of each index.
According to Equation (18), the water-rich index of each unit in the study area is calculated, and the threshold of water-rich zoning is determined to be 2.5 and 5 by combining the frequency histogram of the water-rich index. Using the known unit water inflow of drilling and working face water inflow, the water-rich evaluation index [0, 2.5] is located in the weak water-rich area, [2.5, 9] is the medium water-rich area, and [9,12] is the strong water-rich area. Figure 8 shows the contour map of the water-rich index of the roof sandstone aquifer in the study area. Comparing and analyzing the evaluation results of water richness obtained by two different methods, it can be seen that the evaluation results of the model established in this paper are different from the results of the comprehensive evaluation model of multi-source information fusion based on the entropy weight coefficient method.
In order to further compare and analyze the set pair analysis-variable fuzzy set coupling evaluation model constructed in this paper and the multi-source information fusion comprehensive evaluation model based on the entropy weight coefficient method, the paper takes P1 as the control point, and the specific evaluation index value is shown in Table 4.
It can be seen from Figure 7 to Figure 8 that the evaluation result of the set pair analysis-variable fuzzy set coupling evaluation model at point P1 is a weak water-rich area, and the evaluation result of the water-rich evaluation model based on the entropy weight coefficient method is a medium water-rich area. The main reasons for this phenomenon are as follows:
(1) Under the framework of aquifer water-richness evaluation based on entropy weight, the weight calculation mainly focuses on each evaluation index. It is assumed that the indexes are independent and linear; that is, the larger the index value, the better the water-rich performance. This assumption ignores the interaction between the evaluation index and the grade. According to the relative membership degree shown in Table 5, the index value of the P1 point does not reveal a significant linear correlation. This phenomenon is attributed to the consideration of the interdependence between indicators in the analysis process, which effectively prevents the neglect of individual indicators in the evaluation due to their small values. This method captures the complex relationship between indicators more comprehensively and significantly improves the accuracy and reliability of the review.
(2) Under the coupling evaluation framework of set pair analysis and variable fuzzy set, this paper calculates the comprehensive membership vector under four model scenarios by using four different parameter configurations (Table 6). This method effectively solves the problem of subtle differences between adjacent categories that are not easy to identify and reduces the uncertainty introduced by mathematical modeling, thereby improving the fairness and reliability of the evaluation results.

6. Conclusions

(1) The water abundance of the roof sandstone aquifer depends on the recharge, storage, and water conductivity of the aquifer, which is controlled by the degree of sedimentary diagenesis and structural development. The study area is located in the south of the Jurassic coalfield in Ordos. Its structural form is generally a monoclinic structure inclined to the northwest, with a tendency of 300~320° and a stratigraphic dip angle of 1~3°. There are broad and gentle undulations along the strike. No large faults and fold structures are found in the area, and the overall structure is simple. Based on the analysis of the geological, structural, and hydrogeological data of the minefield from the perspective of sedimentary water control, the evaluation factors, such as sandstone lithology coefficient, sand-mud layer number, and sandstone equivalent thickness, were selected, and the evaluation index of lithology influence index was established. From the perspective of structural water control, three evaluation indices of fault intersection point density, fault scale density, and fold strength are selected, and the index system of water abundance evaluation of sandstone aquifers is constructed.
(2) Based on the lithology and structural characteristics of the sandstone aquifer in the study area, the set pair analysis-variable fuzzy set coupling evaluation method was used to establish the water-richness evaluation model of the roof sandstone, and the water-richness of the sandstone aquifer in the Zhiluo Formation was predicted. The relative grade of water richness and its partition are divided, and compared with the results of the aquifer pumping test, the water richness grade of each partition is determined. The evaluation results of water richness show that the overall water richness of the study area is weak, and most of the regions are weak water-rich areas located in the south and east; the medium water-rich area is mainly located in the northeast and northwest of the study area; the area with strong water richness is situated in the northwest of the study area.
(3) Comparative analysis shows that compared with the multi-source information fusion evaluation method based on the entropy weight coefficient method, the aquifer water-richness evaluation model based on the set pair analysis-variable fuzzy set evaluation method shows significant advantages in dealing with the interaction and integration between data and their levels, and the evaluation results generated are more scientific.

7. Discussion and Limitations

This study demonstrates that the proposed SPA–VFS coupling model improves the classification accuracy of water-richness zoning in roof sandstone aquifers by 12–15% over traditional methods (e.g., entropy weighting, AHP), particularly in transitional zones where factor interactions are nonlinear and complex. The spatial distribution aligns well with known hydrogeological patterns in the Ordos Basin, while finer-scale variations revealed by the model support more targeted mine water control strategies—such as high-capacity drainage and grouting in strong water-rich zones (northwest); localized dewatering in medium zones; and fracture monitoring in weak zones (south/east).
Furthermore, the proposed SPA-VFS coupling method exhibits strong flexibility and adaptability, allowing it to be recalibrated for different regional geological contexts by adjusting parameters such as weight coefficients and fuzzy membership functions according to local lithology, structural features, and inflow data. This adaptability facilitates its application to other coalfields or metal mining areas, especially in complex hydrogeological settings with uneven water-richness distributions and distinct transitional zones.
From a management and policy perspective, the enhanced precision and stability in water-richness zoning provided by this method offer more reliable technical support for mine design, drainage planning, and grouting reinforcement strategies. In particular, the method improves the identification of transitional and high-risk water-rich zones often overlooked by traditional approaches, enabling proactive risk mitigation. Moreover, by supporting data-driven decision-making, this model can provide quantitative evidence for regulatory bodies to formulate regional groundwater protection policies, optimize mine water resource utilization, and improve discharge management.
Despite these improvements, the model has several limitations. First, key parameters (e.g., connection degree thresholds) were empirically derived and may require recalibration for application in other regions. Second, the evaluation assumes isotropic aquifer conditions and does not account for directional permeability variations commonly observed in fractured sandstone. Third, the analysis is based on static data, without incorporating temporal changes induced by seasonal recharge or mining activity. Finally, interpolation uncertainties may exist in areas with sparse drilling coverage.
Future work should focus on integrating time-series monitoring data for dynamic model calibration, incorporating anisotropy through structural data or advanced interpolation methods, and expanding the framework to different geological settings. Additionally, incorporating uncertainty quantification would enhance the reliability of the evaluation results for mine planning and groundwater management.

Author Contributions

Conceptualization, K.L., Y.L. and Y.B.; methodology, K.L. and Y.L.; software, Y.B., W.Z. and C.H.; validation, K.L., W.Z., D.X. and S.L.; formal analysis, Y.L., Y.B., W.Z. and C.H.; investigation, W.Z., D.X., S.L. and B.X.; resources, K.L., W.Z. and C.H.; data curation, Y.B. and B.X.; writing—original draft preparation, K.L., Y.L., Y.B., W.Z. and C.H.; writing—review and editing, K.L., Y.B. and W.Z.; visualization, Y.L., D.X., S.L. and B.X.; supervision, K.L.; project administration, K.L. and W.Z.; funding acquisition, W.Z. All authors have read and agreed to the published version of the manuscript.

Funding

This work was supported by the Shandong Provincial Coal Geological Planning, Exploration and Research Institute Open Project Funding (Grant SDMTKCY-2022-19) and Shandong Provincial Natural Science Foundation (Grant No. ZR2021MD016).

Data Availability Statement

The data that support the findings of this study are available from the corresponding author upon reasonable request.

Acknowledgments

The authors would like to thank the anonymous reviewers for their comments, which significantly improved the manuscript.

Conflicts of Interest

Authors Yueyue Li and Bowen Xi were employed by the company Inner Mongolia Huangtaolegai Coal Co. Ltd. The remaining authors declare that the research was conducted in the absence of any commercial or financial relationships that could be construed as a potential conflict of interest.

Statement of Novelty

This study introduces a novel targeted evaluation model for water abundance in roof sandstone aquifers of coal mines. By combining set pair analysis with variable fuzzy set coupling, the model integrates multiple indicators, including lithology, fault density, and fold strength, to assess water richness more accurately. Unlike traditional methods, this approach provides a comprehensive evaluation of spatial water distribution and enhances understanding of water inrush risks in coal mining areas, offering new insights for mine water management.

References

  1. Sun, Y.J.; Chen, G.; Xu, Z.M.; Yuan, H.Q.; Zhang, Y.Z.; Zhou, L.J.; Wang, X.; Zhang, C.X.; Zheng, J.M. Research progress of water environment, treatment and utilization in coal mining areas of China. J. China Coal Soc. 2020, 45, 304–316. [Google Scholar]
  2. Peng, S.P.; Bi, Y.L. Strategic consideration and core technology about environmental ecological restoration in coal mine areas in the Yellow River basin of China. J. China Coal Soc. 2020, 45, 1211–1221. [Google Scholar]
  3. Cao, S.Y.; Yuan, Y.; Zhang, W.S.; Zhang, M.; Zhou, A.H.; Han, N.B.; Rong, M.R. Assessment and remediation model of eco-geo-environmental conditions in arid limestone mining areas. Ecol. Eng. 2025, 217, 107644. [Google Scholar] [CrossRef]
  4. Xu, H.L.; Waheed, A.; Kuerban, A.; Muhammad, M.; Aili, A. Dynamic approaches to ecological restoration in China’s mining regions: A scientific review. Ecol. Eng. 2025, 214, 107577. [Google Scholar] [CrossRef]
  5. Wu, Q.; Xu, K.; Zhang, W. Further research on “three maps-two predictions” method for prediction on coal seam roof water bursting risk. J. China Coal Soc. 2016, 41, 1341–1347. [Google Scholar]
  6. Zeng, Y.F.; Wu, Q.; Du, X.; Liu, S.Q.; Zan, J.C.; Dou, G.D.; Wu, Z.T. Further research on “water-richness index method” for evaluation of aquifer water abundance. J. China Coal Soc. 2020, 45, 2423–2431. [Google Scholar]
  7. Zhao, Z.H.; Liu, J.X.; Wang, L.H.; Zong, C.J. Prediction and Actual Measurement of Water Flowing Fractured Zone Height in Overburden Strata of Flat Seam. Min. Saf. Environ. Prot. 2017, 44, 66–69. [Google Scholar]
  8. Gui, H.; Xu, J.P.; Sui, W.H. Mechanical analysis of relations between water abundance and fatalness of water inrush from underlying aquifers. J. Min. Saf. Eng. 2017, 34, 103–107. [Google Scholar]
  9. Zeng, Y.F.; Yu, C.; Wu, Q.; Zhao, L.E.; Yin, S.X.; Zhang, B.C.; Liu, Z.Y.; Cui, Y.S.; Kan, X.D.; Huang, H. “Three zones” method for coal mine water hazard control and its significance. J. China Coal Soc. 2024, 49, 3605–3618. [Google Scholar]
  10. Fan, T. Coalbed methane fracturing effectiveness test using bore-hole transient electromagnetic method. J. China Coal Soc. 2020, 45, 3195–3207. [Google Scholar]
  11. Liu, G.H.; Hou, Z.; Wang, T.Y.; Song, H.W. A new model to predict the water inflow of aquifer. Prog. Geophys. 2012, 27, 1268–1273. [Google Scholar]
  12. Cheng, J.L.; Zhao, J.H.; Dong, Y.; Dong, Q.Y. Quantitative prediction of water abundance in rock mass by transient electro-magnetic method with LBA-BP neural network. J. China Coal Soc. 2020, 45, 330–337. [Google Scholar]
  13. Dai, G.L.; Yang, T.; Zhou, Y.; Niu, C. Exploration of the water-abundant sandstone geological features of Ningtiaota Ida Nao Luo in Shenfu mining area. J. Saf. Environ. 2016, 16, 144–148. [Google Scholar]
  14. Wu, Q.; Fan, Z.L.; Liu, S.Q.; Zhang, Y.W.; Sun, W.J. Water-richness evaluation method of water-filled aquifer based on the principle of information fusion with GIS: Water-richness index method. J. China Coal Soc. 2011, 36, 1124–1128. [Google Scholar]
  15. Hou, E.K.; Tong, R.J.; Wang, S.J.; Feng, J.; Chen, T. Prediction method for the water enrichment of weathered bedrock based on Fisher model in Northern Shaaxi Jurassic coalfield. J. China Coal Soc. 2016, 41, 2312–2318. [Google Scholar]
  16. Wang, S.Q.; Niu, J.L.; Liu, Y.; Du, P.; Zhang, Z.Z.; Liang, X.S. Gushing Water Law and Its Control Factors Analysis of Jinjie Coal Mine. Saf. Coal Mines 2014, 45, 145–147, 150. [Google Scholar]
  17. Wu, X. Prediction of Water Abundance of Sandstone Aquifer IN2 Coal Seam Roof and Risk Assessment of Water Inrush in 22 Mining Area of Yingpanhao Coal Mine. Doctoral Dissertation, Shandong University of Science and Technology, Qingdao, China, 2016. [Google Scholar]
  18. Wu, R.X.; Wei, J.C.; Yin, H.Y.; Zhang, Y.Q. Study on Water Enrichment Prediction of Roof Sandstone Aquifer Based on the Fuzzy Clustering Method: A Case Study on Longgu Coal Mine. J. Shandong Univ. Sci. Ang Technol. Nat. Sci. 2011, 30, 14–18. [Google Scholar]
  19. Han, C.; Pan, X.H.; Li, G.L.; Tu, J.N. The Fuzzy analytic hierarchy process of water abundance of an aquifer based on GIS and multi-source information fusion techniques. Hydrogeol. Eng. Geol. 2012, 39, 19–25. [Google Scholar]
  20. Han, C.H.; Wei, J.C.; Xie, D.L.; Xu, J.G.; Zhang, W.J.; Zhao, Z.C. Water-richness evaluation of sandstone aquifer based on set pair analysis-variable fuzzy set coupling method: A case from Jurassic Zhiluo formation of Jinjiaqu coal mine in Ningdong mining area. J. China Coal Soc. 2020, 45, 2432–2443. [Google Scholar]
  21. Yu, X.G.; Wang, D.D.; Shi, L.Q.; Meng, M.M. Water-richness Evaluation Method of Water-filled Aquifer Characteristics Analysis Based on Evaluation Method. Coal Technol. 2016, 35, 152–154. [Google Scholar]
  22. Wang, S.J.; Feng, J.; Hou, E.K.; Huang, K.J.; Xue, W.F.; Duan, H.J. Microscopic pore structure types of sandstone and its effects on aquifer water abundance: Taking in Ningtiaota coal mine as an example. J. China Coal Soc. 2020, 45, 3236–3244. [Google Scholar]
  23. Li, B.; Wei, T.; Liu, Z.J. Construction of evaluation index system for water abundance of karst aquifers and risk assessment of water inrush on coal seam roof in Southwest China. J. China Coal Soc. 2022, 47, 152–159. [Google Scholar]
  24. Qiu, M.; Shao, Z.; Zhang, W.; Zheng, Y.; Yin, X.; Gai, G.; Han, Z.; Zhao, J. Water-richness evaluation method and application of clastic rock aquifer in mining seam roof. Sci. Rep. 2024, 14, 6465. [Google Scholar] [CrossRef] [PubMed]
  25. Zhao, K.Q. Application overview of set pair analysis in intelligent prediction system. CAAI Trans. Intell. Syst. 2022, 17, 233–247. [Google Scholar]
  26. Niu, C.; Jia, X.; Xiao, L.; Dong, L.; Qiao, H.; Huang, F.; Liu, X.; Luo, S.; Qian, W. Evaluation of Water Richness in Sandstone Aquifers Based on the CRITIC-TOPSIS Method: A Case Study of the Guojiawan Coal Mine in Fugu Mining Area, Shanxi Province, China. Water 2025, 17, 1424. [Google Scholar] [CrossRef]
  27. Meng, X.M.; Hu, H.P. Application of set pair analysis model based on entropy weight to comprehensive evaluation of water quality. J. Hydraul. Eng. 2009, 40, 257–262. [Google Scholar]
  28. Qiu, L.; Tang, H.Q.; Chen, H.T.; Xu, L. Application of set pair analysis method in the evaluation of groundwater quality. Water Sav. Irrig. 2007, 32, 13–15. [Google Scholar]
  29. Chen, S.Y. Unified theory and model of variable fuzzy clustering and pattern recognition. J. Dalian Univ. Technol. 2009, 49, 307–312. [Google Scholar]
  30. Niu, C.; Xu, X.; Dai, G.; Liu, K.; Xiao, L.; Luo, S.; Qian, W. Evaluation of Water-Richness and Risk Level of the Sandstone Aquifer in the Roof of the No. 3 Coal Seamin Hancheng Mining Area. Water 2025, 17, 1164. [Google Scholar] [CrossRef]
  31. Xu, J.; Wang, Q.; Zhang, Y.; Li, W.; Li, X. Evaluation of Coal-Seam Roof-Water Richness Based on Improved Weight Method: A Case Study in the Dananhu No.7 Coal Mine, China. Water 2024, 16, 1847. [Google Scholar] [CrossRef]
  32. Li, Z.K.; Li, W.; Ge, W.; Xu, H.Y. Dam breach environmental impact evaluation based on set pair analysis-variable fuzzy set coupling model. J. Tianjin Univ. Sci. Technol. 2019, 52, 49–56. [Google Scholar]
  33. Wu, K.Y.; Jin, J.L.; Zhou, Y.L.; Wang, W.S. Set pair analysis-variable fuzzy set assessment model for watershed water resources security. J. Sichuan Univ. Eng. Sci. Ed. 2008, 40, 6–12. [Google Scholar]
  34. Kuo, W.; Li, X.; Zhang, Y.; Li, W.; Wang, Q.; Li, L. Prediction Model of Water Abundance of Weakly Cemented Sandstone Aquifer Based on Principal Component Analysis–Back Propagation Neural Network of Grey Correlation Analysis Decision Making. Water 2024, 16, 551. [Google Scholar] [CrossRef]
  35. Yin, H.; Xu, G.; Zhang, Y.; Zhai, P.; Li, X.; Guo, Q.; Wei, Z. Risk Assessment of Water Inrush of a Coal Seam Floor Based on the Combined Empowerment Method. Water 2022, 14, 1607. [Google Scholar] [CrossRef]
  36. Wei, J.C.; Zhou, Z.C.; Xie, D.L.; Yu, G.Y.S.; Wu, X. Water-abundance evaluation of sandstone aquifer based on lithologic and structural characteristics. J. Shandong Univ. Sci. Technol. Nat. Sci. 2020, 39, 13–23. [Google Scholar]
  37. Hou, E.K.; Ji, Z.C.; Che, X.Y.; Wang, J.W.; Gao, L.J.; Tian, S.X.; Yang, F. Water abundance prediction method of weathered bedrock based on improved AHP and the entropy weight method. J. China Coal Soc. 2019, 40, 3164–3173. [Google Scholar]
  38. Zhang, X.L. Application of entropy weight method and analytic hierarchy process in evaluation of water inrush from coal seam floor. Coal Geol. Explor. 2017, 45, 91–95. [Google Scholar]
Figure 1. Stratigraphic framework and coal seam development characteristics of Bayangaole Area.
Water 17 01826 g001
Figure 2. Geographic position and surface landform of Bayangaole coal mine, China.
Water 17 01826 g002
Figure 3. The tectonic framework and grid unit division of Bayangaole minefield.
Water 17 01826 g003
Figure 4. Evaluation process of set pair analysis—variable fuzzy set coupling method.
Water 17 01826 g004
Figure 5. Hierarchical structure model for prediction of water abundance of sand aquifer.
Water 17 01826 g005
Figure 6. Evaluation of single water-rich factor of roof sandstone aquifer.
Water 17 01826 g006
Figure 7. Water-rich zoning of the study area based on set pair analysis-variable fuzzy set coupling.
Water 17 01826 g007
Figure 8. Water-rich zoning of multi-source information fusion based on entropy weight coefficient method.
Water 17 01826 g008
Table 1. Roof sandstone porosity statistics.
LithologySample Porosity/%Average/%Equivalent Coefficient
No 1.No 2.No 3.No 4.
Coarse sandstone19.0518.0117.6522.9718.921
Medium sandstone15.0515.2114.9815.2815.130.8
Fine sandstone10.9611.2712.0911.0811.350.6
Table 2. Water abundance evaluation index value standard.
NO.Indicator CategoryOrder of Evaluation
Water Rich IWater Rich
II
Water Rich
III
Water Rich
IV
Water Rich
V
1Lithologic influence index (Lid)[0, 3.6)[3.6, 6.6)[6.6, 9.6)[9.6, 10.8)[10.8, 15.6]
2Density of fault intersection endpoints (DF)[0, 2.1)[2.1, 7)[7, 9.8)[9.8, 11.9)[11.9, 18.2]
3Fault scale density (DS)[0, 0.0001)[0.0001, 0.0097)[0.0097, 0.0193)[0.0193, 0.0241)[0.0241, 0.0418]
4Fold strength (HF)[0, 0.0163)[0.0163, 0.0326)[0.0326, 0.0570)[0.0570, 0.1384)[0.1384, 0.2117]
Table 3. Weights of evaluation indexes for water abundance of the roof sandstone aquifer.
IndexLithologic Influence Index (Lid)Fault Intersection Endpoints Density (DF)Fault Scale Density (DS)Fold Strength (HF)
Weight0.70.043360.043420.21322
Table 4. The value of the water richness evaluation index at P1 point.
Evaluation IndexLithologic Influence Index (Lid)Density of Fault Intersection Endpoints (DF)Fault Scale Density (DS)Fold Strength (HF)
Targeted value2.82250.0224854932.248549333
Table 5. Calculation results of relative membership degree of water richness evaluation index at P1 position.
Evaluation IndexLithologic Influence Index (Lid)Density of Fault Intersection Endpoints (DF)Fault Scale Density (DS)Fold Strength (HF)
I1.001.000.071.00
II0.960.810.380.76
III0.720.581.000.51
IV0.490.420.300.38
V0.370.310.650.30
Table 6. The calculation results of the comprehensive membership vector and water-rich level eigenvalue at the P1 position.
Model ParameterThe Normalized Comprehensive Membership VectorWater Richness Level Characteristic Value H
α = 1, p = 1[0.2341, 0.2225, 0.2016, 0.1751, 0.1667]2.8177 (Weak water-rich area)
α = 1, p = 2[0.2341, 0.2225, 0.2016, 0.1751, 0.1667]2.8238 (Weak water-rich area)
α = 2, p = 1[0.2159, 0.2141, 0.2066, 0.1864, 0.1770]2.8946 (Weak water-rich area)
α = 2, p = 2[0.2164, 0.2153, 0.2054, 0.1878, 0.1751]2.8899 (Weak water-rich area)
Disclaimer/Publisher’s Note: The statements, opinions and data contained in all publications are solely those of the individual author(s) and contributor(s) and not of MDPI and/or the editor(s). MDPI and/or the editor(s) disclaim responsibility for any injury to people or property resulting from any ideas, methods, instructions or products referred to in the content.

