
A Comparative Assessment of Surface Water Quality in Lake Yuriria, Guanajuato, Using the Water Quality Index

 , , , , ,
Abstract
1. Introduction
2. Materials and Methods
2.1. Study Site
2.2. Sampling and Parameter Analysis
2.3. Field Parameter Analysis
2.4. Parameter Analysis
2.5. Water Quality Index Analysis
2.6. Statistical Analysis of Water Quality Parameters
3. Results and Discussion
3.1. Physicochemical Parameters of Water in the Lake
3.2. Metals in the Lake Water
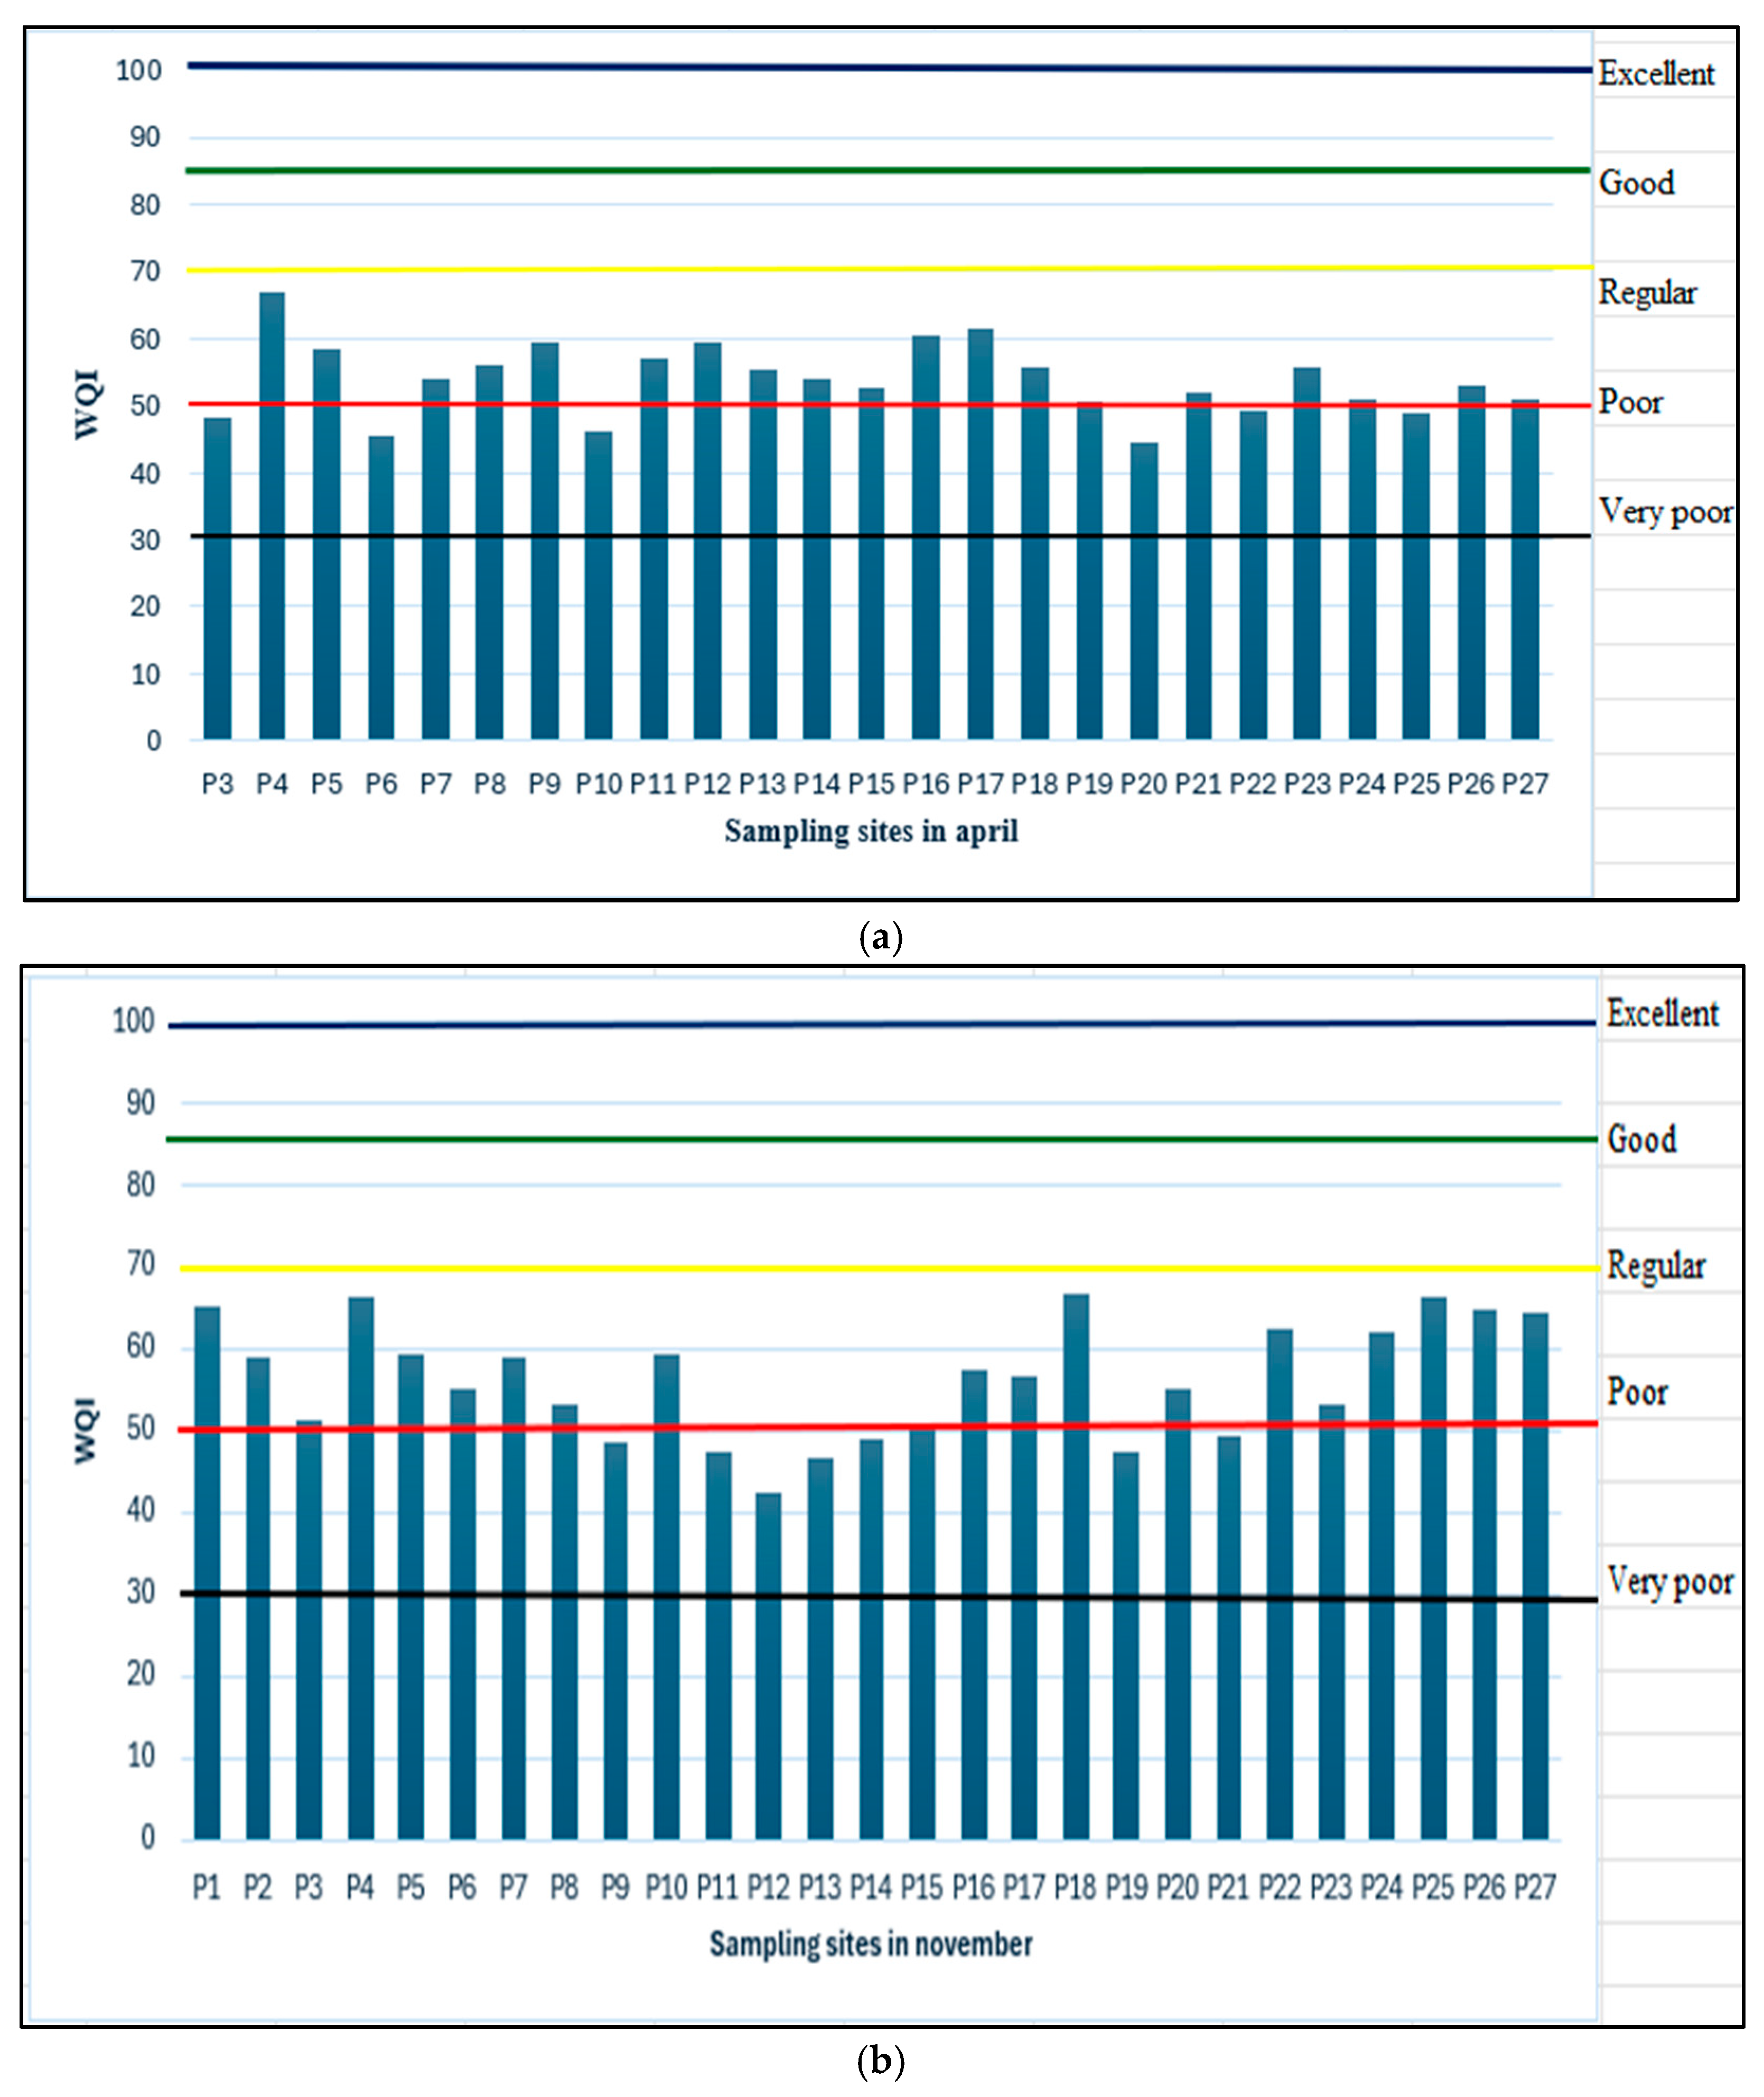
3.3. Water Quality Index (WQI)
3.4. Statistical Analysis
4. Conclusions
Author Contributions
Funding
Data Availability Statement
Conflicts of Interest
References
- Subramaniam, P.; Ahmed, A.N.; Fai, C.M.; Abdul Malek, M.; Kumar, P.; Huang, Y.F.; Sherif, M.; Elshafie, A. Integrated GIS and Multivariate Statistical Approach for Spatial and Temporal Variability Analysis for Lake Water Quality Index. Cogent Eng. 2023, 10, 2190490. [Google Scholar] [CrossRef]
- Syeed, M.M.M.; Hossain, M.S.; Karim, M.R.; Uddin, M.F.; Hasan, M.; Khan, R.H. Surface Water Quality Profiling Using the Water Quality Index, Pollution Index and Statistical Methods: A Critical Review. Environ. Sustain. Indic. 2023, 18, 100247. [Google Scholar] [CrossRef]
- Dixit, A.; Shrivastava, S. Assessment of Parameters of Water Quality Analysis of Hanumantal and Robertson Lake at Jabalpur (MP). Asian J. Res. Chem. 2013, 6, 752–754. [Google Scholar]
- Rizo-Decelis, L.D.; Andreo, B. Water Quality Assessment of the Santiago River and Attenuation Capacity of Pollutants Downstream Guadalajara City, Mexico. River Res. Appl. 2016, 32, 1505–1516. [Google Scholar] [CrossRef]
- Saleem, M.; Iqbal, J.; Shah, M.H. Seasonal Variations, Risk Assessment and Multivariate Analysis of Trace Metals in the Freshwater Reservoirs of Pakistan. Chemosphere 2019, 216, 715–724. [Google Scholar] [CrossRef]
- Ali, E.M.; Khairy, H.M. Environmental Assessment of Drainage Water Impacts on Water Quality and Eutrophication Level of Lake Idku, Egypt. Environ. Pollut. 2016, 216, 437–449. [Google Scholar] [CrossRef]
- Shrestha, A.K.; Basnet, N. The Correlation and Regression Analysis of Physicochemical Parameters of River Water for the Evaluation of Percentage Contribution to Electrical Conductivity. J. Chem. 2018, 2018, 8369613. [Google Scholar] [CrossRef]
- Kumar, P.; Mahajan, A.K.; Meena, N.K. Evaluation of Trophic Status and Its Limiting Factors in the Renuka Lake of Lesser Himalaya, India. Environ. Monit. Assess. 2019, 191, 105. [Google Scholar] [CrossRef] [PubMed]
- De Anda, J.; Shear, H.; Maniak, U.; Riedel, G. Phosphates in Lake Chapala, Mexico. Lakes Reserv. Sci. Policy Manag. Sustain. Use 2001, 6, 313–321. [Google Scholar] [CrossRef]
- Wu, Z.; Wang, X.; Chen, Y.; Cai, Y.; Deng, J. Assessing River Water Quality Using Water Quality Index in Lake Taihu Basin, China. Sci. Total Environ. 2018, 612, 914–922. [Google Scholar] [CrossRef]
- Uddin, M.G.; Nash, S.; Olbert, A.I. A Review of Water Quality Index Models and Their Use for Assessing Surface Water Quality. Ecol. Indic. 2021, 122, 107218. [Google Scholar] [CrossRef]
- Avigliano, E.; Monferrán, M.V.; Sánchez, S.; Wunderlin, D.A.; Gastaminza, J.; Volpedo, A.V. Distribution and Bioaccumulation of 12 Trace Elements in Water, Sediment and Tissues of the Main Fishery from Different Environments of the La Plata Basin (South America): Risk Assessment for Human Consumption. Chemosphere 2019, 236, 124394. [Google Scholar] [CrossRef] [PubMed]
- Kumar, A.; Kumar, V.; Pandita, S.; Singh, S.; Bhardwaj, R.; Varol, M.; Rodrigo-Comino, J. A Global Meta-Analysis of Toxic Metals in Continental Surface Water Bodies. J. Environ. Chem. Eng. 2023, 11, 109964. [Google Scholar] [CrossRef]
- Espinal Carreón, T.; Sedeño Díaz, J.E.; López López, E. Evaluación de La Calidad Del Agua En La Laguna de Yuriria, Guanajuato, México, Mediante Técnicas Multivariadas: Un Análisis de Valoración Para Dos Épocas 2005, 2009–2010. Rev. Int. Contam. Ambient. 2013, 29, 147–163. [Google Scholar]
- Comisión Nacional Para el Conocimiento y Uso de la Biodiversidad Humedales Continentales de México. Available online: https://www.biodiversidad.gob.mx/ (accessed on 6 May 2025).
- Instituto Nacional de Estadística y Geografía Conjunto de Datos Vectoriales de Uso de Suelo y Vegetación, Escala 1:250,000 (Serie VII). Available online: https://www.inegi.org.mx/temas/usosuelo/ (accessed on 6 May 2025).
- González Arévalo, A.L. La Contaminación Por Desechos Industriales En La Laguna de Yuriria, Ubicada En La Región Centro de México. In Aproximaciones Teórico-Metodológicas para el Análisis Territorial y el Desarrollo Regional Sostenible; Universidad Nacional Autónoma de México, Instituto de Investigaciones Económicas y Asociación Mexicana de Ciencias para el Desarrollo Regional: Ciudad de México, Mexico, 2021; Volume I. [Google Scholar]
- Secretaría de Medio Ambiente y Ordenamiento Territorial Laguna de Yuriria y Su Zona de Influencia. Available online: https://smaot.guanajuato.gob.mx/sitio/areas-naturales-protegidas/10/Laguna-de-Yuriria-y-su-Zona-de-Influencia (accessed on 6 May 2025).
- Alobaidy, A.H.M.J.; Abid, H.S.; Maulood, B.K. Application of Water Quality Index for Assessment of Dokan Lake Ecosystem, Kurdistan Region, Iraq. J. Water Resour. Prot. 2010, 2, 792–798. [Google Scholar] [CrossRef]
- Sutadian, A.D.; Muttil, N.; Yilmaz, A.G.; Perera, B.J.C. Using the Analytic Hierarchy Process to Identify Parameter Weights for Developing a Water Quality Index. Ecol. Indic. 2017, 75, 220–233. [Google Scholar] [CrossRef]
- Sedeño-Díaz, J.E.; López-López, E. Water Quality in the Río Lerma, Mexico: An Overview of the Last Quarter of the Twentieth Century. Water Resour. Manag. 2007, 21, 1797–1812. [Google Scholar] [CrossRef]
- Rubio-Arias, H.; Contreras-Caraveo, M.; Quintana, R.M.; Saucedo-Teran, R.A.; Pinales-Munguia, A. An Overall Water Quality Index (WQI) for a Man-Made Aquatic Reservoir in Mexico. Int. J. Environ. Res. Public Health 2012, 9, 1687–1698. [Google Scholar] [CrossRef]
- Nguyen, T.G.; Huynh, T.H.N. Assessment of Surface Water Quality and Monitoring in Southern Vietnam Using Multicriteria Statistical Approaches. Sustain. Environ. Res. 2022, 32, 20. [Google Scholar] [CrossRef]
- Hernández-Martínez, J.L.; Perera-Burgos, J.A.; Acosta-González, G.; Alvarado-Flores, J.; Li, Y.; Leal-Bautista, R.M. Assessment of physicochemical parameters by remote sensing of Bacalar Lagoon, Yucatán Peninsula, Mexico. Water 2023, 16, 159. [Google Scholar] [CrossRef]
- APHA. Standard Methods for the Examination of Water and Wastewater; APHA: Washington, DC, USA, 2005; ISBN 9780875532356. [Google Scholar]
- WHO. Guidelines for Drinking-Water Quality: Fourth Edition Incorporating the First and Second Addenda; WHO: Geneva, Switzerland, 2022. [Google Scholar]
- Zhang, Z.; Wang, J.J.; Ali, A.; DeLaune, R.D. Heavy Metals and Metalloid Contamination in Louisiana Lake Pontchartrain Estuary along I-10 Bridge. Transp. Res. D Transp. Environ. 2016, 44, 66–77. [Google Scholar] [CrossRef]
- Wang, J.; Fu, Z.; Qiao, H.; Liu, F. Assessment of Eutrophication and Water Quality in the Estuarine Area of Lake Wuli, Lake Taihu, China. Sci. Total Environ. 2019, 650, 1392–1402. [Google Scholar] [CrossRef]
- Sheela, A.M.; Letha, J.; Joseph, S.; Chacko, M.; Sanal Kumar, S.P.; Thomas, J. Water Quality Assessment of a Tropical Coastal Lake System Using Multivariate Cluster, Principal Component and Factor Analysis. Lakes Reserv. Sci. Policy Manag. Sustain. Use 2012, 17, 143–159. [Google Scholar] [CrossRef]
- Iqbal, J.; Shah, M.H.; Akhter, G. Characterization, Source Apportionment and Health Risk Assessment of Trace Metals in Freshwater Rawal Lake, Pakistan. J. Geochem. Explor. 2013, 125, 94–101. [Google Scholar] [CrossRef]
- Razmkhah, H.; Abrishamchi, A.; Torkian, A. Evaluation of Spatial and Temporal Variation in Water Quality by Pattern Recognition Techniques: A Case Study on Jajrood River (Tehran, Iran). J. Environ. Manag. 2010, 91, 852–860. [Google Scholar] [CrossRef]
- Braga, F.H.R.; Dutra, M.L.S.; Lima, N.S.; da Silva, G.M.; de Miranda, R.C.M.; da Firmo, W.C.A.; de Moura, A.R.L.; de Monteiro, A.S.; da Silva, L.C.N.; da Silva, D.F.; et al. Study of the Influence of Physicochemical Parameters on the Water Quality Index (WQI) in the Maranhão Amazon, Brazil. Water 2022, 14, 1546. [Google Scholar] [CrossRef]
- Zanor, G.A.; Lecomte, K.L.; Jesús Puy Y Alquiza, M.; Saldaña-Robles, A.; Manjarrez-Rangel, C.S.; Rubio-Jiménez, C.A.; Pussetto, N. A 16th century artificial reservoir under human pressure: Water quality variability assessment in Laguna de Yuriria, central Mexico. Environ. Monit. Assess. 2023, 195, 182. [Google Scholar] [CrossRef]
- Kumar, A.; Mishra, S.; Bakshi, S.; Upadhyay, P.; Thakur, T.K. Response of Eutrophication and Water Quality Drivers on Greenhouse Gas Emissions in Lakes of China: A Critical Analysis. Ecohydrology 2023, 16, e2483. [Google Scholar] [CrossRef]
- Nong, X.; Shao, D.; Zhong, H.; Liang, J. Evaluation of Water Quality in the South-to-North Water Diversion Project of China Using the Water Quality Index (WQI) Method. Water Res. 2020, 178, 115781. [Google Scholar] [CrossRef]
- Ferreira, C.S.S.; Kašanin-Grubin, M.; Solomun, M.K.; Sushkova, S.; Minkina, T.; Zhao, W.; Kalantari, Z. Wetlands as Nature-Based Solutions for Water Management in Different Environments. Curr. Opin. Environ. Sci. Health 2023, 33, 100476. [Google Scholar] [CrossRef]


| i | Subi | wi |
|---|---|---|
| 1 | Fecal coliforms | 0.15 |
| 2 | pH | 0.12 |
| 3 | BOD5 | 0.10 |
| 4 | Nitrates | 0.10 |
| 5 | Phosphates | 0.10 |
| 6 | Temperature change | 0.10 |
| 7 | Turbidity | 0.08 |
| 8 | Total dissolved solids | 0.08 |
| 9 | Dissolved oxygen | 0.17 |
| WQI Range | Classification | Color |
|---|---|---|
| (0 < WQI ≤ 25) | Very poor | Black |
| (26 < WQI ≤ 50) | Poor | Red |
| (51 < WQI ≤ 70) | Regular | Yellow |
| (71 < WQI ≤ 90) | Good | Green |
| (91 < WQI ≤ 100) | Excellent | Blue |
| Parameters | April (n = 25) | November (n = 27) | WHO 2022 1 | ||
|---|---|---|---|---|---|
| Mean ± SD | Min–Max | Mean ± SD | Min–Max | ||
| Depth (m) | 1.8 ± 0.4 | 1.0–2.1 | 3.5 ± 0.4 | 2.5–4.0 | - |
| Temperature (°C) | 25.8 ± 1.6 | 22.7–28.2 | 22.4 ± 2.1 | 20.0–29.9 | 25 |
| pH | 7.7 ± 0.2 | 7.3–8.0 | 7.6 ± 0.3 | 7.1–8.1 | 6.5-8.5 |
| Conductivity (µS/cm) | 678.0 ± 15.0 | 650.0–700.0 | 387.4 ± 37.2 | 310.0–440.0 | 750 |
| TDS (mg/L) | 334.8 ± 7.7 | 320.0–350.0 | 192.6 ± 17.9 | 160.0–220.0 | 500 |
| DO (mg/L) | 2.7 ± 1.5 | 0.2–5.1 | 4.8 ± 1.6 | 2.3–10.1 | 5-8 |
| Color (Units) | 515.6 ± 148.1 | 311.1–1014.8 | 503.8 ± 298.2 | 274.1–1922.2 | - |
| Turbidity (UTN) | 34.6 ± 10.1 | 17.1–61.0 | 26.5 ± 7.0 | 16.8–53.5 | 5 |
| Hardness (mg/L) | 196.8 ± 3.5 | 192.0–203.0 | 72.1 ± 11.6 | 49.0–93.0 | - |
| Alkalinity (mg/L) | 304.4 ± 7.3 | 294.0–324.0 | 36.7 ± 4.4 | 25.0–44.0 | - |
| TSS (mg/L) | 56.1 ± 2.4 | 52.5–62.5 | 55.6 ± 28.9 | 50.0–200.0 | - |
| Cl− (mg/L) | 0.05 ± 0.04 | 0.01–0.2 | 0.01 ± 0.02 | ND–0.1 | 250 |
| NH4+ (mg/L) | 0.3 ± 0.1 | 0.2–0.5 | 0.2 ± 0.1 | ND–0.6 | - |
| NO2− (mg/L) | 0.01 ± 0.01 | ND–0.02 | 0.01 ± 0.01 | ND–0.1 | - |
| NO3− (mg/L) | ND ± ND | ND–ND | ND ± ND | ND–ND | 45 |
| N (mg/L) | 2.0 ± 0.1 | 2.0–2.4 | 2.0 ± 0.0 | 2.0–2.0 | - |
| P (mg/L) | 0.7 ± 0.2 | 0.3–1.3 | 2.9 ± 4.7 | ND–15.0 | - |
| PO43− (mg/L) | 2.1 ± 0.7 | 0.7–3.8 | 8.8 ± 14.5 | 0.1–46.0 | - |
| Orthophosphates (mg/L) | 1.8 ± 0.2 | 1.6–2.5 | 0.4 ± 0.1 | 0.3–0.6 | - |
| SO42− (mg/L) | 29.9 ± 2.5 | 25.0–35.0 | 25.7 ± 6.0 | 10.0–40.0 | 250 |
| BOD5 (mg/L) | 29.7 ± 9.7 | 16.4–46.9 | 23.4 ± 21.2 | 8.0–116.2 | 5 |
| COD (mg/L) | 55.8 ± 11.38 | 37.4–84.2 | 47.0 ± 38.9 | 9.4–187.2 | 3 |
| TC (NMP/100 mL) | 2400.0 ± 0.0 | 2400.0–2400.0 | 1607.7 ± 1084.9 | 15.0–2400.0 | - |
| FC (NMP/100 mL) | 320.8 ± 784.6 | 9.0–2400.0 | 1550.8 ± 1089.6 | 7.0–2400.0 | 2500 |
| Parameters (µg/L) | April (n = 25) | November (n = 27) | ||
|---|---|---|---|---|
| Mean ± SD | Min–Max | Mean ± SD | Min–Max | |
| Li | 14.3 ± 12.2 | ND–40.5 | 7.6 ± 1.6 | 6.0–11.5 |
| Be | 0.05 ± 0.02 | 0.02–0.08 | 0.05 ± 0.02 | 0.02–0.14 |
| Mg | 18,856.7 ± 1192.4 | 16,188.6–20,698.5 | 9542.2 ± 1239.9 | 7356.8–11654.9 |
| K | 26,133.2 ± 715.0 | 24,801.0–27,439.5 | 15,839.0 ± 1482.1 | 12,325.6–18,159.4 |
| V | 3.5 ± 0.9 | 2.0–5.6 | 4.1 ± 1.1 | 2.7–8.2 |
| Cr | 0.4 ± 0.3 | 0.2–1.9 | 0.4 ± 0.6 | 0.1–3.5 |
| Mn | 46.0 ± 21.3 | 14.9–128.3 | 29.2 ± 14.8 | 15.0–78.0 |
| Co | 0.3 ± 0.1 | 0.2–0.5 | 0.2 ± 0.1 | 0.2–0.6 |
| Ni | 2.1 ± 1.1 | 1.0–5.5 | 2.0 ± 1.0 | 1.0–4.6 |
| Cu | 2.5 ± 3.0 | 0.7–15.4 | 1.6 ± 1.5 | 0.6–7.1 |
| Zn | 9.8 ± 9.1 | ND–27.7 | 8.6 ± 9.8 | ND–39.4 |
| Ga | 0.04 ± 0.03 | 0.01–0.10 | 0.02 ± 0.02 | 0.01–0.09 |
| As | 6.3 ± 0.3 | 5.5–6.6 | 3.3 ± 0.5 | 2.1–3.9 |
| Se | 4.2 ± 0.8 | 2.7–5.4 | 1.5 ± 0.3 | 1.0–2.2 |
| Ag | 0.02 ± 0.01 | 0.01–0.03 | 0.01 ± 0.01 | ND–0.03 |
| Cd | 0.1 ± 0.1 | ND–0.4 | 0.1 ± 0.2 | ND–0.7 |
| Ba | 222.5 ± 11.6 | 204.4–263.9 | 130.3 ± 12.2 | 102.9–160.6 |
| Pb | 2.0 ± 2.5 | ND–7.9 | 2.4 ± 3.2 | ND–13.0 |
| U | 0.3 ± 0.04 | 0.2–0.4 | 0.2 ± 0.03 | 0.2–0.3 |
| Parameters | p-Value |
|---|---|
| Fecal coliforms | 2.55 × 10⁻⁵ * |
| pH | 0.04 * |
| BOD5 | 0.23 |
| Nitrates | 0.36 |
| Phosphates | 0.02 * |
| Temperature change | 3.47 × 10⁻⁸ * |
| Turbidity | 0.001 * |
| Total dissolved solids | 7.95 × 10−38 ** |
| Dissolved oxygen | 2.06 × 10⁻⁵ * |
Disclaimer/Publisher’s Note: The statements, opinions and data contained in all publications are solely those of the individual author(s) and contributor(s) and not of MDPI and/or the editor(s). MDPI and/or the editor(s) disclaim responsibility for any injury to people or property resulting from any ideas, methods, instructions or products referred to in the content. |
© 2025 by the authors. Licensee MDPI, Basel, Switzerland. This article is an open access article distributed under the terms and conditions of the Creative Commons Attribution (CC BY) license (https://creativecommons.org/licenses/by/4.0/).
Share and Cite
López-Gutiérrez, J.M.; Ramírez-Mosqueda, E.; Cea-Barcia, G.E.; Ruiz-Aguilar, G.M.L.; Castro-Ramírez, I.; Camarena-Martínez, S.; Ilizaliturri-Hernández, C.A.; Rocha-Amador, D.O.; Costilla-Salazar, R. A Comparative Assessment of Surface Water Quality in Lake Yuriria, Guanajuato, Using the Water Quality Index. Water 2025, 17, 1825. https://doi.org/10.3390/w17121825
López-Gutiérrez JM, Ramírez-Mosqueda E, Cea-Barcia GE, Ruiz-Aguilar GML, Castro-Ramírez I, Camarena-Martínez S, Ilizaliturri-Hernández CA, Rocha-Amador DO, Costilla-Salazar R. A Comparative Assessment of Surface Water Quality in Lake Yuriria, Guanajuato, Using the Water Quality Index. Water. 2025; 17(12):1825. https://doi.org/10.3390/w17121825
Chicago/Turabian StyleLópez-Gutiérrez, Juan Manuel, Elizabeth Ramírez-Mosqueda, Glenda Edith Cea-Barcia, Graciela M. L. Ruiz-Aguilar, Israel Castro-Ramírez, Sarai Camarena-Martínez, César Arturo Ilizaliturri-Hernández, Diana Olivia Rocha-Amador, and Rogelio Costilla-Salazar. 2025. "A Comparative Assessment of Surface Water Quality in Lake Yuriria, Guanajuato, Using the Water Quality Index" Water 17, no. 12: 1825. https://doi.org/10.3390/w17121825
APA StyleLópez-Gutiérrez, J. M., Ramírez-Mosqueda, E., Cea-Barcia, G. E., Ruiz-Aguilar, G. M. L., Castro-Ramírez, I., Camarena-Martínez, S., Ilizaliturri-Hernández, C. A., Rocha-Amador, D. O., & Costilla-Salazar, R. (2025). A Comparative Assessment of Surface Water Quality in Lake Yuriria, Guanajuato, Using the Water Quality Index. Water, 17(12), 1825. https://doi.org/10.3390/w17121825