Article

Spatiotemporal Dynamics of Nitrogen and Phosphorus in the Water and Sediment from the Source Reservoir of the Mid-Route of China’s South-to-North Water Diversion Project

1
Henan Academy of Fishery Sciences, Zhengzhou 450044, China
2
Centre for Research on Environmental Ecology and Fish Nutrition of the Ministry of Agriculture, Shanghai Ocean University, Shanghai 201306, China
3
National Demonstration Center for Experimental Fisheries Science Education, Shanghai Ocean University, Shanghai 201306, China
*
Authors to whom correspondence should be addressed.
These authors contributed equally to this work.
Water 2025, 17(12), 1824; https://doi.org/10.3390/w17121824
Submission received: 19 May 2025 / Revised: 15 June 2025 / Accepted: 16 June 2025 / Published: 18 June 2025
(This article belongs to the Section Water Quality and Contamination)

Abstract

To investigate the spatiotemporal distribution characteristics of nitrogen and phosphorus in the water and sediment of the Danjiangkou Reservoir, the source of the Middle Route of China’s South-to-North Water Diversion Project, we designed a year-long monitoring program. The water and sediment samples were collected from 13 sampling points in the upstream and downstream areas over the year. The results revealed significant spatial heterogeneity in N and P concentrations, with higher levels of total nitrogen, nitrate nitrogen, and nitrite nitrogen in the upstream area compared to the downstream area (p < 0.01). Total phosphorus was also significantly higher in the upstream area (p < 0.05). Seasonal variations were observed, with TN and TP levels peaking in February and August, respectively. The TN:TP ratio indicated a severe P-limited state in most periods, transitioning to a co-limited state of N and P during summer. Sediment analysis showed that TN and TP concentrations were higher in the upstream area, with no significant differences between upstream and downstream on an annual basis, exhibiting strong stoichiometric internal stability. However, seasonal differences were noted, particularly in February and November. This study highlights the complex interactions between water and sediment, emphasizing the role of sediment resuspension, water flow, and seasonal changes in nutrient dynamics. These findings provide a scientific basis for the management and protection of water quality in the Danjiangkou Reservoir, ensuring its role as a critical water source for the South-to-North Water Diversion Project.

1. Introduction

Nitrogen (N) and phosphorus (P) are crucial elements in lake and reservoir ecosystems. Nitrogen is the fundamental element for biological processes, while phosphorus significantly influences the primary productivity and trophic levels of the system. It is generally believed that nitrogen is the limiting factor in marine systems, while phosphorus is the limiting factor in freshwater eutrophication [1,2]. Over the past three decades, the accelerated urbanization process and rapid industrial and agricultural development in China have led to substantial discharges of untreated sewage or industrial waste containing nitrogen and phosphorus into aquatic systems through surface runoff. This nutrient loading has triggered excessive algal growth, resulting in oxygen-depleted conditions, mass mortality of aquatic organisms, and severe impacts on aquatic ecosystems. Long-term monitoring data have revealed that the total nitrogen and total phosphorus in the lakes of the most densely populated Yangtze River middle and lower reaches exceed the standard in many cases. This chronic nutrient pollution has caused frequent algal blooms, reduced water transparency, and elevated eutrophication risks [3].
Sediment, also known as “bottom sludge,” serves as a critical repository for materials in lakes and plays a crucial role as a “sink” or “source” within the material cycle of the entire lake system, which is of great significance to the health of lake and reservoir ecosystems [4]. The release of nitrogen and phosphorus from sediment into the overlying water is an important component of the biogeochemical cycle, directly impacting the aquatic environment [5]. In many lakes in China, nitrogen and phosphorus are enriched in sediment, with the total nitrogen ranging from 122 to 9559 mg/kg and the total phosphorus ranging from 96 to 2906 mg/kg [6,7,8,9,10]. According to the widely accepted guidelines issued by the Ministry of Environment and Energy of Ontario, Canada, in 1992, the threshold values of total nitrogen (TN) and total phosphorus (TP) in sediment to cause the lowest level of ecological risk effects are 550 mg/kg and 600 mg/kg, respectively [11]. It can be inferred that most lake sediment in China currently faces a high level of ecological and environmental risk.
The Danjiangkou Reservoir (32°36′–33°48′ N, 110°59′–111°49′ E) is located in the middle–upper reaches of the Han River, the largest tributary of the Yangtze River. Formed after the closure of the Danjiangkou Dam in 1973, it spans across Henan and Hubei provinces, covering a water area of 1050 km2 with an average depth of 28 m. As the water source for the middle route of the South-to-North Water Diversion Project, it serves multiple roles, including flood control, irrigation, power generation, tourism, and municipal water supply. The water quality of the reservoir critically influences both the biodiversity and ecological balance of the surrounding environment and broader regional priorities: supporting regional economic prosperity, improving national water resource allocation, and safeguarding strategic initiatives like the Beijing–Tianjin–Hebei region. With a storage capacity of 29.05 billion m3 at a water level of 170 m, an annual inflow of 39.48 billion m3, and an annual water transfer volume of about 9.5 billion m3, the vast volume of water exchange poses a significant challenge to water quality management. In recent years, government departments have ensured stable and safe water quality through strengthening water source protection, strictly monitoring water quality, enhancing sewage treatment, promoting ecological restoration, and strengthening collaborative management. However, economic development and population pressures continue to threaten the water quality of the Danjiangkou Reservoir, where non-point source pollution and internal loading (sediment release) remain primary concerns. This study, through a one-year tracking and monitoring of the chemical characteristics of nitrogen and phosphorus in the water and sediment of the Henan area of the Danjiangkou Reservoir, provides a comprehensive understanding of the variation in nitrogen and phosphorus nutrients during dynamic water regulation. We also explore the interactions between the water and sediment, aiming to provide a scientific theoretical basis for water quality protection and reservoir management.

2. Materials and Methods

2.1. Study Area

The Danjiangkou Reservoir is composed of the Han Reservoir in Hubei Province and the Dan Reservoir in Henan Province, making it the second-largest artificial lake-type reservoir in China. This study selected the Dan Reservoir in Henan Province as the research object, with a water area of about 506 km2 and the water level maintained between 157 and 170 m throughout the year (Figure 1).

2.2. Collection and Determination of Water and Sediment Samples

Samples were collected in February (winter), May (spring), August (summer), and November (fall) in the Dan Reservoir. A total of 13 sampling points were selected, including 4 in the upstream reservoir (S10–S13) and 9 in the downstream reservoir (S1–S9). Water samples were collected using acrylic glass samplers at 0 m, 4 m, 12 m, 16 m, and 20 m depths, with a volume of 500 mL each, and taken back to the laboratory for the determination of total nitrogen (TN), total phosphorus (TP), ammonium nitrogen (NH4+-N), nitrate nitrogen (NO3-N), and nitrite nitrogen (NO2-N). The determination of TN was carried out according to the alkaline potassium persulfate ultraviolet spectrophotometric method [12], the determination of TP was carried out according to the potassium persulfate digestion molybdate spectrophotometric method [13], and the determination of NH4+-N, NO3-N, and NO2-N was carried out according to GB3838-2002 [14].
While collecting water samples, a Petersen sediment sampler was used to collect surface sediment samples (0–15 cm) from each sampling point. The sediment samples were visually inspected and stored in sealed bags, marked, and then taken back to the laboratory at low temperature. The sediment samples were dried at 60 °C in an oven until constant weight and then sieved through a 60-mesh sieve. The determination of TN and TP content in sediment samples was completed at the Agricultural Product Quality Supervision and Test Center of the Ministry of Agriculture and Rural Affairs (Zhengzhou), with the determination of TN according to the method of NY/T 53-1987 [15] and the determination of TP according to GB 5009.87-2016 [16].
The water level data were obtained from the Yangtze River Hydrology Network (http://www.cjh.com.cn/), and the rainfall data were provided by the Xichuan County Meteorological Bureau.

2.3. Statistical Analysis

Preliminary statistical analysis of the data was performed using Excel 2010. t-tests and one-way ANOVA were conducted on the data using SPSS 22.0, and correlation analysis was carried out and relevant graphs were plotted using Origin 2019b.

3. Results and Analysis

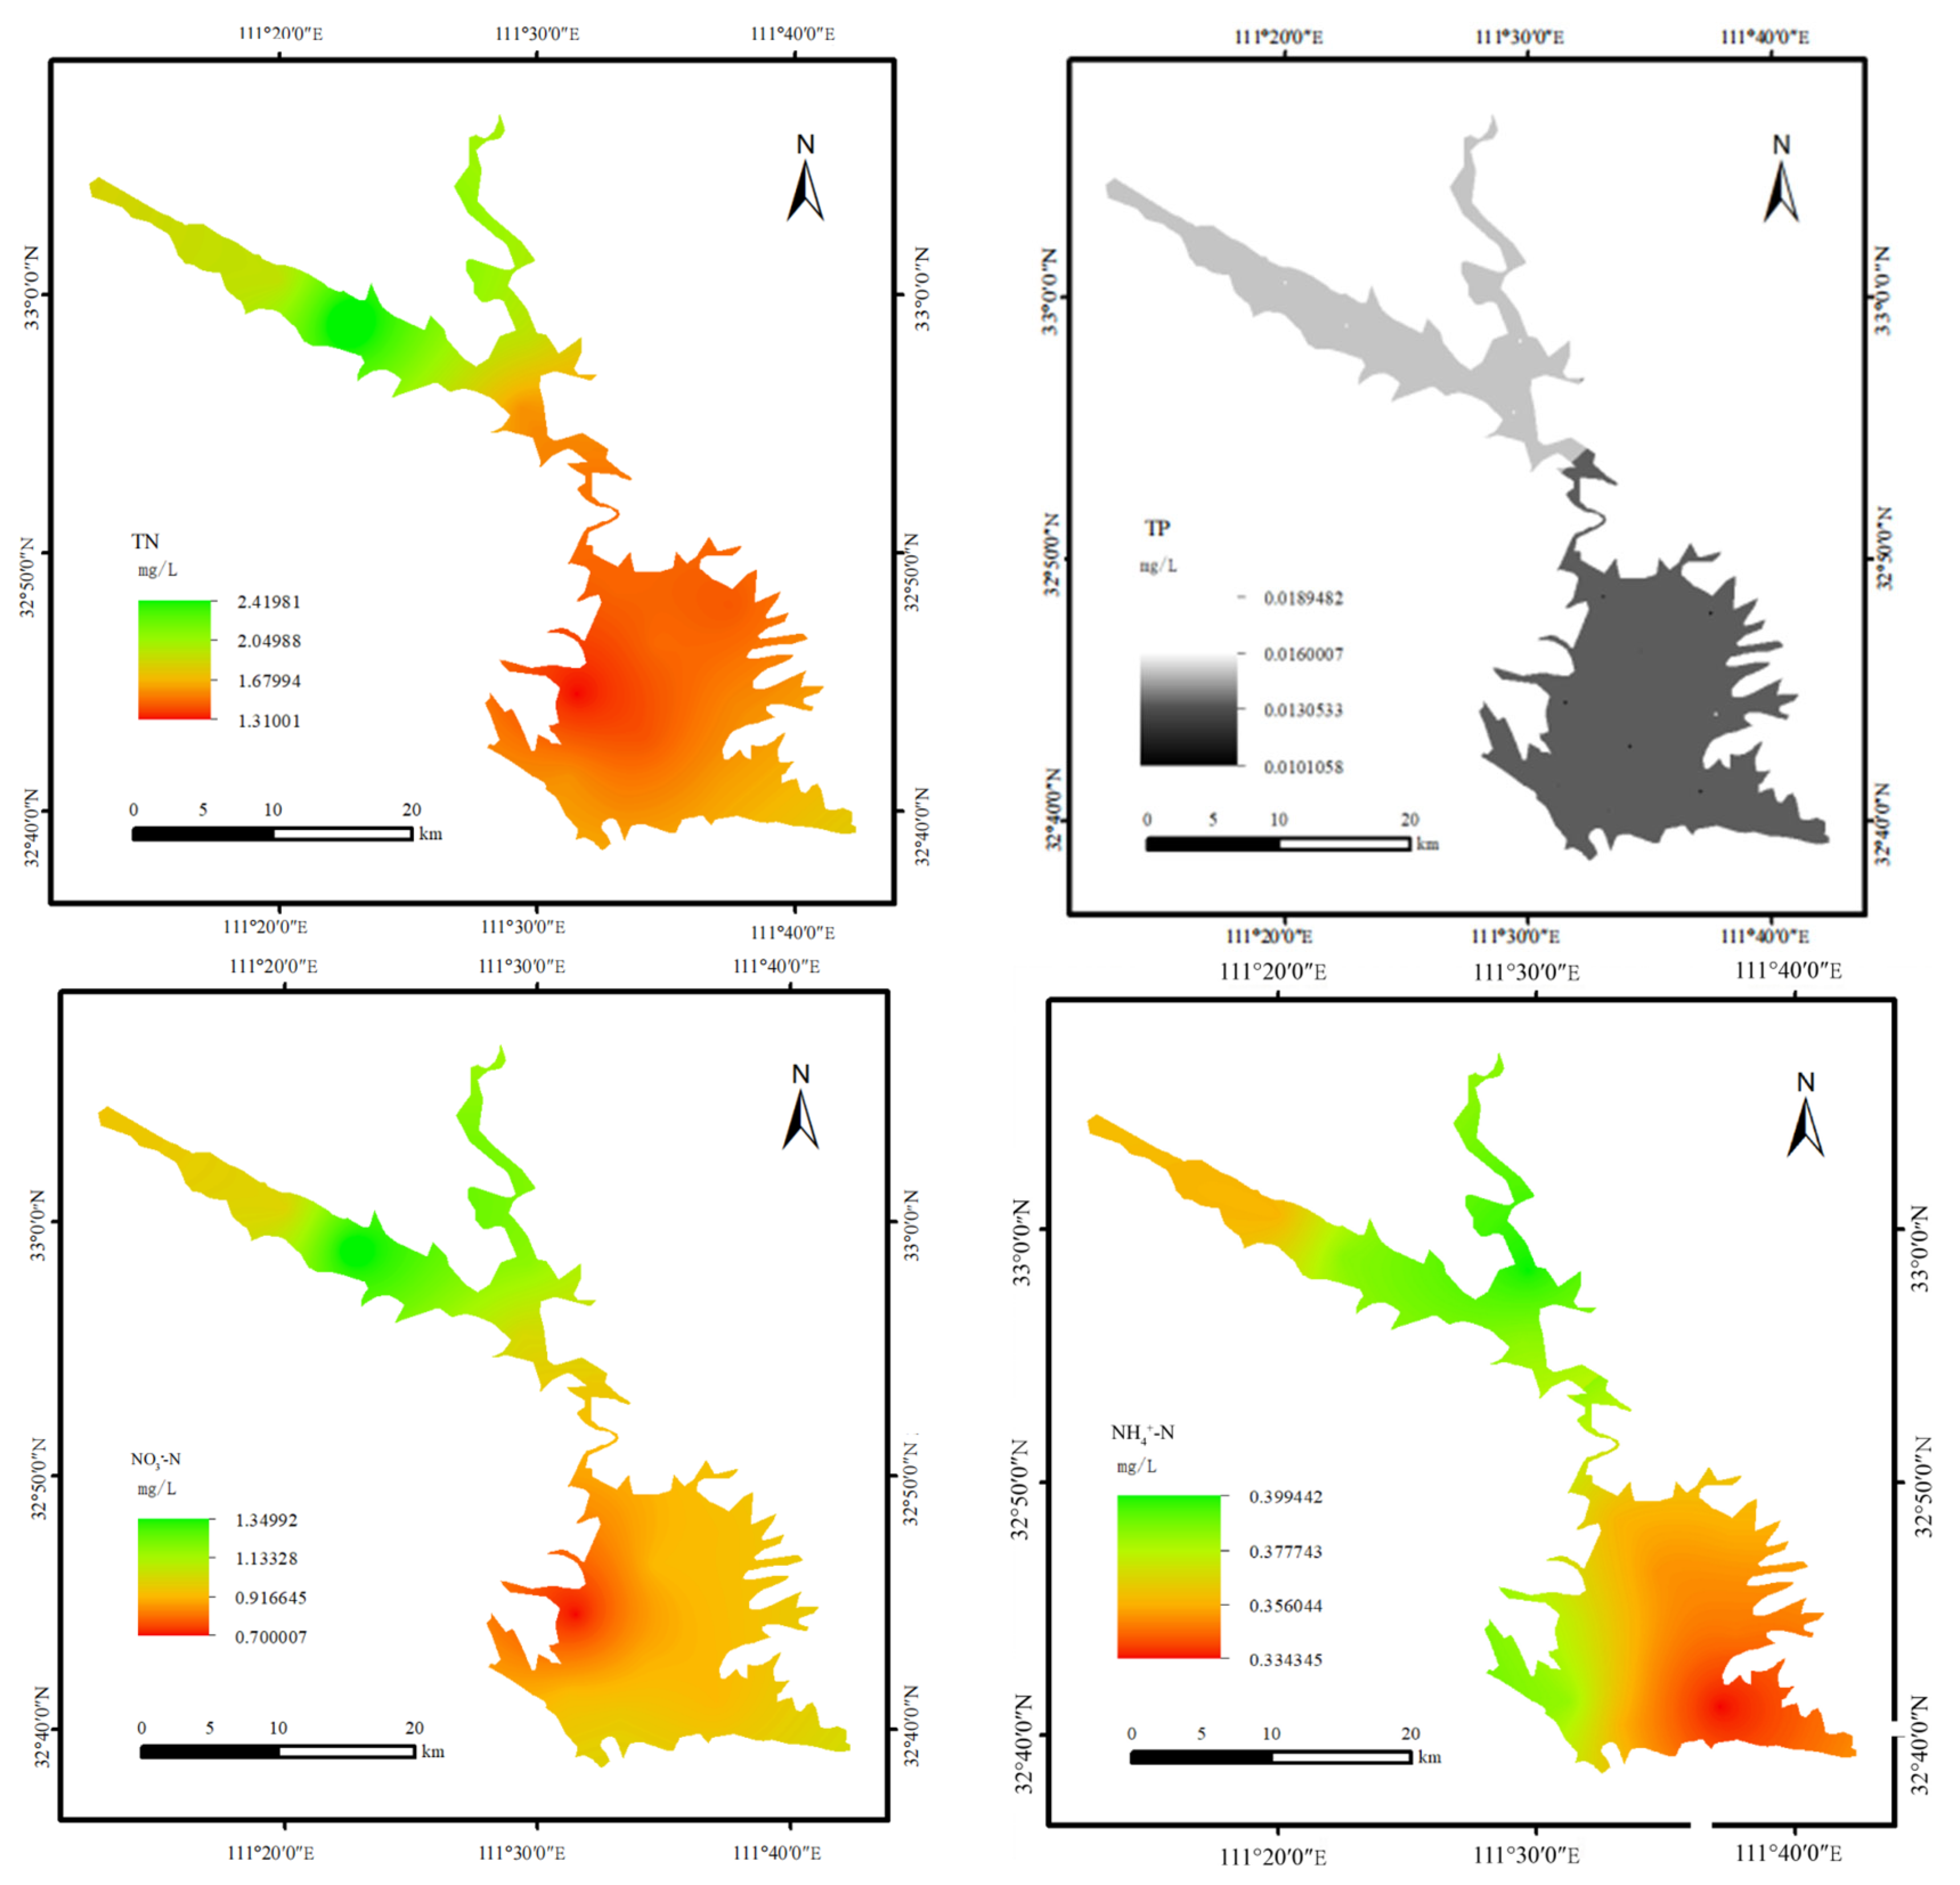
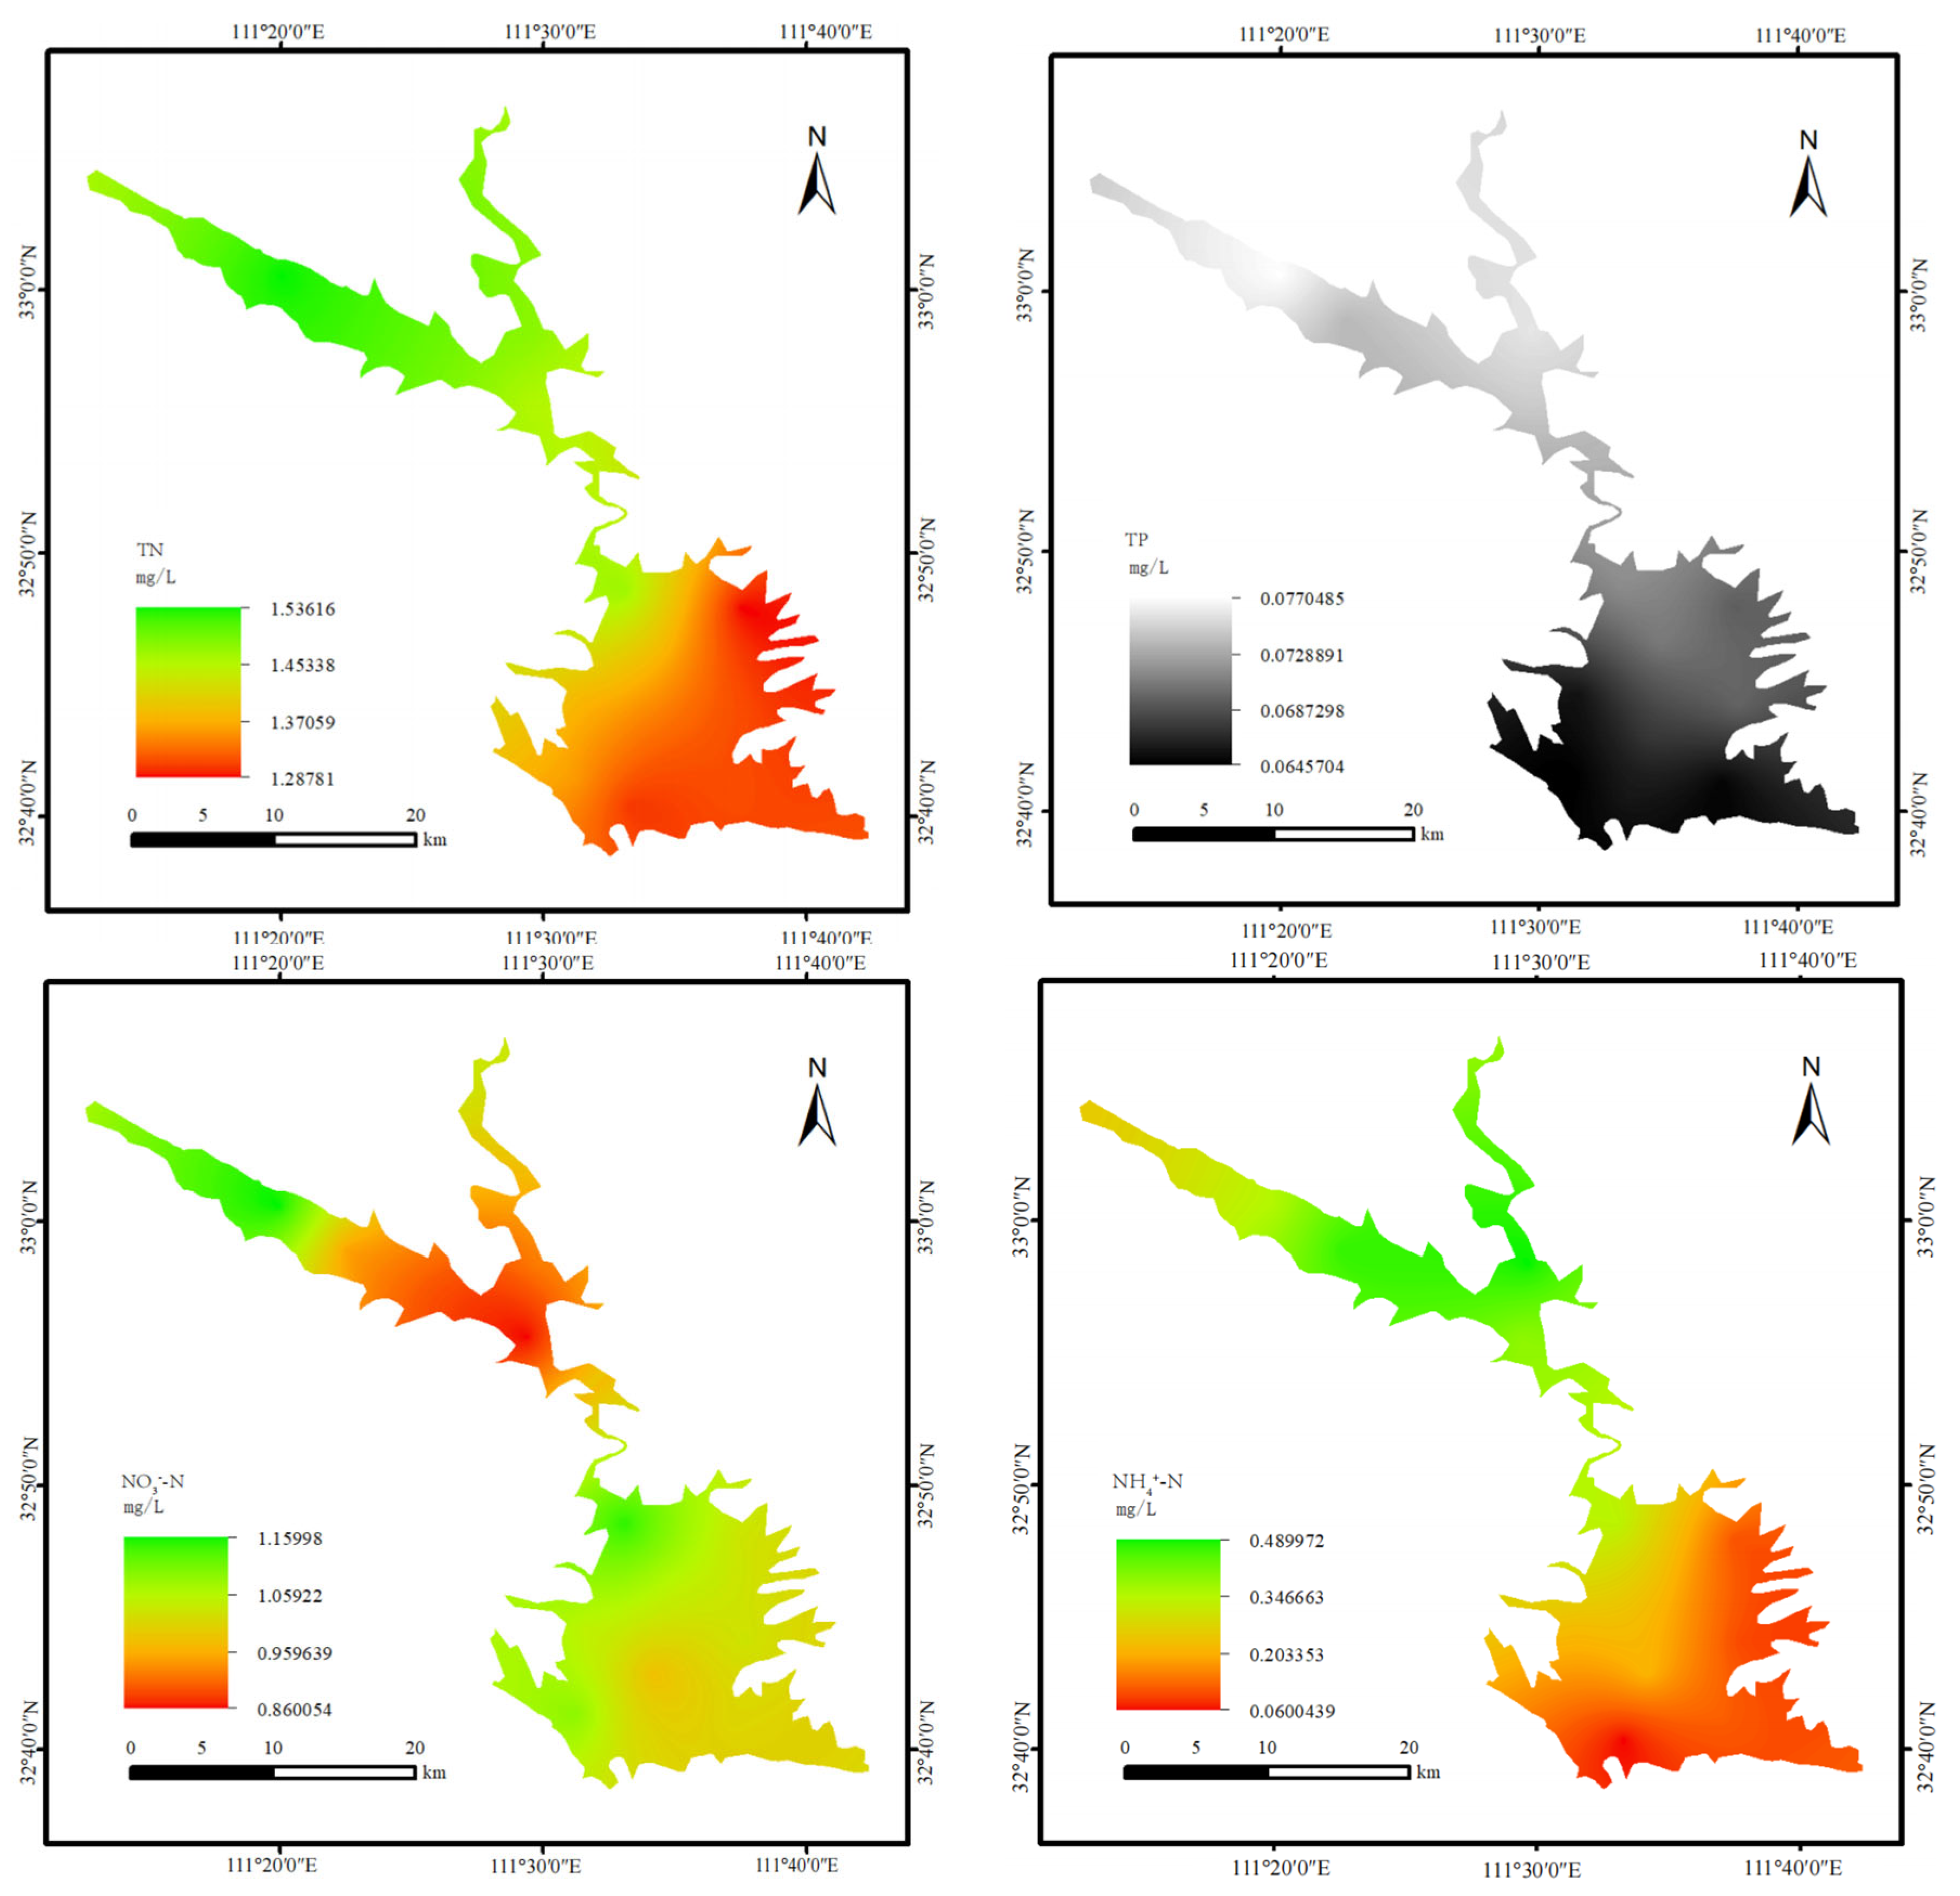
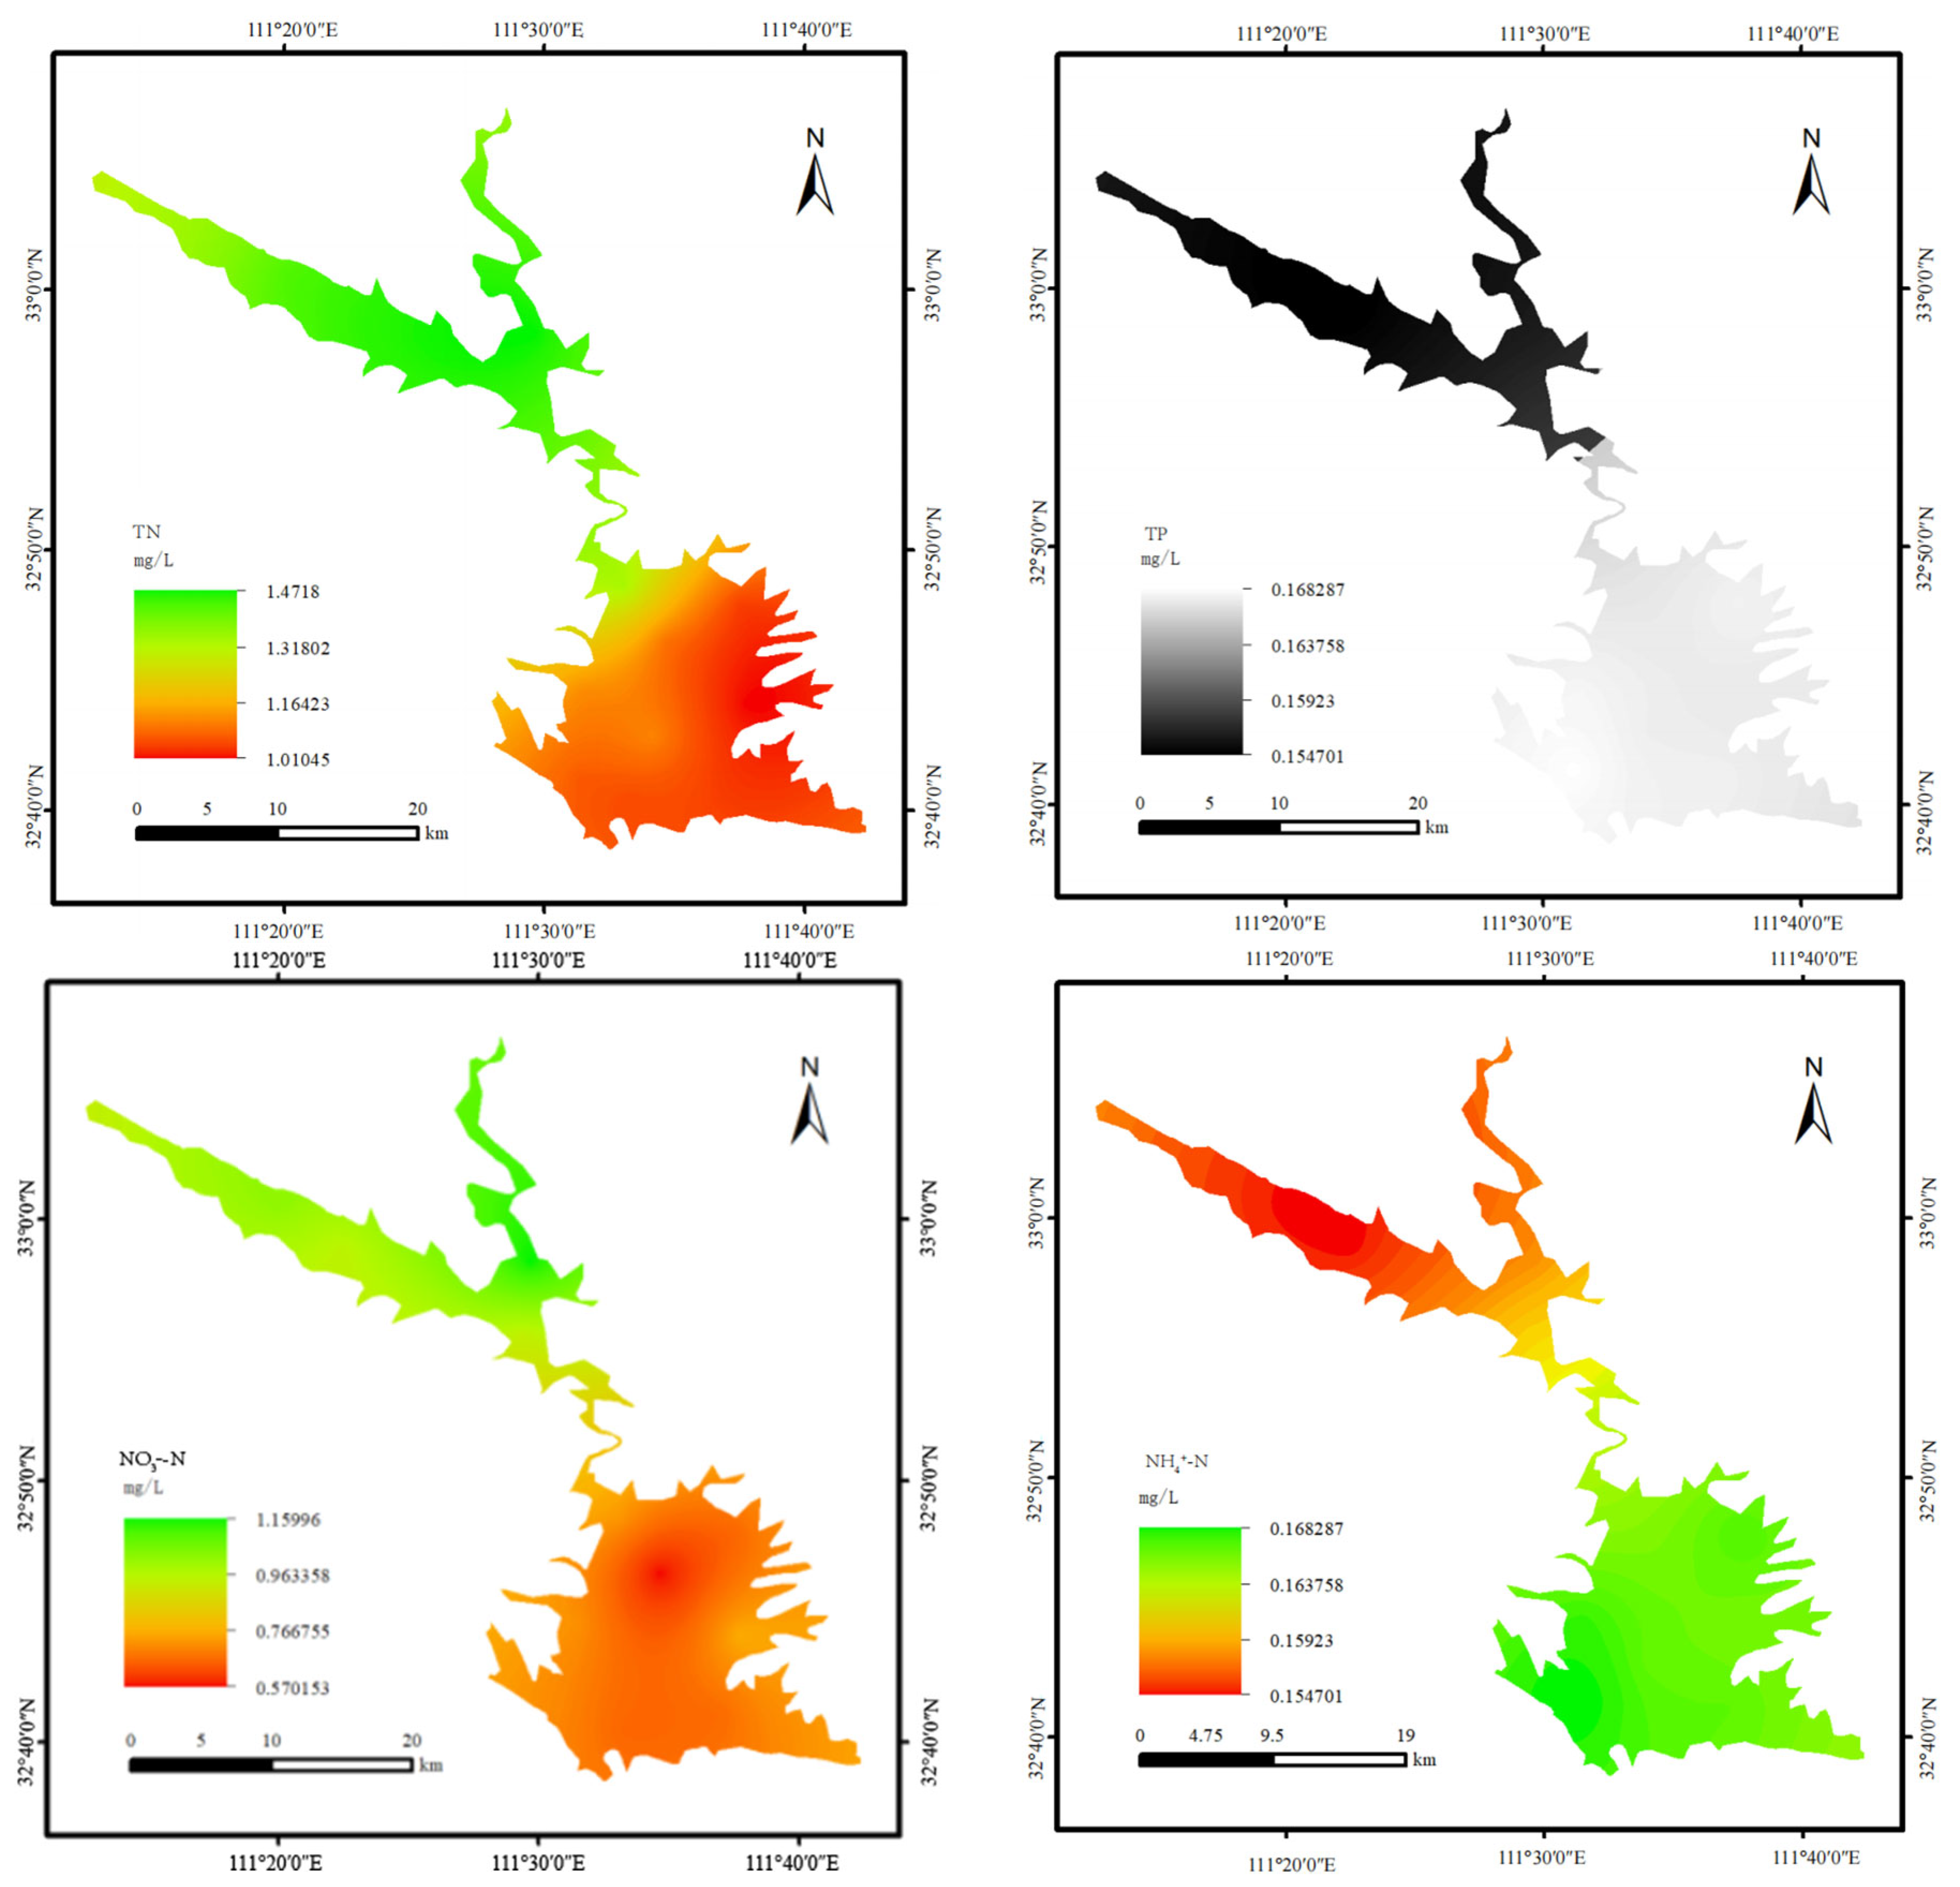
3.1. Temporal and Spatial Characteristics of Nitrogen and Phosphorus in Water

As shown in Figure 2, Figure 3, Figure 4 and Figure 5, from a spatial perspective, a distinct spatial gradient emerged, with nitrogen and phosphorus concentrations gradually increasing from downstream to upstream areas in the Dan Reservoir. TN (1.59 ± 0.28 mg/L), NH4+-N (0.25 ± 0.17 mg/L), NO3-N (1.07 ± 0.14 mg/L), and NO2-N (0.026 ± 0.014 mg/L) in the upstream reservoir area were significantly higher than those in the downstream area (p < 0.01). TP (0.057 ± 0.04 mg/L) in the upstream reservoir area was significantly higher than that in the upstream area (p < 0.05). Further comparisons of the water environment in the upstream and downstream reservoirs for each season showed that, in February, TN, NO3-N, and NO2-N in the upstream reservoir were significantly higher than in the downstream reservoir (p < 0.01); in May, NO3-N and NO2-N in the upstream reservoir were significantly higher than in the downstream reservoir (p < 0.01), and TP was significantly higher in the upstream reservoir (p < 0.05); in August, NO2-N and NH4+-N in the upstream reservoir were significantly higher than in the downstream reservoir (p < 0.01), and TN and TP were significantly higher in the upstream reservoir (p < 0.05); and in November, TN in the upstream reservoir was significantly higher than in the downstream reservoir (p < 0.05), and NO3-N was significantly higher in the upstream reservoir (p < 0.01). This indicated that there was a significant spatial heterogeneity in nitrogen and phosphorus in the water of the Dan reservoir, and seasonal variations further strengthened the spatial differences between upstream and downstream.
From a time scale perspective, the Dan Reservoir exhibited significant seasonal variations in nitrogen and phosphorus concentrations. TN reached its peak in February (1.96 ± 0.29 mg/L), which was a highly significant difference compared to May and November (p < 0.01) and a significant difference versus August (p < 0.05). No significant differences were observed among May (1.25 ± 0.22 mg/L), August (1.39 ± 0.12 mg/L), and November (1.21 ± 0.31 mg/L). TP reached its maximum in August (0.07 ± 0.006 mg/L), while TP in February was the lowest (0.013 ± 0.002 mg/L), significantly lower than that in May (p < 0.05) and highly significantly lower than that in August/November (p < 0.01). TP (0.04 ± 0.02 mg/L) in May was highly significantly lower than that in August but showed no difference compared to November (0.05 ± 0.03 mg/L). No statistical difference existed in TP between August and November.
The TN:TP ratio in the Dan Reservoir exhibited significant seasonal variation but no spatial differentiation. Spatially, no statistical difference existed between upstream (53.28 ± 51.2) and downstream (58.9 ± 42.8) (p > 0.05). Temporally, the ratio peaked in February (127.87 ± 21.09), showing highly significant differences versus all other months (p < 0.01). While May (44.4 ± 16.11) and November (36.43 ± 18.66) demonstrated no significant difference, both were highly significantly higher than that in August (19.97 ± 1.61; p < 0.01). August exhibited the lowest ratio.

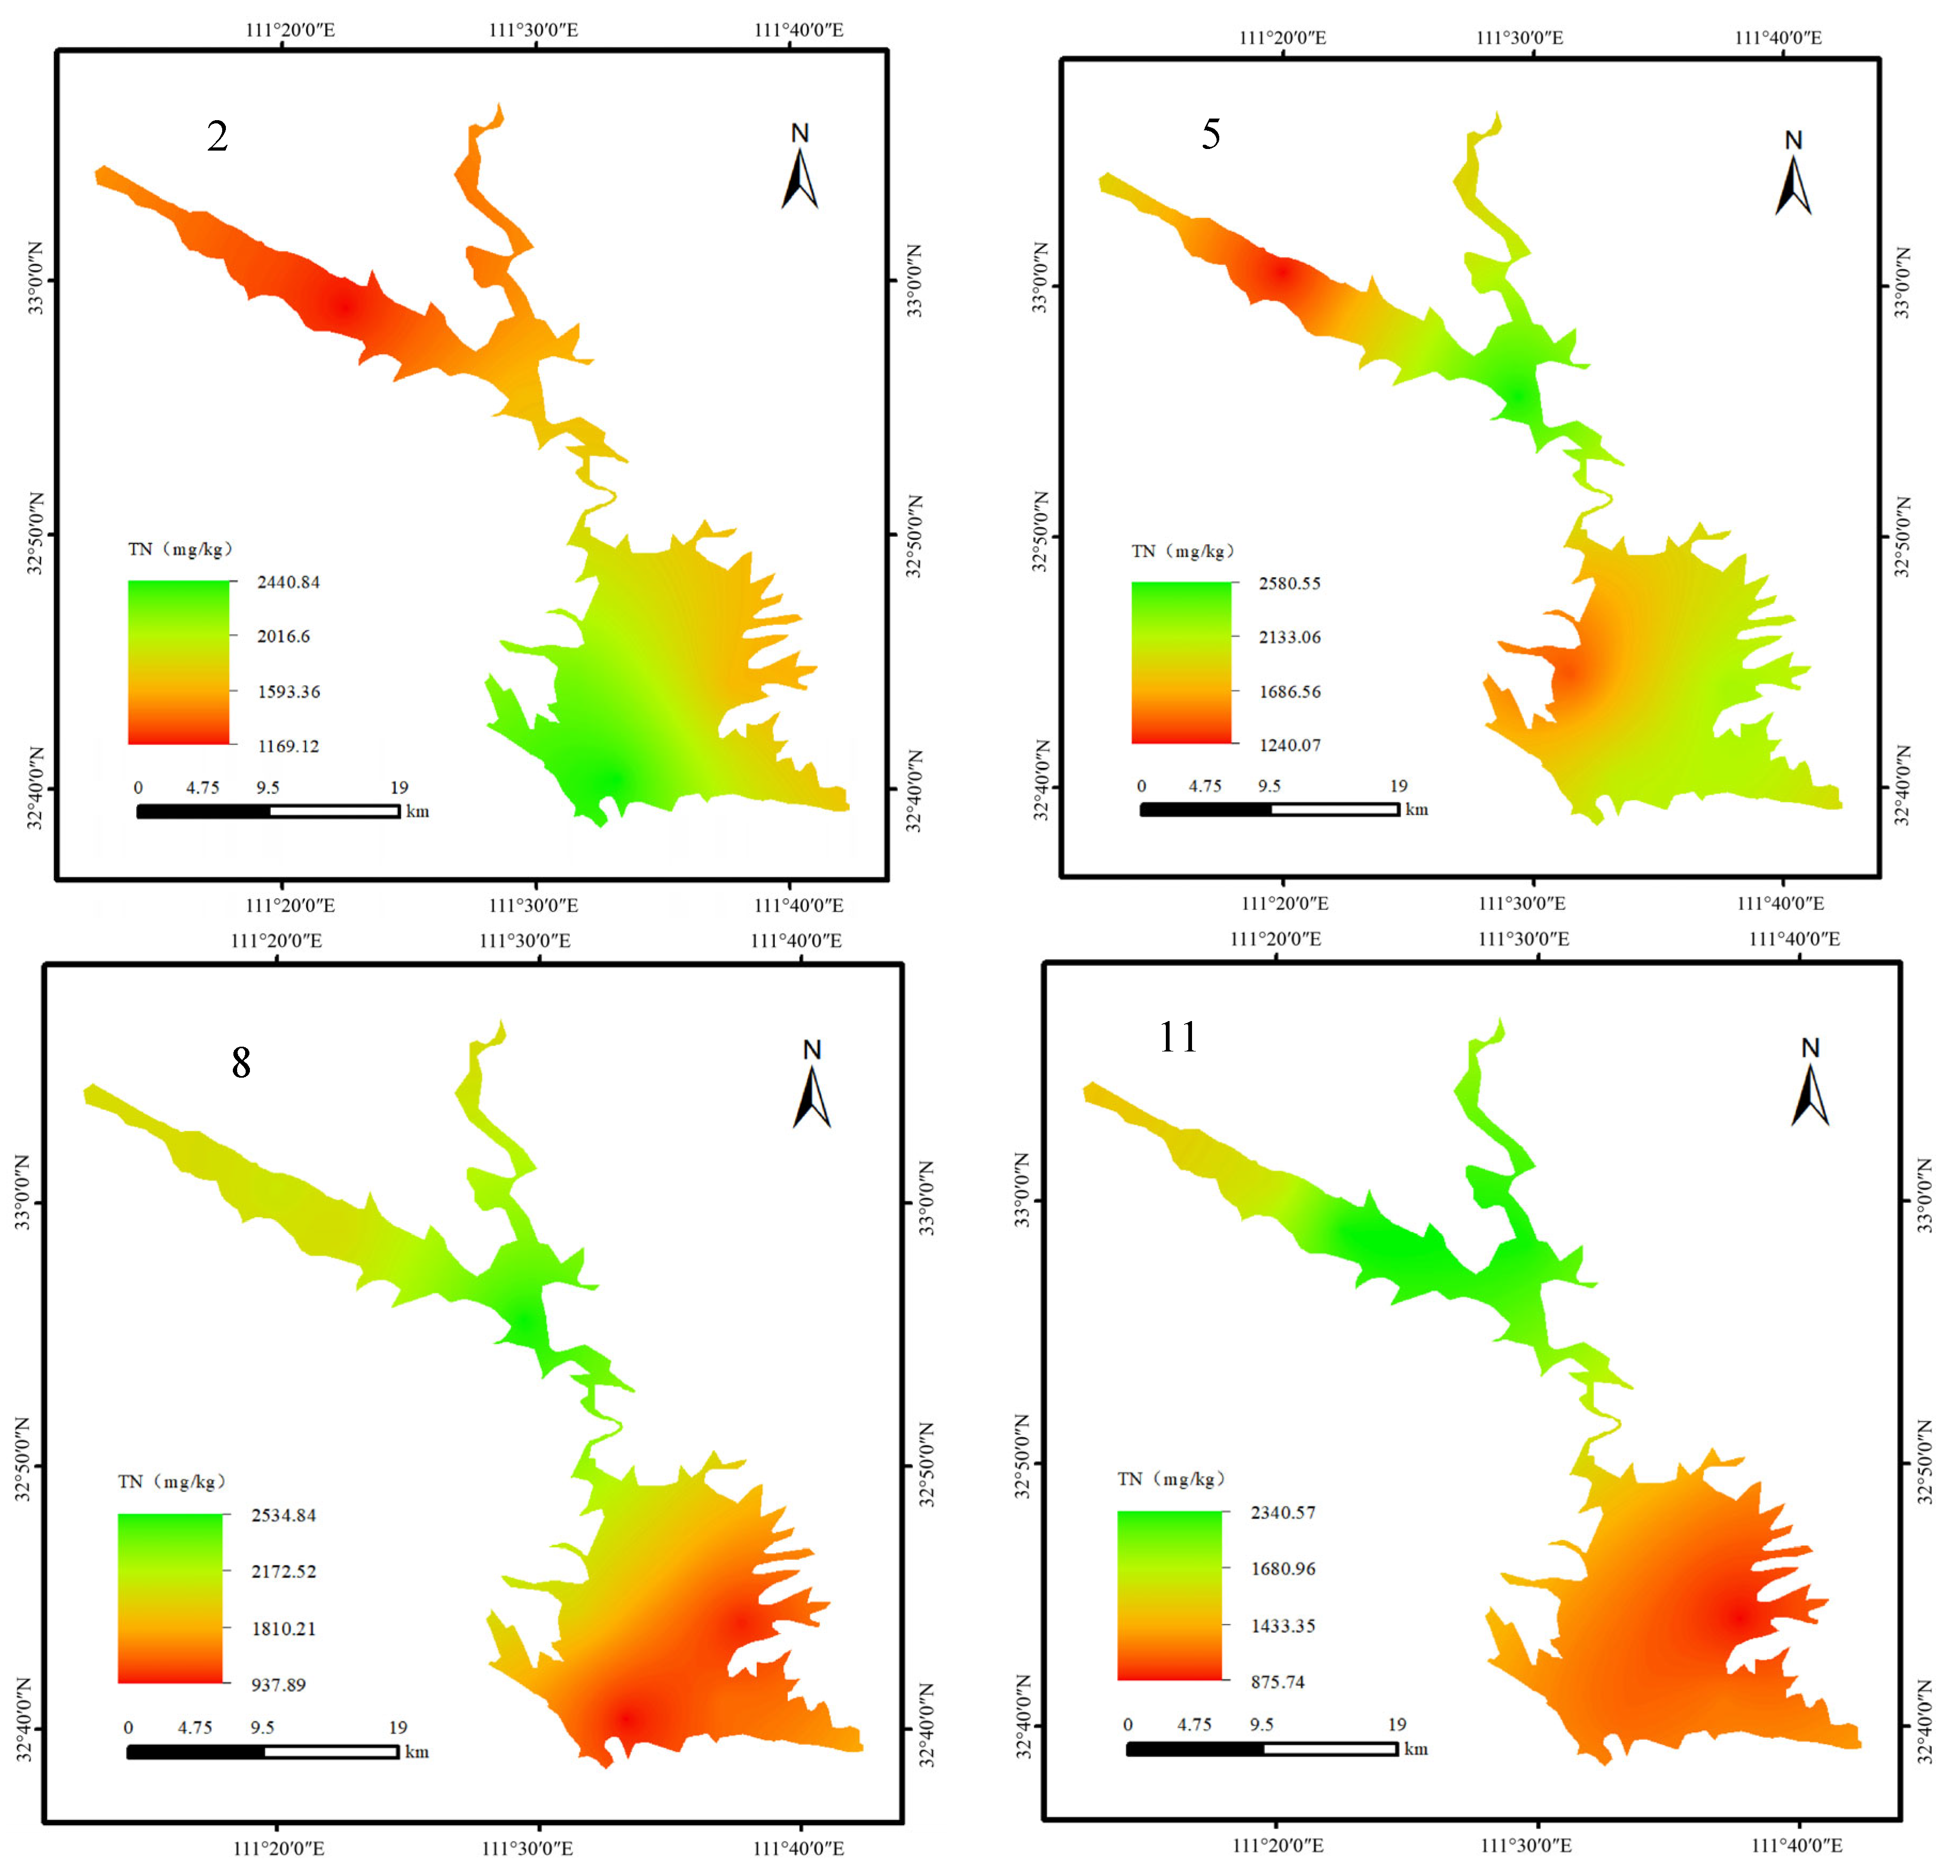
3.2. Nitrogen and Phosphorus Spatiotemporal Characteristics in Sediment

From the spatial perspective, the annual average values of TN and TP in sediment of the upstream reservoir were (1855 ± 587 mg/kg) and (660 ± 141 mg/kg) respectively, which were higher than those in sediment of the downstream reservoir (TN: 1680 ± 532 mg/kg, TP: 580 ± 131 mg/kg). t-tests were conducted on TN, TP, and TN:TP in the upstream and downstream reservoirs. The results indicated that there were no statistically significant differences in TN, TP, and TN:TP of the sediment between the upstream and downstream reservoir, showing a certain degree of homeostasis. Further comparisons of the N and P characteristics in the sediment of each quarter showed that, in February, the TN in the sediment of the downstream reservoir was significantly higher than that in the upstream (p < 0.05); in August, the TP of the upstream reservoir was significantly higher than that in the downstream (p < 0.05); and in November, the TN in the upstream reservoir was significantly higher than that in the downstream (p < 0.05), and the TP was extremely significantly higher than that in the downstream reservoir (p < 0.01) (Figure 6 and Figure 7).
From a temporal perspective, the content of TN in the sediment exhibited a fluctuating trend throughout the year, starting to rise in February (1730 ± 501 mg/kg), reaching its peak in August (1870 ± 784 mg/kg), and then gradually decreasing to its lowest point (1550 ± 563 mg/kg). The content of TP showed a decreasing trend, reaching its highest point in February (650 ± 80 mg/kg) and decreasing to its lowest point in November (590 ± 211 mg/kg). However, there was no significant difference in TN and TP in the four quarters (p > 0.05). The annual variation of TN:TP showed a similar trend to TN, reaching its peak in August and dropping to its lowest point in November, significantly lower than other months (p < 0.05).

3.3. Correlation Analysis of Nitrogen and Phosphorus Characteristics in Water and Sediment

Correlation analysis was conducted on the water environmental factors and sediment TN and TP characteristics of the upstream and downstream reservoir areas of the Dan Reservoir. The results showed that in the upstream reservoir area, the TN:TP ratio in the water had a significant positive correlation with water TN (p < 0.05) and a significant negative correlation with water TP (p < 0.05). The water NO2-N showed a significant negative correlation with water TN (p < 0.05), a significant positive correlation with water TP (p < 0.05), and an extremely significant negative correlation with the water TN:TP ratio (p < 0.01). The water TN showed a significant negative correlation with sediment TN (p < 0.05), sediment TN showed a significant positive correlation with sediment TP (p < 0.05), and an extremely significant positive correlation with sediment TN:TP (p < 0.01). The water level showed a significant positive correlation with sediment TP (p < 0.05) and an extremely significant negative correlation with rainfall (p < 0.01) (Table 1).
In the downstream reservoir area, the water TP showed an extremely significant negative correlation with water TN:TP and NO3-N (p < 0.05). The water NH4+-N showed an extremely significant negative correlation with water TN:TP and water NO2-N (p < 0.01). Sediment TN showed a significant positive correlation with water TN and water NO2-N (p < 0.05) and an extremely significant positive correlation with sediment TN:TP (p < 0.01). Sediment TP showed a significant positive correlation with water TN, water TN:TP, and water NO2-N (p < 0.05) showed an extremely significant positive correlation with sediment TN (p < 0.01). The water level showed a significant negative correlation with water TN, water TN:TP, water NO3-N, and sediment TN (p < 0.05), a significant positive correlation with water TP and water NH4+-N (p < 0.05), and an extremely significant negative correlation with water NO2-N (p < 0.01). Rainfall showed an extremely significant positive correlation with water NO2-N and NO3-N (p < 0.01) and an extremely significant negative correlation with sediment TP (p < 0.01) (Table 2).

4. Discussion

4.1. Distribution Characteristics of Nitrogen and Phosphorus in the Water of the Dan Reservoir

A substantial amount of research has been conducted on the water environmental characteristics of the Danjiangkou Reservoir. Yin et al. [17] analyzed the total phosphorus concentration across the Danjiangkou Reservoir over many years, finding that the TP in the water had been stable at the Class I–II level for nearly a decade. While intense autumn floods can cause a temporary increase in TP, the increase was mainly concentrated in the Han River reservoir, which is related to the fact that the inflow from the Han River accounts for nearly 90% of the total inflow of the reservoir. Yan [18] assessed the water quality of the downstream reservoir area from 2018 to 2020 and found that the DO, TN, TP, NO3-N and CODMn all met the Class I surface water quality evaluation standards. The flow velocity showed a highly significant positive correlation with TN and NO3-N (p < 0.01) and a significant negative correlation with ammonium nitrogen (NH4+-N) (p < 0.05). The flow rate showed a highly significant positive correlation with NO3-N (p < 0.01) and a significant positive correlation with TN (p < 0.05). Geng [19] evaluated the water quality of the Danjiangkou Reservoir from 2010 to 2014 based on conventional indicators, classifying the DO and NH4+-N as Class I, TP as Class II, and TN as Class IV. In the present study, the annual average TN in the upstream and downstream reservoir areas of the Dan Reservoir were 1.58 mg/L and 1.27 mg/L, respectively, which would be classified as Class IV according to the “Surface Water Environmental Quality Standards” (GB3838-2002); the annual average TP in the upstream and downstream reservoir areas were 0.06 mg/L and 0.04 mg/L, respectively, slightly exceeding Class I but remaining stable within Class II; the NH4+-N in the upstream and downstream reservoir areas were 0.25 mg/L and 0.2 mg/L, respectively, meeting Class II standards. However, the single-factor pollution index method cannot fully reflect the state of water quality; comprehensive evaluation requires additional parameters such as pH value, DO, permanganate index, and COD, as well as transparency and chlorophyll a [20]. Based on the results of trophic state evaluation, Geng [19] believed that the exceedance of TN did not affect the trophic level of the Danjiangkou Reservoir, and its overall water quality was Class II and oligotrophic, meeting the standards for a primary drinking water source. Lu et al. [20], through whole-ecosystem experimental research, found that the no-observed-effect concentrations (NOECs) for fish and submerged aquatic plants for the TN in water were 41 mg/L and 12–17 mg/L, respectively, while the NH4+-N was 5–6 mg/L; the NOEC for phosphorus release from sediment affecting the TN of water was 5 mg/L. They therefore believed that China’s current “Surface Water Environmental Quality Standards” are overly stringent and suggested that the standard limits for TN and NH4+-N in Classes I–V be relaxed to 2 mg/L. However, the above suggestions were mainly aimed at the management of eutrophication in lakes. As the source of the South-to-North Water Diversion Project, the Dan Reservoir maintains high nitrogen levels—the primary threat to water quality safety. Thus, a stricter monitoring and assessment system should be adopted to ensure long-term stability and compliance with drinking water standards. Furthermore, it was found that the TN, NO3-N, and NO2-N in the upstream reservoir area were significantly higher than those in the downstream area (p < 0.01), and TP was significantly higher in the upstream area (p < 0.05), indicating pronounced spatial heterogeneity. The Dan River, as one of the main tributaries feeding into the Danjiangkou Reservoir, contributes approximately 10% of the total inflow of the reservoir. As the water moves from the upstream to the downstream area, the water surface area expands, the depth increases, and the water flow velocity decreases significantly. This enhances the sedimentation of particulate matter and dilutes the nutrients in the water, resulting in a decrease in nitrogen and total phosphorus indicators in the downstream compared to the upstream. This spatial variation indirectly confirms the rationality of dividing the Danjiangkou Reservoir into two distinct zones for this study, which was also one of the innovative points of this research.
The N:P ratio in water bodies has been a long-term concern for scientists. In 1958, Redfield [21] discovered that the C:N:P ratio in marine phytoplankton was nearly constant and similar to that in deep seawater, leading to the proposal of the famous Redfield ratio, C:N:P = 106:16:1 (molar ratio). This theory has since been commonly used as a criterion for determining nutrient limitation, with N:P > 16:1 being considered P-limited and vice versa for N limitation [22]. However, this result has been found by different scholars to not be universally applicable [23,24,25]. Qin et al. [26] summarized the morphological and nutritional status data of 573 lakes worldwide and proposed using the TN:TP (mass ratio) of water as an indicator of N and P limitation in lakes, with N limitation considered as N:P < 9, P limitation as N:P ≥ 22.6, and dual N and P limitation as 9 ≤ N:P < 22.6. In this study, the annual average TN:TP in water of the upstream reservoir was 53.82 and that in the downstream reservoir area was 58.9, with no significant difference between the upstream and downstream reservoir areas (p > 0.05). The TN:TP in February was significantly higher than in other months, at 127.8, while the minimum TN:TP in August was 19.97. According to Qin [26], the water in the upstream and downstream areas of the Dan Reservoir is in a severe P-limited state most of the time and in a co-limited state of N and P during the summer. P limitation is a common phenomenon in lakes, especially for deep-water lakes. This may be due to the fact that only the mixed layer in deep-water lakes is active, with weak denitrification leading to an increase in N:P due to significant sedimentation of P. Smith et al. [27] believed that P limitation can significantly affect the growth and reproduction of algae, causing food limitations for consumers that feed on algae and thus leading to changes in the biological community structure of the reservoir ecosystem. Yu et al. [28] used a three-dimensional physical–ecological coupling model to simulate different degrees of P limitation in the eutrophication area of the Pearl River Estuary and concluded that P limitation affects the absorption of N by phytoplankton in the upper layer, with excess N being transported to the lower water, promoting the growth of phytoplankton in the lower water and improving the hypoxic conditions there, which is of positive significance for stratified water bodies in summer. Zhou et al. [29] summarized data from 831 lakes worldwide and believed that the N:P ratio in lakes is mainly influenced by P concentration, with lakes with low N:P and co-limited N and P being more prone to eutrophication. Therefore, we can infer that the Dan Reservoir faces certain risks of eutrophication in summer and suggest that special attention be paid to prevention.

4.2. Distribution Characteristics of Nitrogen and Phosphorus in the Sediment of the Dan Reservoir

The potential risk of eutrophication in Chinese lakes and reservoirs is widespread. Once external pollution is effectively controlled, the release of nitrogen and phosphorus from sediment becomes the main cause of water eutrophication [5]. A large number of microorganisms in the sediment contribute to the mineralization and release of N and P. The low oxygen levels and abundant organic matter content in the sediment provide a favorable reaction environment for anaerobic ammonia-oxidizing bacteria and denitrifying bacteria, promoting the return of N elements from the sediment back into the water bodies [30]. Concurrently, the increase in C and N loads in the sediment enhances the secretion of alkaline phosphatase, promoting the release of P [31]. Typically, there is a dynamic balance between N and P at the water–sediment interface. When disturbed by external factors such as water level fluctuations or water flow disturbances, this balance is disrupted, greatly increasing the risk of N and P release from sediment and intensifying the process of eutrophication in lake and reservoir waters. Previous studies have shown that there are many factors affecting the release of N and P from sediment. The particle size and composition of the sediment themselves directly affect their adsorption and release of N and P. It is generally believed that sediment with smaller particle sizes has a faster release rate and shorter release time. Polar functional groups in sedimentary organic matter can interact with water molecules to form a hydration layer on the sediment surface, affecting the adsorption and desorption of pollutants by the sediment [32]. Secondly, the physical and chemical characteristics of the overlying water can significantly affect the release of N and P from sediment. For example, Tammeorg et al. [33] found that the hypoxic environment in Lake Peipsi during summer was the main cause of P release in sediment, and Zhang et al. [34] believed that alkaline water could inhibit the activity of denitrifying bacteria, thereby increasing the release of N in the sediment. In a study on the release of C and N after flooding of soil and vegetation in the drawdown zone of the Hongjiadu Reservoir of the Wu River, Li [35] found that high temperatures could increase the secretion of N and P transformation enzymes in microorganisms, thereby increasing the mineralization rate of N and P and promoting their dissolution. Additionally, submerged plants, water level fluctuations, and disturbance effects are also important factors affecting the release of N and P from sediment. Submerged plants can adsorb and intercept a large amount of particulate matter, significantly reducing the emission of N and P. Seasonal water replenishment and release in reservoirs change the water level of the reservoir area, and a large amount of farmland and forest land around the reservoir area are periodically submerged and exposed, forming a large drawdown zone. The nutrients stored in the drawdown zone are released in large quantities during re-submersion, becoming the main source of internal pollution [5]. In this study, the annual average total nitrogen values in the sediment of the upstream and downstream reservoirs were 1855 mg/kg and 1680 mg/kg, respectively, and the annual average total phosphorus values were 660 mg/kg and 584 mg/kg, respectively, which are much higher than the TN in the sediment of the Danjiangkou Reservoir reported by Han in 2018 (562 mg/kg) [36] and the average value of TN (1340 mg/kg) and TP (570 mg/kg) reported by Li from 2011 to 2016 in the downstream reservoir area of the Dan Reservoir [37]. This indicates that, in recent years, the TN of the Dan Reservoir and the TP of the downstream reservoir have been continuously deteriorating, gradually forming a huge nutrient pool and facing a greater ecological risk.
From a spatial characteristic perspective, there was no statistical difference in the annual average TN and TP content of the sediment in the upstream and downstream reservoir areas, indicating that the environmental heterogeneity of the upstream and downstream reservoir areas has not significantly affected the sediment, reflecting the stability of the N and P characteristics of the Dan Reservoir sediment. However, the results were different in specific time periods. In February, the TN of the upstream reservoir was significantly lower than that of the downstream reservoir, and in November, both TN and TP of the upstream reservoir were significantly higher than those of the downstream reservoir area, showing a great seasonal difference. February is the dry season, with reduced water flow speed, fewer suspended particles and nutrients in the upstream water, and low flow and low temperature leading to reduced microbial activity at the water–sediment interface and weakened exchange, resulting in lower TN and TP content in the sediment of the upstream reservoir. In contrast, the downstream reservoir area, affected by long-term water flow migration, accumulates nutrients in the sediment, resulting in relatively higher content. In November, when the Danjiangkou Reservoir is filled to its highest water level of 170 m, the upstream water carries a large amount of nutrients, which are more likely to settle in the shallow water area of the upstream reservoir, leading to an increase in the content of TN and TP in the sediment of the upstream reservoir area. The sediment in the downstream reservoir area, after being flushed and disturbed by a huge amount of water flow for a year, has greatly reduced nutrients. Unlike the Dan Reservoir, the sediment in different areas of Chaohu Lake showed obvious spatial heterogeneity [10], and it was speculated that the reason may be that Chaohu Lake is a shallow water reservoir with an average water depth of only 3.06 m, which has a weak dilution capacity for external input of nutrients, and the interaction between water and sediment is more common. The upstream and downstream reservoir areas of the Dan Reservoir have a water depth of more than 25 m, with stronger dilution capacity and stability. From this, it can be seen that changes in water level and storage capacity caused by the hydrological regulation of reservoirs are key regulatory factors affecting the release and distribution of endogenous nitrogen and phosphorus in the sediment.

4.3. The Interaction Between Water and Sediment in the Dan Reservoir

The interaction between water and sediment is an important link in aquatic ecosystems and has attracted great attention from scholars. Blazhchishin [38] studied the influencing factors of sediment resuspension in the shallow-water lake Vistula Lagoon and found that sediment resuspension occurred more frequently in areas close to the coastline, and the frequency of resuspension gradually decreased with increasing water depth. Holmroos et al. [39] investigated the impact of sediment resuspension on the N:P ratio, TN, and TP in the shallow eutrophic lake Kirkkojarvi, concluding that the sediment resuspension impacted TP in the water more significantly than TN, leading to a decrease in the TN:TP ratio in the water. Dabrowski et al. [40] found that high salinity in the Arctic Beaufort Sea shelf reduced the solubility of NH4+-N, promoting its faster sedimentation from the water column, while the reduction in ice cover and storm events promoted the re-release of dissolved components from pore water back into the water column in the sediment. Chen [41] conducted a survey on the thickness and distribution characteristics of sediment in the Hongfeng Lake Reservoir in Guizhou and found that as the N:P ratio and pollutant substances in the water increased, the amount and N and P content of sediment also gradually increased. Wang [42] analyzed the nutrient characteristics of water bodies and sediment in the Thousand Islands Lake and found that the content of sediment nutrients was significantly positively correlated with water depth and significantly negatively correlated with water temperature and turbidity. In this study, the N and P characteristics of the water and sediment in the upstream and downstream reservoir areas of the Dan Reservoir showed significant correlations. However, unlike upstream, the TN in the water and sediment in the upstream reservoir area showed a significant negative correlation, while the TP in the water and sediment showed no correlation. In the downstream reservoir area, the TN in the water and sediment showed a significant positive correlation, and the TP in the water and sediment showed a significant negative correlation. Similar conclusions have been drawn from previous studies on Dianchi and Wuliangsuhai [6,43].
As mentioned earlier, the particle size and composition of the sediment directly affect their adsorption and release of N and P. Sediment with smaller particle sizes often has a faster release rate and shorter release time. During the sampling process of this study, it was found that there were obvious differences in sediment morphology between the upstream and downstream reservoir areas. The upstream reservoir area is mainly composed of large-grained sand and stones with loose structure, while the downstream reservoir area is mainly composed of clay and silt with compact structure, which is in line with the general laws of fluvial dynamics. When surface runoff carries a large amount of nutrients into the reservoir, the higher flow speed and shallower water level in the upstream reservoir area increase the interaction between the water and sediment. TN in the water undergoes migration and transformation with sediment, and a large amount of N is intercepted. However, the larger surface area of the upstream sediment slows down the resuspension process, leading to a decrease in water TN, while sediment TN gradually increases. This also indicates that N in the water is not the only source of N in the sediment; it may also be related to biological degradation, microbial mineralization, etc. After entering the downstream area, the TN in the water significantly decreases, the water depth increases, the flow speed decreases, and the hydrodynamic conditions become poor. The lower oxygen content at the bottom of the reservoir promotes the occurrence of denitrification and anaerobic ammonia oxidation reactions, promoting the return of N elements from the sediment back into the water. The small particle size of sediment particles has a faster exchange efficiency, forming a dynamic consistency between the N elements in the water and sediment. Unlike N, it is difficult for P to escape from the sediment in the form of gas, and it usually combines with metal ions to form phosphates and is stored in the sediment for a long time, forming a complementary relationship with P in the water. However, the material cycle between the water and sediment is a complex process, and further in-depth research is needed in combination with a study of the hydrodynamic characteristics, microbial community structure, aquatic plant composition, and the disturbance effects of benthic animals [5].
It is worth mentioning that in this study, there was a significant negative correlation between precipitation and water level. The reason for this is that the Han River accounts for nearly 90% of the total inflow of the Danjiangkou Reservoir. Since August 2023, the precipitation in the upper reaches of the Han River has increased by 80% compared to the same period in previous years, which has significantly increased inflow into the Danjiangkou Reservoir. However, the rainfall data in this study is the statistical data of Xichuan County, where the Dan Reservoir is located. The county received less rainfall than usual in 2023, and most of it was concentrated in April and May, when the water level of the Danjiangkou Reservoir was at its annual lowest. In October, when the Danjiangkou Reservoir reached its full water level of 170 m, it coincided with the lowest annual rainfall in Xichuan County. Therefore, the negative correlation between rainfall and water level indicates once again that the water level of the Danjiangkou Reservoir mainly depends on the inflow from the Han River basin.

5. Conclusions

Based on the morphology of the Dan Reservoir and the influence of geographical barriers, this study divided the Dan Reservoir into two storage areas, upstream and downstream, and tracked the N and P characteristics in the water and sediment. The results showed that the N and P in the upstream reservoir area were significantly higher than those in the downstream reservoir area. The N:P ratio of the water was above 50, indicating a significant P-limited state. There was no significant difference in the N and P characteristics of sediment between the upstream and downstream reservoir areas. There was a significant correlation between the water environment and sediment N and P in the reservoir area. It can be seen that the water environment in the Dan Reservoir has significant spatial heterogeneity, and the variation of P in the reservoir area plays a dominant role, which can significantly affect the N:P characteristics of this water body.

Author Contributions

Conceptualization, Y.Z. and D.Z.; data curation, D.Z., Y.L. and X.H.; formal analysis, J.Z., X.W., K.G. and S.S.; funding acquisition, Y.Z., Q.L. and J.L.; writing—original draft, Y.Z. and D.Z.; writing—review and editing, Y.Z., Q.L. and J.L. All authors have read and agreed to the published version of the manuscript.

Funding

This work was funded by the Henan Provincial Department of Science and Technology Research Project (252102110063), the Independent Innovation Project of the Henan Academy of Agricultural Sciences (2025ZC128), and the National Key Research and Development Program of China (No. 2023YFD2400900).

Data Availability Statement

Data will be made available on request.

Conflicts of Interest

The authors declare no conflicts of interest.

References

  1. Seppälä, J.; Knuuttila, S.; Silvo, K. Eutrophication of aquatic ecosystems a new method for calculating the potential contributions of nitrogen and phosphorus. Int. J. Life Cycle Assess. 2004, 9, 90–100. [Google Scholar] [CrossRef]
  2. Azevedo, L.B.; Henderson, A.D.; Zelm, R.V.; Jolliet, V.; Huijbregts, M.A. Assessing the importance of spatial variability versus model choices in life cycle impact assessment: The case of freshwater eutrophication in Europe. Environ. Sci. Technol. 2013, 47, 13565–13570. [Google Scholar] [CrossRef]
  3. Zhang, G.L.; Gu, X.H.; Zhao, T.; Zhang, Y.L.; Xu, L.G. Ecological and environmental changes and protection measures of lakes in China. Bull. Chin. Acad. Sci. 2023, 38, 358–364. [Google Scholar]
  4. Du, Y.H.; Liu, C.; Chen, K.N.; Gu, X.Z.; Huang, W.; Wei, Z. Occurrence and internal loadings of nitrogen and phosphorus in the sediment of Lake Baiyangdian. J. Lake Sci. 2018, 30, 1537–1551. [Google Scholar]
  5. Li, Q.G.; Tian, Y.; Liu, L.; Zhang, G.M.; Wang, H.J. Research progress on pelease mechanisms of nitrogen and phosphorus of sediments in water bodies and their influencing factors. Wetl. Sci. 2022, 20, 94–103. [Google Scholar]
  6. Wu, Y.L. Study on the Composition and Sedimentary Characteristics of Nitrogen and Phosphorus in the Water and Sediments of Dianchi Lake. Ph.D. Thesis, Nanjing Normal University, Nanjing, China, 2018. [Google Scholar]
  7. Yin, Y.Y.; Peng, G.Z.; Xie, Y.N.; Mo, Y.T.; Li, F.F.; Ouyang, M.F.; Huang, D.Z. Characteristics and risk assessment of nutrients and heavy metals pollution in sediments of Dongting Lake. Environ. Chem. 2021, 40, 2399–2409. [Google Scholar]
  8. Wang, X.; Chen, X.Y.; Zou, Y.; Chen, J.J.; Li, F.C. Spatial distribution characteristics and pollution assessment of nitrogen, phosphorus and organic matter in sediments of Yangcheng Lake. Environ. Monit. Forewarning 2021, 13, 44–49. [Google Scholar]
  9. Xi, M.S.; Huang, M.Y. Sediment characteristics of Erhai Lake and its impact on the overlying water. Environ. Sci. Surv. 2023, 42, 5–8+20. [Google Scholar]
  10. Wang, Y.P.; Xu, W.W.; Han, C.; Hu, W.P. Distribution of nitrogen and phosphorus in Lake Chaohu sediments and pollution evaluation. Environ. Sci. 2021, 42, 699–711. [Google Scholar]
  11. CCME. Canadian Sediment Quality Guidelines for the Protection of Aquatic Life; Canadian Council of Ministers of the Environment: Winnipeg, MB, USA, 2007. [Google Scholar]
  12. GB11894-89; Water Quality—Determination of Total Nitrogen—Alkaline Potassium Persulfate Digestion UV Spectrophotometric Method. Ministry of Ecology and Environment: Beijing, China, 1989.
  13. GB11893-89; Water Quality—Determination of Total Phosphorus—Ammonium Molybdate Spectrophotometric Method. Ministry of Ecology and Environment: Beijing, China, 1989.
  14. GB3838-2002; Environmental Quality Standards for Surface Water. Ministry of Ecology and Environment: Beijing, China, 2002.
  15. NY/T 53-1987; Method for the Determination of Soil Total Nitrogen (Semi-Micro Kjeldahl Method). Ministry of Agriculture: Beijing, China, 1987.
  16. GB 5009.87-2016; National Food Safety Standard Determination of Phosphorus in Foods. National Health and Family Planning Commission: Beijing, China, 2016.
  17. Yin, W.; Wang, C.; Wang, L.; Xin, X.K.; Liu, G. Spatial and temporal distribution characteristics and influencing factors of totalphosphorus in Danjiangkou Reservoir. Yangtze River 2023, 54, 1–7+10. [Google Scholar]
  18. Yan, X.Y. Phytoplankton Community Variations in Danku of Danjiangkou Reservoir Under Water Transfer and Driving Factors Analysis. Master’s Thesis, Nanyang Normal University, Nanyang, China, 2021. [Google Scholar]
  19. Geng, Y. Study on Enhanced Coagulation of South-North Water in Zhengzhou and Water Quality Assement of Danjiang Water. Ph.D. Thesis, North China University of Water Resources and Electric Power, Zhengzhou, China, 2017. [Google Scholar]
  20. Lu, W.W.; Wu, J.; Li, Z.; Cui, N.X.; Cheng, S.P. Water quality assessment of an urban river receiving tail water using the single-factor index and principle component analysis. Water Supply 2019, 19, 603–609. [Google Scholar] [CrossRef]
  21. Redfield, A.C. The biological control of chemical factors in the environment. Am. Sci. 1958, 46, 205–221. [Google Scholar]
  22. Redfield, A.C.; Ketchum, B.H.; Richards, A. The Influence of Organisms on the Composition of Sea-Water; Interscience Publishers: New York, NY, USA, 1963. [Google Scholar]
  23. Wang, H.Z.; Wang, H.J.; Li, Y.; Ma, S.N. The Control of Lake Eutrophication: Focusing on Phosphorusabatement, or Reducing both Phosphorus and Nitrogen? Acta Hydrobiol. Sin. 2020, 44, 938–960. [Google Scholar]
  24. Naiman, R.J. Animal influences on ecosystem dynamics: Large animals are more than passive components of ecological systems. Bioscience 1988, 38, 750–752. [Google Scholar] [CrossRef]
  25. Sardans, J.; Rivas-Ubach, A.; Peuelas, J. The elemental stoichiometry of aquatic and terrestrial ecosystems and its relationships with organismic lifestyle and ecosystem structure and function: A review and perspectives. Biogeochemistry 2012, 111, 1–39. [Google Scholar] [CrossRef]
  26. Qin, B.; Zhou, J.; Elser, J.J. Water depth underpins the relative roles and fates of nitrogen and phosphorus in lakes. Environ. Sci. Technol. 2020, 54, 3191–3198. [Google Scholar] [CrossRef]
  27. Smith, R.E.; Kalff, H. The effect of phosphorus limitation on algal growth rates: Evidence from Alkaline Phosphatase. Can. J. Fish. Aquat. Sci. 2011, 38, 1421–1427. [Google Scholar] [CrossRef]
  28. Yu, L.; Gan, J. Reversing impact of phytoplankton phosphorus limitation on coastal hypoxia due to interacting changes in surface production and shoreward bottom oxygen influx. Water Res. 2022, 212, 118094. [Google Scholar] [CrossRef]
  29. Zhou, J.; Han, X.; Brookes, J.; Qin, B. High probability of nitrogen and phosphorus co-limitation occurring in eutrophic lakes. Environ. Pollut. 2022, 292, 118276. [Google Scholar] [CrossRef]
  30. Kang, Y.; Xie, H.; Zhang, J.; Zhao, C.; Wang, W.; Guo, Y. Intensified nutrients removal in constructed wetlands by integrated Tubifex tubifex and mussels: Performance and mechanisms. Ecotoxicol. Environ. Saf. 2018, 162, 446–453. [Google Scholar] [CrossRef]
  31. Li, H.; Song, C.L.; Cao, X.Y.; Zhou, Y.Y. The phosphorus release pathways and their mechanisms driven by organic carbon and nitrogen in sediment of eutrophic shallow lakes. Sci. Total Environ. 2016, 572, 280. [Google Scholar] [CrossRef]
  32. Li, B.G.; Qiao, Y.B.; Ma, Q. Effect of Solids Concentration on the Phosphorus Adsorption onto Yellow River Sediments. J. Inn. Mong. Norm. Univ. (Nat. Sci. Ed.) 2010, 39, 50–54+58. [Google Scholar]
  33. Tammeorg, O.; Nurnberg, G.; Horppila, J.; Haldna, M.; Niemistö, J. Redox-related release of phosphorus from sediment in large and shallow Lake Peipsi: Evidence from sediment studies and long-term monitoring data. J. Great Lakes Res. 2020, 6, 46. [Google Scholar] [CrossRef]
  34. Zhang, L.; Wang, S.; Wu, Z. Coupling effect of pH and dissolved oxygen in water column on nitrogen release at water–sediment interface of Erhai Lake, China. Estuar. Coast. Shelf Sci. 2014, 149, 178–186. [Google Scholar] [CrossRef]
  35. Li, X.Q. The Release Amount of Carbon and Nitrogen From Soil and Plant Under Inundation in the Water-Level-Fluctuation Zone of the Wujiang Hongjiadu Reservoir. Ph.D. Thesis, Tibet University, Lasa, China, 2020. [Google Scholar]
  36. Han, Y.P.; Pan, L.; Chen, Y.; Wang, H. Analysis on Spatial Distribution and Influencing Factors of Nitrogen in Sediments of Water-fluctuating Zone in Danjiangkou Reservoir Area. J. North China Univ. Water Resour. Electr. Power (Nat. Sci. Ed.) 2019, 40, 75–80. [Google Scholar]
  37. Li, B.; Wang, Y.; Zheng, Z.; Xu, X.; Xin, Y.R.; Huang, J.; Guo, S.J.; Bi, S.G.; Hu, L.Q.; Chen, Z.J.; et al. Temporal and Spatial Changes in Sediment Nutrients and Heavy Metals of the Danjiangkou Reservoir Before and After Water Division of the Mid-route Project. Environ. Sci. 2018, 39, 3591–3600. [Google Scholar]
  38. Blazhchishin, A.I.; Chubarenko, I.P. Sediment-water interactions in the Vistula lagoon-some preiiminary resuits. Sediment. Recycl. Aquat. Ecosyst. 1999, 1, 77–83. [Google Scholar]
  39. Holmroos, H.; Hietanen, S.; Niemistö, J.; Horppila, J. Sediment resuspension and denitrification affect the nitrogen to phosphorus ratio of shallow lake waters. Fundam. Appl. Limnol. 2012, 180, 193–205. [Google Scholar] [CrossRef]
  40. Dabrowski, J.S.; Pickart, R.S.; Stockwell, D.A.; Lin, P.G.; Charette, M.A. Physical drivers of sediment-water interaction on the Beaufort Sea shelf. Deep-Sea Res. Part I Oceanogr. Res. Pap. 2022, 3, 181. [Google Scholar] [CrossRef]
  41. Chen, C.; Zhang, M.S.; Yang, J.W.; Ye, F.; Lin, Y. Nitrogen and Phosphorus Deposition and Distribution Characteristics of Sediment in Hongfeng Lake Reservoir. J. Anhui Agric. Sci. 2008, 36, 15650–15652. [Google Scholar]
  42. Wang, T.S. Nutrient Distribution and Its Influencing Factors in Water and Sediment of a Deep-Water Reservoir. Ph.D. Thesis, China West Normal University, Nanchong, China, 2023. [Google Scholar]
  43. Wu, Y. Spacial and Temporal Variation and Transport of Contaminants Within Water and Up-Layer Sediments in Lake Wuliangsuhai. Ph.D. Thesis, Inner Mongolia Agricultural University, Huhehaote, China, 2011. [Google Scholar]
Figure 1. Location and sampling map of the Danjiangkou Reservoir.
Water 17 01824 g001
Figure 2. Spatial distribution map of TN, TP, NO3N, and NH4+-N in the Dan Reservoir in February.
Water 17 01824 g002
Figure 3. Spatial distribution map of TN, TP, NO3N, and NH4+-N in the Dan Reservoir in May.
Water 17 01824 g003
Figure 4. Spatial distribution map of TN, TP, NO3N, and NH4+-N in the Dan Reservoir in August.
Water 17 01824 g004
Figure 5. Spatial distribution map of TN, TP, NO3N, and NH4+-N in the Dan Reservoir in November.
Water 17 01824 g005
Figure 6. Distribution characteristics of TN in sediment of the Dan Reservoir in February, May, August, and November.
Water 17 01824 g006
Figure 7. Distribution characteristics of TP in sediment of the Dan Reservoir in February, May, August, and November.
Water 17 01824 g007
Table 1. Correlation analysis of N and P in water (W) and sediment (S) in the upstream reservoir of the Dan Reservoir.
IndicatorsW-TNW-TN:TPW-TPW-NO3-NW-NO2-NW-NH4+-NS-TNS-TPS-TN:TPWater LevelRainfall
W-TN10.84852 **−0.466950.5974 *−0.58204 *0.51116 *−0.6194 *−0.34814−0.55518−0.2249−0.32965
W-TN:TP 1−0.72515 **0.42564−0.87215 **0.40943−0.5066−0.28435−0.45104−0.40183−0.24211
W-TP 1−0.297570.64313 *−0.241020.15580.015420.188430.2270.18996
W-NO3-N 1−0.36552−0.01952−0.47965−0.44835−0.29456−0.380660.27198
W-NO2-N 10.09670.613570.425780.659040.618290.175
W-NH4+-N 1−0.06883−0.33870.1341−0.17136−0.38726
S-TN 10.58421 *0.83541 **0.218380.031
S-TP 10.044950.61653 *−0.35901
S-TN:TP 1−0.155830.29811
Water level 1−0.71566 **
Rainfall 1
Note: The numbers in the table represent the correlation coefficients, “*”indicates significant correlation (p < 0.05), and“**”indicates extremely significant correlation (p < 0.01).
Table 2. Correlation analysis of N and P in water (W) and sediment (S) in the downstream reservoir of the Dan Reservoir.
IndicatorsW-TNW-TN:TPW-TPW-NO3-NW-NO2-NW-NH4+-NS-TNS-TPS-TN:TPWater LevelRainfall
W-TN10.430820.04151−0.122650.39891 *−0.64137 **0.59783 *0.57219 *0.36807−0.36189 *−0.11472
W-TN:TP 1−0.75197 **0.33968 *0.35637−0.48377 **0.5050.5948 *0.13711−0.41933 *−0.1232
W-TP 1−0.58772 **−0.3310.20592−0.45696−0.54768 *−0.160850.36268 *−0.16354
W-NO3-N 10.36698−0.035330.13450.34825−0.20645−0.37611 *0.50858 **
W-NO2-N 1−0.74744 **0.72793 *0.70304 *0.64472−0.86406 **0.56114 **
W-NH4+-N 1−0.41984−0.42412−0.206520.72057 **−0.28231
S-TN 10.83739 **0.70142 **−0.57277 *0.27437
S-TP 10.21423−0.507830.21701
S-TN:TP 1−0.381570.20858
Water level 1−0.71566 **
Rainfall 1
Note: The numbers in the table represent the correlation coefficients, “*”indicates significant correlation (p < 0.05), and “**”indicates extremely significant correlation (p < 0.01).
Disclaimer/Publisher’s Note: The statements, opinions and data contained in all publications are solely those of the individual author(s) and contributor(s) and not of MDPI and/or the editor(s). MDPI and/or the editor(s) disclaim responsibility for any injury to people or property resulting from any ideas, methods, instructions or products referred to in the content.

