Abstract
The Pinglu Canal is a strategic inland restricted waterway under construction in southwest China. Its ship wave superposition characteristics under conditions of high-density shipping and large ships may threaten navigation safety, but little related research has been performed. Based on the Pinglu Canal project, this study uses the XBeach numerical model, which is validated by field observations on the Chengzi River waterway, to analyze the ship wave characteristics under single-ship navigation (SN) and two-ship navigation in opposite directions (2NOD). The results show the influences of ship type and water depth. For SN, secondary waves of the navigation administration boat (NAB) dominate, with wave height decreasing as water depth increases. Larger cargo ships (CSs) present significant primary wave effects and a complex relationship between the secondary wave’s height and water depth. For 2NOD, the NAB wave effect is stronger due to superposition. As for larger CSs, the primary wave effect is significantly enhanced and occupies the dominant position, with secondary wave height tending to increase with the increase in water depth. The study reveals the characteristics of single-ship and two-ship waves in the Pinglu Canal, providing a theoretical basis and technical support for ship wave risk assessment and ecological revetment design.
1. Introduction
As a vital component of the global transportation system, shipping has seen continuous growth in global trade, accompanied by the increasing density of waterways and ports. In recent years, China has prioritized the strategic importance of canals in water transport. Over a millennium after the completion of the Beijing-Hangzhou Grand Canal, the country has initiated construction of a new artificial waterway, the Pinglu Canal. The construction of the Pinglu Canal aims to develop shipping while serving multiple functions including water supply, irrigation, flood control, and water ecological improvement. This project will fundamentally resolve Guangxi’s longstanding paradox of coastal proximity without direct river-to-sea navigation channels. Upon completion, 5000-ton-class river–sea ships will gain direct access from inland ports along the Xijiang River to China’s coastal ports and major Southeast Asian harbors, enhancing connectivity between domestic and international markets. Therefore, ensuring navigation safety and efficiency of the Pinglu Canal is important, which requires critical research on ship waves during navigation.
Numerical simulation has always been an important means for studying the characteristics of ship waves. In recent years, with the continuous in-depth exploration by more and more scholars, the numerical model of ship waves has also tended to mature. Wang and Guan et al. [1] proposed an extended version of the COWS model by incorporating a moving pressure term into the momentum equation. Wang et al. [2] calibrated the ship wave height formula proposed by the Delft Hydraulics Institute and developed a tailored calculation method for predicting ship wave heights in the Jianghuai Canal. Additionally, by using deep learning methods, Yasir et al. [3] summarized various techniques for detecting Kelvin ship waves from SAR images of the sea surface.
In recent years, many scholars have also chosen to use the XBeach model [4] to describe ship wave generation and propagation, considering that the XBeach model can provide a computationally efficient framework for ship wave simulations with simplified numerical approaches. De Jong et al. [5] has proved that XBeach is better than Delft3D-FLOW since it allows the calculation of passing-ship effects including non-linear shallow-water effects and the influence of arbitrary geometries. The capability of XBeach to predict the interaction between ships in complex channel geometries was validated through comparison with physical model experiments conducted by Zhou et al. [6]. Björn Almström et al. [7] compared XBeach against high-quality field measurements of ship waves and assessed its general applicability to ship wave simulations through an extensive sensitivity analysis with regard to the main input parameters. The result showed that XBeach is a robust model for ship wave applications with inputting available data. Bluteau et al. [8] proved that XBeach could model the evolution of the waves’ drawdown as they propagated over several kilometers from the channel. Mao and Li et al. [9] showed that the XBeach model is not only able to calculate the primary and secondary waves well, but also the ship-induced near-bed velocity when ship waves are prominent in the water flume.
In addition, numerous studies have further investigated the interactions between ship waves and factors such as channel cross-sections, riverbed sediment dynamics, and navigation modes. Mao et al. [10] analyzed the flow velocity variations and bed shear stress patterns induced by ship waves. Based on prior research on sediment transport under unidirectional currents and waves [11], they derived a ship wave-driven sediment transport capacity formula. Zhang et al. [12] demonstrated that ship waves generated by high-speed ships exert significantly stronger impacts on moored ships. Wang et al. [13] focused on the propagation characteristics of ship waves in restricted waterways, successfully capturing their evolutionary processes through numerical simulations. Ma and Liu et al. [14] examine the impact of the ship’s principal dimensions on the steady waves generated by the ship, and practical approaches are subsequently proposed to reverse predict the ship’s length, width, draught, and related parameters.
Although the mutual interaction of ship hydrodynamics has become increasingly significant in terms of its impact on navigation safety and coastal ecology, there are still obvious gaps in the current academic research in this field. Most of the existing literature focuses on the analysis of the ship waves of isolated ships, while there are few systematic discussions on the modeling of wave interference mechanisms in scenarios of multiple ships’ navigation side by side or intersecting. More critically, existing studies generally lack an in-depth understanding of the spatio-temporal superposition mechanism of ship waves under high-density navigation conditions. In fact, with increasing waterway constraints and growing ship dimensions/traffic density, ship-to-ship hydrodynamic interactions have become inevitable. Studies have already shown that the interaction forces and moments on the ship seem to increase non-linearly with decreasing lateral distance between the ships [15]. Based on this discovery, it can be speculated that the two ships traveling in opposite directions will indeed lead to the interaction of the ship waves. Such breakthroughs in research can not only optimize intelligent shipping systems but also provide wave energy assessment tools for green port construction, offering dual value in ensuring navigation safety and the sustainable development of coastal areas.
Addressing this gap, this study investigates wave patterns generated by two ships navigating in restricted channels (based on the Pinglu Canal Project, currently under construction), analyzing navigation scenarios in opposite directions. This study investigates ship wave characteristics generated by two-ship navigation in opposite directions (2NOD) under varying water depth conditions. A comparative analysis is conducted against single-ship navigation (SN) scenarios, evaluating key features such as wave height and propagation patterns. Thus, this study provides a theoretical basis and technical support into ship wave risk assessment and ecological revetment design in the restricted waterway of the Pinglu Canal.
The outline of this paper is as follows. Section 2 introduces the Pinglu Canal as the study site. Section 3 has three parts: the first is the theory associated with ship waves and the XBeach model (from a ship wave perspective); the second is the field observation for validation; the third is about the model setup, where the study site for evaluating the XBeach model is provided and it is further explained how the XBeach model was set up. Section 4 presents the simulation results of SN and 2NOD sequentially, which is discussed in different conditions, while the conclusions of the work are finally drawn in Section 5.
2. Study Site: The Pinglu Canal
This research is conducted based on the sixth section (Qinzhou section) of the downstream waterway project of the Qishi hub of the Pinglu Canal. The overall route of the Pinglu Canal (Figure 1) is 134.2 km long, starting from the estuary in the Xijiang River mainstream in Nanning, connecting with the Qinjiang River, and then flowing south along the mainstream of the Qinjiang River into the Qinzhou Port waters of the Beibu Gulf. The entire project is constructed in accordance with the standards of Class I inland waterways, capable of accommodating 5000-ton ships. The estimated total investment for the project amounts to CNY 72.7 billion (about USD 9.98 billion). After the completion of the Pinglu Canal, 5000-ton ships capable of navigating both inland waterways and the sea can directly travel from the ports on the Xijiang River to the coastal ports of China and major ports in Southeast Asia, better connecting the domestic and international markets. This will fundamentally change the current situation where Guangxi has access to the sea but lacks direct river navigation to the sea. As of 1 November 2024, the cumulative concrete pouring for the main body of the ship locks at the three major hubs of Madao, Qishi, and Qingnian has exceeded 2.4 million cubic meters.
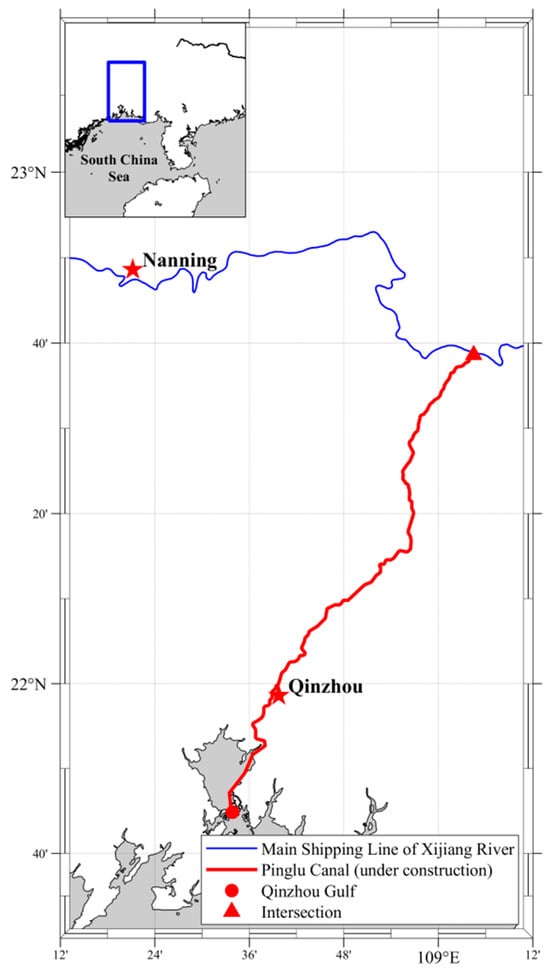
Figure 1.
Schematic diagram of the geographical location of the Pinglu Canal, which connects the Xijiang River with Qinzhou Gulf.
Considering the construction conditions of this project and its long-term development trend, the increase in the cross-sectional area of the waterway will mainly be achieved by expanding the width of the waterway, with a small increase in water depth, thus forming a wide and shallow waterway cross-section. Since the Pinglu Canal is constructed to the standards of an inland waterway of Grade I, the specific dimensions of the waterway cross-section are presented in Figure 2. For this cross-section, the normal water level is 8.7 m.

Figure 2.
The dimensions of the typical channel cross-section studied in this paper (unit: meters), and the normal water level is 8.7 m.
Due to the size limitations (e.g., steep slope, narrow channel, and shallow water depth), restricted waterways differ significantly from open waterways in terms of ship resistance, ship floating state, and wave generation, where ship navigation could be affected by shallow water and bank effects. In addition, the Pinglu Canal has the following characteristics: high ship density and complex ship types. Sudden changes in water levels may complicate navigation conditions. Therefore, studying the wave patterns generated by ships navigation at different water depths is of great significance for channel design, navigation policies, and other aspects.
3. Materials and Methods
3.1. Overview
In this section, we first introduce the basic concept of the ship wave. Then, the XBeach model is presented to how it can implement the numerical simulation of ship waves. Since the Pinglu Canal is still under construction, it is difficult to conduct field observation and experiments. To prove the validity of XBeach, we conducted field observations of ship waves in the Chengzi River waterway, which is also a restricted waterway. We used the information of the waterway and the collected data to establish the corresponding XBeach model, and implemented the validation based on the numerical simulation results. Finally, we describe the model setup and parameter calibration of the study site Pinglu Canal in this paper.
3.2. Ship Waves
Ship waves refer to the surface fluctuations caused by pressure changes generated by the interaction between a ship’s hull and water during navigation [16]. The study of ship waves dates back to the 19th century, with historical records [17] indicating the first published works on ship wave phenomena. The renowned naval architect Froude [18] became the first researcher to comprehensively describe ship wave patterns and their main characteristics. In the same year, Kelvin [19,20] conducted pioneering theoretical analyses of ship waves, proposing the famous Kelvin angle, thus being recognized as the founder of ship wave theory. Other notable contributors to ship wave theory include naval architects and fluid mechanics researchers such as Havelock [21,22] and Hogner [23].
Figure 3 presents the basic ship wave system and field. When the deep Froude number, (where V is the ship speed, g is the acceleration due to gravity, and h is the water depth), is less than 0.84, the wave pattern is termed deep-water ship waves (Kelvin waves), while the ship is termed navigating in the subcritical speed zone. The Kelvin wave pattern consists of two distinct sets of diverging and transverse waves confined within a fan-shaped area behind the hull [24]. Transverse waves propagate in the same direction as ship movement, while diverging waves distribute symmetrically along the navigation direction with propagation angles approximately 55° from the course [25]. The wave crest cusp points form a cusp locus line at 19°28′ to the navigation direction, where maximum wave height occurs [26].
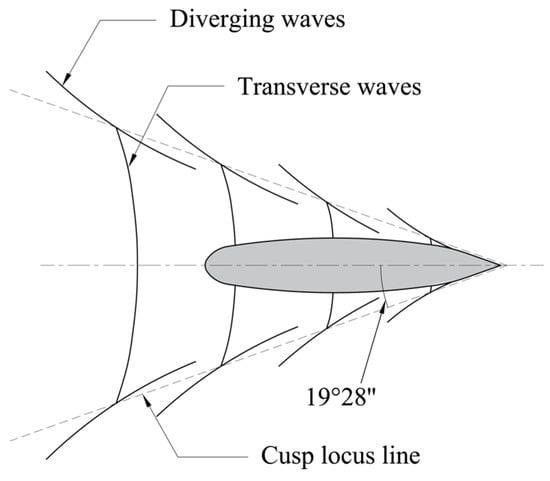
Figure 3.
Schematic diagram of ship wave system and field.
When > 0.84, shallow water effects emerge, creating shallow water wave patterns. In transcritical speed regions, diverging and transverse waves merge. The angle between the cusp locus line and navigation course gradually increases with water depth Froude number, approaching 90° with the maximum wave height. The length of the cusp locus line increases with speed. In supercritical speed regions, transverse waves disappear, leaving only diverging waves with elongated crest lines whose angles relative to course decrease with increasing speed [27].
When a ship navigates through confined waters, two distinct wave phenomena emerge in the hydrodynamic system (Figure 4). The primary wave system develops as a reverse current beneath the hull generates a localized low-pressure fluid region surrounding the ship, which causes the drawdown wave. The secondary wave system, recognized as the Kelvin wave system, exhibits a dual nature: transverse waves advancing parallel to the ship’s trajectory and divergent waves propagating at angles approaching 90° relative to the ship’s motion. Generally speaking, the primary wave is of lower frequency and the secondary wave is of higher frequency. First systematically characterized by Thompson [28], this classical hydrodynamic phenomenon elucidates fundamental principles of ship wave interactions, with the transverse–divergent wave duality remaining a cornerstone in naval hydrodynamics research.
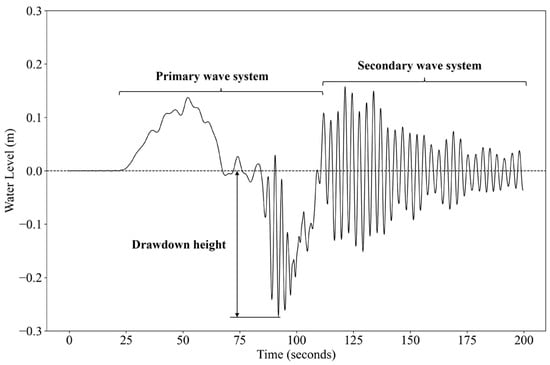
Figure 4.
Illustration of the water level change of ship waves, divided into primary wave system and secondary wave system according to different frequencies.
3.3. Numerical Model
The open-source XBeach numerical model [29], developed by UNESCO-IHE and Delft University of Technology, is an event-driven model initially designed to assess hurricane impacts on barrier islands along the U.S. East Coast. Capable of simulating short-term morphological changes from storm surges, floods, and tsunamis, it excels in modeling dune erosion caused by storms. As a depth-averaged shallow water model for long wave problems, XBeach resolves wave group-scale surf beat and radiation stress gradients. Its sediment transport calculations account for near-bed sediment stirring and dune face avalanching, enabling prediction of bathymetric changes.
Validation studies demonstrate that XBeach’s non-hydrostatic model effectively simulates ship waves and hydrodynamic interactions between navigating and moored ships in complex channel geometries [6]. Moving ships are represented as pressure fields traveling along predefined trajectories within the model domain. Ships are defined on separate grids, with their drafts specified at grid points. At each computational timestep, the ship draft is interpolated from the ship grid to the global grid while maintaining a constant ship volume. The water head in each grid cell is then updated based on the interpolated ship draft. Ship waves are generated through the movement of the pressure field and propagate across the entire grid. All XBeach codes including the non-hydrostatic model and the adaptations for moving ships are of open-source and available through http://xbeach.org/ (accessed on 26 August 2024). The version used in this study is XBeach v1.24.6057.
3.3.1. Non-Hydrostatic Model
In the XBeach model, the simulation of ship waves is realized based on the non-hydrostatic module [6]. Only the important governing equations are shown below and more details can be found in [30]. Assuming the fluid is incompressible, homogeneous, and Newtonian, the governing equations (Navier–Stokes equations) for free-surface flow in Cartesian coordinates are expressed as
where is the velocity vector, is the total pressure, is the gravitational body force, and is the deviatoric viscous stress tensor.
When the vertical motion of a water body mass is violent and the vertical acceleration is not neglected, the non-hydrostatic model explicitly takes into account the non-hydrostatic term in the vertical momentum equation (i.e., the pressure is not determined by the height of the water column alone). Furthermore, for incompressible flow, the continuity equation is , which requires that local velocity variations are compensated by pressure adjustments. Therefore, the vertical pressure is not only controlled by hydrostatic gravity, but also contains the dynamic pressure component. Thus, the total pressure is decomposed into a hydrostatic and hydrodynamic part and expressed as
where is the free surface elevation (measured positive upwards from reference level ), is the dynamic pressure normalized with the reference density , and is the atmospheric pressure (assumed to be uniform and stationary).
Under the Boussinesq hypothesis, turbulent stresses are introduced via the mean flow quantities as
where is the eddy viscosity. For Equation (1), the resulting equations in tensor notation are as follows:
where represents the turbulent shear stress tensor.
By integrating the continuity equation along the vertical (depth) direction, we obtain the following:
The kinematic boundary conditions at the free surface and the bottom are given below:
Assuming the bed elevation changes on a much longer timescale than fluid motion, the time derivative in (7) can be neglected. Substituting (6) and (7) into (5) and applying Leibniz’s rule yields, we obtain the following:
where and are the depth-averaged velocities, calculated as follows:
From this point, Equation (8) is referred to as the global continuity equation. This equation gives a relationship between the depth-averaged velocity and the surface elevation.
XBeach is currently formulated using depth averaged quantities and therefore the momentum equation labelled Equation (4) is integrated over the water depth. Because the procedure is very similar for each of the three momentum equations, only the u-momentum equation will be dealt with in detail. In component form, the conservation of momentum in the x-direction can be written as follows:
which consists of terms for time derivatives, advection, pressure, and stresses. After depth-integration of those components, the depth-integrated horizontal momentum equations in the x, y and z directions become
where , and are the depth-averaged dynamic pressure, free surface pressure, and bottom pressure, respectively; , , , , and are the depth-averaged stress components; and are source terms resulting from stresses at the free surface and bed in the x and y directions; and is the depth-averaged vertical velocity.
In order to close the above shallow water equations, a Smagorinsky-type sub-grid model is used to calculate the eddy viscosity in (3), which can be expressed as follows:
where is the Smagorinsky constant and is the characteristic length scale of the smallest resolvable eddy.
To obtain a unique solution, in addition to the depth-averaged Equations (8), (12), (13) and (14), tangential and normal velocity stress boundary conditions must be specified along all boundaries. At open boundaries, the time-varying normal velocity component is defined, and the tangential velocity gradient is set to zero. At closed boundaries, the normal flow is assumed as zero, and boundaries are fully reflective.
At the free surface, normal and tangential stresses are assumed to be continuous, and the pressure is set to atmospheric pressure. Furthermore, the atmospheric pressure at the free surface is assumed to be uniform and stationary and taken to be zero for convenience.
At the bottom, the kinematic boundary condition (7) is used. The is a synthesis of the pressure throughout the water column. It contains the hydrostatic pressure (determined by the water depth) and the non-hydrostatic pressure (determined by local fluid acceleration, etc.). In addition, the two tangential stresses due to bed friction are described using mean flow as , where is the dimensionless friction coefficient.
The XBeach model uses first-order finite differences in a Cartesian coordinate system, with spatial variations computed as upwind differences. The predictor–corrector method is used. In the corrector step, the velocity and pressure are corrected with non-hydrostatic pressure. For the calculation of the non-hydrostatic pressure term, it is solved by constructing a Poisson equation, which can be briefly expressed as
where denotes the source terms derived from momentum equations and boundary conditions. The discrete Poisson equation for the pressure has to be solved at each time step.
Non-linear advection terms are expressed in momentum-conserving form. The model time step ensures the stability of the calculation process by limiting the maximum time step, and the Courant–Friedrichs–Lewy (CFL) number is user-defined. For a more detailed numerical derivation, solution procedure and model verification, Reference [30] can be consulted.
3.3.2. Ship Modeling
In XBeach, moving ships are represented as pressure fields traveling along predefined trajectories within the model domain, while the water pressure head in each grid cell is adjusted dynamically as the ships move. The pressure head from the ship is interpolated from the vessel dimensions onto the computational grid by maintaining the hull volume [7]. To implement ship modeling, some variables of a ship need to be defined: a regular x- and y-grid; ship depths (draft) on that grid; center of gravity (x, y, z) and a track specified as x and y locations versus time, from which heading is computed.
However, the shape of a ship is described in XBeach up to the level of detail that the calculation grid allows. Furthermore, only one draft per horizontal coordinate can be prescribed. This means that certain details of the shape of the hull cannot be described. The details of the complex (3D) flow in the direct vicinity of the ship are therefore not captured fully in the model. When considering the ship-induced water motions somewhat further away from the hull, this somewhat crude approach to represent the ship is adequate [5].
Variable interpolation between the XBeach and ship grids is implemented using the MKMAP and GRMAP functions [7]. MKMAP determines the indices and weights () of the four surrounding XBeach water level points () for each ship grid point (). GRMAP transforms XBeach grid variables (e.g., water level) into ship grid variables [6]:
where is the pressure head in the ship grid and is the pressure head in the computational grid of XBeach. When the ship grid has much finer resolution than the XBeach grid, GRMAP2 performs the reverse operation, integrating ship grid variables back into the XBeach grid:
where is the area of a ship grid cell, and is the area of the XBeach computational domain. The interpolation ensures volume conservation and produces smoother results compared to bilinear interpolation.
At each time step, the ship’s position and heading are interpolated onto the XBeach grid. Using MKMAP and GRMAP2, the ship’s pressure head is interpolated onto the XBeach grid and added to the cumulative pressure head from all ships. At the initial time step, the water level is set to a negative pressure head to suppress initial disturbances.
3.4. Field Observations and Model Validation
3.4.1. Field Observations
We conducted a field observation of ship waves on the Chengzi River waterway in Jiangsu, China. The Chengzi River waterway is an important part of the waterway network connecting the Beijing-Hangzhou Grand Canal and the Hongze Lake area. Its designed bottom width is 45 m, the designed water depth is 3.2 m, and the normal water level is 12.5 m, which meets the navigation requirements of 1000-ton ships. The overall line shape is nearly straight. Before the observation, basic information about the Chengzi River waterway, including design materials and bathymetry data, was collected to prepare for the setup of the river section model for observation.
The main contents of this field observation are as follows.
- A navigation administration boat (NAB) was arranged to pass the observation point at different pre-set speeds, each passing at a different offshore distance;
- The cargo ships (CSs) that passed randomly on the day of the field observation were observed, while we recorded the ship names and searched the relevant AIS data of the CSs via the website (https://www.shipxy.com/, accessed on 24 August 2024), including size, speed, draft, etc.
During the observation process, the wave form generated by the NAB and the CSs moving on the water surface was observed, and a camera was used to record the change process of the ship waves, and the corresponding distances from the observation point were collected. The other equipment included a 5 m long ruler with an accuracy of 0.01 m, used to measure water level (Figure 5a); a tripod (Qingzhuang Photographic Equipment Co., Ltd., Guangzhou, China) for fixing the camera; a laser rangefinder for measuring the distance from each ship to the observation point; and an unmanned aerial vehicle (UAV, Dajiang Innovation Technology Co., Ltd., Shenzhen, China) for aerial photography and recording the ship tracks. The observation point was located on a vertical revetment platform. Figure 5b,c present the NAB and CS recorded by the UAV.

Figure 5.
Related pictures of the field observation: (a) the ruler for measuring water level; (b) the NAB captured by the UAV; (c) the CS captured by the UAV.
In total, 17 groups of data were observed, including 12 groups of the controlled NAB trials and 5 groups of random CS passages, with ship parameters extracted from materials or AIS records and wave heights measured via video frame analysis. The ship name of the NAB was SGHS251, and the speeds were 3.6 m/s, 4.2 m/s, and 4.7 m/s, respectively, and the offshore distances ranged between 10.0 m and 31.8 m. All the 5 CSs were almost fully loaded, passing from north (N) to south (S), and all were SN. Their ship names were HHH8838, TY777, SXZH6073, SSYH0088 and LZZH2589. The speeds of CSs ranged from 1.49 m/s to 1.70 m/s, and the offshore distances ranged from 24.3 m to 31.0 m.
We used computer software to extract the images from the observed video frame by frame, read the water level changes, and used them as the waveform of the ship waves. In order to avoid the influence of reflection after the ship waves propagated to the revetment and the superposition of adjacent waves, only the first single primary wave of the ship wave propagated to the ruler was read to obtain the wave heights of a primary wave. We sorted the data of all observation groups and the corresponding primary wave heights, which are listed in Table 1.

Table 1.
The data of all observation groups and the corresponding primary wave heights at the observation (Obs.) point.
3.4.2. Numerical Simulation and Validation
A waterway section of the Chengzi River including the observation section was selected for a generalized model setup. In order to make the model simulation close to the actual situation, the model range must be large enough to ensure that the ships pass through the simulation area of the observation section at a preset speed. Therefore, the length of the model section was set to 900 m. The model used a rectangular grid. After several tests, the grid size of the model along the shore was 5 m, and the grid size of the model perpendicular to the shoreline was 1 m. The water surface width of the waterway was set to 68 m with reference to the section design figure of the river section, and the model width was 88 m after considering the revetment. According to the multi-beam scanning section elevation data of the Chengzi River in 2023 and the water level during the field observation, the bathymetry of the model section was set. Figure 6a presents the grid and bathymetry of the model. According to the field observation data (Table 1), the ship-related parameters and the navigation track at a fixed distance from the shoreline were set. Figure 6b presents the form of the applied pressure field by a ship in the model, which matches the actual hull’s outline shape as much as possible. Moreover, it was assumed that there was no discharge input in the Chengzi River. Therefore, the initial flow velocity was zero.
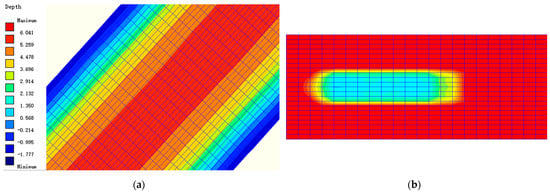
Figure 6.
Two-dimensional presentation of (a) the grid and bathymetry of the Chengzi River model and (b) the form of the applied pressure field by the ship in the global model grid, taking the CS in Figure 5c as an example.
During ship modelling, each ship form had respective parameters, including the regular x- and y-grid, ship depths (draft) on that grid, the center of gravity (x, y, z) and the track specified as x and y locations versus time. After multiple pre-simulations and parameter calibration, the calculation time step CFL was determined to be 0.7 and the horizontal viscosity value nuh was determined to be 0.1. Considering the ship types, the solver used to solve the linear system was the sip solver. The model used the Manning coefficient to represent the bottom roughness, which was 0.02. The simulation time depended on each ship speed. The parameters of flow boundary condition, left and right, were set to wall, that was, the shore wall that the flow could not pass through. The other parameters in the model were default.
In the numerical model governing file, the output point corresponding to the field observation site was selected to output the water level changes, and the output time step was 0.1 s. The height of the highest water level of the primary wave was extracted as the wave height value of this point. Figure 7 presents the comparison between the observation data and the simulation results. The mean absolute error (MAE), root mean square error (RMSE), determination coefficient (R2) and Pearson correlation coefficient (r) were used to measure the simulation effect of the model. The comparison shows that the non-hydrostatic model of XBeach has a certain ability to simulate ship waves.
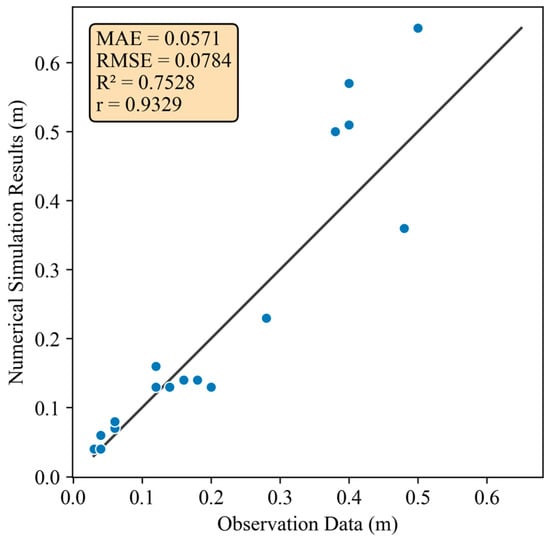
Figure 7.
Comparison of observation data and numerical simulation results, with MAE = 0.0571 m, RMSE = 0.0784 m, R2 = 0.7528 and r = 0.9329, which shows the ability of XBeach to simulate ship waves.
3.5. Model Setup of the Pinglu Canal
After model validation, the model setup and parameter settings of the Pinglu Canal can be carried out. The length of the Pinglu Canal model studied was set to 1000 m, and the bottom width of was set to 80 m with reference to the river planning section diagram (Figure 2). After pre-simulations and analysis, a structured grid with 5 m × 2 m resolution was adopted, balancing computational efficiency and accuracy in capturing wave propagation dynamics. According to the design materials, the normal water level is 8.7 m. Therefore, we set four water depths, namely 6.3 m, 7.0 m, 7.5 m, and 8.0 m. The water surface width was determined by the corresponding water depth. When the ship wave propagates toward the shore, the wave will have a certain runup. In order to prevent the wave overflowing the grid range, the grid width was extended to a certain extent compared with the water surface width. It was assumed that there was no discharge input in the canal and the initial flow velocity was zero. The simulation time of the model depended on each corresponding ship speed. The other parameters were the same as the Chengzi River model.
Table 2 lists the three ship types selected according to the design materials, including a NAB, a 2000-ton CS and a 5000-ton CS, which were all fully loaded. The models of in-water pressure field caused by each ship type’s draft are shown in Figure 8. By specifying the ship draft distribution in the ship grid, which is interpolated and converted to a water level drop in the XBeach model, the pressure field is thus generated. The speed of each ship type was set to the most common value. The input files of ship-related parameters were set according to the ship sizes and drafts. To avoid the influence of numerical instability on the simulation results, the ship track files described the ships’ navigation as slowly accelerating to maximum speed. The depth Froude number was calculated for each ship type. When considering the lowest navigable water level, was 0.76, 0.38, and 0.28, respectively, all of which meant that all ships were in the subcritical speed zone.

Table 2.
Ship parameter settings for numerical simulation.
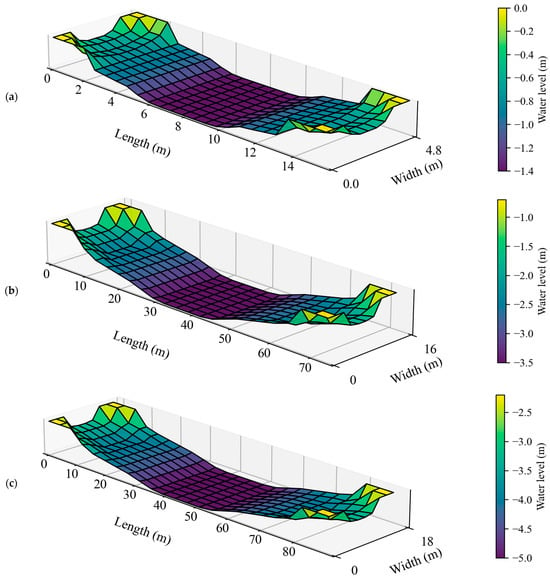
Figure 8.
The models of in-water pressure field caused by each ship type’s draft: (a) NAB; (b) 2000-ton CS; (c) 5000-ton CS.
The study site section is a two-way waterway. We considered the situations of SN and 2NOD. When it is SN, the ship is located at the center of the waterway. When it is 2NOD, both ships are 20 m away from the center of the waterway. Figure 9 presents the two navigation conditions and the wave field of each condition and also the coordinate system of the Pinglu Canal model.
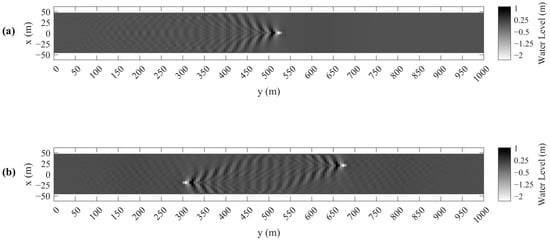
Figure 9.
The display of the ships’ navigation positions, wave fields, and the coordinate system in the Pinglu Canal model, taking the NAB ship type as an example, with (a) SN and (b) 2NOD.
4. Results and Discussion
4.1. Single-Ship Navigation
When it is single-ship navigation (SN), the ship of the model passes on the centerline x = 0. We read the water level changes at 10 m, 20 m, 30 m, and 40 m from the center of the model in turn. The data output point was set at the stable ship speed stage. Figure 10, Figure 11 and Figure 12 present the water level changes at different output points of each ship type. According to [7], we used a third-order Butterworth filter to separate the primary waves and the secondary waves of the ship waves. The sampling frequency of all data was 10 Hz. For the primary waves, a cutoff frequency of 1/15 Hz was applied. And for the secondary waves, we used a bandpass filter with a low-cutoff frequency of 1/10 Hz and a high-cutoff frequency of 1/1 Hz. The situations of multiple water depths are also presented in Figure 10, Figure 11 and Figure 12. In addition, for the convenience of comparison, water level diagrams of 2000-ton CS (Figure 11) and 5000-ton CS (Figure 12) present the same time length.
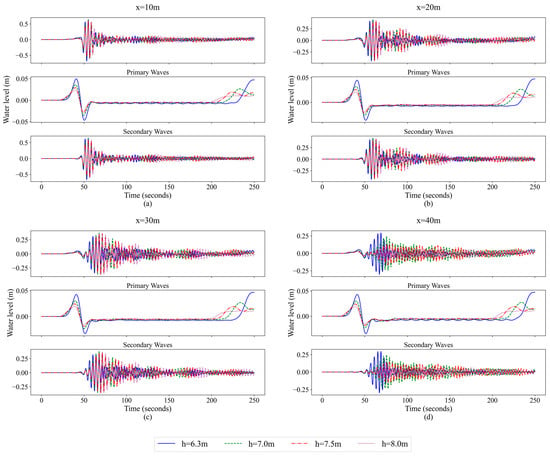
Figure 10.
Water level changes at different water depths during the NAB navigation at (a) x = 10 m, (b) x = 20 m, (c) x = 30 m and (d) x = 40 m, and the primary and secondary waves separated by a third-order Butterworth filter.
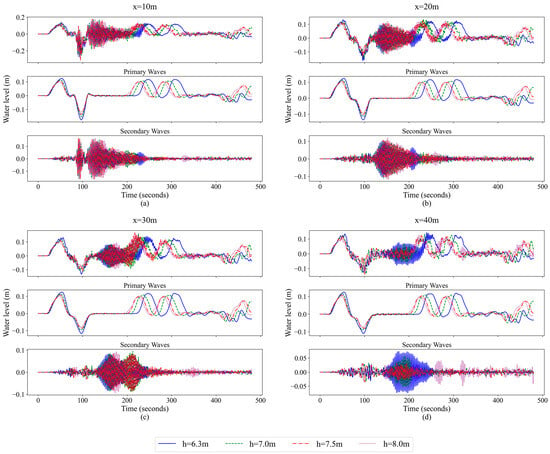
Figure 11.
Water level changes at different water depths during the 2000-ton CS navigation at (a) x = 10 m, (b) x = 20 m, (c) x = 30 m and (d) x = 40 m, and the primary and secondary waves separated by a third-order Butterworth filter.
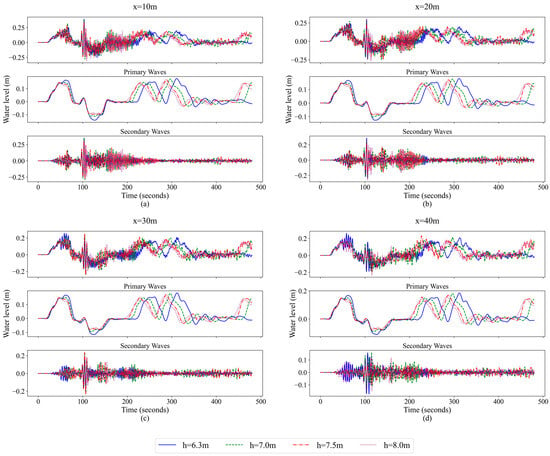
Figure 12.
Water level changes at different water depths during the 5000-ton CS navigation at (a) x = 10 m, (b) x = 20 m, (c) x = 30 m and (d) x = 40 m, and the primary and secondary waves separated by a third-order Butterworth filter.
Figure 10 presents that the ship waves of the NAB are clear and simple. There are differences in the ship wave form at different water depths. When in shallow water, the wave form is relatively steeper and the amplitude is larger, meaning that the energy is more concentrated. When in deep water, the wave form is relatively flat and the energy is dispersed. During the propagation of the ship waves, the primary waves are generated first, and the secondary waves are generated at the same time as the drawdown wave is formed. The wave height of the primary waves is obviously much smaller than the maximum wave height of the secondary waves. As the water depth increases, the influence of the primary waves decreases, including the water level rise height and the drawdown height. However, there is no obvious difference between the above two heights at different distances from the ship. Additionally, the period of the primary waves decreases with the increase in water depth. On the other hand, the attenuation rate of the secondary waves slows down with the increase in water depth because of the decrease in bottom friction.
From the water level changes in Figure 11, it can be seen that the ship waves of the 2000-ton CS present a superposition of the primary waves and the secondary waves. There is a significant difference in the generation time between the primary waves and the secondary waves. During the propagation of the ship waves, the primary waves are generated first, and after the drawdown wave is formed, the secondary waves dominate. Compared with the NAB, the effect of the primary waves is relatively enhanced, the difference in wave height between the primary waves and the secondary waves is somewhat reduced, and the primary wave period increases. It is worth noting that the primary waves have similar amplitudes at different positions without obvious attenuation. As the water depth increases, the influence of the primary waves decreases, including the water level rise height and the drawdown height, with a decreasing wave period. The secondary waves have more concentrated energy and a longer impact time.
From the water level changes in Figure 12, it can be seen that the ship waves of the 5000-ton CS also present a superposition of the primary waves and the secondary waves. However, the primary waves and the secondary waves are generated at similar times. During the propagation of the ship waves, the primary waves are generated. When the water level rises to the wave crest, the secondary waves are generated at the same time. The difference in wave height between the primary waves and the secondary waves is smaller than that of the NAB. Meanwhile, the primary wave period is larger, with relatively enhanced wave effects. As the distance to the hull increases, the attenuation effect of the primary waves is not obvious. As the water depth increases, the influence of the primary waves decreases, including the water level rise height and the drawdown height, and the period decreases accordingly. The energy of the secondary waves is more dispersed, and the maximum height occurs at the drawdown wave. Compared with the 2000-ton CS, the 5000-ton CS has significantly higher energy, whether it is the primary waves or the secondary waves. Due to a larger hull size and more displacement of the 5000-ton CS, the disturbance to the water body during navigation is more intense, so the amplitude and period of the ship waves generated are larger, and the wave form is more complex.
Figure 13 presents the change in the maximum height of secondary waves along the cross-section of each ship type at different water depths. In Figure 13a, the maximum height of the secondary waves of the NAB presents a trend of decreasing with increasing water depth at x = 10 m and x = 40 m. At the same water depth, the maximum height decays rapidly with increasing distance. In Figure 13b, the maximum height of the secondary waves of the 2000-ton CS decays with increasing distance, and decays faster in deep water. However, at x = 10 m, x = 20 m, and x = 30 m, which are closer to the hull, the maximum height in deep water is larger; at x = 40 m, which is farthest from the hull, the maximum height in shallow water is larger. In Figure 13c, there is no obvious pattern in the change in the maximum height of the secondary waves for the 5000-ton CS with water depth, and it shows an overall decay trend with increasing distance.
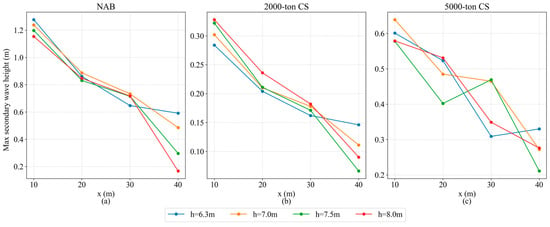
Figure 13.
Comparison of the maximum wave heights along the cross-section at different water depths for the navigation of (a) NAB; (b) 2000-ton CS; (c) 5000-ton CS.
4.2. Two-Ship Navigation in Opposite Directions
For two-ship navigation in opposite directions (2NOD), the most unfavorable situation would be in the intersection section of the two ships. The result output point is at the stable ship speed stage. This section takes the water level change at the intersection of two ships at x = 40 m as an example, as presented in Figure 14. The third-order Butterworth filter and cutoff frequency setting in Section 4.1. were also used to separate the primary waves and secondary waves. The situations of multiple water depths are also presented. The same time length is intercepted for 2000-ton and 5000-ton CSs. Figure 15 presents the comparison of the maximum wave heights along the cross-section at different water depths.
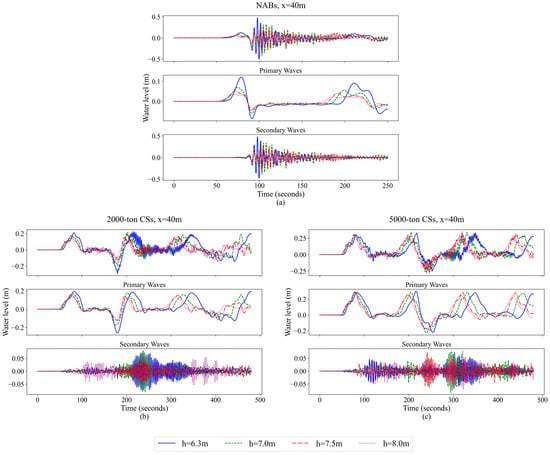
Figure 14.
Water level changes at different water depths during the navigation of (a) NABs, (b) 2000-ton CSs and (c) 5000-ton CSs at x = 40 m, and the primary and secondary waves separated by a third-order Butterworth filter.
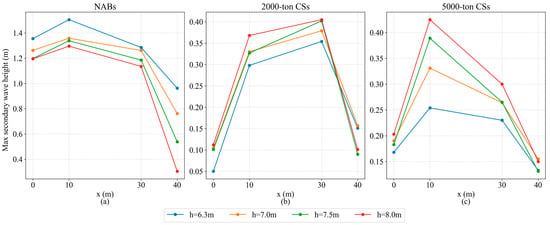
Figure 15.
Comparison of the maximum wave heights along the cross-section at different water depths for the navigation of two (a) NABs; (b) 2000-ton CSs; (c) 5000-ton CSs.
For NAB, the regular pattern of the ship waves with the water depth when 2NOD is similar to that when SN. Compared with a single navigation boat, the effect of ship waves is more significant due to superposition. Comparing Figure 13a and Figure 15a, it can be seen that at the same position in the channel, that is, x = 40 m, the heights of primary wave and secondary wave of 2NOD are significantly larger than those of SN. This is of course related to the changes in the output point and the relative position of ships caused by the changes in the navigation position of the ships, but it still shows that the hydrodynamics of the ships inside the water when 2NOD deserves attention.
When it is 2NOD for 2000-ton or 5000-ton CSs, the regular patterns of the primary waves varying with the water depth are similar to those when SN. However, compared with SN, the primary wave effect is more significant, almost doubled, while the max amplitude of the secondary waves is smaller than that of the primary waves. It is obvious that the energy is concentrated and easy to dissipate. The regular pattern of the secondary waves varying with the water depth is almost opposite to that of the NAB. As presented in Figure 15b,c, the maximum wave height of the secondary waves increases with the increase in water depth.
There are several differences in the characteristics of the ship waves for the 2000-ton CSs and 5000-ton CSs in the 2NOD conditions. The primary wave period of the 5000-ton CSs is relatively short, while the wave form is steeper and more complex. Furthermore, the drawdown wave appears after two wave crests, while that of the 2000-ton CSs appears between the two wave crests. The secondary wave energy of the 2000-ton CSs is more concentrated. At h = 6.3 m, the maximum wave height of the 2000-ton CSs at x = 10 m and x = 30 m is larger.
4.3. Discussion on Secondary Wave Height
Existing studies generally believe that when the depth Froude number < 1, the ship is navigating in the subcritical speed zone, and the height of the ship waves generally decreases with the increase in water depth. However, some simulation results of this study are obviously not consistent. It is assumed that there are two reasons for this.
First, in a restricted waterway, when the ship size and draft are large with shallow water, more wave energy will be dissipated due to the bottom friction. When the water depth increases, the interaction with the bottom of the waterway during the propagation of the secondary waves is weakened, meaning the energy dissipation is reduced, and the secondary waves can retain more energy during propagation, thus showing a larger maximum wave height.
Second, the principle of XBeach simulating ship waves is the movement of the water surface pressure field. In deep water, the pressure disturbance caused by the movement of the hull can be more effectively transmitted to the free water surface away from the hull, resulting in more energy generated by the secondary waves. Thus, the wave height of the secondary waves is increased. In shallow water, the pressure transmission is limited by the water depth, and the growth of the secondary wave height is suppressed.
However, there are many situations in actual ships meeting, such as different ship types, asymmetric navigation, different loads, etc. In addition, the model in this paper is a simple generalized straight section. The actual Pinglu Canal also has sections with complex flow fields such as curved waterways and ship lock exits. The above situations need to be further studied. Furthermore, one study [7] has shown that under some conditions, the simulation of XBeach for ship waves is quite different from the actual observation, and the maximum wave heights obtained by simulation are greater than the actual observation value. The simulation accuracy of this study may need to be validated by subsequent field observation and experiments.
5. Conclusions
As a high-level restricted waterway, the Pinglu Canal’s ship wave characteristics are worth studying when large ships are navigable and the cross-sectional scale is limited. Ship waves are divided into primary waves and secondary waves according to frequency, and their characteristics are affected by water depth and ship parameters. This study applied the XBeach numerical model, which performs well in simulating the generation and propagation of ship waves. Through field observations and validation on the Chengzi River waterway, it was confirmed that XBeach can simulate the hydrodynamic effects of ships in restricted waterways to a certain extent.
Through simulation, we explored the ship wave characteristics under different navigation conditions in the generalized channel model of the Pinglu Canal, focusing on the influence of ship type and water depth. For SN, when the ship size is small (i.e., NAB), the primary wave height is much smaller than the secondary wave height. As the water depth increases, the influence of the primary waves and the secondary wave height both show a decreasing trend. When the ship size is larger, the primary wave effect is relatively enhanced, the period is longer, and the relationship between the secondary wave height and the water depth becomes complicated. For both small and large ship size, the distance to the hull has little effect on the primary waves, but a more significant attenuation effect on the secondary waves. When 2NOD, the regular pattern of the change in ship waves with distance and primary waves with water depth is similar to that when SN. The ship wave effect of the NAB is stronger due to the superposition effect. For the two larger ships, the primary wave effect is significantly enhanced and occupies the dominant position of the ship waves. The secondary wave effect of the large ship is smaller than the primary wave, and the secondary wave height tends to increase with the increase in water depth. The possible reasons for the relationship between the secondary wave height and water depth are discussed. The simulation results may need validation by subsequent field observation and experiments.
This study provides a theoretical basis and technical support for ship wave risk assessment and ecological revetment design in the restricted waterway of the Pinglu Canal.
Author Contributions
Conceptualization, C.Z. and T.C.; methodology, T.C. and S.W.; software, C.Z. and X.X.; validation, S.W. and J.Y.; formal analysis, T.C.; investigation, J.Y. and X.X.; resources, C.Z. and J.P.; data curation, S.W.; writing—original draft preparation, S.W. and J.S.; writing—review and editing, C.Z. and S.W.; visualization, S.W. and J.S.; supervision, C.Z., S.X. and J.H.; project administration, C.Z. and J.P.; funding acquisition, S.X. All authors have read and agreed to the published version of the manuscript.
Funding
This research was funded by the National Natural Science Foundation of China, grant number 52271266.
Data Availability Statement
The original contributions presented in this study are included in the article. Further inquiries can be directed to the corresponding author.
Acknowledgments
The authors acknowledge the Chengzi River Ship Lock Management Office in Suqian, Jiangsu, for the equipment, materials and support provided during the field observations.
Conflicts of Interest
Authors Chu Zhang, Tiejun Cheng and Jiacheng You were employed by Changjiang Wuhan Waterway Engineering Bureau, Wuhan, China. Author Jian Pan was employed by Guangxi Pinglu Canal Construction Co., Ltd., Qinzhou, China. Author Xiangyu Xu was employed by Pinglu Canal Group Co., Ltd., Nanning, China. The remaining authors declare that the research was conducted in the absence of any commercial or financial relationships that could be construed as a potential conflict of interest.
Abbreviations
The following abbreviations are used in this manuscript:
| SN | Single-ship navigation |
| 2NOD | Two-ship navigation in opposite directions |
| NAB | Navigation administration boat |
| CS | Cargo ship |
| UAV | Unmanned aerial vehicle |
| Obs. | Observation |
| CFL | Courant–Friedrichs–Lewy number |
| MAE | Mean absolute error |
| RMSE | Root mean square error |
References
- Wang, L.; Guan, M.; Fang, K.; Liang, L.; Wang, P. Numerical Simulation of Ship-borne Waves by a Boussinesq-type Model. Mar. Sci. Bull. 2024, 1–9. Available online: https://link.cnki.net/urlid/12.1076.P.20240913.1406.002 (accessed on 15 June 2025).
- Wang, L.; Wang, J.; Xu, H.; Yang, Y. Research on the Calculation Method of Ship Wave Height in the Jianghuai Canal. J. Waterw. Harb. 2023, 44, 611–617. [Google Scholar]
- Yasir, M.; Jianhua, W.; Mingming, X.; Hui, S.; Zhe, Z.; Shanwei, L.; Colak, A.T.I.; Hossain, M.S. Ship detection based on deep learning using SAR imagery: A systematic literature review. Soft Comput. 2023, 27, 63–84. [Google Scholar] [CrossRef]
- Zhou, M.; Roelvink, D.; Verheij, H.J.; Ligteringen, H. Study of passing ship effects along a bank by Delft 3D-flow and XBeach. In Proceedings of the International Workshop on Nautical Traffic Models IWNTM13, Delft, The Netherlands, 5–7 June 2013; pp. 71–81. [Google Scholar]
- de Jong, M.; Roelvink, D.J.A.; Reijmerink, B.; Breederveld, C. Numerical modelling of passing-ship effects in complex geometries and on shallow water. In Proceedings of the Pianc Smart Rivers 2013, Maastricht, The Netherlands and Liège, Belgium, 23–27 September 2013; pp. 23–27. [Google Scholar] [CrossRef]
- Zhou, M.; Zou, Z.; Roelvink, D. Prediction of ship-ship interactions in ports by a non-hydrostatic model. J. Hydrodyn. 2015, 27, 824–834. [Google Scholar] [CrossRef]
- Almström, B.; Roelvink, D.; Larson, M. Predicting ship waves in sheltered waterways—An application of XBeach to the Stockholm Archipelago, Sweden. Coast. Eng. 2021, 170, 104026. [Google Scholar] [CrossRef]
- Bluteau, C.E.; Rooijen, A.v.; Matte, P.; Dumont, D. Impacts of Ship-Induced Waves along Shorelines during Flooding Events. J. Waterw. Port Coast. Ocean Eng. 2023, 149, 04023015. [Google Scholar] [CrossRef]
- Mao, L.; Li, X.; Chen, Y. Impacts of Ship Waves on Bed Morphology of a Trapezoidal Cross-Sectional Channel. J. Offshore Mech. Arct. Eng. 2022, 144, 051201. [Google Scholar] [CrossRef]
- Mao, L.; Chen, Y. Sediment movement in inland waterways under the influence of ship waves. J. Sediment Res. 2023, 48, 22–29. [Google Scholar] [CrossRef]
- Mao, L.; Chen, Y. Investigation of Ship-Induced Hydrodynamics and Sediment Suspension in a Heavy Shipping Traffic Waterway. J. Mar. Sci. Eng. 2020, 8, 424. [Google Scholar] [CrossRef]
- Zhang, L.; Zhou, L.; Sheng, X.; Du, W. Experimental study on the influence of ship waves on mooring ships. J. Wuhan Univ. Technol. (Transp. Sci. Eng.) 2021, 45, 1108–1112. [Google Scholar]
- Wang, M.; Deng, B.; Jiang, C.; Wu, Z. Numerical study on propagation characteristics of ship waves in a restricted channel. J. Water Resour. Water Eng. 2020, 31, 157–163. [Google Scholar]
- Ma, C.; Liu, Z.; Yang, Y.; Zhan, C.; Chen, X.; Feng, B.; Chang, H. The reverse prediction of the ship principal dimensions based on the Kelvin ship waves. Ocean Eng. 2023, 285, 115308. [Google Scholar] [CrossRef]
- Yang, Y.; Eloot, K.; Delefortrie, G.; el Moctar, O. Experimental and numerical investigations of ship–ship interaction during overtaking for benchmarking. Appl. Ocean Res. 2025, 154, 104325. [Google Scholar] [CrossRef]
- Wang, S. Research on Ship Traveling Waves (Part One). J. Waterw. Harb. 1980, 4, 21–37. Available online: https://kns.cnki.net/kcms2/article/abstract?v=7HNy6Ze5ODHpJQSTJgev1-XABW5LjFDtC7cP90-l_ujWrju5kZFNrfg5vZ6TrWqL-56sDjIFGno3EbziwrGBwv2I3U10L8dTlTrgPPDAu6wKDmt5i3eUCaGzyWMEcFuq4jmdA_4pCmhE50epV8n6zKrfJU4S6O74xEIKiMwwTAIHcQMTljo-c-FZno8sUmQg&uniplatform=NZKPT&language=CHS (accessed on 15 June 2025).
- Rankine, W.J.M. On waves which travel along with ships. Trans. Inst. Nav. Archit. 1868, 9, 275–281. [Google Scholar]
- Froude, W. Experiments upon the effect produced on the wave making resistance of ships by length of parallel middle body. In Transactions of the Institution of Naval Architects; Forgotten Books: London, UK, 1877; Volume 18. [Google Scholar]
- Kelvin, L. On the waves produced by a single impulse in water of any depth. Philos. Trans. R. Soc. Lond. 1887, 178, 269–271. [Google Scholar]
- Thomson, W. On ship waves. Proc. Inst. Mech. Eng. 1887, 38, 409–434. [Google Scholar] [CrossRef]
- Havelock, T.H. The propagation of groups of waves in dispersive media, with application to waves on water produced by a travelling disturbance. Proc. R. Soc. Lond. Ser. A-Contain. Pap. A Math. Phys. Character 1908, 81, 398–430. [Google Scholar] [CrossRef]
- Havelock, T.H. The calculation of wave resistance. Proc. R. Soc. Lond. Ser. A-Contain. Pap. A Math. Phys. Character 1934, 144, 0514–0537. [Google Scholar] [CrossRef]
- Hongner, E. A contribution to the theory of ship waves. Arkiv for Mate. Astron. Och Fys. 1923, 17, 2. Available online: https://9lib.org/document/ozl3oloz-a-contribution-to-the-theory-of-ship-waves.html (accessed on 15 June 2025).
- Li, S. The Theoretical Basis of Wave Resistance; People’s Communications Publishing House: Beijing, China, 1986; pp. 20–26. Available online: https://cadal.edu.cn/cx/reader/reader/book/reader.shtml?channel=4&code=61939c3491b9e0d2a6c41ca3f6d74eb6&epage=-1&ipinside=0&netuser=0&spage=1&ssno=58000159&userid=901476644&bookType=1&unit=openapi&backUrl=&cpage=248 (accessed on 15 June 2025).
- Wang, X. Ship waves. Acta Mech. Sin. 1975, 1, 55–56. Available online: https://kns.cnki.net/kcms2/article/abstract?v=7HNy6Ze5ODGTM8Gb6-pjadIPjP-1WzjQcSRHrv4vqAcDsxHcgU0BK2Nz0zGNRk36V2NYgm_ULRPXm_JSwgG0MBy1i3SL2ijOfId4LfAPQwIdQDwGNlcMEkJjICG35dSyaV92cNaQlBRsDl5N_MhVt1EmUt2ehP_WcxPIEAvL_g5JlFkRBLKHqmDK_lmNiDHP&uniplatform=NZKPT&language=CHS (accessed on 15 June 2025).
- MacFarlane, G.; Renilson, M. Wave Wake—A Rational Method for Assessment. In Proceedings of International Conference on Coastal Ships and Inland Waterways, London, UK, 17–18 February 1999; pp. 1–15. Available online: https://hdl.handle.net/102.100.100/526471 (accessed on 15 June 2025).
- Torsvik, T.; Soomere, T. Simulation of patterns of wakes from high-speed ferries in Tallinn Bay. Est. J. Eng. 2008, 14, 232–254. [Google Scholar] [CrossRef]
- Thomson, W. XXVII. On the waves produced by a single impulse in water of any depth, or in a dispersive medium. Lond. Edinb. Dublin Philos. Mag. J. Sci. 1887, 23, 252–255. [Google Scholar] [CrossRef]
- Roelvink, D.; Reniers, A.; van Dongeren, A.; de Vries, J.V.; McCall, R.; Lescinski, J. Modelling storm impacts on beaches, dunes and barrier islands. Coast. Eng. 2009, 56, 1133–1152. [Google Scholar] [CrossRef]
- Smit, P.; Stelling, G.; Roelvink, D.J.A.; Thiel de Vries, J.; McCall, R.; van Dongeren, A.; Jacobs, R. XBeach: Non-Hydrostatic Model: Validation, Verification and Model Description; Delft University of Technology and Deltares report; Delft University of Technology: Delft, The Netherlands, 2010. [Google Scholar]
Disclaimer/Publisher’s Note: The statements, opinions and data contained in all publications are solely those of the individual author(s) and contributor(s) and not of MDPI and/or the editor(s). MDPI and/or the editor(s) disclaim responsibility for any injury to people or property resulting from any ideas, methods, instructions or products referred to in the content. |
© 2025 by the authors. Licensee MDPI, Basel, Switzerland. This article is an open access article distributed under the terms and conditions of the Creative Commons Attribution (CC BY) license (https://creativecommons.org/licenses/by/4.0/).