

Design and Properties of Titanium Dioxide/Graphene Oxide Composites Exploitable in Wastewater Treatments

 ,
, 
 and
and
Abstract

1. Introduction
2. Materials and Methods
2.1. Materials
2.2. Synthesis of TGO
2.3. Physicochemical Characterization
2.4. Functional Characterization
3. Results and Discussion
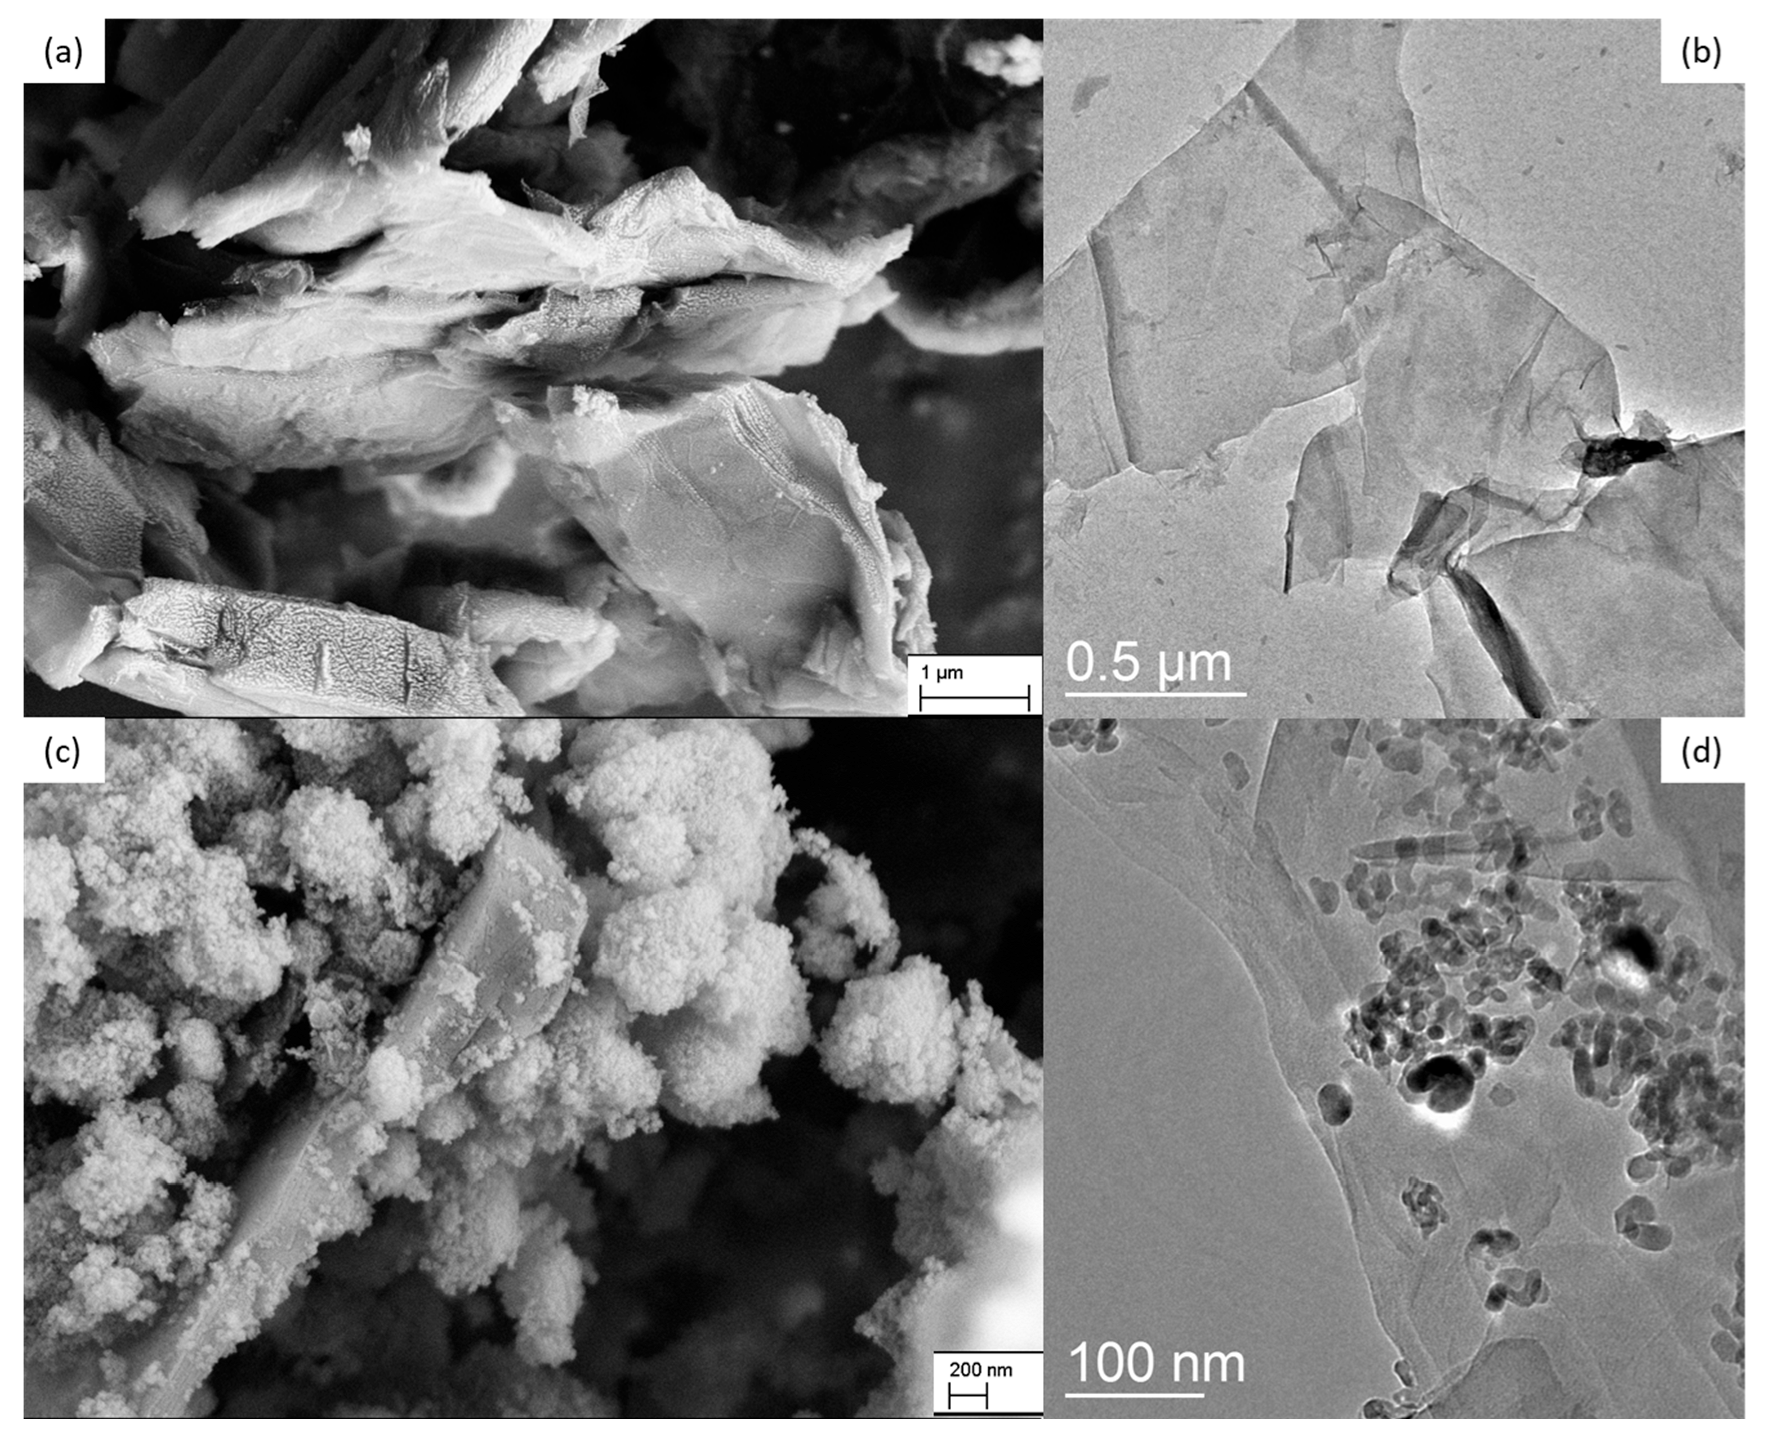
3.1. Physicochemical Characterization
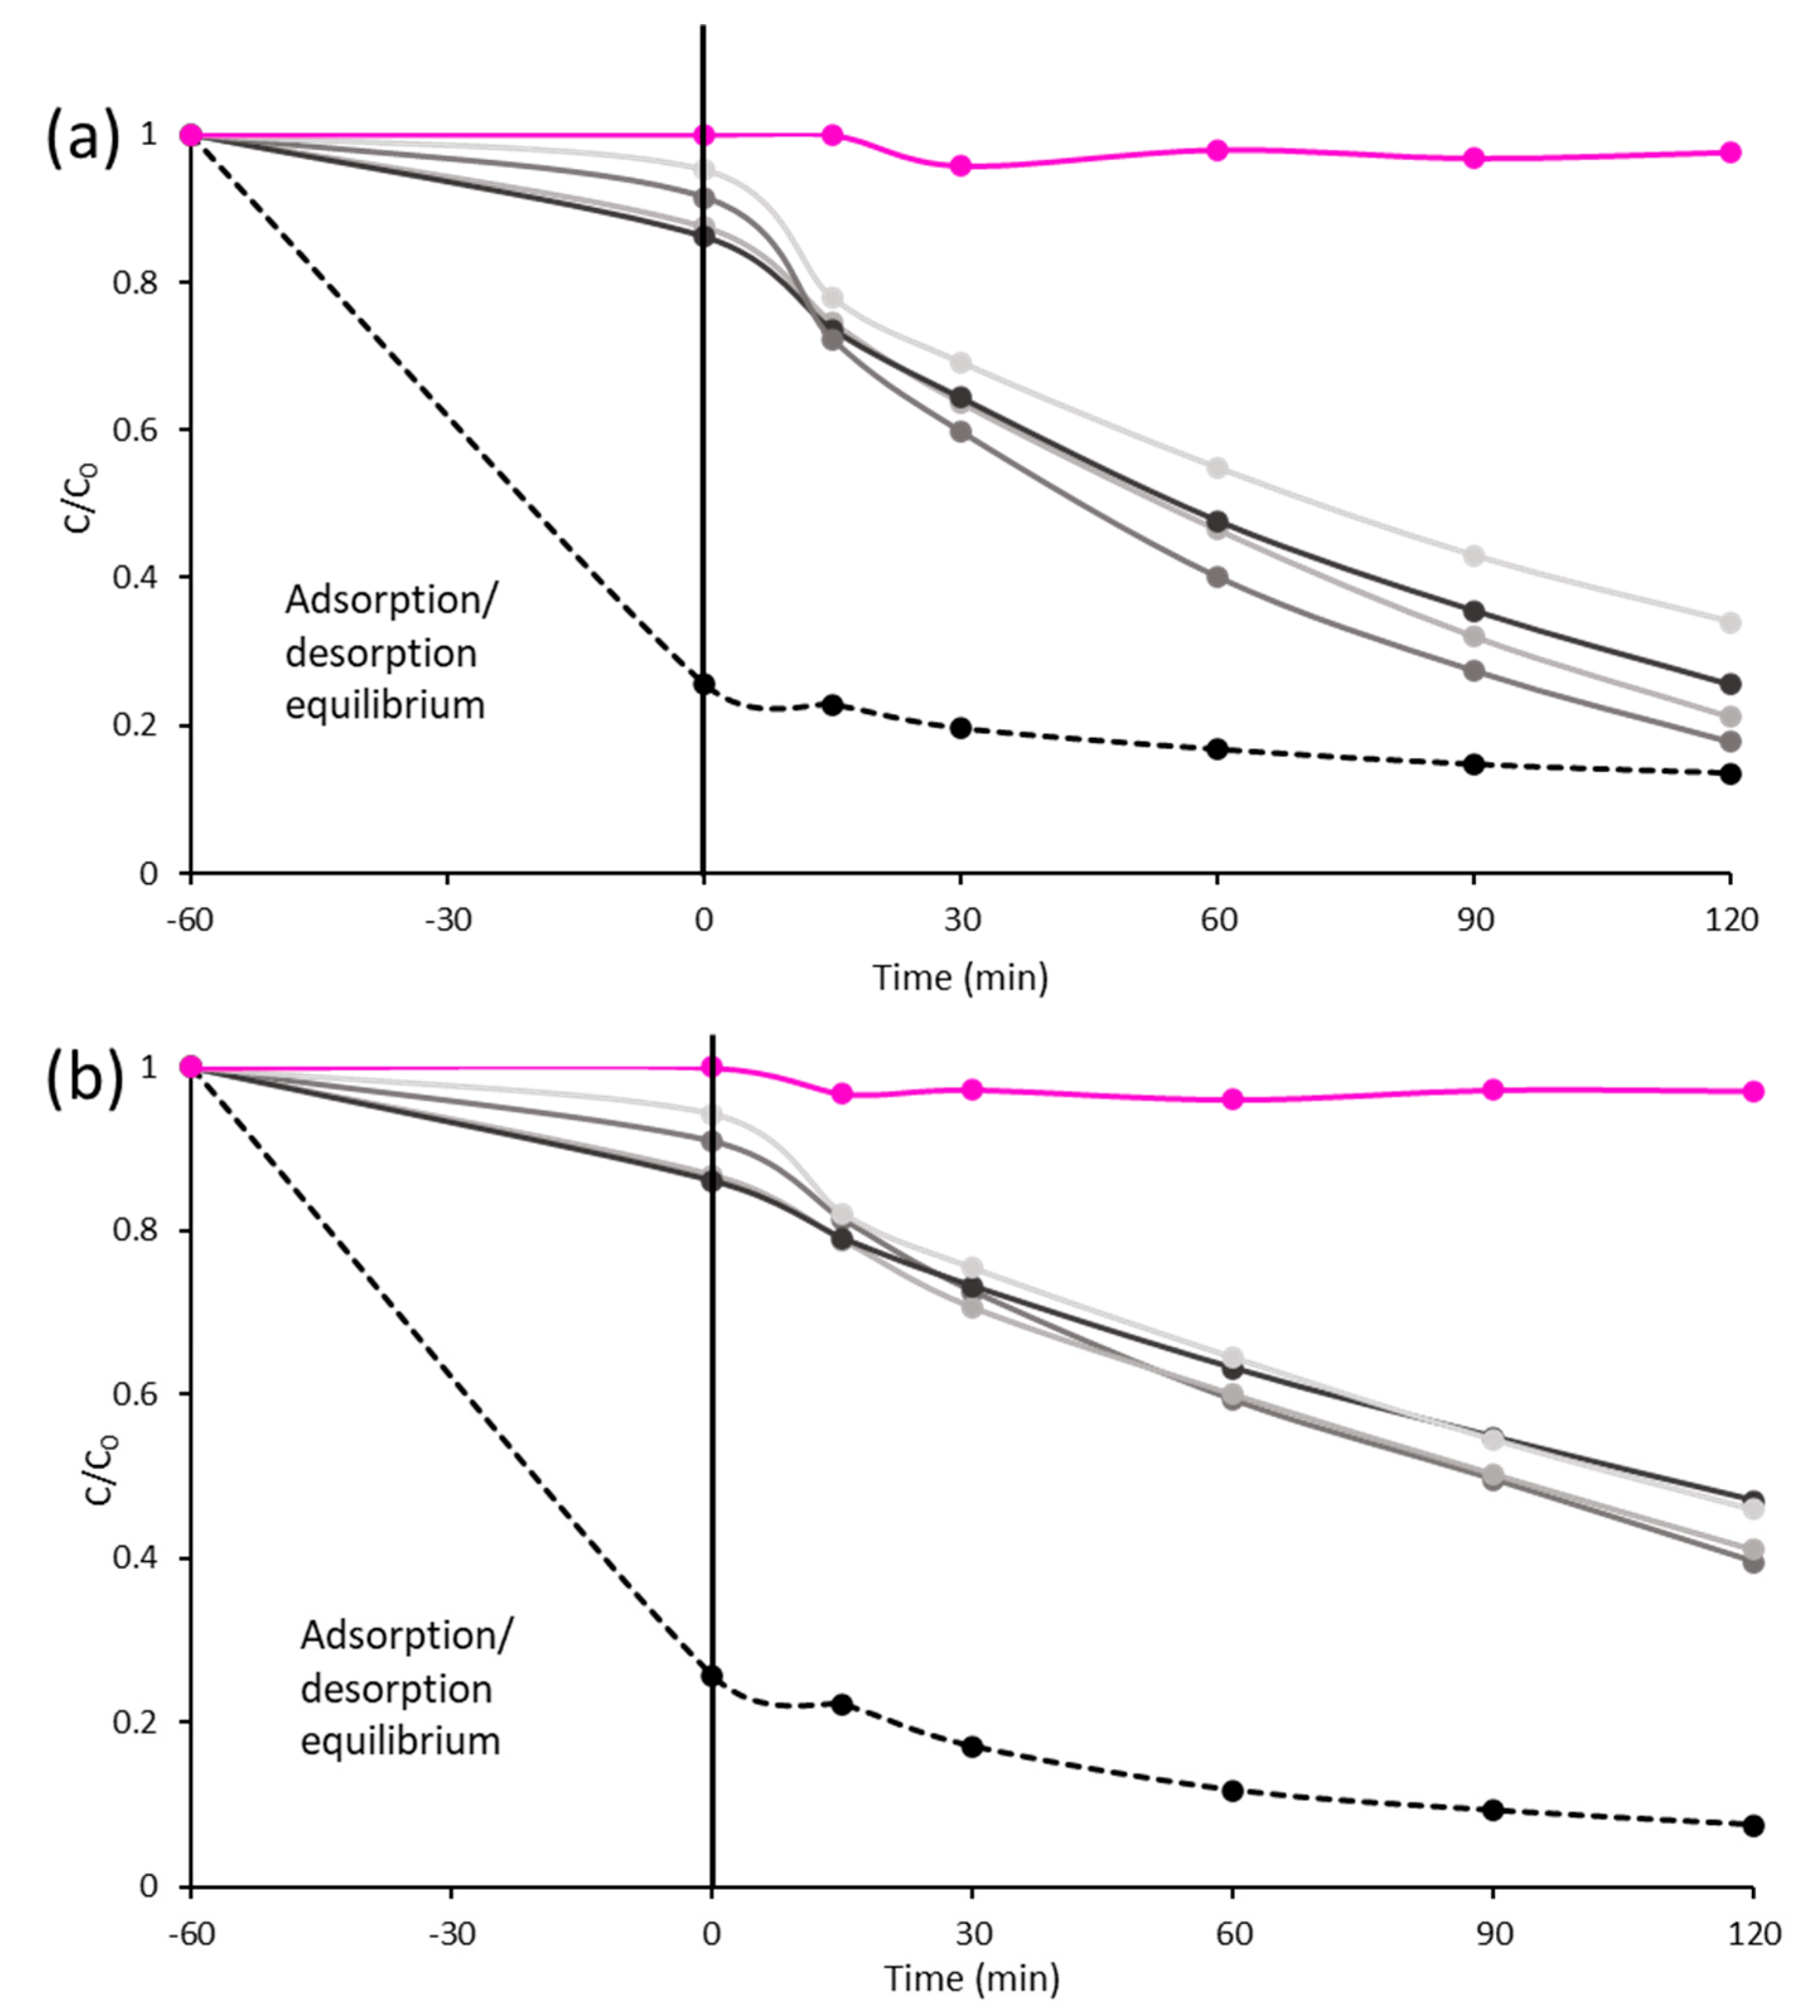
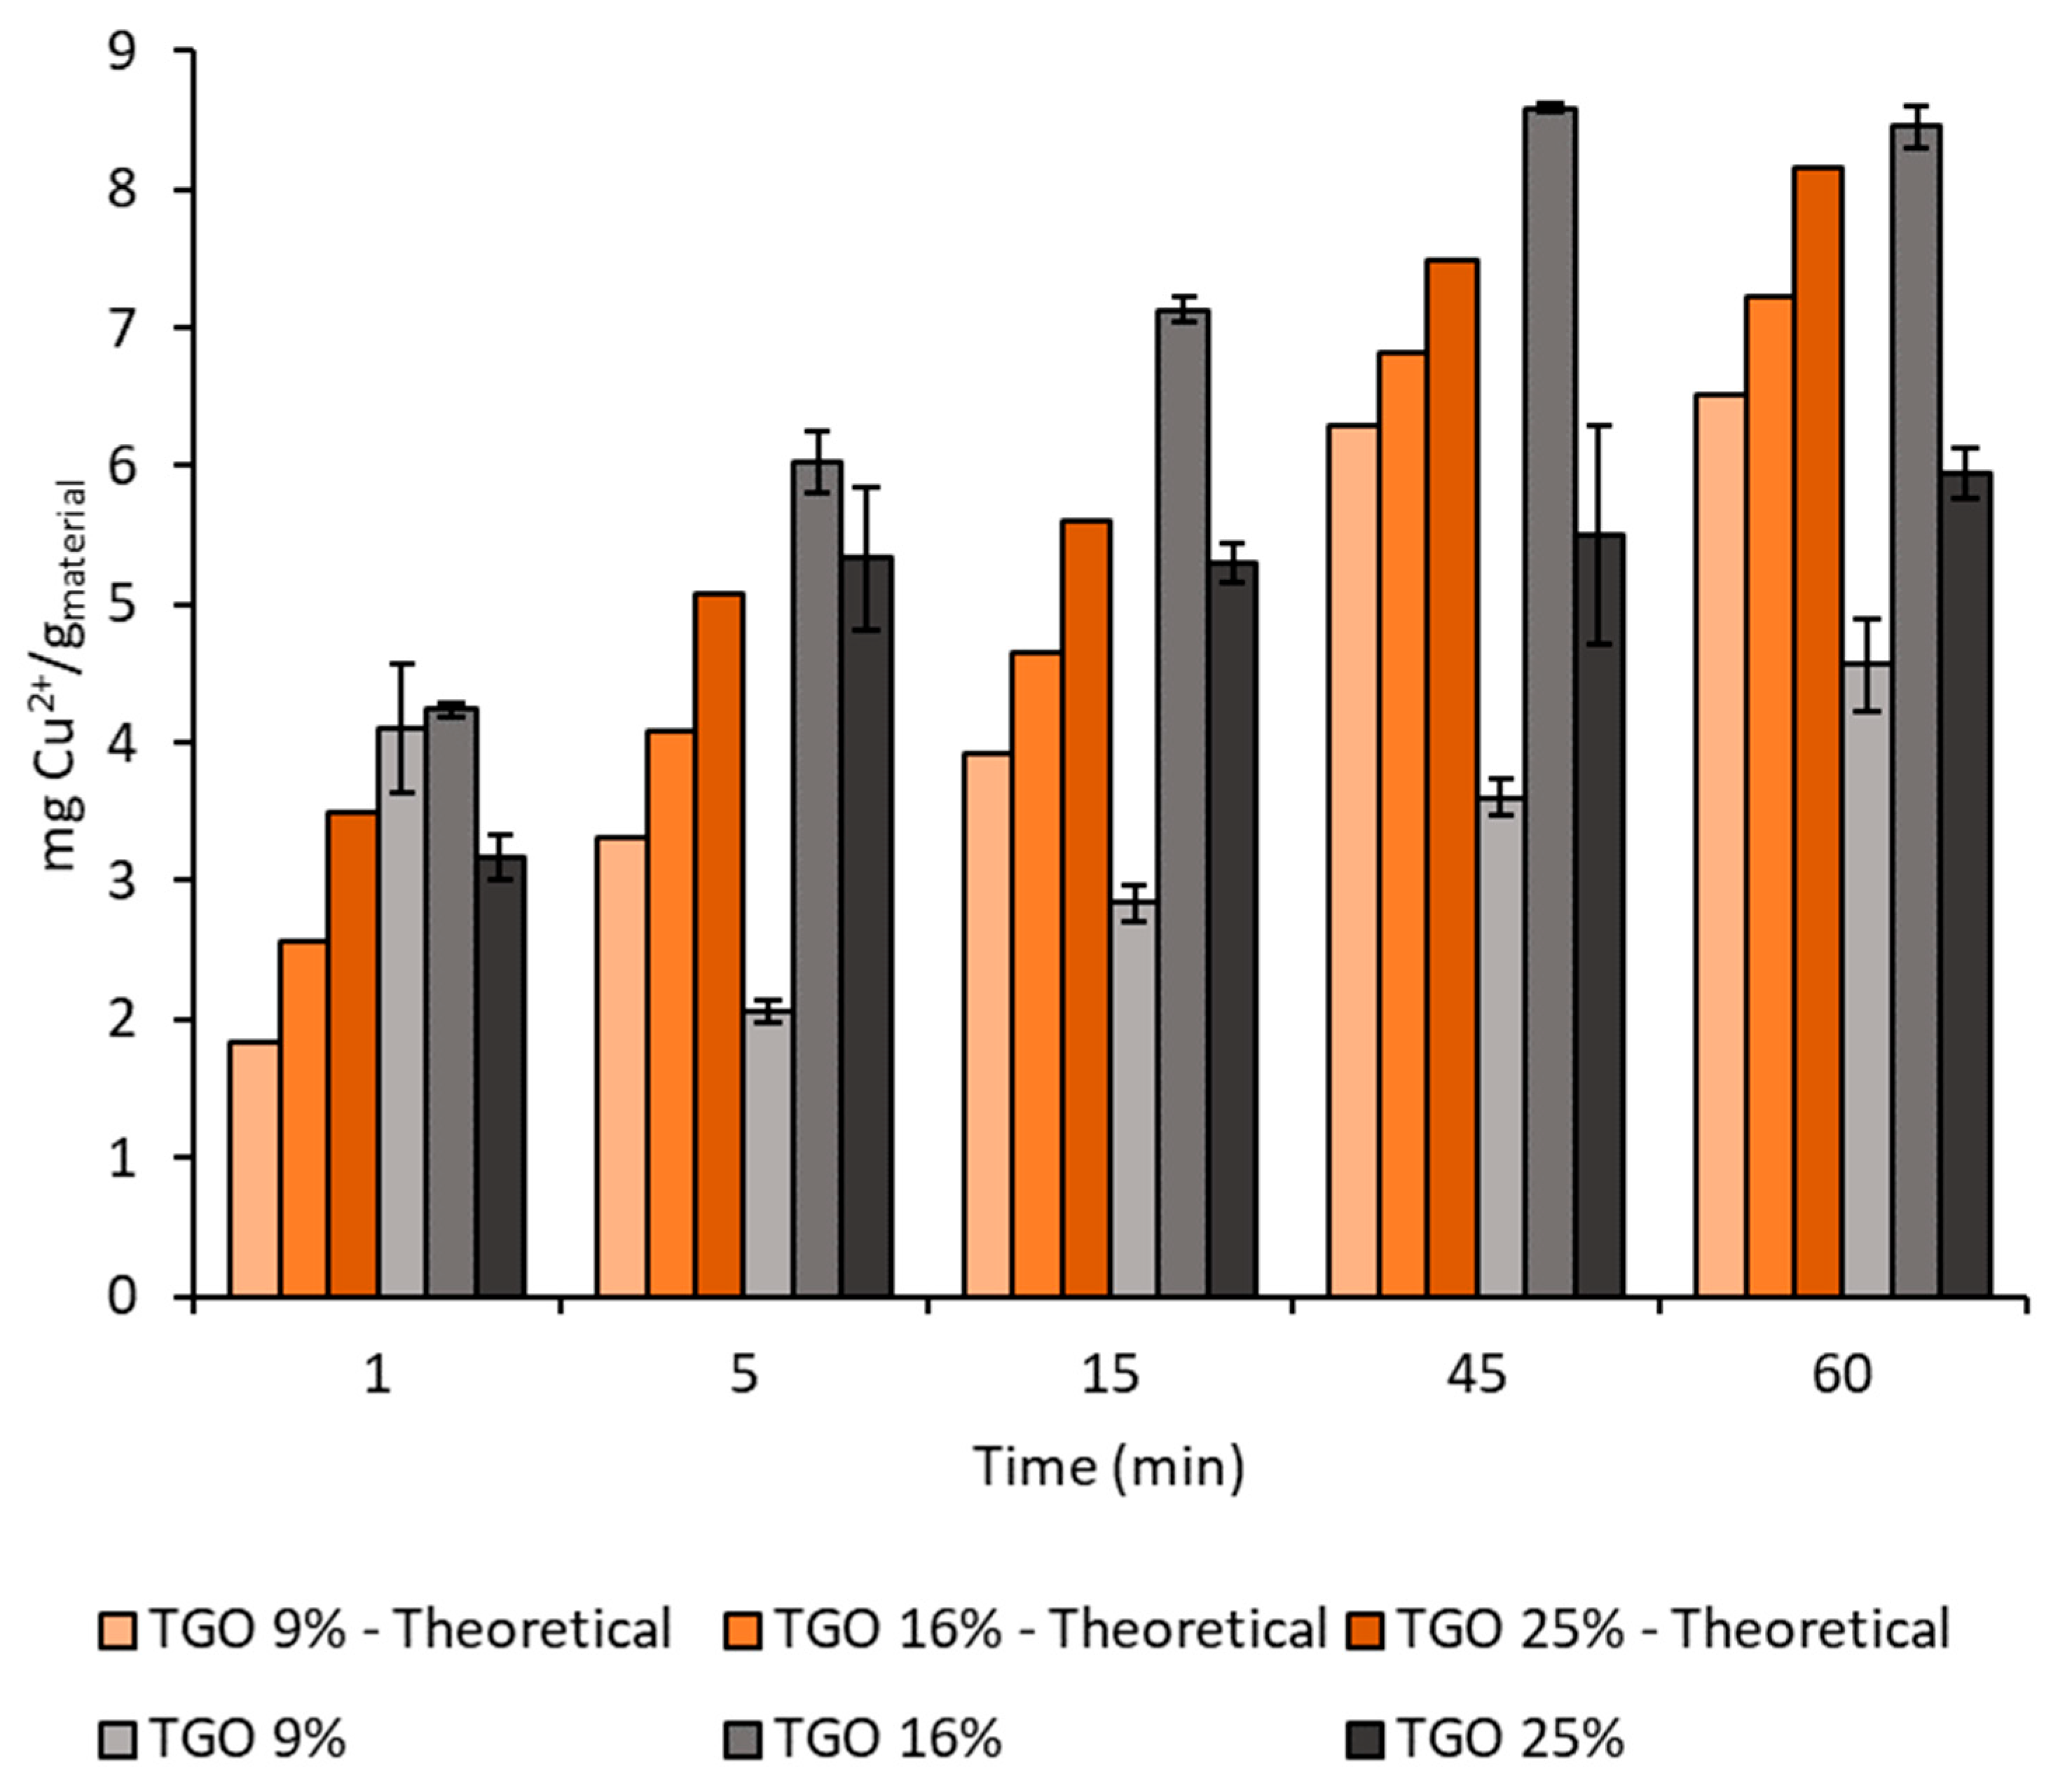
3.2. Functional Characterization
4. Conclusions
Supplementary Materials
Author Contributions
Funding
Data Availability Statement
Conflicts of Interest
References
- ONU. Transforming Our World: The 2030 Agenda for Sustainable Development; United Nations: New York, NY, USA, 2015. [Google Scholar]
- UNICEF; WHO. Progress on Household Drinking Water, Sanitation and Hygiene 2000–2017: Special Focus on Inequalities. UNICEF: New York, NY, USA; Geneva, Switzerland, 2019; p. 140. [Google Scholar]
- Frédéric, S. EU Commission Unveils ‘European Green Deal’: The Key Points. Available online: https://www.euractiv.com/ (accessed on 29 December 2019).
- Clarke, R.M.; Cummins, E. Evaluation of “Classic” and Emerging Contaminants Resulting from the Application of Biosolids to Agricultural Lands: A Review. Hum. Ecol. Risk Assess. Int. J. 2015, 21, 492–513. [Google Scholar] [CrossRef]
- Nikolaou, A. Pharmaceuticals and Related Compounds as Emerging Pollutants in Water: Analytical Aspects. Glob. Nest J. 2013, 15, 1–12. [Google Scholar] [CrossRef]
- Azizi-Lalabadi, M.; Pirsaheb, M. Investigation of Steroid Hormone Residues in Fish: A Systematic Review. Process Saf. Environ. Prot. 2021, 152, 14–24. [Google Scholar] [CrossRef]
- Kurian, M. Advanced Oxidation Processes and Nanomaterials—A Review. Clean. Eng. Technol. 2021, 2, 100090. [Google Scholar] [CrossRef]
- Gatou, M.A.; Syrrakou, A.; Lagopati, N.; Pavlatou, E.A. Photocatalytic TiO2-Based Nanostructures as a Promising Material for Diverse Environmental Applications: A Review. Reactions 2024, 5, 135–194. [Google Scholar] [CrossRef]
- Zhang, S.; Gu, P.; Ma, R.; Luo, C.; Wen, T.; Zhao, G.; Cheng, W.; Wang, X. Recent Developments in Fabrication and Structure Regulation of Visible-Light-Driven g-C3N4-Based Photocatalysts towards Water Purification: A Critical Review. Catal. Today 2019, 335, 65–77. [Google Scholar] [CrossRef]
- Devi, L.G.; Kavitha, R. A Review on Non Metal Ion Doped Titania for the Photocatalytic Degradation of Organic Pollutants under UV/Solar Light: Role of Photogenerated Charge Carrier Dynamics in Enhancing the Activity. Appl. Catal. B Environ. 2013, 140–141, 559–587. [Google Scholar] [CrossRef]
- Acharya, R.; Parida, K. A Review on TiO2/g-C3N4 Visible-Light-Responsive Photocatalysts for Sustainable Energy Generation and Environmental Remediation. J. Environ. Chem. Eng. 2020, 8, 103896. [Google Scholar] [CrossRef]
- Mishra, S.; Marandi, B.; Sanjay, K.; Acharya, R. Graphitic Carbon Nitride Loaded Bi4O5I2 for Elevated Photocatalytic Tetracycline Degradation. Ournal Met. Mater. Miner. 2025, 35, e2261. [Google Scholar] [CrossRef]
- Xia, X.-H.; Jia, Z.-J.; Yu, Y.; Liang, Y.; Wang, Z.; Ma, L.-L. Preparation of Multi-Walled Carbon Nanotube Supported TiO2 and Its Photocatalytic Activity in the Reduction of CO2 with H2O. Carbon N. Y. 2007, 45, 717–721. [Google Scholar] [CrossRef]
- Mofijur, M.; Hasan, M.M.; Ahmed, S.F.; Djavanroodi, F.; Fattah, I.M.R.; Silitonga, A.S.; Kalam, M.A.; Zhou, J.L.; Khan, T.M.Y. Advances in Identifying and Managing Emerging Contaminants in Aquatic Ecosystems: Analytical Approaches, Toxicity Assessment, Transformation Pathways, Environmental Fate, and Remediation Strategies. Environ. Pollut. 2024, 341, 122889. [Google Scholar] [CrossRef]
- Chen, X.; Mao, S.S. Titanium Dioxide Nanomaterials: Synthesis, Properties, Modifications, and Applications. Chem. Rev. 2007, 107, 2891–2959. [Google Scholar] [CrossRef] [PubMed]
- Burda, C.; Chen, X.; Narayanan, R.; El-Sayed, M.A. Chemistry and Properties of Nanocrystals of Different Shapes. Chem. Rev. 2005, 105, 1025–1102. [Google Scholar] [CrossRef]
- Lerf, A.; He, H.; Forster, M.; Klinowski, J. Structure of Graphite Oxide Revisited. J. Phys. Chem. B 1998, 102, 4477–4482. [Google Scholar] [CrossRef]
- Guerrero-Contreras, J.; Caballero-Briones, F. Graphene Oxide Powders with Different Oxidation Degree, Prepared by Synthesis Variations of the Hummers Method. Mater. Chem. Phys. 2015, 153, 209–220. [Google Scholar] [CrossRef]
- Berberidou, C.; Kyzas, G.Z.; Paspaltsis, I.; Sklaviadis, T.; Poulios, I. Photocatalytic Disinfection and Purification of Water Employing Reduced Graphene Oxide/TiO2 Composites. J. Chem. Technol. Biotechnol. 2019, 94, 3905–3914. [Google Scholar] [CrossRef]
- Jiang, G.; Lin, Z.; Chen, C.; Zhu, L.; Chang, Q.; Wang, N.; Wei, W.; Tang, H. TiO2 Nanoparticles Assembled on Graphene Oxide Nanosheets with High Photocatalytic Activity for Removal of Pollutants. Carbon N. Y. 2011, 49, 2693–2701. [Google Scholar] [CrossRef]
- Saroyan, H.S.; Bele, S.; Giannakoudakis, D.A.; Samanidou, V.F.; Bandosz, T.J.; Deliyanni, E.A. Degradation of Endocrine Disruptor, Bisphenol-A, on an Mixed Oxidation State Manganese Oxide/Modified Graphite Oxide Composite: A Role of Carbonaceous Phase. J. Colloid Interface Sci. 2019, 539, 516–524. [Google Scholar] [CrossRef]
- Trapalis, A.; Todorova, N.; Giannakopoulou, T.; Boukos, N.; Speliotis, T.; Dimotikali, D.; Yu, J. TiO2/Graphene Composite Photocatalysts for NOx Removal: A Comparison of Surfactant-Stabilized Graphene and Reduced Graphene Oxide. Appl. Catal. B Environ. 2016, 180, 637–647. [Google Scholar] [CrossRef]
- Zhang, H.; Wang, X.; Li, N.; Xia, J.; Meng, Q.; Ding, J.; Lu, J. Synthesis and Characterization of TiO2/Graphene Oxide Nanocomposites for Photoreduction of Heavy Metal Ions in Reverse Osmosis Concentrate. RSC Adv. 2018, 8, 34241–34251. [Google Scholar] [CrossRef]
- Giannakoudakis, D.A.; Farahmand, N.; Łomot, D.; Sobczak, K.; Bandosz, T.J.; Colmenares, J.C. Ultrasound-Activated TiO2/GO-Based Bifunctional Photoreactive Adsorbents for Detoxification of Chemical Warfare Agent Surrogate Vapors. Chem. Eng. J. 2020, 395, 125099. [Google Scholar] [CrossRef]
- Shaik, B.B.; Katari, N.K.; Raghupathi, J.K.; Jonnalagadda, S.B.; Rana, S. Titanium Dioxide/Graphene-Based Nanocomposites as Photocatalyst for Environmental Applications: A Review. ChemistrySelect 2024, 9, e202403521. [Google Scholar] [CrossRef]
- Badoni, A.; Thakur, S.; Vijayan, N.; Swart, H.C.; Bechelany, M.; Chen, Z.; Sun, S.; Cai, Q.; Chen, Y.; Prakash, J. Recent Progress in Understanding the Role of Graphene Oxide, TiO2 and Graphene Oxide-TiO2 Nanocomposites as Multidisciplinary Photocatalysts in Energy and Environmental Applications. Catal. Sci. Technol. 2025, 15, 1702–1770. [Google Scholar] [CrossRef]
- Naghavi, N.; Jalaly, M.; Mohammadi, S.; Mousavi-Khoshdel, S.M. An Investigation into the Influence of Graphene Content on Achieving a High-Performance TiO2-Graphene Nanocomposite Supercapacitor. ChemistryOpen 2024, 13, 202400128. [Google Scholar] [CrossRef]
- Basso Peressut, A.; Cristiani, C.; Dotelli, G.; Dotti, A.; Latorrata, S.; Bahamonde, A.; Gascó, A.; Hermosilla, D.; Balzarotti, R. Reduced Graphene Oxide/Waste-Derived TiO2 Composite Membranes: Preliminary Study of a New Material for Hybrid Wastewater Treatment. Nanomaterials 2023, 13, 1043. [Google Scholar] [CrossRef]
- Morales-Torres, S.; Pastrana-Martínez, L.M.; Figueiredo, J.L.; Faria, J.L.; Silva, A.M.T. Design of Graphene-Based TiO2 Photocatalysts—A Review. Environ. Sci. Pollut. Res. 2012, 19, 3676–3687. [Google Scholar] [CrossRef]
- Mishra, S.; Acharya, R.; Parida, K. Spinel-Ferrite-Decorated Graphene-Based Nanocomposites for Enhanced Photocatalytic Detoxification of Organic Dyes in Aqueous Medium: A Review. Water 2023, 15, 81. [Google Scholar] [CrossRef]
- Mishra, S.; Acharya, L.; Sharmila, S.; Sanjay, K.; Acharya, R. Designing G-C3N4/NiFe2O4 S-Scheme Heterojunctions for Efficient Photocatalytic Degradation of Rhodamine B and Tetracycline Hydrochloride. Appl. Surf. Sci. Adv. 2024, 24, 100647. [Google Scholar] [CrossRef]
- Acharya, R.; Sillanpää, M.; Al-Farraj, S. A Comprehensive Review on Sequestration of Aqueous Cr (VI) over Graphene Based Adsorbents. J. Hazard. Mater. Adv. 2025, 18, 100670. [Google Scholar] [CrossRef]
- Acharya, R.; Lenka, A.; Parida, K. Magnetite Modified Amino Group Based Polymer Nanocomposites towards Efficient Adsorptive Detoxification of Aqueous Cr (VI): A Review. J. Mol. Liq. 2021, 337, 116487. [Google Scholar] [CrossRef]
- Adly, M.S.; El-Dafrawy, S.M.; El-Hakam, S.A. Application of Nanostructured Graphene Oxide/Titanium Dioxide Composites for Photocatalytic Degradation of Rhodamine B and Acid Green 25 Dyes. J. Mater. Res. Technol. 2019, 8, 5610–5622. [Google Scholar] [CrossRef]
- Lee, S.-Y.; Park, S.-J. TiO2 Photocatalyst for Water Treatment Applications. J. Ind. Eng. Chem. 2013, 19, 1761–1769. [Google Scholar] [CrossRef]
- Tauc, J. Optical Properties and Electronic Structure of Amorphous Ge and Si. Mater. Res. Bull. 1968, 3, 37–46. [Google Scholar] [CrossRef]
- Fuente, E.; Menéndez, J.A.; Díez, M.A.; Suárez, D.; Montes-Morán, M.A. Infrared Spectroscopy of Carbon Materials: A Quantum Chemical Study of Model Compounds. J. Phys. Chem. B 2003, 107, 6350–6359. [Google Scholar] [CrossRef]
- Nguyen-Phan, T.-D.; Pham, V.H.; Shin, E.W.; Pham, H.-D.; Kim, S.; Chung, J.S.; Kim, E.J.; Hur, S.H. The Role of Graphene Oxide Content on the Adsorption-Enhanced Photocatalysis of Titanium Dioxide/Graphene Oxide Composites. Chem. Eng. J. 2011, 170, 226–232. [Google Scholar] [CrossRef]
- Almeida, N.A.; Martins, P.M.; Teixeira, S.; Lopes da Silva, J.A.; Sencadas, V.; Kühn, K.; Cuniberti, G.; Lanceros-Mendez, S.; Marques, P.A.A.P. TiO2/Graphene Oxide Immobilized in P(VDF-TrFE) Electrospun Membranes with Enhanced Visible-Light-Induced Photocatalytic Performance. J. Mater. Sci. 2016, 51, 6974–6986. [Google Scholar] [CrossRef]
- Wang, G.; Guo, W.; Xu, D.; Liu, D.; Qin, M. Graphene Oxide Hybridised TiO2 for Visible Light Photocatalytic Degradation of Phenol. Symmetry 2020, 12, 1420. [Google Scholar] [CrossRef]
- Tang, B.; Chen, H.; Peng, H.; Wang, Z.; Huang, W. Graphene Modified TiO2 Composite Photocatalysts: Mechanism, Progress and Perspective. Nanomaterials 2018, 8, 105. [Google Scholar] [CrossRef]
- Kong, E.D.H.; Chau, J.H.F.; Lai, C.W.; Khe, C.S.; Sharma, G.; Kumar, A.; Siengchin, S.; Sanjay, M.R. GO/TiO2-Related Nanocomposites as Photocatalysts for Pollutant Removal in Wastewater Treatment. Nanomaterials 2022, 12, 3536. [Google Scholar] [CrossRef]
- Volfkovich, Y.M.; Rychagov, A.Y.; Sosenkin, V.E.; Baskakov, S.A.; Kabachkov, E.N.; Shulga, Y.M. Supercapacitor Properties of RGO-TiO2 Nanocomposite in Two-Component Acidic Electrolyte. Materials 2022, 15, 7856. [Google Scholar] [CrossRef]
- Tronox Ultrafine and Specialty Titanium Dioxide: CristalACTiVTM DT-51. Available online: https://www.tronox.com/product/cristalactiv-dt-51/ (accessed on 8 May 2025).
- Ding, C.; Qin, X.; Tian, Y.; Cheng, B. PES Membrane Surface Modification via Layer-by-Layer Self-Assembly of GO@TiO2 for Improved Photocatalytic Performance. J. Memb. Sci. 2022, 659, 120789. [Google Scholar] [CrossRef]
- Utami, M.; Wang, S.; Fajarwati, F.I.; Salsabilla, S.N.; Dewi, T.A.; Fitri, M. Enhanced Photodegradation of Rhodamine B Using Visible-Light Sensitive N-TiO2/RGO Composite. Crystals 2023, 13, 588. [Google Scholar] [CrossRef]
- Bhattacharyya, S.; Donato, L.; Chakraborty, S.; Calabrò, V.; Davoli, M.; Algieri, C. Synergistic Efficiency of TiO2-GO Nanocomposite Membranes in Dye Degradation for Sustainable Water Pollution Remedy. Earth Syst. Environ. 2025, 9, 639–652. [Google Scholar] [CrossRef]
- Minella, M.; Sordello, F.; Minero, C. Photocatalytic Process in TiO2/Graphene Hybrid Materials. Evidence of Charge Separation by Electron Transfer from Reduced Graphene Oxide to TiO2. Catal. Today 2017, 281, 29–37. [Google Scholar] [CrossRef]
- Guo, J.; Zhu, S.; Chen, Z.; Li, Y.; Yu, Z.; Liu, Q.; Li, J.; Feng, C.; Zhang, D. Sonochemical Synthesis of TiO2 Nanoparticles on Graphene for Use as Photocatalyst. Ultrason. Sonochem. 2011, 18, 1082–1090. [Google Scholar] [CrossRef]
- Stengl, V.; Bakardjieva, S.; Grygar, T.M.; Bludská, J.; Kormunda, M. TiO2-Graphene Oxide Nanocomposite as Advanced Photocatalytic Materials. Chem. Cent. J. 2013, 7, 41. [Google Scholar] [CrossRef]
- Nosaka, Y.; Nosaka, A.Y. Reconsideration of Intrinsic Band Alignments within Anatase and Rutile TiO2. J. Phys. Chem. Lett. 2016, 7, 431–434. [Google Scholar] [CrossRef]
- Gomez-Polo, C.; Larumbe, S.; Gil, A.; Muñoz, D.; Fernández, L.R.; Barquín, L.F.; García-Prieto, A.; Fdez-Gubieda, M.L.; Muela, A. Improved Photocatalytic and Antibacterial Performance of Cr Doped TiO2 Nanoparticles. Surf. Interfaces 2021, 22, 100867. [Google Scholar] [CrossRef]
- Abou-Gamra, Z.M.; Ahmed, M.A.; Hamza, M.A. Investigation of Commercial PbCrO4/TiO2 for Photodegradation of Rhodamine B in Aqueous Solution by Visible Light. Nanotechnol. Environ. Eng. 2017, 2, 12. [Google Scholar] [CrossRef]
- Zhu, L.; Huang, D.; Ma, J.; Wu, D.; Yang, M.; Komarneni, S. Fabrication of AgBr/Ag2CrO4 Composites for Enhanced Visible-Light Photocatalytic Activity. Ceram. Int. 2015, 41, 12509–12513. [Google Scholar] [CrossRef]
- Leong, C.Y.; Teh, H.L.; Chen, M.C.; Lee, S.L. Effect of Synthesis Methods on Properties of Copper Oxide Doped Titanium Dioxide Photocatalyst in Dye Photodegradation of Rhodamine B. Sci. Technol. Indones. 2022, 7, 91–97. [Google Scholar] [CrossRef]
- Phuruanqrat, A.; Junsang, C.; Patiphatpanya, P.; Dumrongrojthanath, P.; Ekthammathat, N.; Karthik, A.; Thongtem, S.; Thongtem, T. Enhanced Visible-Light-Driven Photodegradation of Rhodamine B over Ag2C2O4/Bi2MoO6 Nanocomposites. J. Chem. Chem. Eng. Res. Artic. 2020, 39, 29–37. [Google Scholar]
- Avasthi, A.; Caro, C.; Pozo-Torres, E.; Leal, M.P.; García-Martín, M.L. Magnetic Nanoparticles as MRI Contrast Agents; Springer International Publishing: Berlin/Heidelberg, Germany, 2020; Volume 378, ISBN 0123456789. [Google Scholar]
- Yu, L.; Xu, W.; Liu, H.; Bao, Y. Titanium Dioxide–Reduced Graphene Oxide Composites for Photocatalytic Degradation of Dyes in Water. Catalysts 2022, 12, 1340. [Google Scholar] [CrossRef]
- Hidayat, R.; Wahyuningsih, S.; Fadillah, G.; Ramelan, A.H. Highly Visible Light Photodegradation of RhB as Synthetic Organic Dye Pollutant Over TiO2-Modified Reduced Graphene Oxide. J. Inorg. Organomet. Polym. Mater. 2022, 32, 85–93. [Google Scholar] [CrossRef]
- Hardiansyah, A.; Budiman, W.J.; Yudasari, N.; Isnaeni; Kida, T.; Wibowo, A. Facile and Green Fabrication of Microwave-Assisted Reduced Graphene Oxide/Titanium Dioxide Nanocomposites as Photocatalysts for Rhodamine 6G Degradation. ACS Omega 2021, 6, 32166–32177. [Google Scholar] [CrossRef]
- Qu, X.; Hu, Q.; Song, Z.; Sun, Z.; Zhang, B.; Zhong, J.; Cao, X.; Liu, Y.; Zhao, B.; Liu, Z.; et al. Adsorption and Desorption Mechanisms on Graphene Oxide Nanosheets: Kinetics and Tuning. Innovation 2021, 2, 100137. [Google Scholar] [CrossRef]
- Yang, X.; Wan, Y.; Zheng, Y.; He, F.; Yu, Z.; Huang, J.; Wang, H.; Ok, Y.S.; Jiang, Y.; Gao, B. Surface Functional Groups of Carbon-Based Adsorbents and Their Roles in the Removal of Heavy Metals from Aqueous Solutions: A Critical Review. Chem. Eng. J. 2019, 366, 608–621. [Google Scholar] [CrossRef]
- Jahan, N.; Roy, H.; Reaz, A.H.; Arshi, S.; Rahman, E.; Firoz, S.H.; Islam, M.S. A Comparative Study on Sorption Behavior of Graphene Oxide and Reduced Graphene Oxide towards Methylene Blue. Case Stud. Chem. Environ. Eng. 2022, 6, 100239. [Google Scholar] [CrossRef]
- Xiong, Q.; Zhang, F. Study on the Performance of Composite Adsorption of Cu2+ by Chitosan/β-Cyclodextrin Cross-Linked Zeolite. Sustainability 2022, 14, 2106. [Google Scholar] [CrossRef]
- Yadav, A.; Yadav, M.; Gupta, S.; Popat, Y.; Gangan, A.; Chakraborty, B.; Ramaniah, L.M.; Fernandes, R.; Miotello, A.; Press, M.R.; et al. Effect of Graphene Oxide Loading on TiO2: Morphological, Optical, Interfacial Charge Dynamics-A Combined Experimental and Theoretical Study. Carbon N. Y. 2019, 143, 51–62. [Google Scholar] [CrossRef]
- Wang, R.; Shi, K.; Huang, D.; Zhang, J.; An, S. Synthesis and Degradation Kinetics of TiO2/GO Composites with Highly Efficient Activity for Adsorption and Photocatalytic Degradation of MB. Sci. Rep. 2019, 9, 1–9. [Google Scholar] [CrossRef] [PubMed]
- Siddeeg, S.M. A Novel Synthesis of TiO2/GO Nanocomposite for the Uptake of Pb2+ and Cd2+ from Wastewater A Novel Synthesis of TiO2/GO Nanocomposite for the Uptake of Pb2+ and Cd2+ from Wastewater. Mater. Res. Express 2020, 7, 025–038. [Google Scholar] [CrossRef]
- Kaur, J.; Kaur, M. Facile Fabrication of Ternary Nanocomposite of MgFe2O4-TiO2@GO for Synergistic Adsorption and Photocatalytic Degradation Studies. Ceram. Int. 2019, 45, 8646–8659. [Google Scholar] [CrossRef]
- Joshi, N.C.; Congthak, R.; Gururani, P. Synthesis, Adsorptive Performances and Photo-Catalytic Activity of Graphene Oxide/TiO2 (GO/TiO2) Nanocomposite-Based Adsorbent. Nanotechnol. Environ. Eng. 2020, 5, 1–13. [Google Scholar] [CrossRef]
- Jaramillo-Fierro, X.; Cuenca, G. Enhancing Methylene Blue Removal through Adsorption and Photocatalysis—A Study on the GO/ZnTiO3/TiO2 Composite. Int. J. Mol. Sci. 2024, 25, 4367. [Google Scholar] [CrossRef]
- Xie, J.; Li, J.; Zhao, L.; Zhang, X.; Yu, B.; Wu, R.; Wang, R.; Liu, J.-H.; Xue, F.; Yang, S.-T. Fabrication of TiO2-Graphene Oxide Aerogel for the Adsorption of Copper Ions. Nanosci. Nanotechnol. Lett. 2014, 6, 1018–1023. [Google Scholar] [CrossRef]
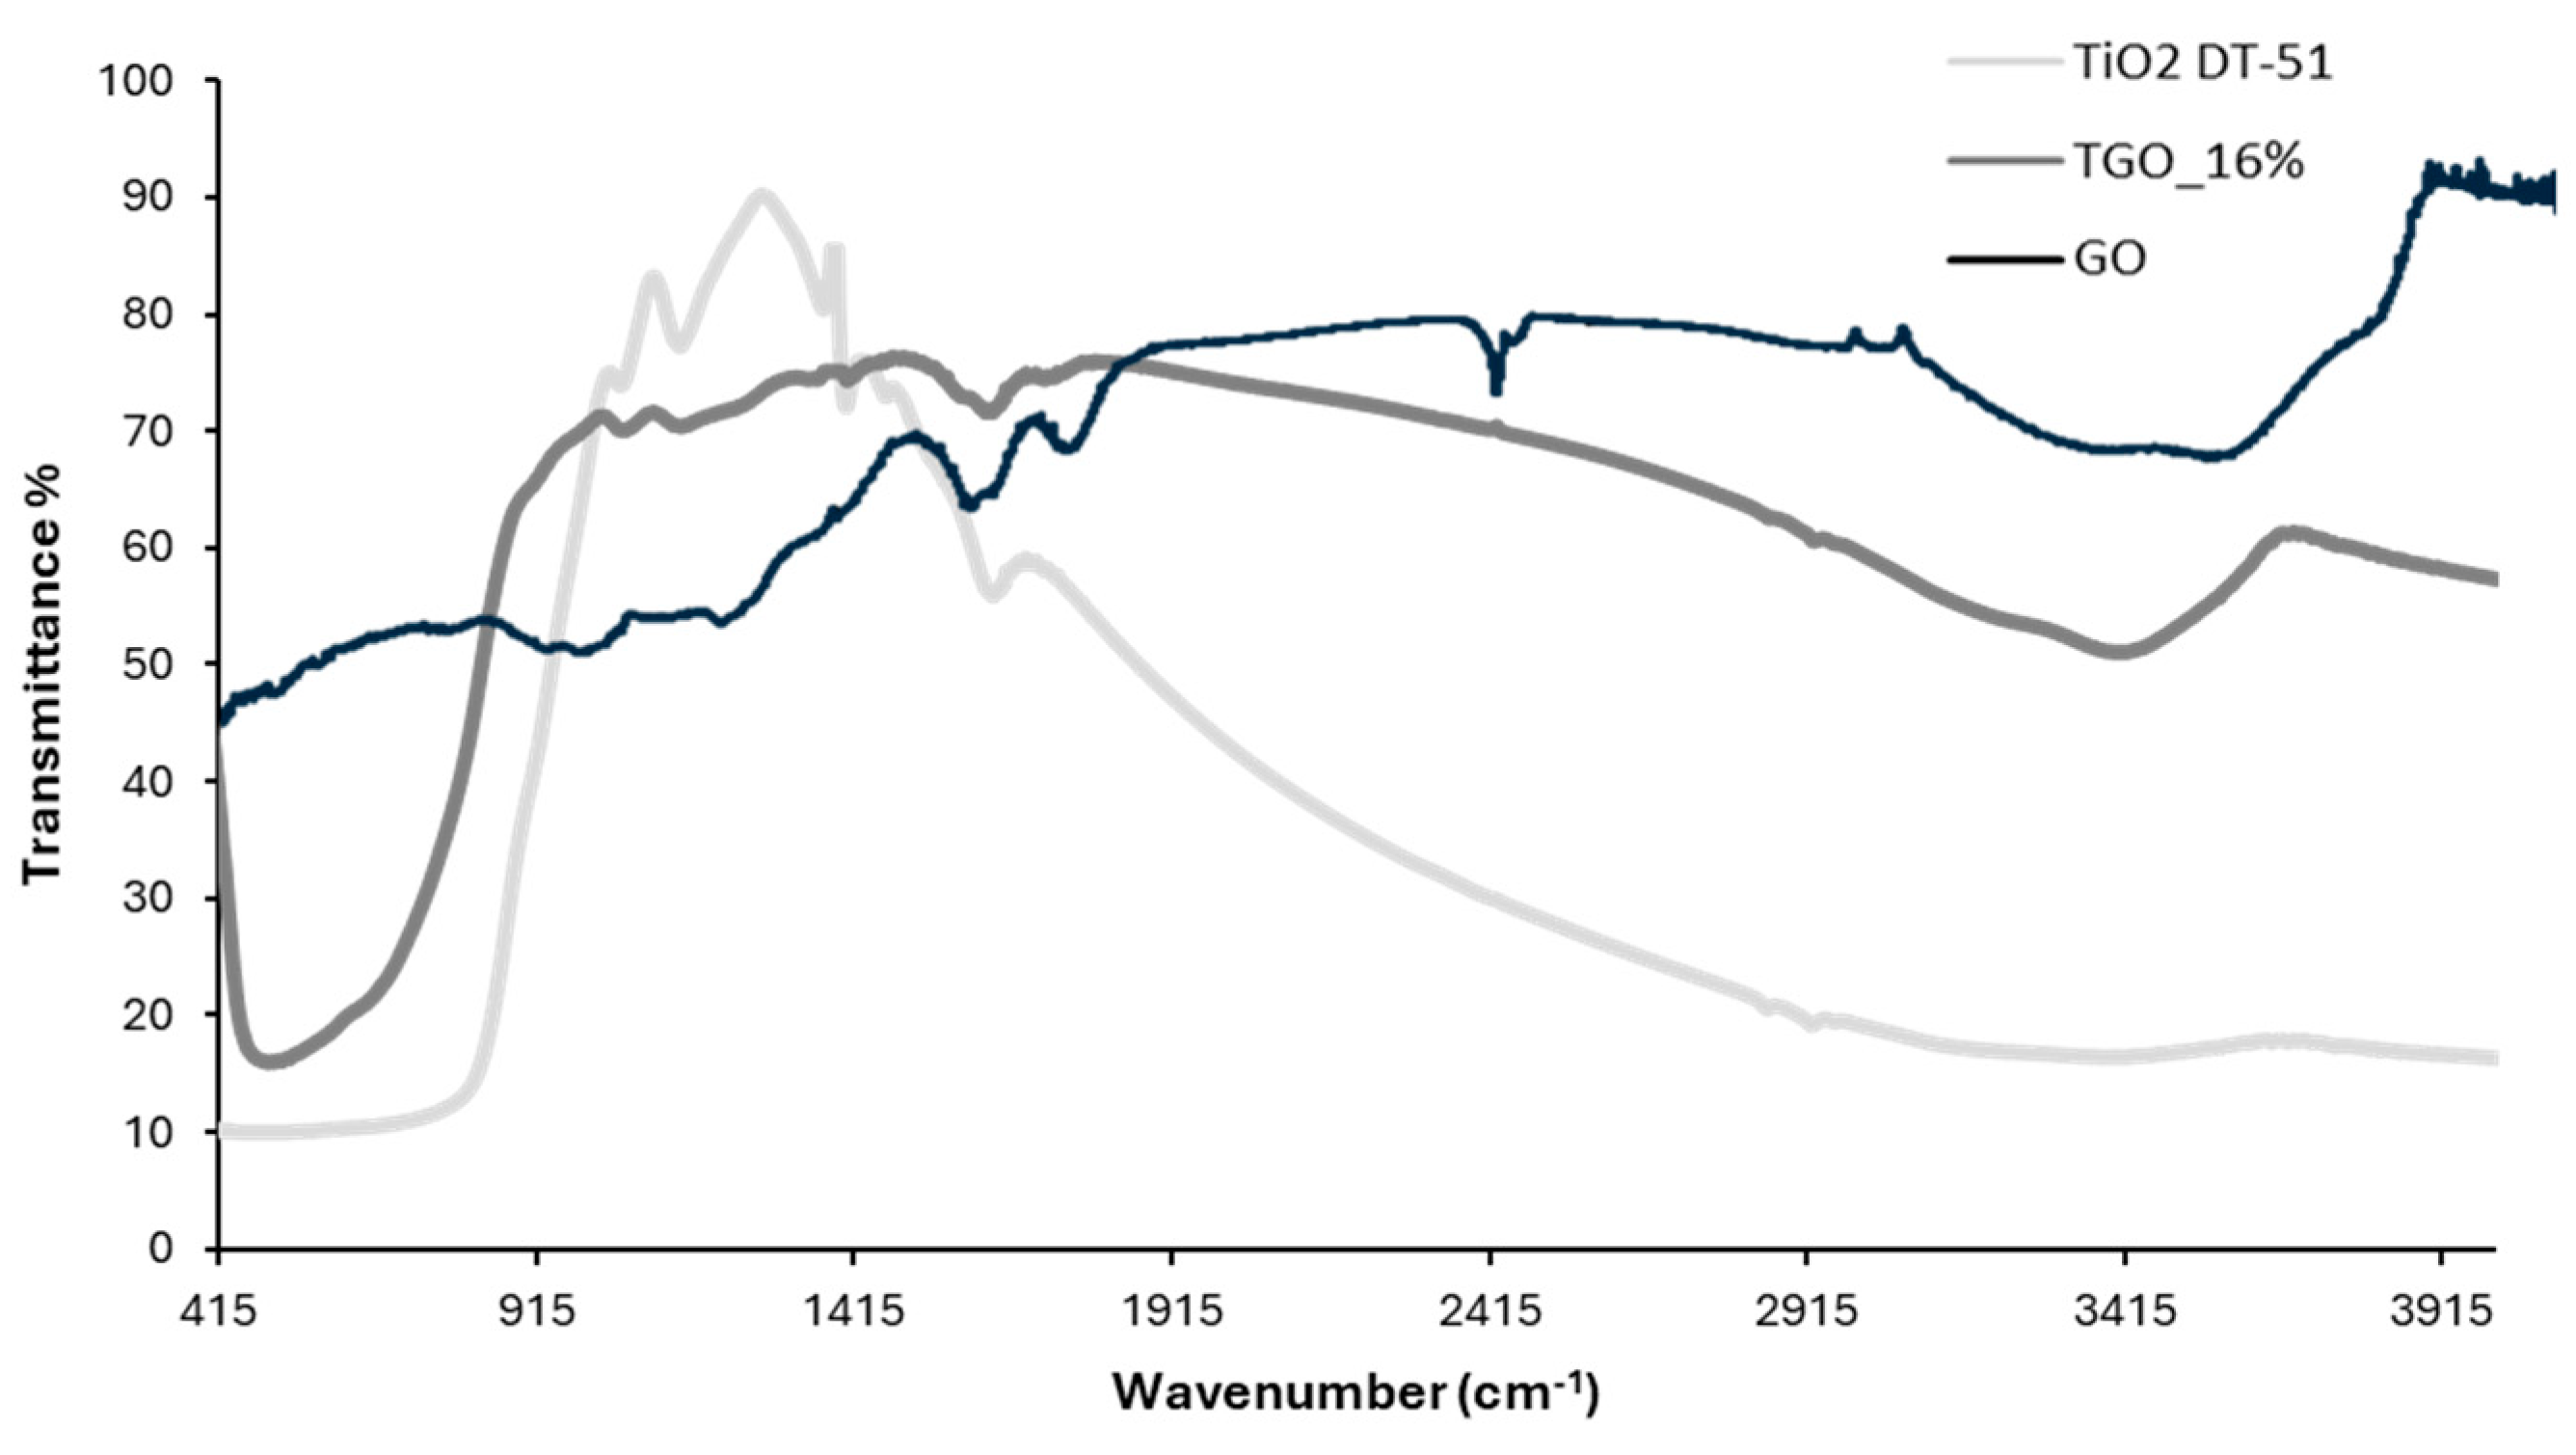
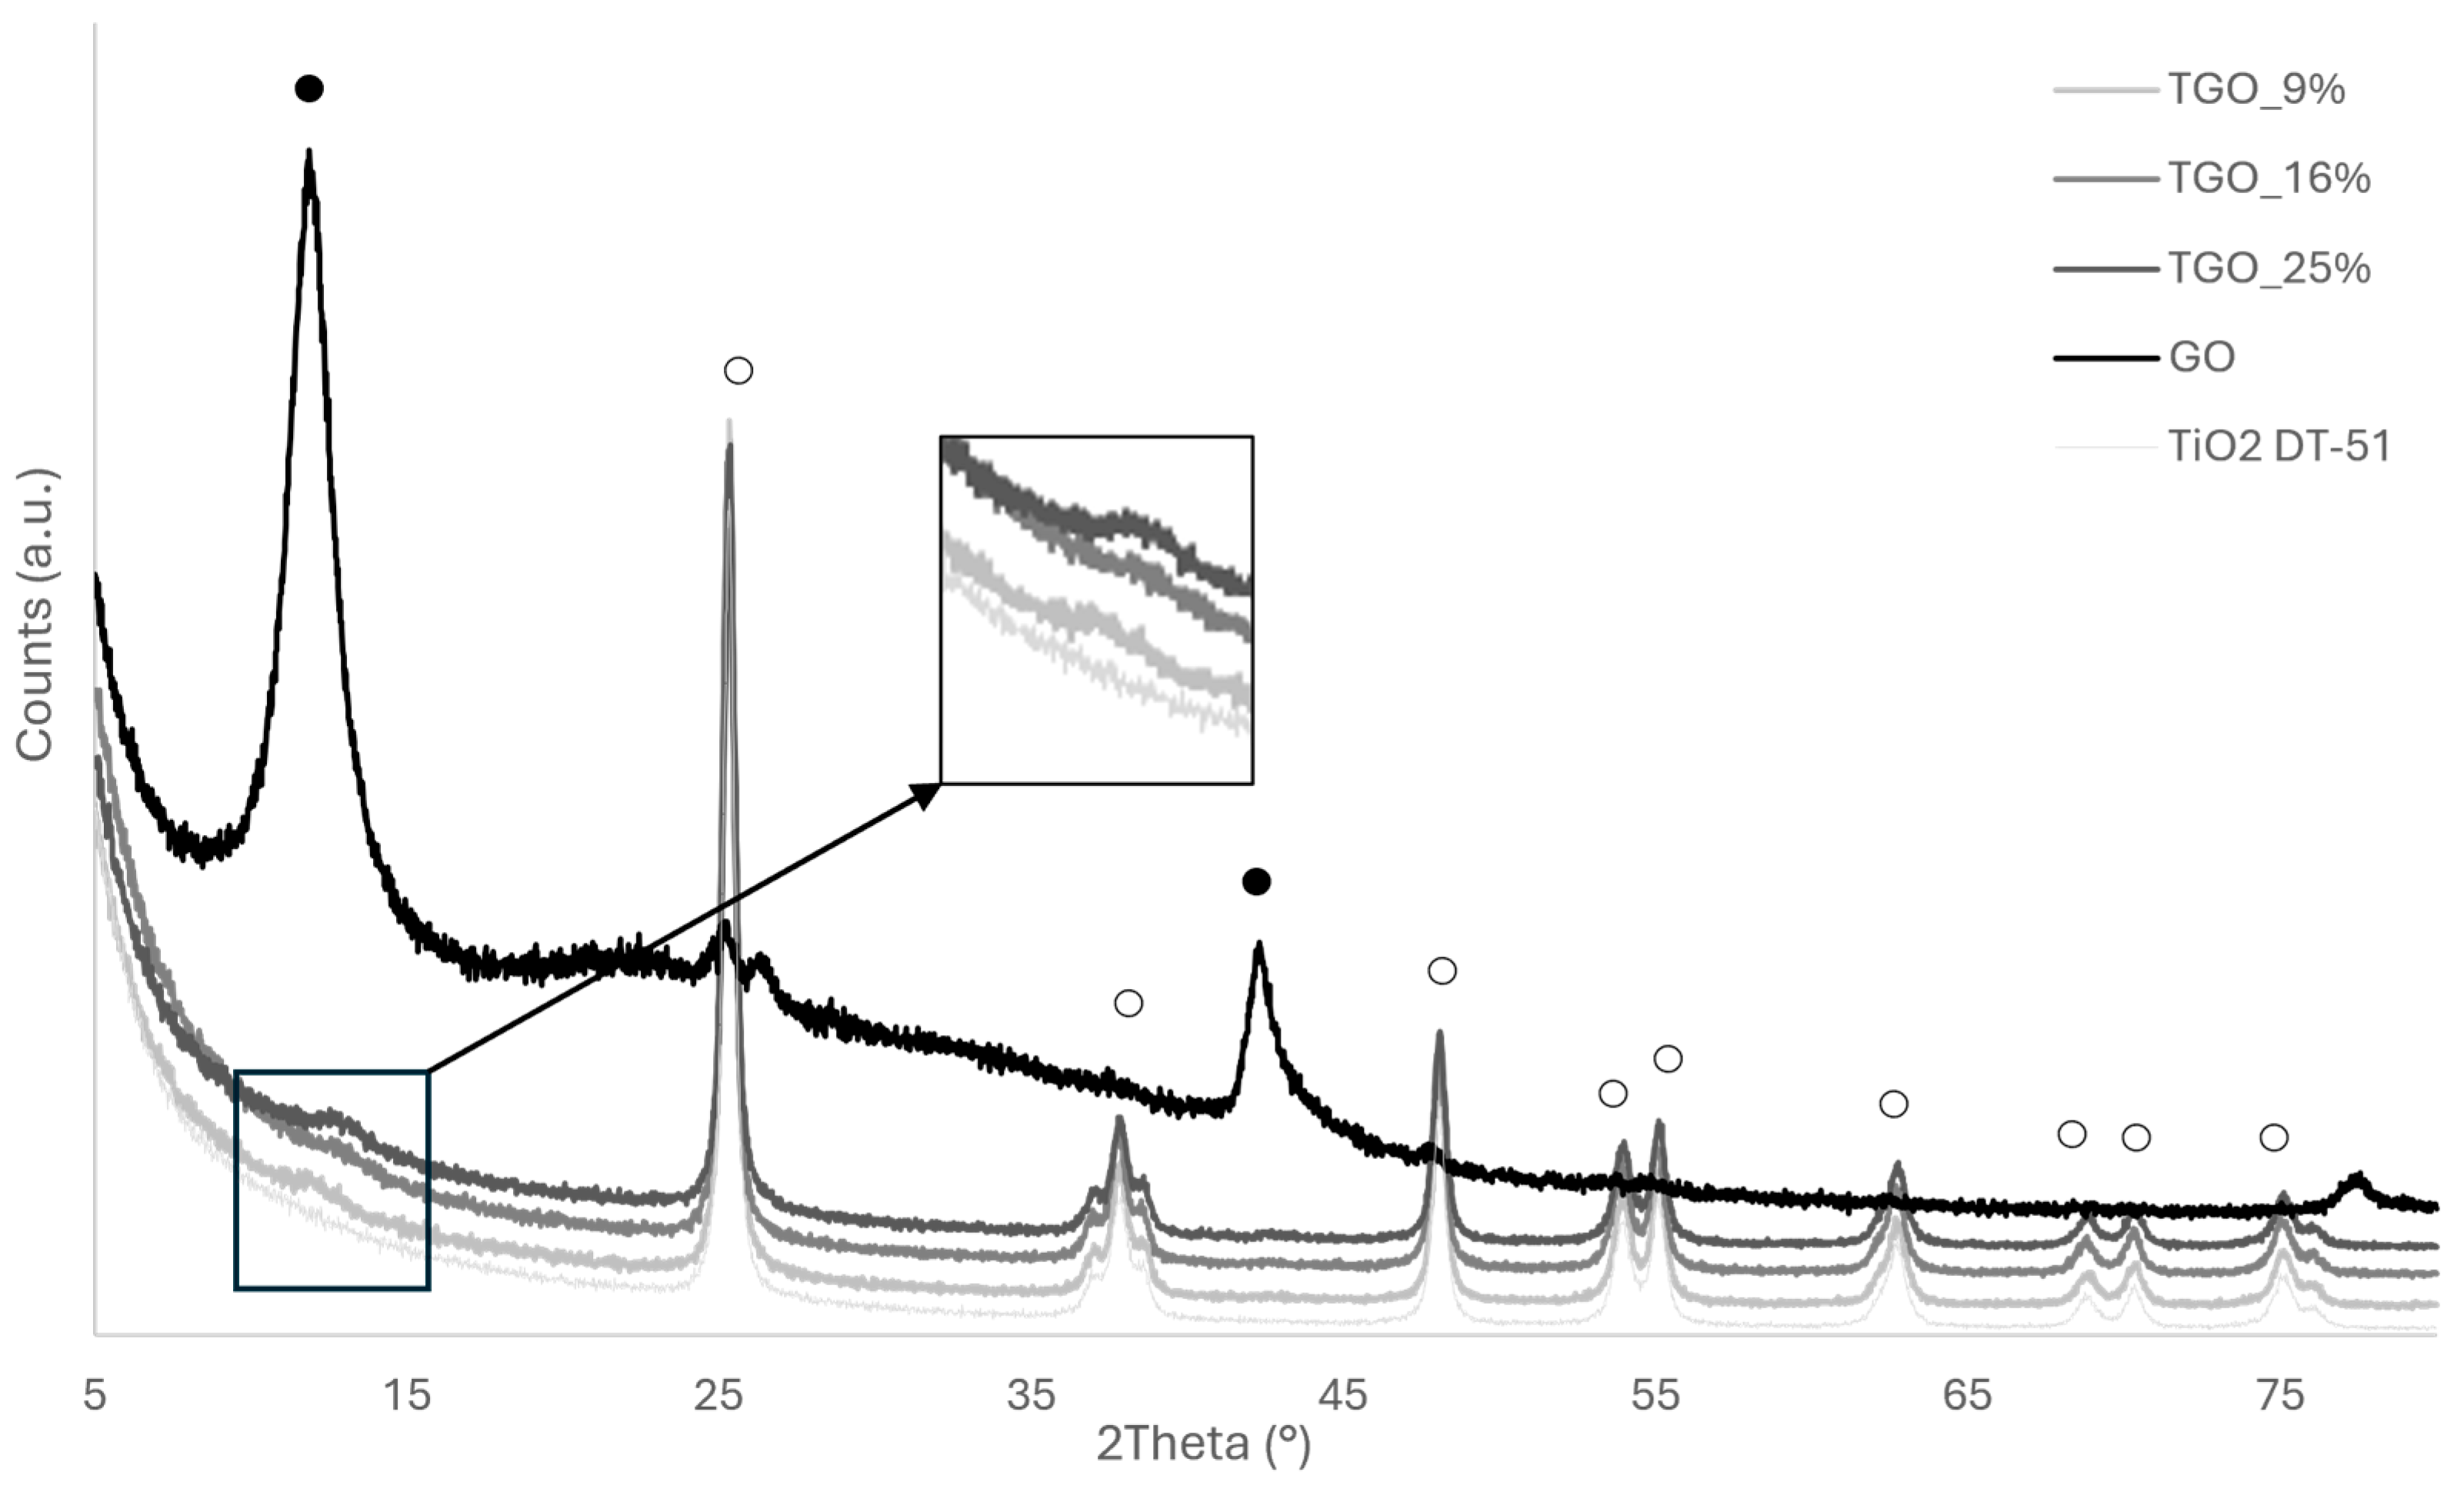
 TiO2 DT-51;
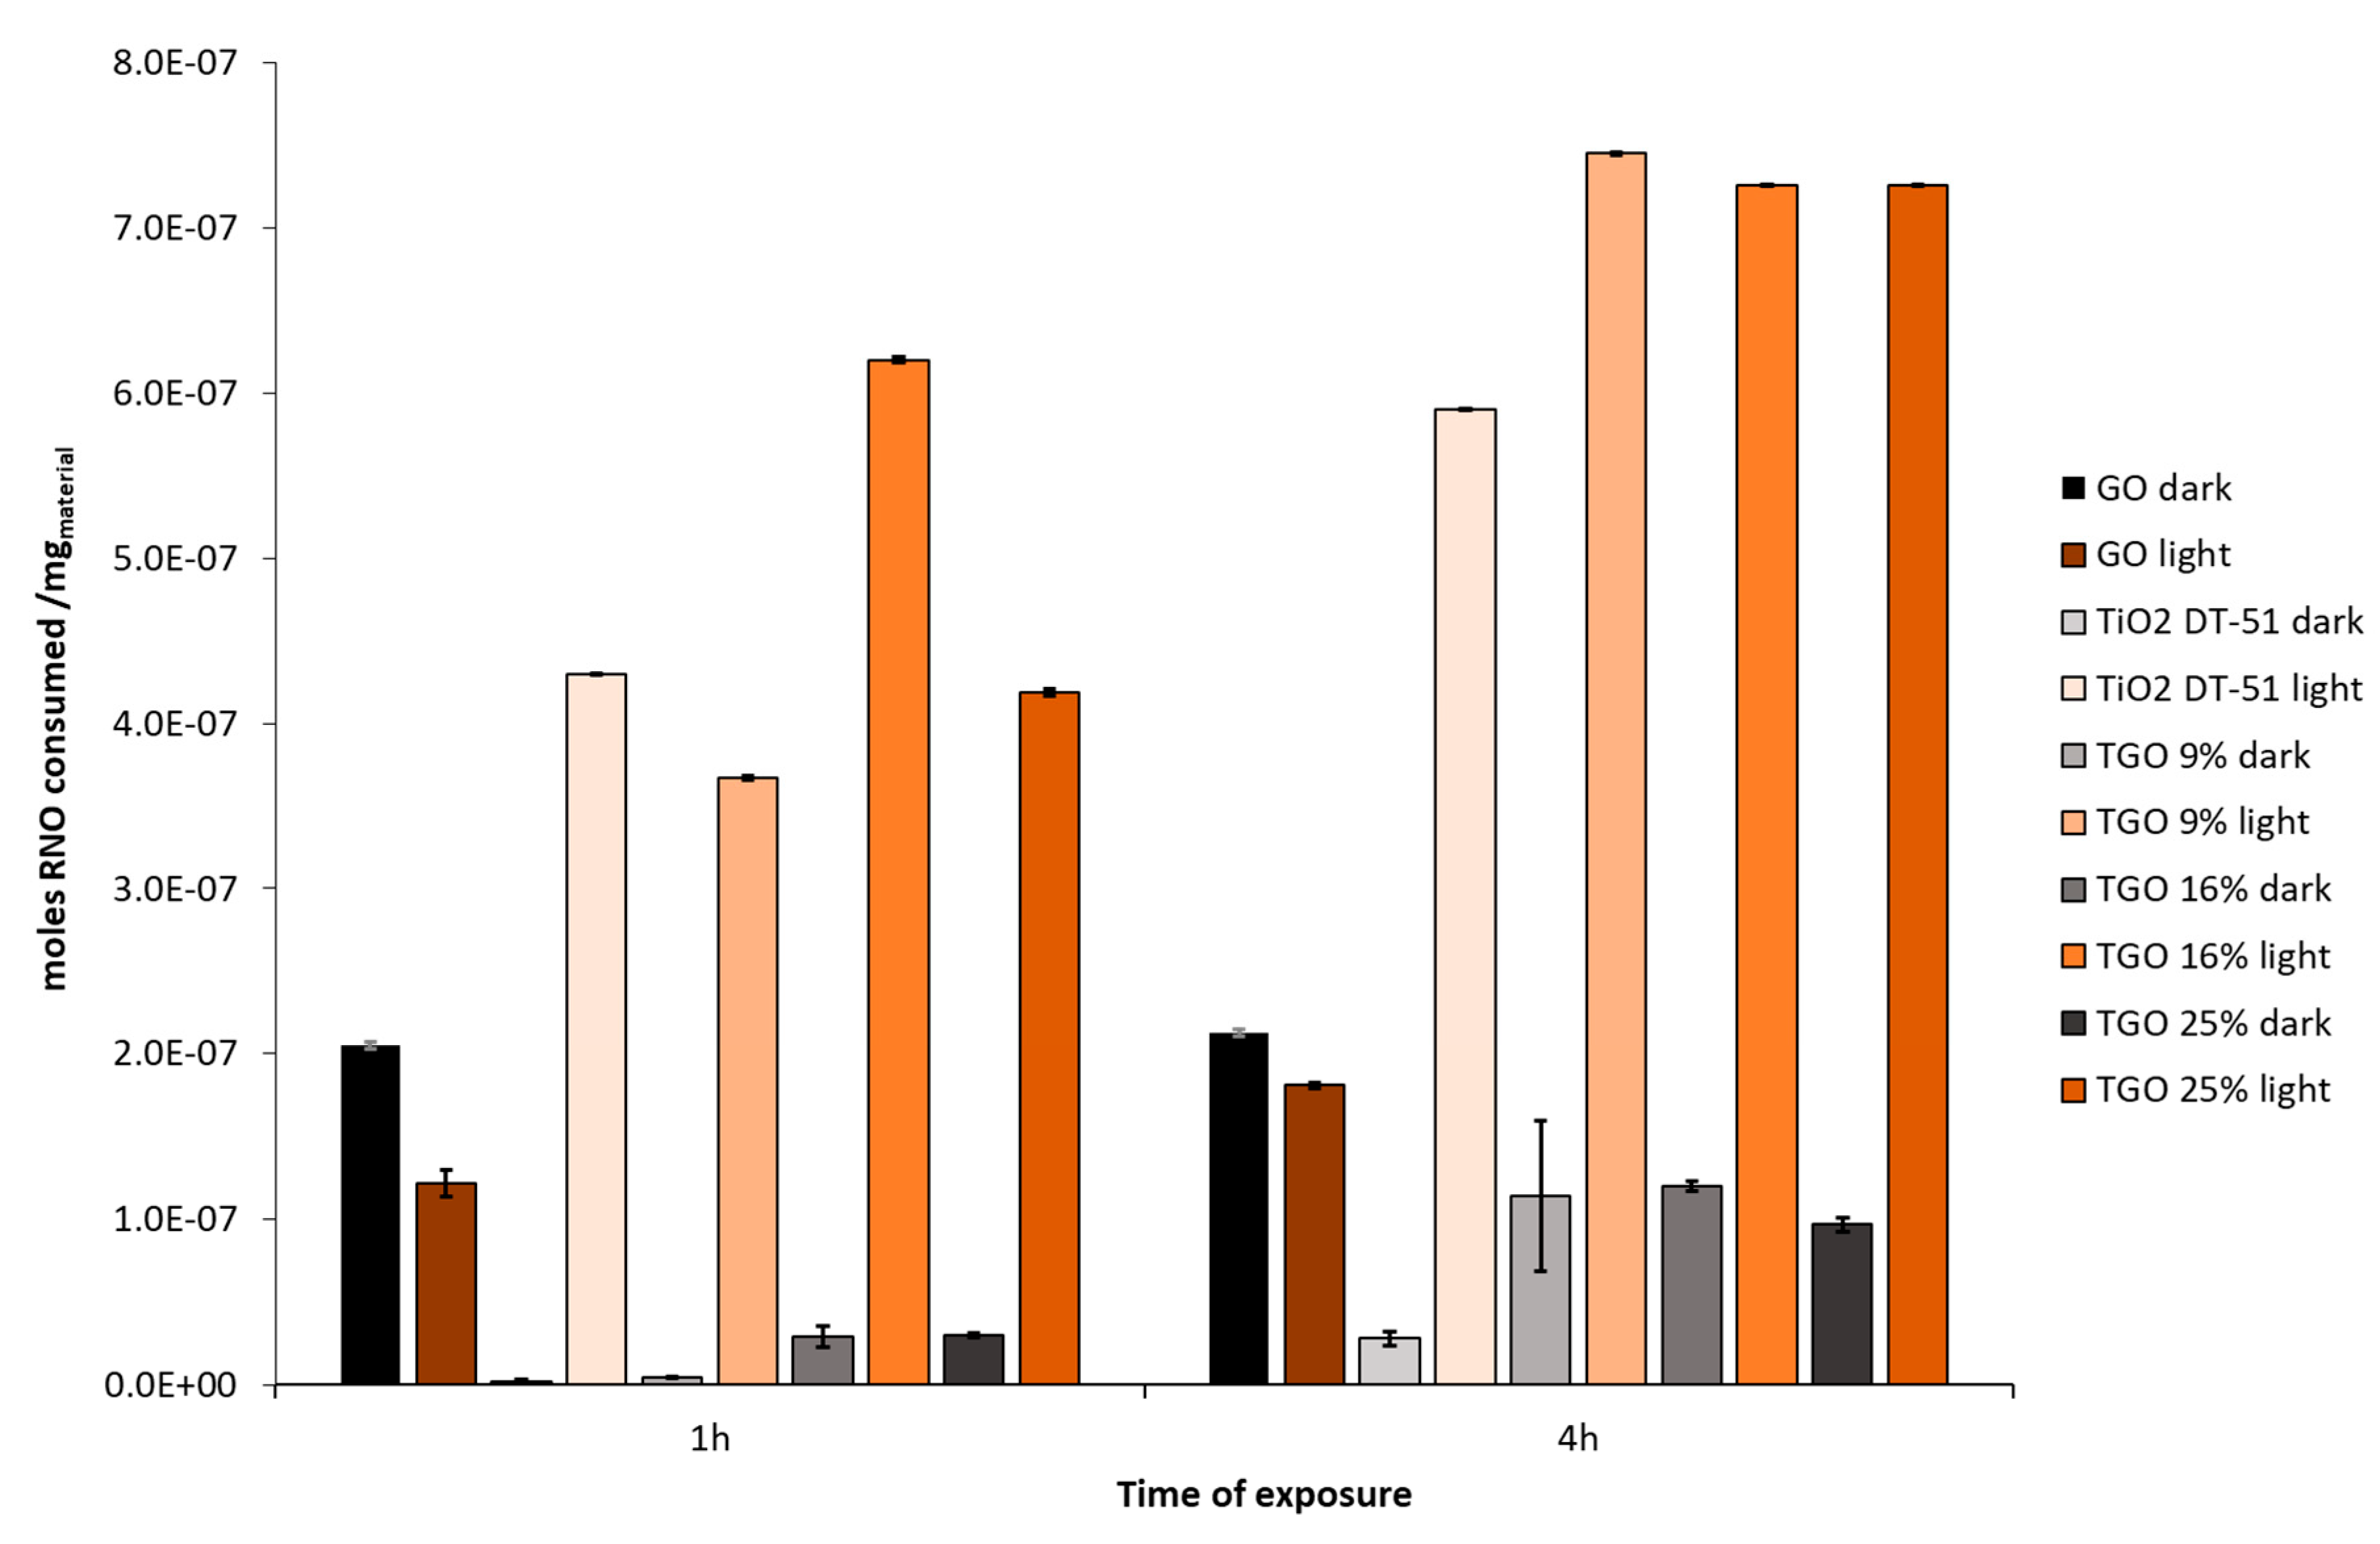
  TGO_9%; ● TGO_16%;
  TGO_25%; ● GO.
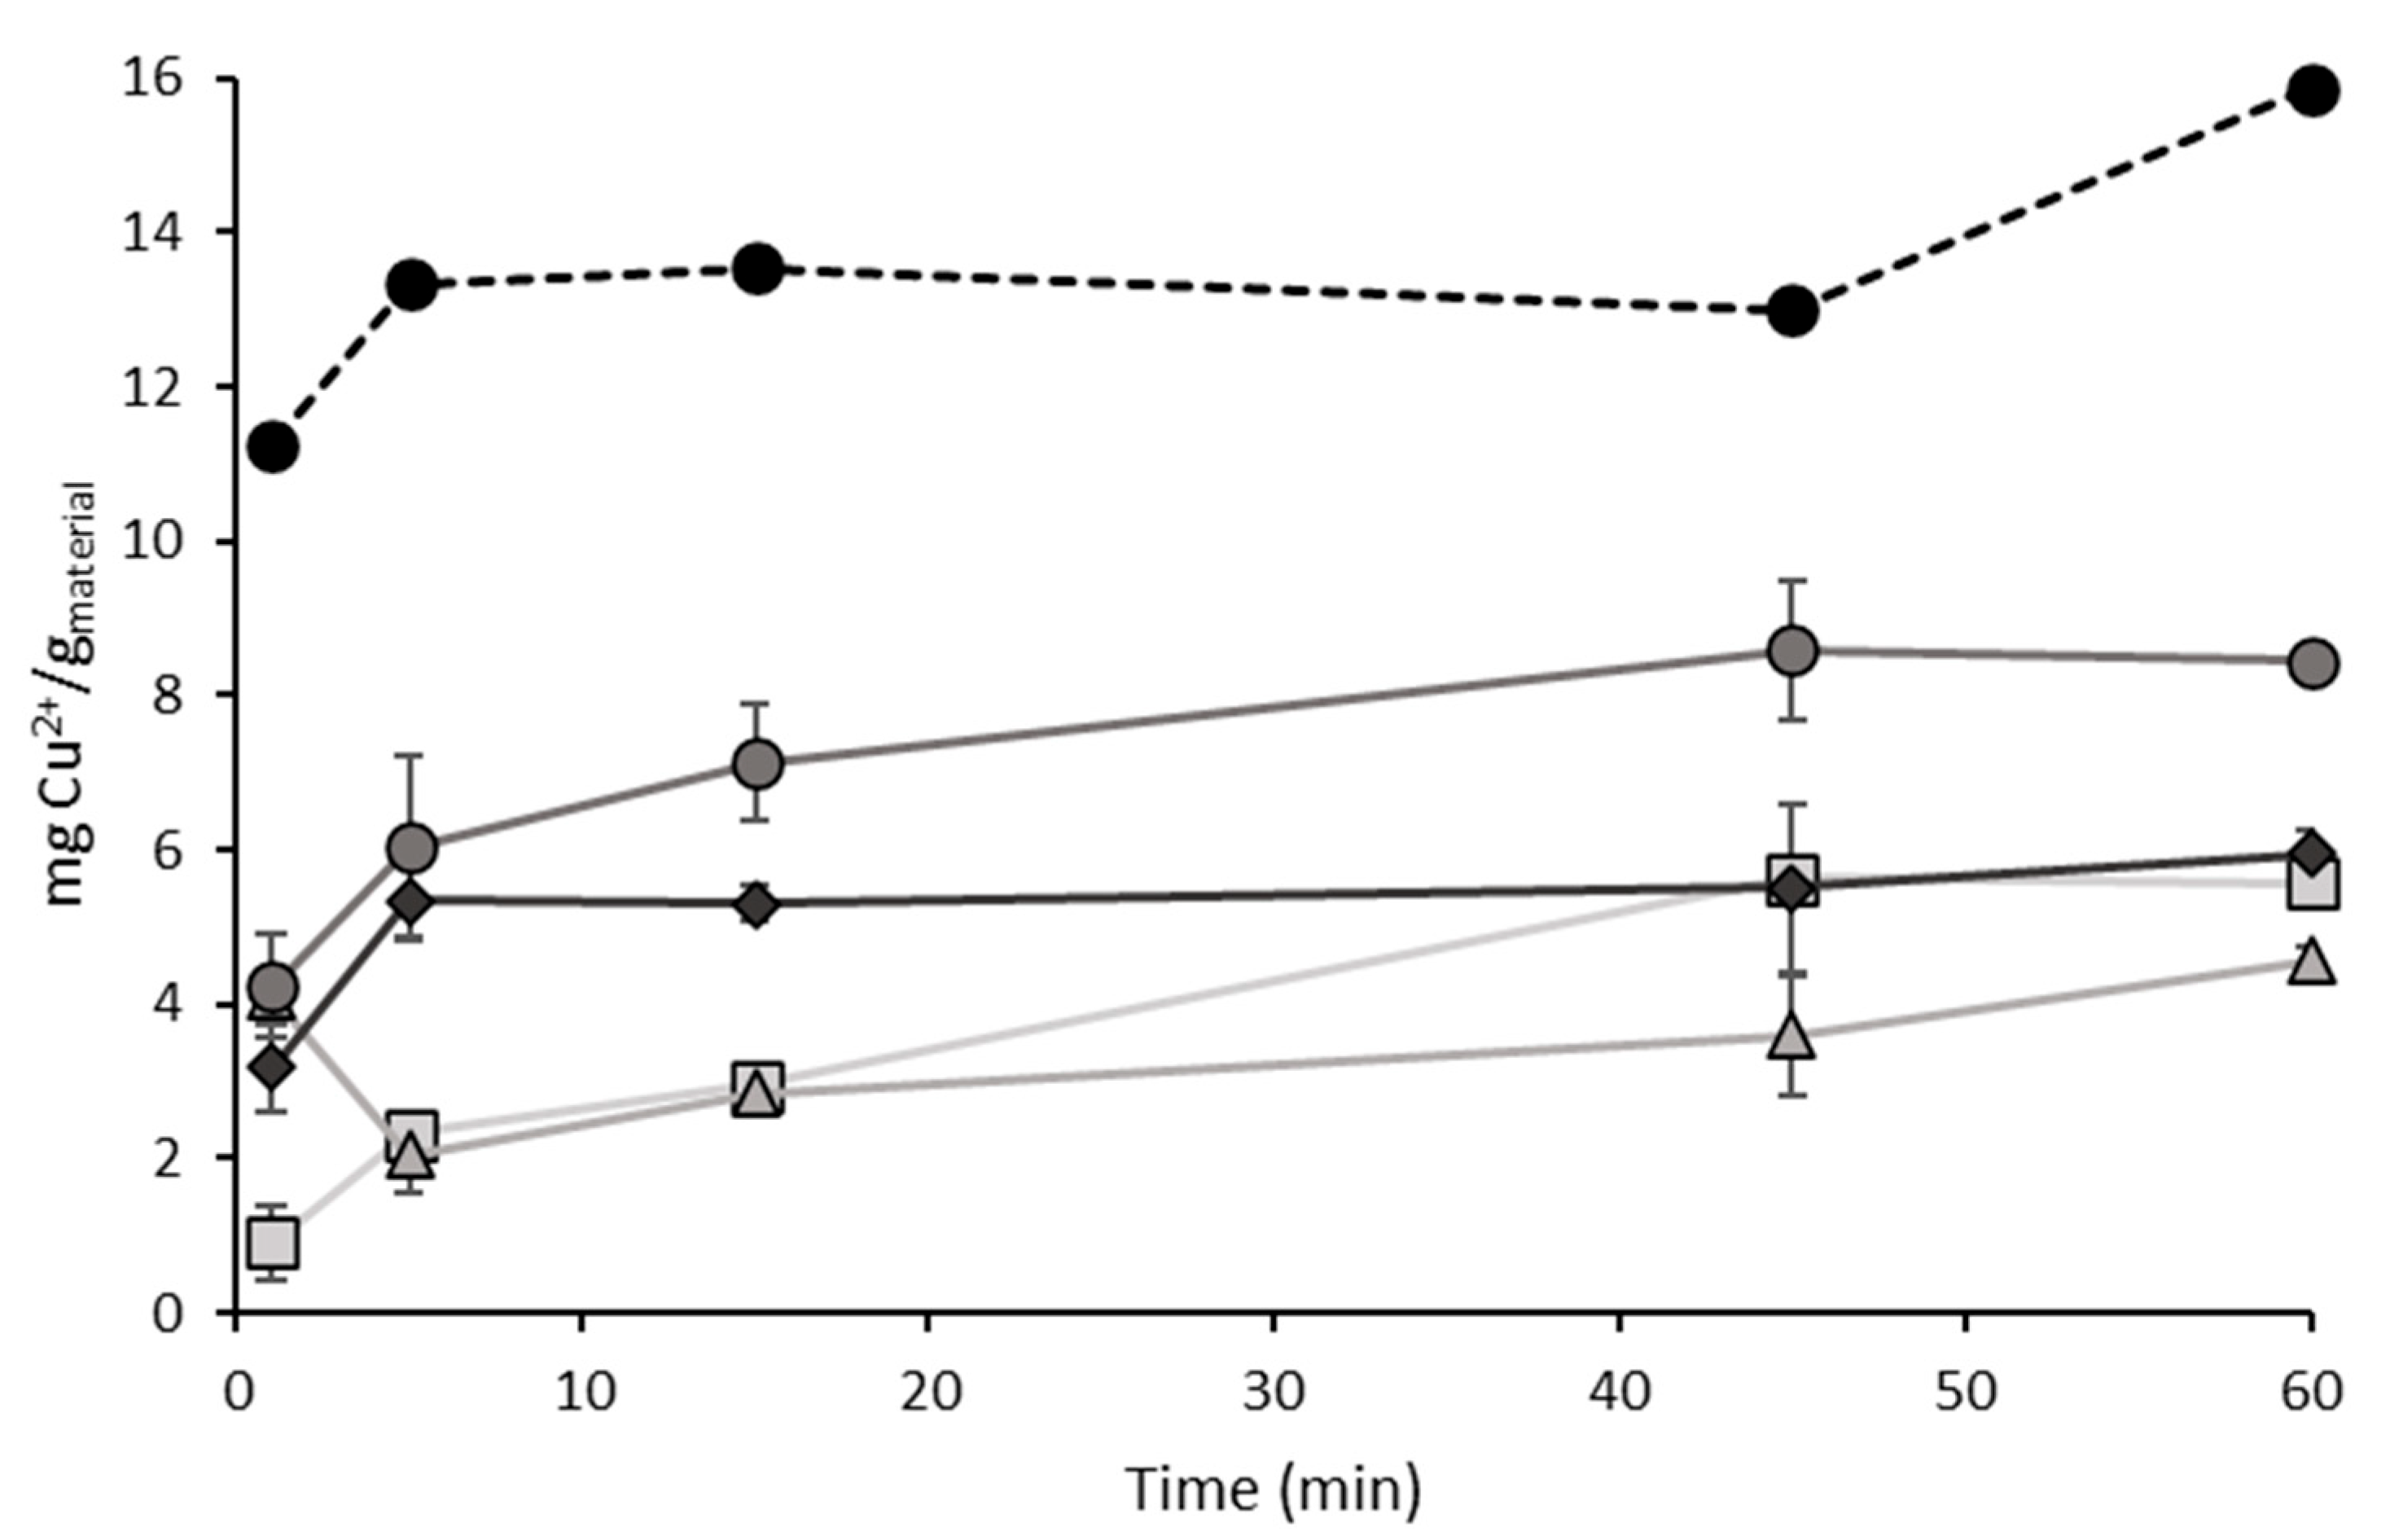

| Sample | Eg (eV) | UV Light | Solar Light |
|---|---|---|---|
| k (min−1) | k (min−1) | ||
| TiO2 DT-51 | 3.25 | 8.3 × 10⁻³ | 5.8 × 10⁻³ |
| GO | nd * | 5.3 × 10⁻³ | nd * |
| TGO_9% | 3.22 | 1.2 × 10⁻² | 6.2 × 10⁻³ |
| TGO_16% | 3.21 | 1.4 × 10⁻² | 6.8 × 10⁻³ |
| TGO_25% | 3.18 | 1.0 × 10⁻² | 5.0 × 10⁻³ |
| Sample | RhB Conversion % |
|---|---|
| TiO2 DT-51 | 64 ± 3.3 |
| TGO_16% | 80 ± 4.9 |
| TiO2/GO | 64 ± 4.2 |
| Photocatalyst Material | %GO | Synthesis Method | RhB Conversion % | Reference |
|---|---|---|---|---|
| TiO2-rGO | 6 | Hydrothermal | 97.9 | [46] |
| N-TiO2/rGO | nd * | Sonication | 78.29 | [58] |
| TiO2-rGO | 10 | Hydrothermal | 86.81 | [59] |
| TiO2GO | 33.3 | Microwave | 82.9 | [60] |
| TGO | 16 | Sonication | 80.0 | Present study |
Disclaimer/Publisher’s Note: The statements, opinions and data contained in all publications are solely those of the individual author(s) and contributor(s) and not of MDPI and/or the editor(s). MDPI and/or the editor(s) disclaim responsibility for any injury to people or property resulting from any ideas, methods, instructions or products referred to in the content. |
© 2025 by the authors. Licensee MDPI, Basel, Switzerland. This article is an open access article distributed under the terms and conditions of the Creative Commons Attribution (CC BY) license (https://creativecommons.org/licenses/by/4.0/).
Share and Cite
Ortelli, S.; Faccani, L.; Ercolani, E.; Zanoni, I.; Artusi, C.; Blosi, M.; Albonetti, S.; Costa, A.L. Design and Properties of Titanium Dioxide/Graphene Oxide Composites Exploitable in Wastewater Treatments. Water 2025, 17, 1809. https://doi.org/10.3390/w17121809
Ortelli S, Faccani L, Ercolani E, Zanoni I, Artusi C, Blosi M, Albonetti S, Costa AL. Design and Properties of Titanium Dioxide/Graphene Oxide Composites Exploitable in Wastewater Treatments. Water. 2025; 17(12):1809. https://doi.org/10.3390/w17121809
Chicago/Turabian StyleOrtelli, Simona, Lara Faccani, Enrico Ercolani, Ilaria Zanoni, Chiara Artusi, Magda Blosi, Stefania Albonetti, and Anna Luisa Costa. 2025. "Design and Properties of Titanium Dioxide/Graphene Oxide Composites Exploitable in Wastewater Treatments" Water 17, no. 12: 1809. https://doi.org/10.3390/w17121809
APA StyleOrtelli, S., Faccani, L., Ercolani, E., Zanoni, I., Artusi, C., Blosi, M., Albonetti, S., & Costa, A. L. (2025). Design and Properties of Titanium Dioxide/Graphene Oxide Composites Exploitable in Wastewater Treatments. Water, 17(12), 1809. https://doi.org/10.3390/w17121809