Abstract
Aquatic vegetation can influence hydraulic performance in channels, rivers, and floodplains. Most previous studies used cylindrical stems to simulate vegetation, while few studies used shrub-like or sedge structures that exhibited a maximum width near the top of the vegetation. In contrast, this research focuses on shrub-like structures that show a maximum width near the bottom of the vegetation. To understand the effects of aquatic vegetation on velocity distribution, water surface profile, and energy loss, experiments have been conducted in an open channel with a rectangular cross-section. The results indicated that the streamwise velocity within the lower layer remains nearly constant with depth where z/y is less than 0.20. However, once z/y exceeds 0.20, the streamwise velocity increases rapidly as the depth increases toward the water surface. Additionally, the shape of the vegetation influences the position of the inflection point. Moreover, the water level rises upstream of the vegetated area, decreases within it, and gradually returns to the normal depth downstream. The bed slope has little effect on relative energy loss, with maximum values reaching 6.61%, while the presence of vegetation leads to a significant increase, reaching up to 22.51%. The relative energy loss increases with a higher submerged ratio. A new empirical equation is proposed to estimate the relative energy loss in vegetated channels.
1. Introduction
Aquatic vegetation typically grows in channels, rivers, and floodplains, and its presence often causes various hydraulic problems. These problems include increased flow resistance, altered velocity distribution, raised water levels, and increased energy loss. The effect of vegetation on the velocity profile depends on the type of vegetation (rigid or flexible) and the flow conditions (submerged or emergent). Due to these differences in both flow conditions and vegetation types, several investigations have examined the impact of vegetation on flow velocity distribution through experimental studies. The flow patterns influenced by vegetation demonstrated that the velocity profile was not logarithmic but exhibited an S-shaped profile [1,2,3,4,5,6,7]. Liu et al. [8] investigated the effect of submerged rigid vegetation on the velocity distribution. It was found that the velocity within the vegetation array remained constant with depth, while the velocity profile above it followed a logarithmic pattern. Other researchers [9,10,11,12] examined the effect of rigid double-layer vegetation on the velocity profile under both submerged and emergent conditions. The results revealed that the velocity was almost constant at the depth of short vegetation and then it increased sharply from the depth just above the short vegetation to the free surface. Xia and Nehal [13] investigated the effect of emergent bending vegetation on the velocity distribution. The results showed that the velocity distribution did not follow a logarithmic profile; instead, it exhibited a double logarithmic profile. Muhammad [14] used natural submerged vegetation to investigate the velocity distribution within a grassed flume. The results indicated that the velocity profile was not uniformly distributed and was significantly influenced by the vegetation density. Ai et al. [15] investigated the effect of floating vegetation on velocity profiles. It was found that the velocity profiles in the mixing layer obeyed the hyperbolic tangent law.
Barahimi and Sui [16] found that for submerged vegetation, the maximum velocity was observed near the bed. However, for deeper flow, the peak velocity occurred at a higher location close to the water surface. Mofrad et al. [17] investigated the effect of submerged and emergent vegetation on the velocity distribution. It was found that, in the case of submerged vegetation, the location of the maximum velocity was observed near the water surface. In contrast, for emergent vegetation, the maximum velocity was shifted towards the bed.
Iimura and Tanaka [18] confirmed that both the velocity and the water level behind the vegetation were significantly reduced as the density of the vegetation increased. Anjum and Tanaka [19] examined the effect of double-layered vegetation on flow velocity. It was found that tall vegetation led to a greater reduction in flow velocity compared to short vegetation.
Many studies were conducted to predict the velocity profile of flow in vegetated channels. For submerged flexible vegetation, analytical models were proposed to estimate the vertical velocity profile of the flow based on double layers [20,21,22,23,24], three layers [1,25], and four layers [26]. Furthermore, for flexible vegetation with variable frontal width in the vertical direction, such as shrubs and sedges, a new analytical model was established [27,28].
For submerged rigid vegetation, a single-layer velocity model was proposed to predict the cross-sectional average velocity [29]. To predict the vertical velocity profile of the flow, an analytical model based on double-layer flow analysis was proposed at a fixed height [30,31,32,33,34,35,36,37] and at two different heights of vegetation [38,39,40]. Additionally, another analytical model was constructed with three layers of the flow, divided into a lower vegetated layer, an upper vegetated layer, and a non-vegetated layer starting from the bed level [41,42,43,44]. An analytical model was constructed for submerged rigid vegetation, and the flow was divided into four layers: an external layer, an upper vegetated layer, a transition layer, and a viscous layer [45].
For floating rigid vegetation, analytical models were proposed to predict the vertical velocity profile based on double layers [46] and three layers [47] flow analysis.
Morri et al. [48] evaluated six analytical models developed by Klopstra et al. [30], Stone and Shen [32], Baptist et al. [34], Huthoff et al. [35], Yang and Choi [36], and Van Velzen et al. [49] to predict the mean velocity in an open channel with submerged rigid vegetation. The results indicated that the Huthoff model was the most effective model for predicting the average velocity. Tang [50] evaluated four analytical models based on two-layer flow analysis from Klopstra et al. [30], Defina and Bixio [33], Baptist et al. [34], and Nepf [51] to predict the vertical velocity distribution of the flow in an open channel with submerged rigid vegetation. It was found that the Defina model significantly overestimated the velocity, while the Klopstra model underestimated it. Among these models, the Baptist and Nepf models produced similar results in most cases. Tang [52] evaluated four analytical models from Klopstra et al. [30], Defina and Bixio [33], Yang and Choi [36], and Nepf [51] against a wide range of experimental data. It was found that none of the models could predict the velocity profiles accurately for all datasets. All models, except for the Yang model, were able to predict the velocity reasonably well in the vegetation layer near the bed.
The vegetation played a vital role in the dissipation of energy [53]. Miyab et al. [54] studied the effect of flexible-sided vegetation on the water surface profile and energy loss. Eraky et al. [55] investigated the effect of different densities of rigid-sided vegetation on water depth in terms of heading up and head loss. The backwater rise and energy loss increased as both vegetation density and thickness increased [56,57,58,59,60]. The combination of short and tall submerged vegetation was more effective in reducing energy compared to short submerged vegetation of the same thickness and density [58]. Anjum and Tanaka [61] investigated the energy reduction in vertically double-layered vegetation with different densities under subcritical flow conditions. Sanjou et al. [62] examined the effect of a single tree line on the reduction of energy. Shaheen et al. [63] examined the influence of submerged and floating vegetation on flow characteristics. Mohamed et al. [64] investigated the influence of floating vegetation on flow characteristics. Ahmed et al. [65] examined the effect of vegetation angle on energy reduction. It was found that energy reduction decreased as the vegetation angle increased.
Usman et al. [66] and Ahmed and Ghumman [67] investigated the effect of an embankment, followed by a moat and emergent vegetation, on energy loss. Muhammad and Tanaka [68] clarified that the embankment, followed by dense vertically double-layered vegetation, could effectively reduce energy. Rahman et al. [69] investigated the effect of an embankment followed by vegetation on a mound for energy reduction. Energy loss was examined under varying conditions of mound length and vegetation density while the mound height remained fixed. Rahman et al. [70] clarified energy loss under varying conditions of mound height and vegetation density. Ahmed et al. [71] investigated the effect of an embankment followed by emergent vegetation on energy loss. Rahman et al. [72] studied the effect of vegetation behind an embankment with a gravel bed under supercritical flow conditions on the energy loss. Pasha et al. [73] investigated energy reduction achieved through vegetation and a backward facing step. Murtaza et al. [74] investigated the effects of a weir and vegetation on backwater rise, water surface profile, and energy dissipation. Yeganeh-Bakhtiary et al. [75] used vegetation in combination with reef ball modular structures to dissipate energy.
To the authors’ knowledge, no efforts have been made to study the effect of shrub-like vegetation (which shows a maximum width near the bottom) with floating vegetation on velocity distribution, water surface profile, and energy loss in vegetated channels. The major objectives of this research are (1) to investigate the effect of shrub-like shape on streamwise velocity distribution, (2) to investigate the effect of vegetation shape on the position of the inflection point, (3) to investigate the effect of submerged ratio on the velocity profile, (4) to investigate the effect of vegetation on water surface profile, (5) to investigate the effect of vegetation on relative energy loss, and (6) to develop an empirical equation to predict the relative energy loss in vegetated channels.
2. Experimental Work
The experimental work is conducted in the hydraulic laboratory of the Hydraulic Research Institute in Alqanatir Alkhayria, Egypt. The experiments are carried out using a reinforced concrete flume with a length of 22.0 m, a width of 0.60 m, and a height of 0.65 m. A hydraulic circuit is established by connecting the inlet and outlet of the flume. Gravel filters are installed at the entrances to dissipate excess energy and achieve a uniform flow distribution. A tailgate, fixed at the end of the flume, is used to control the tailwater depth. The schematic drawing of the experimental setup is shown in Figure 1.
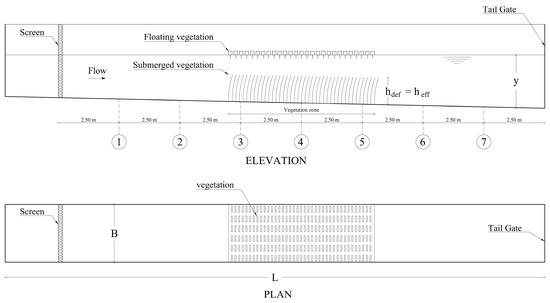
Figure 1.
Schematic diagram for the experimental setup vertical and plan views (long view, not to scale).
The ultrasonic flow meter is installed on the feeding pipe to measure the passing discharge into the flume. Tests are conducted at different discharges of 25.0, 30.0, 35.0, and 40.0 L/s and at different tailwater depths of 0.25, 0.30, and 0.35 m. The channel bed slope is adjusted to values of 0.0010, 0.0020, 0.0023, 0.0049, and 0.0062.
The Electromagnetic Current Meter (EMS), manufactured by Delft Hydraulics in the Netherlands, is used to measure flow velocity. The velocity is measured in both the longitudinal and transverse directions. In the longitudinal direction, velocities are measured at seven different cross-sections located at distances of 2.50, 5.00, 7.50, 10.00, 12.50, 15.00, and 17.50 m from the inlet. In the transverse direction, velocities are measured at five different points, located at distances of 0.10, 0.20, 0.30, 0.40, and 0.50 m from the side of the flume for each cross-section. In the vertical direction, velocity is measured at 0.20, 0.60, and 0.80 of the flow depth from the water surface at every point. Additionally, at the centerline of the flume, velocity is measured at further flow depths of 0.90 and 0.95 of flow depth. The flow depths are measured along the channel centerline using a point gauge mounted on a traveling instrument bridge.
To simulate the behavior of naturally submerged vegetation, artificial flexible elements made from Perspex are used, as shown in Figure 2a. The vegetation height is 0.22 m, with a density of 246 stems/m2. The floating vegetation consists of two parts: the floating part is made of foam with a height of 0.03 m, and the submerged part is made of aluminum wires, also with a height of 0.03 m, as shown in Figure 2b. The density of the floating vegetation is 5000 stems/m2.
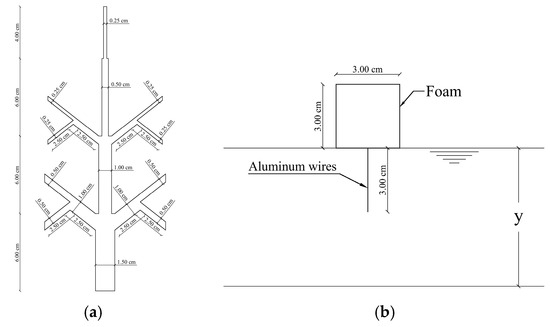
Figure 2.
Artificial vegetation: (a) submerged vegetation; (b) floating vegetation.
The vegetation region is 6.0 m long and is located at a distance of 7.0 m from the inlet. Flow characteristics are measured at seven sections, with a distance of 2.50 m between each section. Sections 1, 2, 6, and 7 are located outside of the vegetation area. Sections 3 and 4 are located at the edge of the vegetation area. Section 5 is located at the center of the vegetation area. Tests are conducted in both the presence and absence of vegetation.
3. Results and Discussions
3.1. Velocity Profile
3.1.1. Effect of Vegetation on the Velocity Profile
In vegetated channels, three typical cross-sections are selected to investigate the effect of vegetation on streamwise velocity distribution, aiming to understand how vegetation influences flow patterns. Specifically, the selected cross-sections representing the upstream, vegetated, and downstream zones are located at sections 2, 4, and 7, respectively. Figure 3 compares the vertical distributions of streamwise velocity for non-vegetated channels and several locations in vegetated channels, with a bed slope of 0.0062, a submerged ratio of 0.94, and a discharge of 40 L/s, where z is the distance from the measurement point to the bed, y is the water depth, and u is the streamwise velocity at that point.
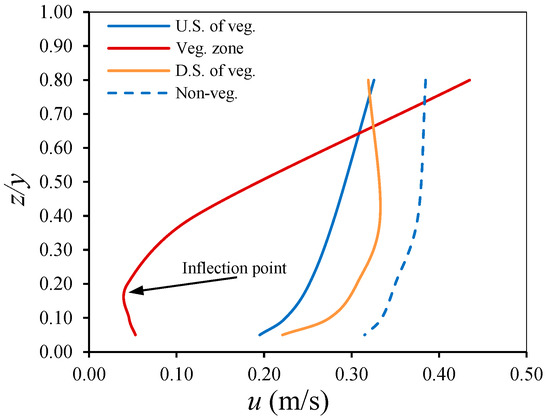
Figure 3.
Vertical distribution of streamwise velocity for non-vegetated channels and various locations in vegetated channels at S = 0.0062, hdef/y = 0.94, and Q = 40 L/s.
The vertical streamwise velocity distribution exhibits significant differences at all locations, as shown in Figure 3. The velocity profile in non-vegetated channels demonstrates a logarithmic relationship with water depth, a pattern also observed in the upstream and downstream sections of vegetation. However, flow velocities in these sections are lower than those in the non-vegetated channels. Specifically, the flow velocity in the upstream section is lower than that in the downstream section. This decrease in velocity is caused by the effects of backwater rise, which reduces the flow velocity in the upstream section of the vegetation [18]. As the upstream water level rises due to the resistance of the vegetation, while the water level gradually decreases in the vegetated area [7].
At the vegetated section, the velocity profile becomes more complex due to the influence of vegetation. The velocity profile turns into two distinct layers, with a significant change at 0.20 of the water depth. Tang et al. [12] reported that the velocity profile followed as a hyperbolic tangent function. Carollo et al. [1], Ren et al. [5], and Meng et al. [6] reported that the velocity profile followed an S-shaped pattern. Anjum and Tanaka [19] reported that the velocity profiles remained almost constant towards the top of the vegetation. In this study, the streamwise velocity within the lower layer is almost constant with depth where z/y is less than 0.20. It decreases significantly, which may be due to the high resistance that low-porosity vegetation offers. After z/y exceeds 0.20, the streamwise velocity increases rapidly toward the water surface as depth increases. Furthermore, a velocity inflection occurs near the lower-foliage area at z/y = 0.20. The velocity profile for submerged vegetation contained an inflection point near the top of the vegetation [1,16,19]. Most previous studies used cylindrical stems, while this research uses a shrub-like shape to simulate vegetation. One of the reasons may be that the shape of vegetation affects the position of the inflection point, where the largest volume of foliage area near 0.20 of water depth may lead to an increase in flow resistance. Thus, the presence of vegetation significantly influences the velocity profile.
3.1.2. Effect of Vegetation Shape on the Position of the Inflection Point
Many previous studies have been conducted to examine the impact of various shapes of submerged vegetation on flow characteristics, as illustrated in Table 1. The comparison of the streamwise velocity distribution between the present research and previous studies is shown in Figure 4. In the case of circular cylindrical vegetation, the values of zi/heff ranged from 0.66 to 0.76, which were derived from the data provided by Liu et al. [8], Chakraborty and Sarkar [44], Tang et al. [76], and Zhao et al. [77]. Conversely, for the cylindrical stems that had elliptical cross-sections with diameters that changed from 0.0007 m at the top to 0.00095 m at the bottom, a decrease in zi/heff was observed compared to previous studies of circular cylindrical vegetation, with a value that reached 0.48, which was inferred from the results reported by Kubrak et al. [20]. The decrease in zi/heff may be related to the change in the width of the elliptical cross-sections from top to bottom. Furthermore, in the case of rectangular plastic strips, the value of zi/heff reached 0.76, as concluded from the findings of Zeng and Li [78]. This observation agreed with previous studies on circular cylindrical vegetation. The values of zi/heff ranged from 0.67 to 0.85 for the vegetation that exhibited an increasing width in the vertical direction from the bottom to the top. Specifically, the Boxwood lobules demonstrated a maximum width of 0.20 m near the top of the vegetation, where the zi/heff reached 0.85 [27]. Additionally, the sedge showed a maximum width of 0.17 m near the top, at which the zi/heff was 0.68 [28]. Similarly, another variety sedge exhibited a maximum width of 0.07 m near the top of the vegetation, where the zi/heff was 0.67 [79]. Conversely, this study focuses on shrub-like vegetation that exhibits a decreasing width in the vertical direction from the bottom to the top, with a maximum width of 0.09 m near the bottom, where the zi/heff reaches 0.29. The decrease in zi/heff may be related to the position of the maximum width of the vegetation, which is near the bottom. Thus, the shape of vegetation significantly influences the position of the inflection point in the vertical streamwise velocity profile.

Table 1.
Summary of present and previous experimental data on flow with various shapes of submerged vegetation.
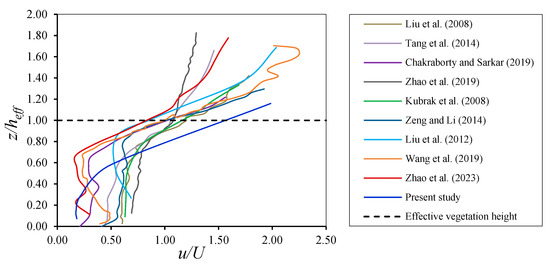
Figure 4.
Comparison of the streamwise velocity distribution between the present study and previous studies conducted by Liu et al. [8], Kubrak et al. [20], Liu et al. [27], Wang et al. [28], Chakraborty and Sarkar [44], Tang et al. [76], Zhao et al. [77], Zeng and Li [78], and Zhao et al. [79].
3.1.3. Effect of Bed Slope and Submerged Ratio on the Velocity Profile
The streamwise velocity is significantly influenced by the bed slope and the submerged ratio. Figure 5 illustrate the vertical distributions of streamwise velocity in vegetated channels for different bed slopes, with a discharge of 40 L/s, at submerged ratios of 0.69 and 0.94. For all submerged ratios, the velocity remains nearly constant when z/y is less than 0.20. However, when considering a submerged ratio of 0.69 (Figure 5a) with bed slopes of 0.0010 and 0.0020, the velocity increases rapidly just after z/y reaches 0.2, continuing until it reaches 0.4, and then increases slowly to the water surface. In contrast, with bed slopes of 0.0049 and 0.0062, the velocity increases slowly just after z/y reaches 0.2, progresses to 0.4, and then increases rapidly to the water surface. Meanwhile, for a bed slope of 0.0023, the velocity increases rapidly just after z/y reaches 0.2, continuing up to the water surface. Interestingly, at a submerged ratio of 0.94 (Figure 5b), all streamwise velocity profiles follow the same curve, indicating that the streamwise velocity increases rapidly just after z/y reaches 0.2 towards the water surface for all bed slopes. Furthermore, in the vegetated layer, the streamwise velocity decreases as the bed slope increases for all submerged ratios. This decrease may be due to the increase in water level resulting from higher resistance.
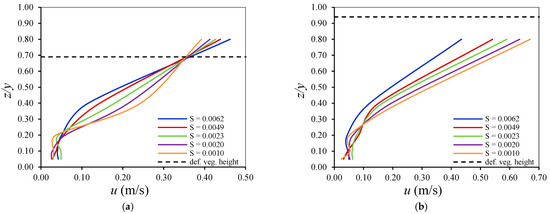
Figure 5.
Vertical distribution of streamwise velocity in vegetated channels for different bed slopes at Q = 40 L/s: (a) hdef/y = 0.69; (b) hdef/y = 0.94. The black dotted line indicates the height of deflected vegetation.
3.2. Water Surface Profile
The water surface profile along the centerline of the channel was surveyed using a point gauge. Figure 6 presents a comparison of the water surface profiles in both non-vegetated and vegetated channels, with a bed slope of 0.0062, a discharge of 40 L/s, and a Froude number of 0.19. The vegetation acts as an obstacle to the flow, which leads to an increase in the water level on the upstream side, a phenomenon known as backwater rise [67,73].
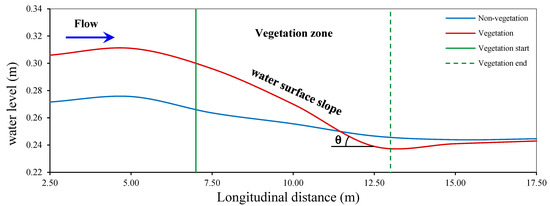
Figure 6.
Water surface profile in non-vegetated and vegetated channels at S = 0.0062, Q = 40 L/s, and F = 0.19.
On the other hand, the backwater rise significantly depends on the bed slope. Figure 7 presents a comparison of the water surface profiles in vegetated channels with different bed slopes at a discharge of 40 L/s and a submerged ratio of 0.94. It is observed that, for all bed slopes, the water surface profiles exhibit the same characteristics. The water level rises upstream of the vegetated zone, then decreases within the vegetated zone and gradually returns to the normal depth downstream of the vegetated zone. This observation agrees with previous studies [55,57,58]. A slight increase in backwater rise is noted with an increase in bed slope, as shown in Figure 7. Ahmed et al. [65] and Pasha et al. [73] reported that increasing the Froude number resulted in an increase in velocity, which subsequently led to an increase in energy head and ultimately caused a rise in backwater. In the present study, an increase in the bed slope leads to an increase in velocity, which raises energy head and consequently increases backwater levels. The backwater level reaches its maximum at a bed slope of 0.0062 and its minimum at a bed slope of 0.0010. Thus, the bed slope plays a significant role in altering the water surface profile.
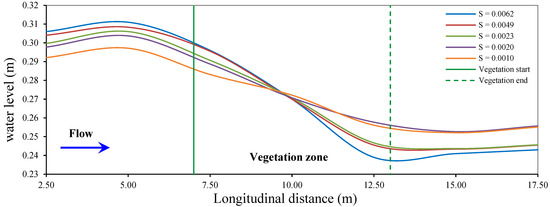
Figure 7.
Water surface profile in vegetated channels for different bed slopes at Q = 40 L/s and hdef/y = 0.94.
Due to the resistance of the vegetation, the water level increases on the upstream side and decreases on the downstream side of the vegetation zone [60,61,65]. Therefore, in the vegetation zone, a large water surface slope is produced as shown in Figure 6 and Figure 7. The relationship between the water surface slope (tan θ) and the Froude number for different bed slopes in vegetated channels at a submerged ratio of 0.94 is illustrated in Figure 8. The water surface slope increases with increases in both the Froude number [65,67] and the bed slopes. Figure 9 illustrates the relationship between the water surface slope (tan θ) and the Froude number at a bed slope of 0.0062 for different submerged ratios. It is observed that the water surface slope increases with increases in both the Froude number and the submerged ratio.
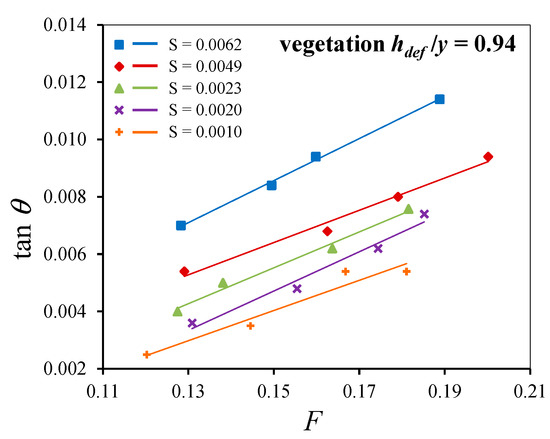
Figure 8.
Relationship between water surface slope (tan θ) and F for different bed slopes in vegetated channels at hdef/y = 0.94.
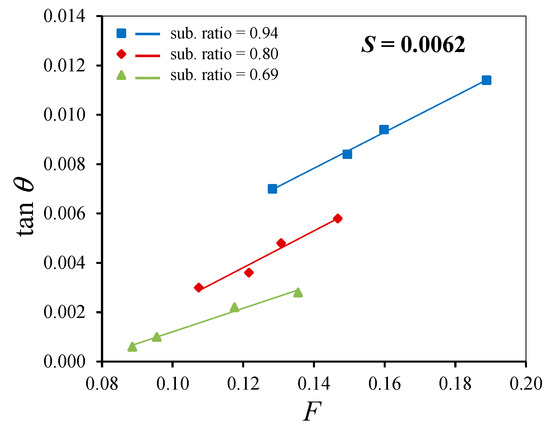
Figure 9.
Relationship between water surface slope (tan θ) and F at S = 0.0062 for different submerged ratios.
3.3. Evaluation of Energy Dissipation
The energy loss in the experimental models represents the difference between upstream and downstream total energy at sections 1 and 7, respectively. The total energy at any section of a channel and the energy loss have been estimated using the following equations [80].
where E is the total energy, z is the elevation of the bottom, y is the water depth, U is the depth-averaged velocity, g is the gravitational acceleration, α is a coefficient to account for variations in velocity in the case of irregular cross-sections (in this study, the value of α is considered as 1), ΔE is the energy loss, E1 is the total energy at section 1, and E7 is the total energy at section 7.
3.3.1. Effect of Bed Slope on Relative Energy Loss in Absence of Vegetation
In non-vegetated scenarios, sixty experimental tests were conducted to investigate the effect of the bed slope on the relative energy loss. Five bed slopes are applied: 0.0010, 0.0020, 0.0023, 0.0049, and 0.0062. The velocity was measured as ranging from 0.06 m/s to 0.46 m/s. The Froude number for each run indicates that the flow condition is classified as subcritical flow, with values ranging from 0.075 to 0.218. A second-degree polynomial function is used to plot the relationship between the relative energy loss and the Froude number. Figure 10 illustrates the relationship between the relative energy loss and the Froude number for different bed slopes. It is observed that the relative energy loss increases with increases in both the Froude number and the bed slopes. The relative energy loss ranges as follows: 0.37–2.43%, 0.99–3.03%, 1.70–4.64%, 2.17–5.20%, and 2.61–6.61% for slopes of 0.0010, 0.0020, 0.0023, 0.0049, and 0.0062, respectively. Compared to the slope of 0.0010, the relative energy loss increases by factors of 1.68, 2.34, 3.08, and 4.15 for slopes of 0.0020, 0.0023, 0.0049, and 0.0062, respectively. Consequently, the bed slope has little effect on the relative energy loss.
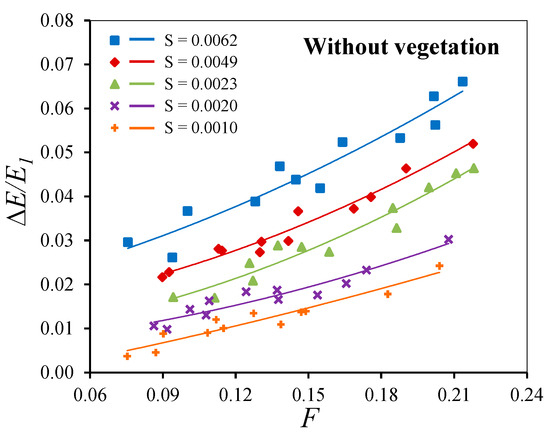
Figure 10.
Relationship between ΔE/E1 and F for different bed slopes in the case of a channel without vegetation.
3.3.2. Effect of Vegetation on Relative Energy Loss
After the installation of vegetation, a significant loss of total energy has been observed [60,61,69]. The effect of the submerged and floating vegetation on the relative energy loss has been examined, with the submerged ratio analyzed in a range from 0.69 to 0.94. The degree of submergence is defined as the ratio of the deflected height of submerged vegetation to flow depth. In the selected range of the Froude number, from 0.078 to 0.200, the relative energy loss through both submerged and floating vegetation is calculated.
Figure 11 illustrates the relationship between the relative energy loss and the Froude number for different bed slopes in both non-vegetated and vegetated channels at submerged ratios of 0.69, 0.80, and 0.94. For a submerged ratio of 0.69, as shown in Figure 11a, the maximum relative energy loss reaches 4.10%, 5.02%, 5.49%, 6.21%, and 7.01% for slopes of 0.0010, 0.0020, 0.0023, 0.0049, and 0.0062, respectively. At a submerged ratio of 0.80, as shown in Figure 11b, the maximum relative energy loss reaches 7.70%, 9.35%, 10.01%, 11.68%, and 12.68% for the same slopes. Finally, for a submerged ratio of 0.94, as shown in Figure 11c, the maximum relative energy loss reaches 15.00%, 16.81%, 17.74%, 20.83%, and 22.51% for the same slopes.
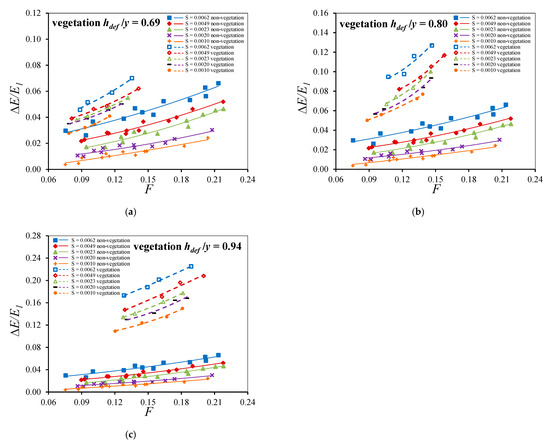
Figure 11.
Relationship between ΔE/E1 and F for different bed slopes in non-vegetated and vegetated channels: (a) hdef/y = 0.69; (b) hdef/y = 0.80; (c) hdef/y = 0.94.
Under the same conditions with a vegetated submerged ratio of 0.69, as shown in Figure 11a, the relative energy loss increases compared to the non-vegetated slope, increasing by factors of 4.19, 3.13, 2.37, 1.88, and 1.57 for slopes of 0.0010, 0.0020, 0.0023, 0.0049, and 0.0062, respectively. At a submerged ratio of 0.80, as shown in Figure 11b, the relative energy loss increases by factors of 6.05, 4.60, 3.60, 3.01, and 2.72 for the same slopes. Similarly, for a submerged ratio of 0.94, as shown in Figure 11c, the relative energy loss increases by factors of 8.26, 7.08, 5.27, 4.77, and 4.18 for the same slopes. Consequently, the presence of vegetation leads to an increase in relative energy loss, as it plays a crucial role in dissipating energy. In addition, the relative energy loss increases with increases in both the Froude number and the bed slopes.
3.3.3. Effect of Submerged Ratio on Relative Energy Loss
The effect of the submerged ratio on the relative energy loss has been examined, with the submerged ratio analyzed in a range from 0.69 to 0.94. The relationship between the relative energy loss and the Froude number for different submerged ratios at bed slopes of 0.0010, 0.0020, 0.0023, 0.0049, and 0.0062 is shown in Figure 12.
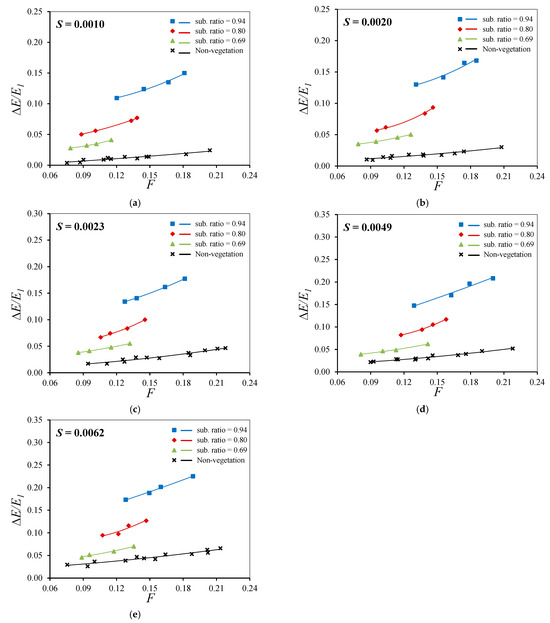
Figure 12.
Relationship between ΔE/E1 and F for different submerged ratio: (a) S = 0.0010; (b) S = 0.0020; (c) S = 0.0023; (d) S = 0.0049; (e) S = 0.0062.
Under the same bed slope conditions, the relative energy loss increases with increasing submerged ratios. For the bed slope of 0.0010, as shown in Figure 12a, the relative energy loss increases with increasing submerged ratios compared to the non-vegetated case, with factors of 4.19, 6.05, and 8.26 for submerged ratios of 0.69, 0.80, and 0.94, respectively. At a bed slope of 0.0020, as shown in Figure 12b, the relative energy loss increases by factors of 3.13, 4.60, and 7.08 for the same submerged ratios. Similarly, at a bed slope of 0.0023, as shown in Figure 12c, the relative energy loss increases by factors of 2.37, 3.60, and 5.27. At a slope of 0.0049, as shown in Figure 12d, it further increases by factors of 1.88, 3.01, and 4.77. Finally, for a bed slope of 0.0062, as shown in Figure 12e, the relative energy loss increases by factors of 1.57, 2.72, and 4.18 for the same submerged ratios. The relative energy loss increases with a higher submerged ratio because friction between the flow and the vegetation increases, as well as turbulent kinetic energy generation. Thus, the submerged ratio plays a vital role in significantly affecting the energy loss.
4. Statistical Regression
In the case of a vegetated channel, the relative energy loss is expressed as a function of the Froude number, bed slope, and submerged ratio, as shown in Equation (3). The results indicate that the relative energy loss increases with an increase in the Froude number, bed slope, and submerged ratio. The exponent value of the submerged ratio depends on its own value and exhibits a second-degree polynomial relationship with it. Figure 13 illustrates a comparison between the predicted and calculated relative energy loss for a vegetated channel within a submerged ratio range of 0.69 to 0.94 and ±15% error lines. The correlation coefficient R2 of Equation (3) is calculated to be 0.99, indicating a strong correlation between the variables. The results indicate a strong agreement between the calculated and predicted relative energy loss values for all experimental data.
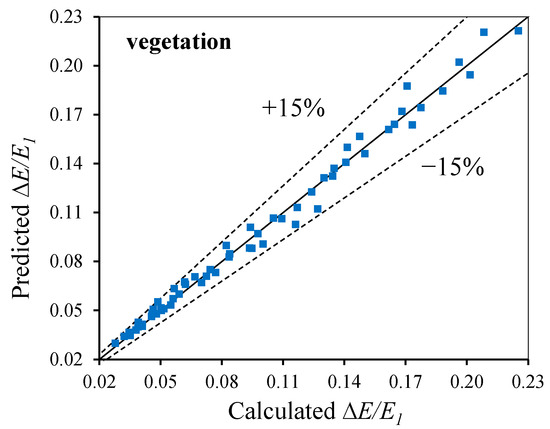
Figure 13.
Comparison between predicted and calculated relative energy loss for vegetated channel at submerged ratio range from 0.69 to 0.94 and ±15% error lines.
5. Conclusions
The following results have been created from this research:
- 1.
- The streamwise velocity within the lower layer is almost constant. Then, it increases rapidly toward the water surface as the depth increases.
- 2.
- The shape of the vegetation significantly influences the position of the inflection point in the vertical streamwise velocity profile.
- 3.
- The streamwise velocity is significantly influenced by the submerged ratio.
- 4.
- An increase in bed slope leads to a slight increase in backwater rise.
- 5.
- The bed slope has little effect on relative energy loss, while the presence of vegetation leads to a significant increase.
- 6.
- The relative energy loss increases with increasing submerged ratio.
- 7.
- New empirical equations are proposed to estimate the relative energy loss in vegetated channels.
Author Contributions
Conceptualization, M.G.E., R.W., G.M.A.-A. and M.F.S.; methodology, M.G.E., G.M.A.-A. and M.F.S.; validation, M.G.E., R.W., G.M.A.-A. and M.F.S.; formal analysis, M.G.E.; investigation, M.G.E.; resources, M.G.E., G.M.A.-A., R.W. and M.F.S.; data curation, G.M.A.-A. and M.F.S.; writing—original draft preparation, M.G.E.; writing—review and editing, M.G.E., R.W., E.P., G.M.A.-A. and M.F.S.; visualization, M.G.E.; supervision, R.W., E.P. and G.M.A.-A. All authors have read and agreed to the published version of the manuscript.
Funding
This research received no external funding.
Data Availability Statement
Data are contained within the article.
Acknowledgments
The contribution is a partial output of the project KEGA 032EU-4-2024: Creation of an education model for increasing the skills of students of a non-programming oriented university in the field of using artificial intelligence tools to support business and entrepreneurship.
Conflicts of Interest
The authors declare no conflicts of interest.
Abbreviations
The following symbols are used in this paper:
| L | Channel length |
| B | Channel width |
| S | Channel bed slope |
| y | Flow depth |
| z | Distance from the measurement point to the bed |
| Height of submerged vegetation | |
| Submerged ratio | |
| Effective vegetation height | |
| Relative position of the inflection point | |
| θ | Water surface slope angle |
| u | Streamwise velocity |
| U | Average flow velocity |
| Q | Discharge |
| E | Total energy |
| ΔE | Energy loss |
| ΔE/E | Relative energy loss |
| α | Velocity coefficient |
| g | Gravitational acceleration |
| F | Froude number |
| γ | Specific weight of water |
| ρ | Density of water |
References
- Carollo, F.G.; Ferro, V.; Termini, D. Flow velocity measurements in vegetated channels. J. Hydraul. Eng. 2002, 128, 664–673. [Google Scholar] [CrossRef]
- Shivpure, V.; Devi, T.B.; Kumar, B. Turbulent characteristics of densely flexible submerged vegetated channel. ISH J. Hydraul. Eng. 2016, 22, 220–226. [Google Scholar] [CrossRef]
- Li, W.Q.; Wang, D.; Jiao, J.L.; Yang, K.J. Effects of vegetation patch density on flow velocity characteristics in an open channel. J. Hydrodyn. 2019, 31, 1052–1059. [Google Scholar] [CrossRef]
- Ahmad, M.; Ghani, U.; Anjum, N.; Pasha, G.A.; Ullah, M.K.; Ahmed, A. Investigating the flow hydrodynamics in a compound channel with layered vegetated floodplains. Civ. Eng. J. 2020, 6, 860–876. [Google Scholar] [CrossRef]
- Ren, B.L.; Wang, D.; Li, W.Q.; Yang, K.J. The velocity patterns in rigid and mobile channels with vegetation patches. J. Hydrodyn. 2020, 32, 561–569. [Google Scholar] [CrossRef]
- Meng, X.; Zhou, Y.; Sun, Z.; Ding, K.; Chong, L. Hydraulic characteristics of emerged rigid and submerged flexible vegetations in the riparian zone. Water 2021, 13, 1057. [Google Scholar] [CrossRef]
- Eraky, O.M.; Eltoukhy, M.A.R.; Abdelmoaty, M.S.; Farouk, E. Effect of rigid, bank vegetation on velocity distribution and water surface profile in open channel. Water Pract. Technol. 2022, 17, 1445–1457. [Google Scholar] [CrossRef]
- Liu, D.; Diplas, P.; Fairbanks, J.D.; Hodges, C.C. An experimental study of flow through rigid vegetation. J. Geophys. Res. Earth Surf. 2008, 113. [Google Scholar] [CrossRef]
- Liu, D.; Diplas, P.; Hodges, C.C.; Fairbanks, J.D. Hydrodynamics of flow through double layer rigid vegetation. Geomorphology 2010, 116, 286–296. [Google Scholar] [CrossRef]
- Tang, X.; Rahimi, H.; Singh, P.; Wei, Z.; Wang, Y.; Zhao, Y.; Lu, Q. Experimental study of open-channel flow with partial double-layered vegetation. Proccedings of the 1st International Symposium on Water Resource and Environmental Management (WREM 2018), Kunming, China, 28–30 November 2018; Volume 81, p. 01010. [Google Scholar] [CrossRef]
- Rashedunnabi, A.H.M.; Tanaka, N. Effectiveness of double-layer rigid vegetation in reducing the velocity and fluid force of a tsunami inundation behind the vegetation. Ocean Eng. 2020, 201, 107142. [Google Scholar] [CrossRef]
- Tang, X.; Rahimi, H.; Guan, Y.; Wang, Y. Hydraulic characteristics of open-channel flow with partially-placed double layer rigid vegetation. Environ. Fluid Mech. 2021, 21, 317–342. [Google Scholar] [CrossRef]
- Xia, J.; Nehal, L. Hydraulic features of flow through emergent bending aquatic vegetation in the riparian zone. Water 2013, 2080–2093. [Google Scholar] [CrossRef]
- Muhammad, M.M.; Yusof, K.W.; Mustafa, M.R.U.; Ghani, A.A. Velocity distributions in grassed channel. In Proceedings of the 4th Annual International Conference on Architecture and Civil Engineering (ACE 2016), Singapore, 25–26 April 2016. [Google Scholar]
- Ai, Y.D.; Liu, M.Y.; Huai, W.X. Numerical investigation of flow with floating vegetation island. J. Hydrodyn. 2020, 32, 31–43. [Google Scholar] [CrossRef]
- Barahimi, M.; Sui, J. Effects of submerged vegetation arrangement patterns and density on flow structure. Water 2023, 15, 176. [Google Scholar] [CrossRef]
- Mofrad, M.R.T.; Afzalimehr, H.; Parvizi, P.; Ahmad, S. Comparison of velocity and reynolds stress distributions in a straight rectangular channel with submerged and emergent vegetation. Water 2023, 15, 2435. [Google Scholar] [CrossRef]
- Iimura, K.; Tanaka, N. Numerical simulation estimating effects of tree density distribution in coastal forest on tsunami mitigation. Ocean Eng. 2012, 54, 223–232. [Google Scholar] [CrossRef]
- Anjum, N.; Tanaka, N. Study on the flow structure around discontinued vertically layered vegetation in an open channel. J. Hydrodyn. 2020, 32, 454–467. [Google Scholar] [CrossRef]
- Kubrak, E.; Kubrak, J.; Rowinski, P.M. Vertical velocity distributions through and above submerged, flexible vegetation. Hydrol. Sci. J. 2008, 53, 905–920. [Google Scholar] [CrossRef]
- Huai, W.X.; Han, J.; Zeng, Y.H.; An, X.; Qian, Z.D. Velocity distribution of flow with submerged flexible vegetations based on mixing-length approach. Appl. Math. Mech. 2009, 30, 343–351. [Google Scholar] [CrossRef]
- Huai, W.; Wang, W.; Zeng, Y. Two-layer model for open channel flow with submerged flexible vegetation. J. Hydraul. Res. 2013, 51, 708–718. [Google Scholar] [CrossRef]
- Wang, W.J.; Huai, W.X.; Zeng, Y.H.; Zhou, J.F. Analytical solution of velocity distribution for flow through submerged large deflection flexible vegetation. Appl. Math. Mech. 2015, 36, 107–120. [Google Scholar] [CrossRef]
- Pu, J.H.; Hussain, A.; Guo, Y.k.; Vardakastanis, N.; Hanmaiahgari, P.R.; Lam, D. Submerged flexible vegetation impact on open channel flow velocity distribution: An analytical modelling study on drag and friction. Water Sci. Eng. 2019, 12, 121–128. [Google Scholar] [CrossRef]
- Chen, Y.C.; Kao, S.P. Velocity distribution in open channels with submerged aquatic plant. Hydrol. Process. 2011, 25, 2009–2017. [Google Scholar] [CrossRef]
- Nikora, N.; Nikora, V.; O’Donoghue, T. Velocity profiles in vegetated open-channel flows: Combined effects of multiple mechanisms. J. Hydraul. Eng. 2013, 139, 1021–1032. [Google Scholar] [CrossRef]
- Liu, Z.; Chen, Y.; Zhu, D.; Hui, E.; Jiang, C. Analytical model for vertical velocity profiles in flows with submerged shrub-like vegetation. Environ. Fluid Mech. 2012, 12, 341–346. [Google Scholar] [CrossRef]
- Wang, W.J.; Huai, W.X.; Li, S.; Wang, P.; Wang, Y.F.; Zhang, J. Analytical solutions of velocity profile in flow through submerged vegetation with variable frontal width. J. Hydrol. 2019, 578, 124088. [Google Scholar] [CrossRef]
- Cheng, N.S. Single-layer model for average flow velocity with submerged rigid cylinders. J. Hydraul. Eng. 2015, 141, 06015012. [Google Scholar] [CrossRef]
- Klopstra, D.; Barneveld, H.J.; Van Noortwijk, J.M.; Van Velzen, E.H. Analytical model for hydraulic roughness of submerged vegetation. In Proceedings of the 27th IAHR World Congress, San Francisco, CA, USA, 10–15 August 1997; pp. 775–780. [Google Scholar]
- Righetti, M.; Armanini, A. Flow resistance in open channel flows with sparsely distributed bushes. J. Hydrol. 2002, 269, 55–64. [Google Scholar] [CrossRef]
- Stone, B.M.; Shen, H.T. Hydraulic resistance of flow in channels with cylindrical roughness. J. Hydraul. Eng. 2002, 128, 500–506. [Google Scholar] [CrossRef]
- Defina, A.; Bixio, A.C. Mean flow and turbulence in vegetated open channel flow. Water Resour. Res. 2005, 41. [Google Scholar] [CrossRef]
- Baptist, M.J.; Babovic, V.; Uthurburu, J.R.; Keijzer, M.; Uittenbogaard, R.E.; Mynett, A.; Verwey, A. On inducing equations for vegetation resistance. J. Hydraul. Res. 2007, 45, 435–450. [Google Scholar] [CrossRef]
- Huthoff, F.; Augustijn, D.C.M.; Hulscher, S.J.M.H. Analytical solution of the depth-averaged flow velocity in case of submerged rigid cylindrical vegetation. Water Resour. Res. 2007, 43. [Google Scholar] [CrossRef]
- Yang, W.; Choi, S.U. A two-layer approach for depth-limited open-channel flows with submerged vegetation. J. Hydraul. Res. 2010, 48, 466–475. [Google Scholar] [CrossRef]
- Tang, X. A mixing-length-scale-based analytical model for predicting velocity profiles of open-channel flows with submerged rigid vegetation. Water Environ. J. 2019, 33, 610–619. [Google Scholar] [CrossRef]
- Huai, W.; Wang, W.; Hu, Y.; Zeng, Y.; Yang, Z. Analytical model of the mean velocity distribution in an open channel with double-layered rigid vegetation. Adv. Water Resour. 2014, 69, 106–113. [Google Scholar] [CrossRef]
- Singh, P.; Rahimi, H.R.; Tang, X. Parameterization of the modeling variables in velocity analytical solutions of open-channel flows with double-layered vegetation. Environ. Fluid Mech. 2019, 19, 765–784. [Google Scholar] [CrossRef]
- Rahimi, H.R.; Tang, X.; Singh, P.; Li, M.; Alaghmand, S. Open channel flow within and above a layered vegetation: Experiments and first-order closure modeling. Adv. Water Resour. 2020, 137, 103527. [Google Scholar] [CrossRef]
- Huai, W.X.; Zeng, Y.H.; Xu, Z.G.; Yang, Z.H. Three-layer model for vertical velocity distribution in open channel flow with submerged rigid vegetation. Adv. Water Resour. 2009, 32, 487–492. [Google Scholar] [CrossRef]
- Samani, J.M.V.; Mazaheri, M. An analytical model for velocity distribution in transition zone for channel flows over inflexible submerged vegetation. J. Agric. Sci. Technol. 2009, 11, 573–584. [Google Scholar]
- Hu, Y.; Huai, W.; Han, J. Analytical solution for vertical profile of streamwise velocity in open-channel flow with submerged vegetation. Environ. Fluid Mech. 2013, 13, 389–402. [Google Scholar] [CrossRef]
- Chakraborty, P.; Sarkar, A. Study of flow characteristics within randomly distributed submerged rigid vegetation. J. Hydrodyn. 2019, 31, 358–367. [Google Scholar] [CrossRef]
- Huai, W.X.; Chen, Z.B.; Jie, H.A.N.; Zhang, L.X.; Zeng, Y.H. Mathematical model for the flow with submerged and emerged rigid vegetation. J. Hydrodyn. Ser. B 2009, 21, 722–729. [Google Scholar] [CrossRef]
- Zhang, X.; Nepf, H.M. Exchange flow between open water and floating vegetation. Environ. Fluid Mech. 2011, 11, 531–546. [Google Scholar] [CrossRef]
- Huai, W.; Hu, Y.; Zeng, Y.; Han, J. Velocity distribution for open channel flows with suspended vegetation. Adv. Water Resour. 2012, 49, 56–61. [Google Scholar] [CrossRef]
- Morri, M.; Soualmia, A.; Belleudy, P. Mean velocity modeling of open-channel flow with submerged rigid vegetation. Int. J. Mech. Mechatron. Eng. 2015, 9, 302–307. [Google Scholar]
- Van Velzen, E.H.; Jesse, P.; Cornelissen, P.; Coops, H. Stromingsweerstand Vegetatie in Uiterwaarden; RIZA: Arnhem, The Netherlands, 2003. [Google Scholar]
- Tang, X. Methods for predicting vertical velocity distributions in open channel flows with submerged rigid vegetation. In Proceedings of the 21st IAHR-APD Congress, Yogyakarta, Indonesia, 2–5 September 2018; Volume 1, pp. 567–576. [Google Scholar]
- Nepf, H.M. Flow and transport in regions with aquatic vegetation. Annu. Rev. Fluid Mech. 2012, 44, 123–142. [Google Scholar] [CrossRef]
- Tang, X. Evaluating two-layer models for velocity profiles in open-channels with submerged vegetation. J. Geosci. Environ. Prot. 2019, 7, 68–80. [Google Scholar] [CrossRef]
- Asghar, M.; Pasha, G.A.; Ghani, U.; Iqbal, S.; Jameel, M.S. Investigating multiple debris impact load and role of vegetation in protection of house model during floods. In Proceedings of the 2nd Conference on Sustainability in Civil Engineering, Islamabad, Pakistan, 26–27 November 2020. [Google Scholar]
- Miyab, N.M.; Afzalimehr, H.; Singh, V.P. Experimental investigation of influence of vegetation on flow turbulence. Int. J. Hydraul. Eng. 2015, 4, 54–69. [Google Scholar]
- Eraky, O.M.; Eltoukhy, M.A.R.; Abdelmoaty, M.S.; Farouk, E. Heading up and head losses estimation due to rigid bank vegetation. Eng. Res. J. (Shoubra) 2023, 52, 64–72. [Google Scholar] [CrossRef]
- Pasha, G.A.; Tanaka, N. Energy loss and drag in a steady flow through emergent vegetation. In Proceedings of the 12th International Conference on Hydroscience & Engineering, Tainan, Taiwan, 6–10 November 2016. [Google Scholar]
- Pasha, G.A.; Tanaka, N. Undular hydraulic jump formation and energy loss in a flow through emergent vegetation of varying thickness and density. Ocean Eng. 2017, 141, 308–325. [Google Scholar] [CrossRef]
- Rashedunnabi, A.H.M.; Tanaka, N. Physical modelling of tsunami energy reduction through vertically two layered rigid vegetation. In Proceedings of the 12th ISE, Tokyo, Japan, 19–24 August 2018. [Google Scholar]
- Pasha, G.A.; Tanaka, N. Characteristics of a hydraulic jump formed on upstream vegetation of varying density and thickness. J. Earthq. Tsunami 2020, 14, 2050012. [Google Scholar] [CrossRef]
- Wu, Y.J.; Jing, H.F.; Li, C.G.; Song, Y.T. Flow characteristics in open channels with aquatic rigid vegetation. J. Hydrodyn. 2020, 32, 1100–1108. [Google Scholar] [CrossRef]
- Anjum, N.; Tanaka, N. Experimental study on flow analysis and energy loss around discontinued vertically layered vegetation. Environ. Fluid Mech. 2020, 20, 791–817. [Google Scholar] [CrossRef]
- Sanjou, M.; Okamoto, T.; Nezu, I. Experimental study on fluid energy reduction through a flood protection forest. J. Flood Risk Manag. 2018, 11, e12339. [Google Scholar] [CrossRef]
- Shaheen, M.F.; Abdel-Aal, G.M.; Elbagoury, M.G. The Influence of Submerged and Floating Vegetation on Manning’s Roughness Coefficient: An Experimental Analysis. Port-Said Eng. Res. J. 2024. [Google Scholar] [CrossRef]
- Mohamed, H.I.; Abd-Elaal, A.M.; Mahmoud, A.A. Flow characteristics of open channels with floating vegetation. J. Eng. Sci. 2020, 48, 186–196. [Google Scholar] [CrossRef]
- Ahmed, A.; Valyrakis, M.; Ghumman, A.; Pasha, G.A.; Farooq, R. Experimental investigation of flood energy reduction through vegetation at various angles. River Res. Appl. 2021, 37, 644–655. [Google Scholar] [CrossRef]
- Usman, F.; Murakami, K.; Kurniawan, E.B. Study on reducing tsunami inundation energy by the modification of topography based on local wisdom. Procedia Environ. Sci. 2014, 20, 642–650. [Google Scholar] [CrossRef][Green Version]
- Ahmed, A.; Ghumman, A. Experimental investigation of flood energy dissipation by single and hybrid defense system. Water 2019, 11, 1971. [Google Scholar] [CrossRef]
- Muhammad, R.A.H.; Tanaka, N. Energy reduction of a tsunami current through a hybrid defense system comprising a sea embankment followed by a coastal forest. Geosciences 2019, 9, 247. [Google Scholar] [CrossRef]
- Rahman, M.A.; Tanaka, N.; Rashedunnabi, A.H.M.; Igarashi, Y. Energy reduction in tsunami through a defense system comprising an embankment and vegetation on a mound. In Proceedings of the 22nd IAHR-APD Congress, Sapporo, Japan, 27–30 October 2020. [Google Scholar]
- Rahman, M.A.; Tanaka, N.; Rashedunnabi, A.H.M. Flume experiments on flow analysis and energy reduction through a compound tsunami mitigation system with a seaward embankment and landward vegetation over a mound. Geosciences 2021, 11, 90. [Google Scholar] [CrossRef]
- Ahmed, A.; Valyrakis, M.; Ghumman, A.; Pasha, G.A.; Farooq, R. Experimental investigation of flood energy dissipation through embankment followed by emergent vegetation. Period. Polytech. Civ. Eng. 2021, 65, 1213–1226. [Google Scholar] [CrossRef]
- Rahman, M.A.; Tanaka, N.; Reheman, N. Experimental study on reduction of scouring and tsunami energy through a defense system consisting a seaward embankment followed by vertically double layered vegetation. Ocean Eng. 2021, 234, 108816. [Google Scholar] [CrossRef]
- Pasha, G.A.; Tanaka, N.; Yagisawa, J.; Achmad, F.N. Tsunami mitigation by combination of coastal vegetation and a backward-facing step. Coast. Eng. J. 2018, 60, 104–125. [Google Scholar] [CrossRef]
- Murtaza, N.; Pasha, G.A.; Ahmed, A. Experimental Investigation of flood energy dissipation for hill torrents management. In Proceedings of the 2nd International Conference on Advance in Civil and Environmental Engineering, Chengdu, China, 22–23 February 2023. [Google Scholar]
- Yeganeh-Bakhtiary, A.; Kolahian, M.; Eyvazoghli, H. Experimental investigation of coastal flooding hydrodynamics using a hybrid defense system. Water 2023, 15, 2632. [Google Scholar] [CrossRef]
- Tang, H.; Tian, Z.; Yan, J.; Yuan, S. Determining drag coefficients and their application in modelling of turbulent flow with submerged vegetation. Adv. Water Resour. 2014, 69, 134–145. [Google Scholar] [CrossRef]
- Zhao, H.; Yan, J.; Yuan, S.; Liu, J.; Zheng, J. Effects of submerged vegetation density on turbulent flow characteristics in an open channel. Water 2019, 11, 2154. [Google Scholar] [CrossRef]
- Zeng, C.; Li, C.W. Measurements and modeling of open-channel flows with finite semi-rigid vegetation patches. Environ. Fluid Mech. 2014, 14, 113–134. [Google Scholar] [CrossRef]
- Zhao, H.; Wang, W.; Jia, F.; Wang, H.; Liu, Z.; Xu, Y. Numerical and analytical flow models in ecological channels with interaction of vegetation and freshwater. Front. Environ. Sci. 2023, 11, 1098993. [Google Scholar] [CrossRef]
- Chow, V.T. Open Channel Hydraulics; McGraw-Hill Publishing Co.: New York, NY, USA, 1959. [Google Scholar]
Disclaimer/Publisher’s Note: The statements, opinions and data contained in all publications are solely those of the individual author(s) and contributor(s) and not of MDPI and/or the editor(s). MDPI and/or the editor(s) disclaim responsibility for any injury to people or property resulting from any ideas, methods, instructions or products referred to in the content. |
© 2025 by the authors. Licensee MDPI, Basel, Switzerland. This article is an open access article distributed under the terms and conditions of the Creative Commons Attribution (CC BY) license (https://creativecommons.org/licenses/by/4.0/).