Article

Effects of Extreme Flooding on Soil Characteristics, Soil Enzyme Activity, and Microbial Structure in Shengjin Lake

Anhui Province Key Laboratory of Wetland Ecosystem Protection and Restoration, School of Resources and Environmental Engineering, Anhui University, Hefei 230601, China
*
Author to whom correspondence should be addressed.
Water 2025, 17(12), 1789; https://doi.org/10.3390/w17121789
Submission received: 8 May 2025 / Revised: 8 June 2025 / Accepted: 13 June 2025 / Published: 14 June 2025

Abstract

Under the global climate change context, the probability of extreme flood events has substantially increased. Nevertheless, our understanding of the post-flood dynamics in wetland ecosystems, particularly regarding soil biogeochemistry and microbiota, remains limited. Therefore, soil properties, enzyme (soil acid phosphatase, soil alkaline phosphatase, soil urease and soil protease) activities, and bacterial communities were examined in four dominant vegetation communities of Shengjin Lake’s riparian zone prior to and following an extreme flooding event. Our findings reveal a notable reduction in soil fertility, including nitrate nitrogen (NO3-N), ammonium nitrogen (NH4⁺-N), available potassium (AK), and total phosphorus (TP), following the flood across different vegetation types. Marked enhancement of four key soil enzymatic activities was observed after flooding. Although the flooding event did not alter the dominant phyla-level bacterial taxa in the various vegetation communities, it significantly reduced the structural divergence among soil bacterial assemblages. Following the flooding event, total nitrogen (TN) emerged as a direct regulatory factor mediating the influence of vegetation communities on bacterial community composition, replacing the previous role of soil urease activity. These results highlight the profound impact of extreme flooding on plant–microbe interactions and provide critical insights into the ecological consequences of such events in wetland ecosystems.

1. Introduction

Riparian zones, as ecotones between aquatic and terrestrial ecosystems, constitute indispensable components of the global ecosystem [1]. These transitional ecosystems perform multifaceted ecological functions, including bank stabilization, provision of organic matter, sustenance of diverse aquatic–terrestrial organisms, sediment retention, moderation of extreme temperatures, and buffering of biogeochemical cycles [2,3]. The study by Fu et al. [4] demonstrates a significant ecosystem service valuation: the average value of individual basic evaluation units in a riparian zone in Northeast China increased from USD 80,000 (1986) to USD 300,000 (2012). Despite being recognized as some of the most biologically productive and biodiverse systems, riparian zones are highly sensitive to human activities and face multiple threats [5]. Pollution, biological habitat modification, species invasion, anthropogenic disturbances, hydro-morphological alteration, and climate change are a number of multiple stressors on riparian zones [6]. They interact with one another and incur rapid loss of ecological functions, thus affecting ecosystem stability [7,8]. For preserving existing, intact riparian zones, there is an urgent need to understand the complex impact of these factors threatening riparian ecological function.
Under combined pressures from climate change and human activities, increasingly frequent extreme hydrological events are driving accelerated wetland degradation [9]. Floods are recognized as critical drivers of vegetation dynamics and soil processes [10,11]. During field experiments in five European lowland streams, riparian species richness declined overall, whereas riparian plant biomass increased after three years of intensified winter flooding [12]. Similarly, following the January 2011 extreme flood event that inundated southeast Queensland, Australia, flooding led to significantly increased seed-bank abundance while markedly decreasing species richness and diversity [13]. In addition, a 2011 study on a stream in Italy [6] found that due to physical changes in the habitat caused by the flood events, the biodiversity of benthic organisms in the stream decreased. Meanwhile, hydrological regimes significantly influence wetland soil physicochemical properties, including soil pH, ion solubility, and nutrient cycling dynamics. Floods significantly enhance the transport of organism-rich and nutrient-enriched sediments [14], facilitating C-N fluxes between river channels and riparian wetlands, thereby influencing the productivity of these ecosystems [15,16]. Although the impacts of extreme flow regimes on riparian biodiversity and vegetation structure have been extensively studied, research has rarely examined soil functional responses to such hydrological disturbances.
Soils in riparian zones serve as biogeochemical hotspots for nutrient cycling, and the coupled cycling of carbon and nutrients plays a pivotal role in regulating water quality and sustaining ecosystem services during and after flood events [17]. Soil enzymes, which are biological indicators, respond rapidly to environmental changes and enable effective assessment of ecosystem health. Studies demonstrate that soil enzyme activity increases during flooding; however, substrate diffusion and elevated oxygen levels post-flooding reduce enzymatic efficiency [18]. At the microbial level, flooding induced anaerobic conditions alter microbiota composition [19]. For instance, a sharp increase in total microbial biomass, bacteria and fungi following extreme flooding was reported by Ou et al. [11]. However, Unger et al. [20] reported decreased markers for aerobic, Gram-positive, and Gram-negative bacterial populations. Consequently, analyzing soil physicochemical properties, microbial community dynamics, and enzymatic responses to flooding events is critical for elucidating carbon and nitrogen cycling mechanisms and wetland ecosystem functionality [21,22]. Plant communities mediate soil functioning through litter and root exudate fluxes in this ecosystem. It is generally believed that more active and more abundant microbial communities exist in high-plant-diversity communities. Considering the establishment of plant vegetation, microbiota analysis should be conducted after a brief soil recovery phase post-flooding, as immediate sampling may yield unrepresentative results. The impacts of flooding on soil have primarily been investigated through laboratory simulations [23], with limited field studies investigating its effects on ecosystem functioning [24]. Riparian zones, in fact, are open ecosystems [25], and simulations alone are insufficient to fully capture the complex responses of soil ecological process to flooding [26].
As a shallow lake connected to the Yangtze River, Shengjin Lake provides natural habitats in its riparian zone for wetland plant communities dominated by Carex thunbergii. Despite prolonged flooding throughout the summer and autumn seasons, Carex thunbergii continues to dominate the riparian zone, covering almost 80% of the area [27]. Nevertheless, the effects of flooding on the soil functions of wetland plant communities, especially in hygrophytic communities like those dominated by Carex thunbergii, are still not well understood.
Due to the unpredictable nature of flooding events, it is extremely difficult to investigate the impacts of natural flooding on the soil ecosystems of riparian wetlands. However, a severe Yangtze flood occurred in the summer of 2020 provided a valuable opportunity for such research. The main aims of this study were to (1) investigate the effects of extreme floods on soil physicochemical properties across the different vegetation communities in riparian zones; (2) elucidate the impacts of extreme floods on key soil enzymatic activities in riparian vegetation communities; (3) characterize changes in soil bacterial community structure of riparian communities under extreme flood events; (4) determine the altered regulatory pathways linking vegetation composition and soil environmental factors to soil bacterial community assembly before and after extreme flooding. By specifically comparing the differences in soil physicochemical properties, soil enzymes, and microbial communities across different vegetation communities before and after extreme flooding, this study expands our understanding of soil changes under extreme flood events and provides scientific support for the conservation of riparian zones.

2. Materials and Methods

2.1. Study Site

The research area is located in Shengjin Lake wetland region, Anhui Province, China (30°16′–30°25′ N, 116°59′–117°12′ E). This region exhibits characteristic north subtropical monsoonal conditions, with an average annual temperature of 16.14 °C and an average annual precipitation of 1600 mm. The soil type is classified as Haplaquepts according to the US Soil Taxonomy (USST) [28]. Shengjin Lake covers an area of 132.8 km2 and consists of three hydrologically linked lacustrine zones (upper/middle/lower) that extend northward from the west and are centered around the Huangpeng Sluice. The hydrological dynamics of Shengjin Lake follow a seasonal cycle, with water levels declining from November to next March. This drawdown phase supports a hygrophytic vegetation assemblage dominated by C. thunbergii (>70% cover), alongside associated species including Phalaris arundinacea, Rumex dentatus, and Eleocharis dulcis. The area also features a diverse mix of hygrophytic vegetation, primarily consisting of Phalaris arundinacea, Rumex dentatus, and Eleocharis dulcis [29]. In 2020, an extreme flood event impacted the Changjiang River Basin, resulting in the largest flood since 2000. At Shengjin Lake, water levels peaked at 17.01 m on 2 August 2020, exceeding the maximum levels recorded in the summers of 2019 and 2018 by over 2 m. Due to flooding, Shengjin Lake maintained water levels above the flood warning threshold (15 m) for a sustained 60-day period (8 July–5 September) (Figure S1) (daily water level measurements at Huangpen Sluice were obtained from the Anhui real-time hydrological telemetry platform (http://yc.wswj.net/ahyc/, accessed on 22 May 2022) [30]; the platform utilized radar water level monitoring stations produced by Shandong Jingdao Optoelectronic Technology Co., Ltd., Qufu, China). At sampling time, Shengjin Lake’s mean water levels were measured at 10.46 m (March 2019) and 9.44 m (December 2020) during sampling.

2.2. Experimental Communities and Sampling

The pre-flood baseline data used for comparison were derived from our previous investigation [20], which examined vegetation-cover-mediated variations in soil nutrient dynamics and microbial community. Given the absence of significant differences in riparian wet plant coverage between 2019 and post-flood conditions [31], we conducted a follow-up sampling campaign in December 2020 to evaluate the impacts of the 2020 extreme flood event on soil functionality. Therefore, the new dataset was collected in 2020 as part of the current study, which aimed to evaluate the effect of an extreme flood in 2020 on soil functionality. To ensure comparability, the experimental design (including sampling site, sampling protocols, and analytical procedures) strictly adhered to the previously published study [18].
Four distinct plant communities were identified in the riparian zone, and corresponding soil samples were subsequently collected: (1) Bs, bare soil (no vegetation cover); (2) RCE, R. dentatus (40% cover) + C. thunbergii (20% cover) + E. dulcis (10% cover); (3) PC, P. arundinacea (45% cover) + C. thunbergii (45% cover); and (4) Ct, C. thunbergii (95% cover) (the abbreviations were created based on the first letters of the dominant plant species in each community or the characteristic of the community). Homogeneous vegetation patches along the lakeshore were randomly selected to establish 1 m × 1 m quadrats, with four replicates per community type (total 16). In all plots, surface soils (0–20 cm) were sampled from each quadrat during both sampling campaigns (March 2019 and December 2020), with sites and community characterization details provided in Zhang et al. [19]. After collection, samples were cleared of plant debris and impurities and then thoroughly homogenized. Each sample was divided into three aliquots: (i) stored at −20 °C used for physicochemical characterization, (ii) flash frozen in liquid nitrogen and stored at −80 °C for microbial profiling, and (iii) archived at −20 °C.

2.3. Soil Chemical Analyses

The soil samples were analyzed for their fundamental physicochemical properties using the standardized methods outlined by Bao [32]. Soil pH was measured (ST2100 pH meter, Ohaus, Changzhou China) in 1:2.5 soil–water suspensions. The soil water content (SWC) was calculated using the oven-drying and weighing method (Sartorius analytical balance, Model ME204, Göttingen, Germany). Soil organic carbon (SOC) was measured via dichromate oxidation (external heating) (manufactured by Ronghua Instrument Manufacturing Co., Ltd., Changzhou, China). The soil total nitrogen (TN) was measured using the Kjeldahl method (Hanon K1160 fully automatic Kjeldahl analyzer, Hanon Future Technology Group Co., Ltd., Zibo, China). The soil ammonium nitrogen (NH4+-N) and soil nitrate nitrogen (NO3-N) were quantified using potassium chloride solution extraction followed by ultraviolet spectrophotometry (Shimadzu UV-2600 UV-Visible Spectrophotometer, Shimadzu Corporation, Kyoto, Japan).
The total soil phosphorus (TP) was quantified using the molybdenum-antimony anti-spectrophotometric method (Shimadzu UV-2600 UV-Visible Spectrophotometer, Shimadzu Corporation, Kyoto, Japan). Soil available K (AK) was measured by 1 M ammonium acetate (NH4OAc, pH 7.0) extraction followed by flame photometry (Shanghai Jingke FP6400 Flame Photometer, Shanghai Precision & Scientific Instrument Co., Ltd., Shanghai, China). The available phosphorus (AP) in the soil was assayed using the sodium bicarbonate extraction method combined with the molybdenum-antimony spectrophotometric method (Shimadzu UV-2600 UV-Visible Spectrophotometer, Shimadzu Corporation, Kyoto, Japan).

2.4. Soil Enzymatic Activities Analyses

Fresh soils were sieved (0.9 mm) for enzyme activity assays. The activity of soil acid phosphatase (SAP) was assayed using the p-nitrophenyl phosphate (pNPP) colorimetric method by measuring the amount of p-nitrophenol released after incubating 1 g of fresh soil with 0.2 mL toluene, 4 mL acetate buffer (pH 5.0), and 1 mL p-nitrophenyl phosphate at 37 °C for 1 h. The reaction was stopped by adding NaOH, and absorbance was measured at 410 nm [33]. The activity of soil alkaline phosphatase (SALP) was assayed using the p-nitrophenyl phosphate (pNPP) colorimetric method by measuring the amount of p-nitrophenol released after incubating 1 g of fresh soil with 0.2 mL toluene, 4 mL boric acid buffer (pH = 9.4), and 1 mL p-nitrophenyl phosphate at 37 °C for 1 h. The reaction was stopped by adding NaOH, and absorbance was measured at 410 nm [33]. Soil urease (SU) activity was determined by measuring NH3-N release (mg g−1 soil) using phenol-hypochlorite colorimetry (625 nm) after incubation with citrate-buffered urea solution [34]. Soil protease (SP) activity was quantified by Folin-phenol colorimetry (660 nm) as mg tyrosine released g−1 soil following Tris-buffered caseinate incubation. The activity of all soil enzymes is expressed as μmol g−1 h−1 of dry soil [34]. All absorbance measurements were performed using a Shimadzu UV-2600 UV-Vis Spectrophotometer (Shimadzu Corporation, Kyoto, Japan).

2.5. DNA Extraction, Amplification, Sequencing, and Microbial Analysis

DNA was purified from 0.50 g fresh soil samples with a Fast DNA SPIN Kit for Soil (MP Biomedicals, Irvine, CA, USA). Then the extracted genomic DNA was dissolved in 100.0 μL of ddH2O to ensure uniform dispersion, and quality was assessed via NANO-100 spectrophotometry (Allsheng, Hangzhou, China). DNA suspensions were held at −20 °C before microbial analysis. The bacterial 16S rRNA V4 region was sequenced (515F/907R primers) on Illumina MiSeq (San Diego, CA, USA) [35].
Quantitative analysis of microbial ecology was carried out using Quantitative Insights Into Microbial Ecology (QIIME v.1.9.1) [36]. Reads (Q < 30, length < 250 bp) were filtered prior to community composition analysis with SILVA ribosomal RNA database version 132 (SILVA v132). All raw reads have been deposited in the NCBI Sequence Read Archive database under the accession number PRJNA1249197.

2.6. Statistical Analyses

One-way ANOVA (SPSS 20.0; FDR-adjusted) assessed differences in soil physicochemical properties (SWC, pH, SOC, TN, NH4+-N, NO3-N, AK, AP and TP), enzymatic activities (SAP, SALP, SU and SP), and microbial diversity (Bacterial Alpha diversity). Prior to ANOVA, the normality of all datasets was verified using Shapiro–Wilk tests, while homogeneity of variances was assessed with Levene’s tests. Statistical analyses were performed using R 4.0.5 (R Foundation for Statistical Computing, Vienna, Austria) and SPSS 20.0 (IBM Corp., Armonk, NY, USA). Data meeting homogeneity of variance (p > 0.05) were analyzed by ANOVA with Tukey’s post hoc test, whereas heteroscedastic data were examined using Kruskal–Wallis test with Dunn’s correction. The graphs were prepared with Origin Pro (9.9) software (2022).
Bacterial alpha diversity (ACE/Chao1/Shannon/Simpson) was calculated via the ‘vegetarian’ package in R (v4.3.0). Bacterial β-diversity was analyzed via Bray–Curtis dissimilarity and visualized via Principal Coordinate Analysis (PCoA) (‘vegan’/‘ape’ packages). Statistical significance of group clustering was tested using PERMANOVA (Adonis, 999 permutations) to assess the effect of experimental factors on microbial community structure.
Redundancy analysis (RDA) was conducted using CANOCO 5.0 (Microcomputer Power, Ithaca, NY, USA) to evaluate the relationships between soil physicochemical properties, enzyme activities, and microbial communities. Prior to RDA: Detrended Correspondence Analysis (DCA) was performed in R (vegan package) to determine whether linear (RDA) or unimodal (CCA, Canonical Correspondence Analysis) models were appropriate. The gradient length of the first DCA axis < 3.0 indicated RDA was suitable. The significance of RDA axes and explanatory variables was tested via 499 Monte Carlo permutations under a reduced model (p < 0.05). The proportion of variance explained by each significant variable was calculated, and forward selection was applied to identify the most influential factors.
The structural equation modeling (SEM) was carried out in IBM SPSS Amos, and Fisher’s C test was employed to evaluate the consistency of the hypothesized relationship structure [37]. When the p-value of Fisher’s C statistic exceeded 0.05, the data were considered consistent with the path model [38]. To comprehensively evaluate model fit, multiple goodness-of-fit indices were analyzed in conjunction with Fisher’s C test, including the following: χ2/df ratio (<3.0), comparative fit index or CFI (>0.90), root mean square error of approximation or RMSEA (<0.08). The dominant plant plays a critical role in shaping community assembly in the8 riparian zone. In this study, the coverage percentage of C. thunbergii was employed as a representative variable for vegetation communities in SEM analysis to assess the influence of vegetation communities, mediated by soil physicochemical properties and enzyme activity, on the structure of the soil bacterial community.

3. Results

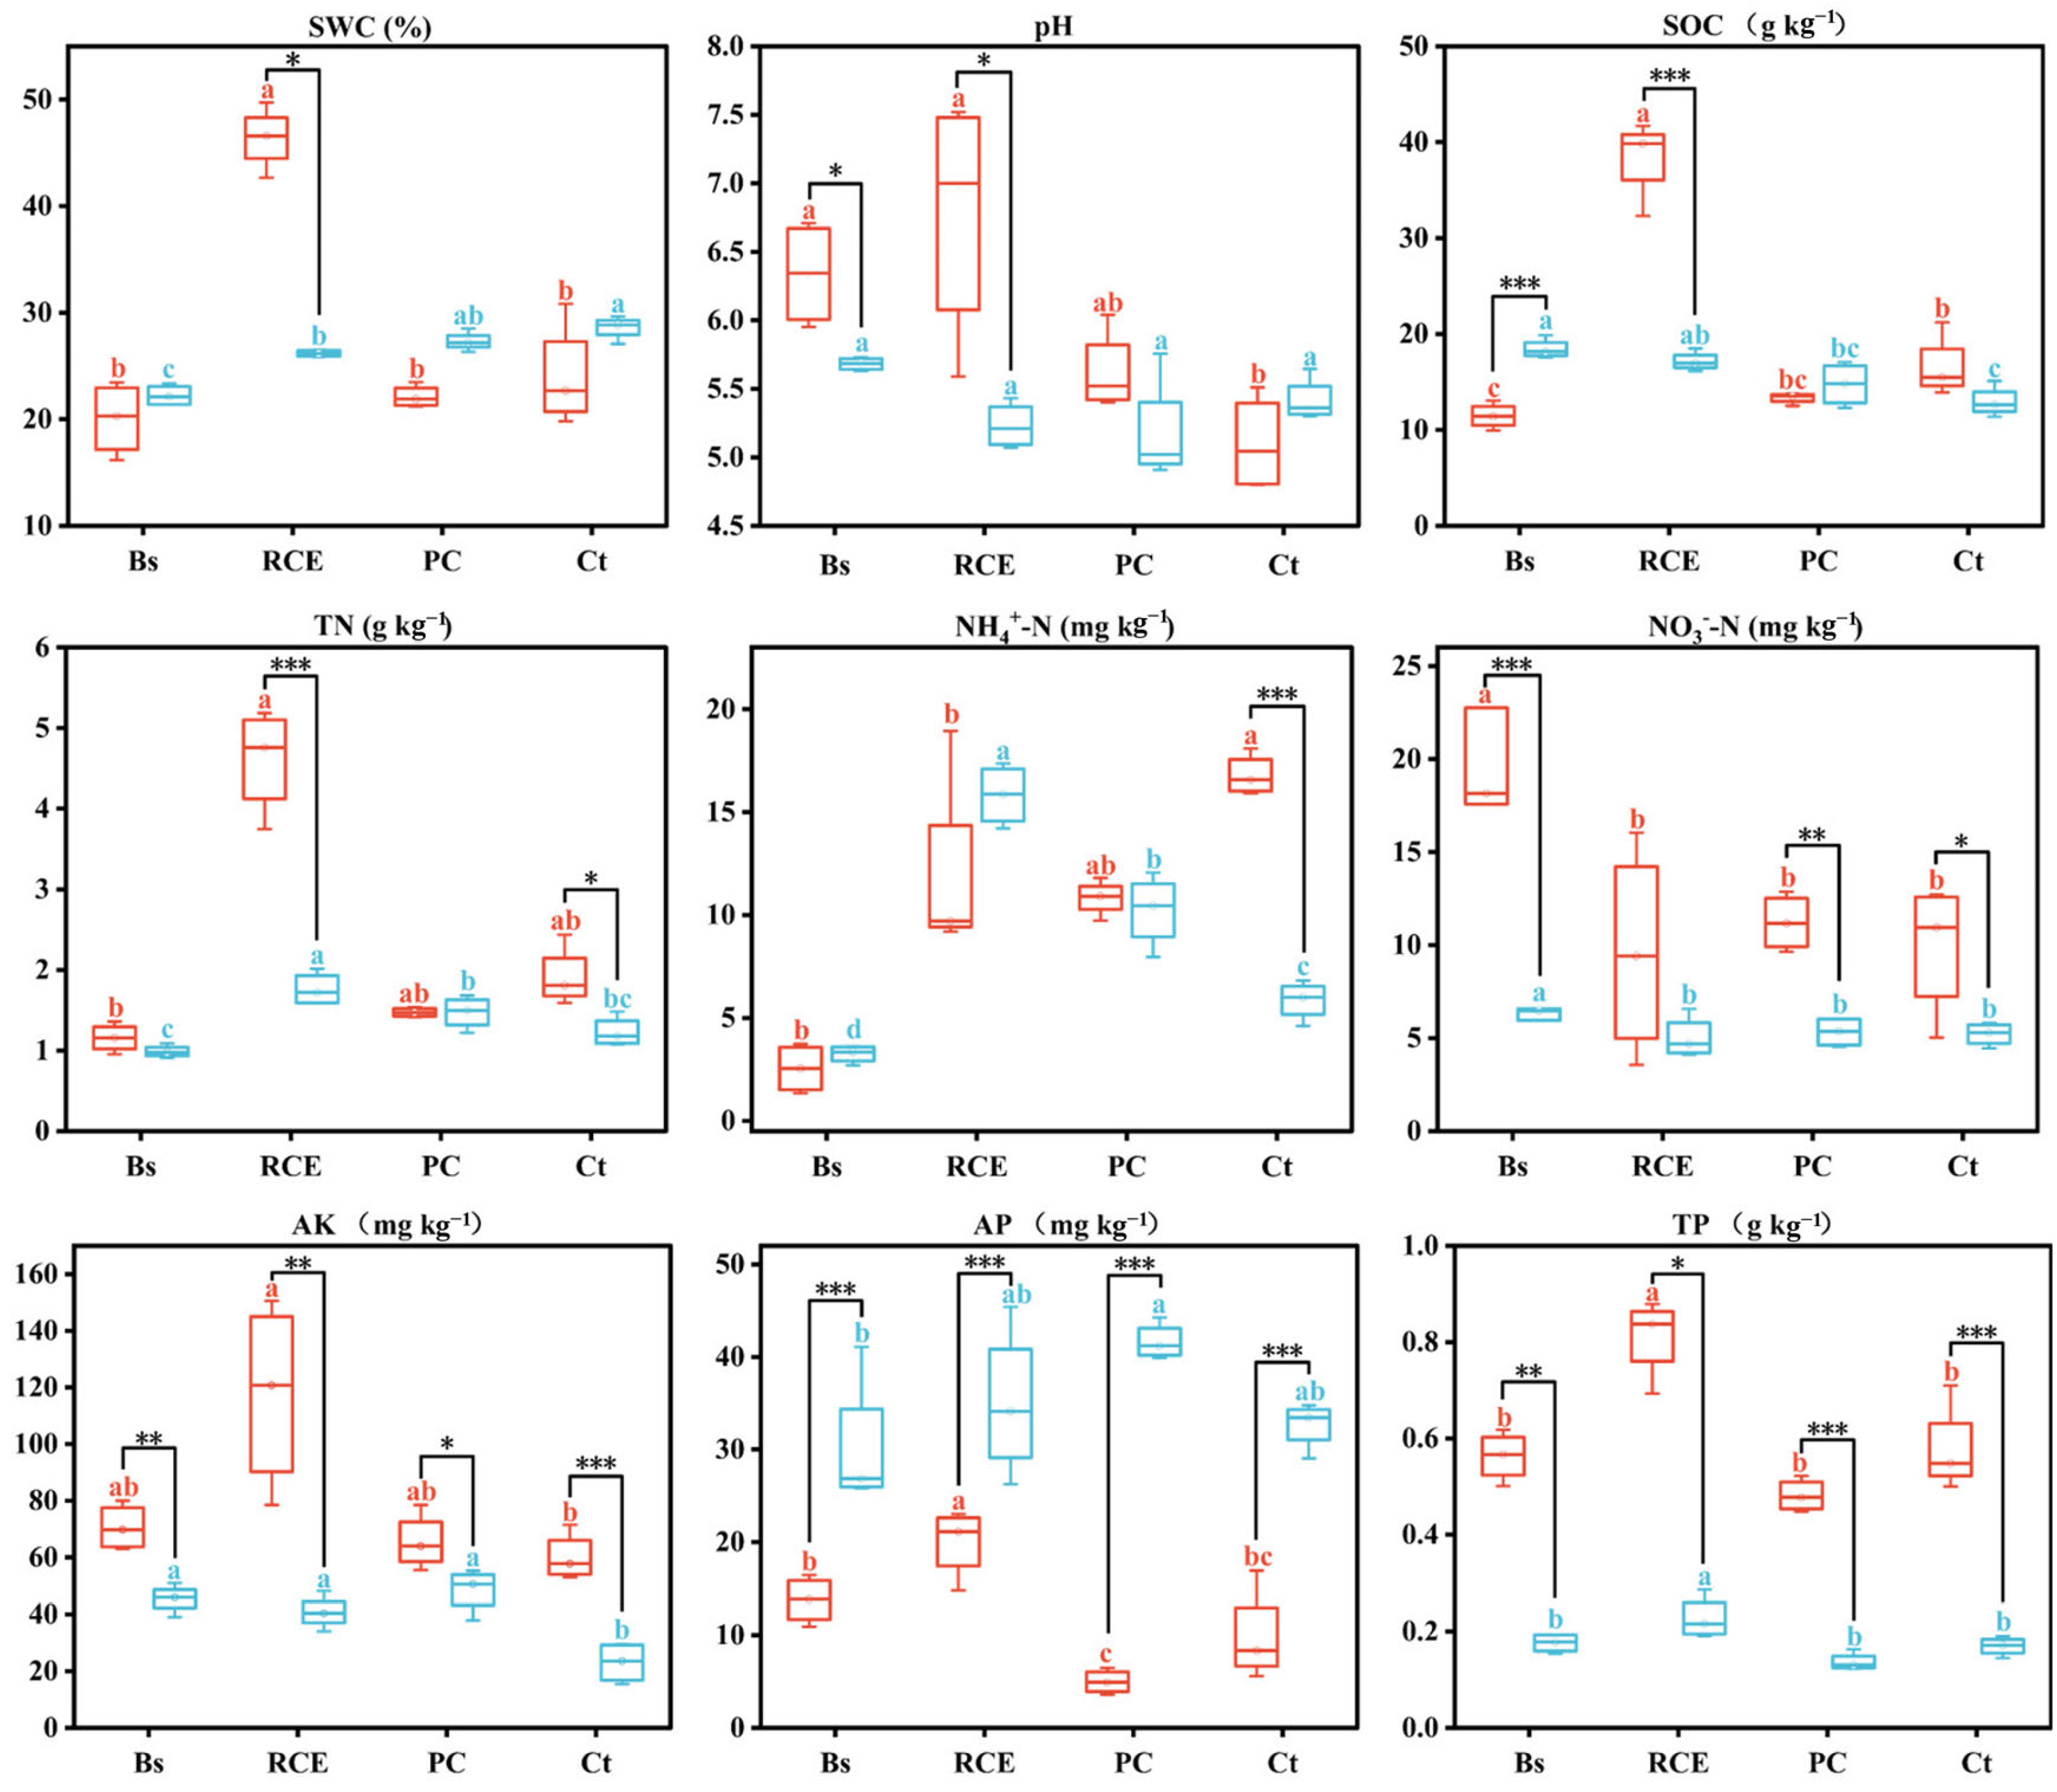
3.1. Soil Physicochemical Properties

Variations in soil physicochemical properties were observed across plant communities during both pre-flood and post-flood periods. Pre-flood SWC, SOC, AP and TP in RCE significantly exceeded Bs, PC and Ct values (p < 0.05). Additionally, the pH, TN, and AK in RCE were slightly higher than those in Bs, PC, and Ct. Among the communities, Bs had the lowest SOC, TN, and NH4⁺-N, while it had the highest NO3-N (Figure 1).
During the post-flood period, pH levels showed no significant differences among all plant communities. Bs exhibited significantly lower SWC and NH4⁺-N levels compared to RCE, PC, and Ct (p < 0.05). Additionally, NO3-N in Bs were significantly higher than those in RCE, PC, and Ct (p < 0.05). Compared to Bs, PC, and Ct systems, RCE exhibited significantly elevated TN and NH4⁺-N concentrations (p < 0.05; Figure 1).
From pre-flood to post-flood, the SWC, pH, SOC, and TN in RCE decreased significantly compared to pre-flood levels (p < 0.05). In Ct, NH4⁺-N also showed a significant decrease (p < 0.05). Across all plant communities, AP increased significantly (p < 0.05). Meanwhile, NO3-N, AK, and TP decreased, with significant reductions observed in AK and AP (p < 0.05; Figure 1).

3.2. Soil Enzyme Activities

The flood event significantly increased the activities of all four measured enzymes across vegetation types (p < 0.05; Figure 2). Among the treatments, PC showed the highest increase in enzyme activities, with values reaching 40.93 (μmol g−1 h−1) for soil acid phosphatase, 31.06 (μmol g−1 h−1) for soil urease, 2.32 (μmol g−1 h−1) for soil alkaline phosphatase, and 434.93 (μmol g−1 h−1) for soil protease (Figure 2).
The soil acid phosphatase activity of four vegetation communities increased by 24.18, 28.03, 35.76 and 28.08 (μmol g−1 h−1) (Figure 2a). Similarly, soil urease activity exhibited changes of 18.35, 21.28, 27.18 and 21.31 (μmol g−1 h−1) (Figure 2b). For soil alkaline phosphatase activity, the values rose by 256.92, 297.87, 379.93 and 298.39 (μmol g−1 h−1) (Figure 2c). Soil protease activity showed increases with values of 101.11, 117.23, 149.53, and 117.44 (μmol g−1 h−1), respectively (Figure 2d).

3.3. Soil Bacterial Community Composition

We calculated ACE and Chao1 indices to evaluate bacterial community richness (Figure 3a,b). From the pre-flood to post-flood period, the ACE and Chao1 indices decreased in Bs and RCE but increased in PC and Ct (Figure 3a,b). In our study, the Shannon and Simpson indices were used to evaluate soil bacterial community diversity. The Shannon index significantly increased in Bs and Ct after flooding (p < 0.05; Figure 3c), while the Simpson index significantly decreased in Bs and Ct (p < 0.05; Figure 3d).
To examine flood-induced changes in soil bacterial communities, we performed PCoA analyses (Figure 3e,f). In our study, significant differences were observed between plant communities before the flood (p = 0.001; Figure 3e). However, these differences were significantly reduced after the flood (p < 0.01; Figure 3f). Post-flood samples exhibited significantly reduced bacterial beta diversity compared to pre-flood conditions.
At the phylum level, Proteobacteria, Acidobacteria, Actinobacteria, and Chloroflexi persisted as the predominant bacterial taxa irrespective of hydrological regime (Figure 4). However, their relative abundance exhibited changes: Proteobacteria in Bs decreased from 29.67% to 24.55%, RCE decreased from 37.92% to 18.20%, PC decreased from 34.55% to 19.90%, and Ct decreased from 36.20% to 23.72%. Acidobacteria in Bs increased from 11.16% to 17.86%, RCE slightly increased from 15% to 15.85%, PC increased from 18.91% to 20.21%, and Ct decreased from 19.65% to 19.61%. Actinobacteria in Bs decreased from 24.57% to 10.13%, RCE increased from 8.83% to 16.03%, PC increased from 8.66% to 14.40%, and Ct increased from 10.27% to 11.19%. Chloroflexi in Bs decreased from 13.16% to 11.40%, RCE increased from 13.97% to 19.55%, PC increased from 10.98% to 13.76%, and Ct increased from 9.93% to 12.13%.

3.4. Correlations Between Soil Variables and Soil Bacterial Community Structure

The redundancy analysis (RDA) revealed that soil physicochemical factors and enzyme activity differentially influenced the bacterial community structure of distinct plant communities during pre- and post-flood periods (Figure 5). The soil variables explained 41.4% and 25.83% of the variance in bacterial community structure during pre-flood and post-flood periods, respectively (Figure 5). Based on the Monte Carlo permutation test, soil bacterial community structure across plant communities was significantly affected by all soil factors before the flood (p < 0.05; Table S1). In contrast, after the flood (2020), only SWC, SOC, NH4⁺-N, and NO3-N significantly contributed to community variation (p < 0.05; Table S1).
Structural equation modeling (SEM) was used to examine the immediate and mediated impacts of plant communities and soil factors on microbial communities during pre-flood (χ2 = 6.437, p = 0.490) and post-flood periods (χ2 = 4.592, p = 0.710; Figure 6). Under both pre-flood and post-flood conditions, the soil bacterial community structure exhibited explained variances (R²) of 62% and 74%. Pre-flood plant communities did not have a direct impact on the composition of the microbial community. However, it exerted a significant direct influence on soil pH, NH4⁺-N, and NO3-N (p < 0.001; Figure 6a). Subsequently, via soil urease as the final mediator, the plant community exerted a significantly positive effect on the microbial community (p < 0.001; Figure 6a). In contrast, plant communities exhibited an indirect negative effect on the composition of soil bacterial communities via NH4⁺-N, although this effect was not statistically significant (p > 0.05; Figure 6a). Post-flood vegetation changes exerted a significantly negative indirect effect on SOC (p < 0.001), then mediating a significantly negative impact on the composition of soil bacterial communities via TN as the ultimate mediator (p < 0.001; Figure 6b). Additionally, plant communities exhibited an indirect negative effect through pH, mediated by soil protease activity, although this effect was not statistically significant (p > 0.05, Figure 6b).

4. Discussion

4.1. Soil Physicochemical Properties

Flooding creates anaerobic conditions in the soil, which profoundly alters soil biochemical processes [21]. During flooding events, the biogeochemical cycling of nutrients and plant community structures in wetlands can be significantly disrupted, subsequently impacting the soil physicochemical properties. In this study, the extreme flood event caused marked alterations in multiple critical soil chemical properties, concurrently resulting in diminished soil fertility. TN, NO3-N, AK and TP concentrations were significantly lower post-flood compared to pre-flood levels across vegetation types. These results align with previous findings by Sánchez-Rodríguez et al. [39], which reported that flooding can lead to nutrient loss in soils, particularly reducing the availability of K. Interestingly, the increase in available P observed after the flooding event might be attributed to the enhanced release of phosphorus resulting from prolonged waterlogging [40].
In the RCE plots, pH decreased significantly, while soil water content exceeded levels observed in other plots. This pattern correlated with reductions in SOC and TN (Figure 1). This observation supports prior research indicating that low pH environments inhibit nitrification, thereby lowering soil nitrate nitrogen content [41]. This may be driven by reduced microbial activity, which hampers organic matter decomposition and accumulation [42] and inhibits nitrogen fixation and release processes [43,44]. Pre-flood analyses revealed strong positive correlations among soil pH, SMC, SOC, and TN (Table S2). The flood event altered soil nutrient relationships, resulting in significant negative correlations between SMC and SOC (p < 0.01), as well as between soil pH and TN (p < 0.05). This may also be related to the aforementioned reasons (Table S3). This study supports previous evidence that the stoichiometric relationships among soil C, N and P are consistently decoupled by flooding events [45].

4.2. Soil Enzyme Activities

Soil enzyme activities exhibit high sensitivity to environmental perturbations in soil processes driven by hydrological changes [46]. Our findings reveal a marked increase in enzyme activity after the flooding event (Figure 2), which diverges from the findings observed in agricultural fields [47]. As soil urease activity was limited by high TN levels, a reduction in TN levels likely enhanced soil urease activity [48]. Soil protease activity was influenced by moisture content and organic matter content [46]. Increased moisture and organic matter content can provide substrates for enzymatic reactions, leading to the enhancement of soil protease activity. A decrease in pH promoted mechanisms such as enhanced microbial activity, altered chemical forms of phosphorus, and modified phosphorus cycling [49], ultimately increasing soil phosphatase activity. Furthermore, studies have demonstrated a positive correlation between soil available phosphorus (AP) levels and soil phosphatase activity [50]. In this study, significant increases in AP levels post-flooding further elevated phosphatase activity (Figure 1 and Figure 2a,c). Beyond these factors, the significant elevation in soil enzyme activity may result from increased microbial diversity and abundance [51].

4.3. Soil Bacterial Community Composition

Flooding modulated oxygen and nutrient availability, thereby inducing structural reorganization and functional modulation within the soil bacterial community. Although flooding minimally affects soil bacterial richness estimates (ACE/Chao1), it significantly alters bacterial diversity metrics (Shannon/Simpson). The bacterial diversity indices of RCE and PC after flooding did not significantly differ from pre-flooded levels. The Shannon and Simpson diversity of Bs and Ct appear susceptible to flooding, likely due to their relatively simple community structures. This supports the earlier hypothesis that enhanced soil biodiversity in plant-diverse systems expands functional response diversity to environmental changes, thereby stabilizing microbial community dynamics [52]. Post-flood analyses revealed significant differences in bacterial richness estimators among various vegetation communities, a phenomenon that was not observed prior to flooding. This may be attributed to a slight, non-significant, decrease in bacterial richness estimators in Bs. Some bacterial species in bare soil may have been washed away due to flooding, while the presence of plants prevented this loss.
Additionally, principal coordinate analysis (PCoA) revealed statistically significant divergence in soil bacterial community composition across sample groups, except for Ct and PC, prior to the flooding event (Figure 3e). Furthermore, after the flooding event, statistical analyses revealed no significant differences in soil bacterial community structure across all sample groups (Figure 3f). A potential explanation is that flooding facilitates bacterial dispersal, enabling continuous microbial influx from upstream across sampling sites, thereby driving homogenization of bacterial community structures [53].
Differences in bacterial structure may also be indirectly influenced by soil properties [54], ultimately resulting in flood-induced spatial heterogeneity in soil bacterial communities. This study demonstrates no significant shifts in the relative abundance of dominant bacterial phyla following flood events (Figure 4). The dominant bacterial phyla before and after the flood were Proteobacteria, Acidobacteria, Actinobacteria, and Chloroflexi. These findings underscore the high adaptive capacity of soil bacterial communities, highlighting their crucial functional roles in wetland ecosystem resilience. Parallel results have been documented in other wetland ecosystems [55,56]. Multiple studies have substantiated that soil physicochemical properties serve as key determinants of microbial community composition. It is noteworthy that, although there was no change in the dominant populations at the bacterial phylum level, the association between soil bacterial assemblages and physicochemical characteristics was modified by the flooding disturbance. (Figure S2).

4.4. Pathways of the Effects of Vegetation Communities and Soil Factors on Composition of Soil Bacterial Communities

This study demonstrated that flooding induced significant alterations in key soil properties across diverse vegetation communities, consequently modulating soil bacterial assemblages. To investigate the complex network of simultaneous influences, a SEM was developed. Comparative analysis of pre- and post-flooding periods revealed distinct soil-mediated pathways through which vegetation communities regulate microbial composition (Figure 6). Prior to flooding, plant communities significantly influenced soil bacterial community structure via soil pH, SOC, NO3-N and SU. These findings align with the established literature identifying soil pH and SOC as critical drivers of bacterial community organization [57,58]. Vegetation-mediated enhancement of bacterial diversity likely stems from improved edaphic conditions, particularly SOC accumulation and pH stabilization, consistent with classical plant–soil positive feedback mechanisms [59]. Notably, post-flood SEM analysis revealed that TN, replacing SU, exerted substantial negative regulation on bacterial communities (Figure 6b). These results suggest that flooding-induced nitrogen limitation drives a functional transition in plant–microbe interactions, shifting from rhizosphere-mediated cooperative urea hydrolysis to competitive exploitation of bioavailable nitrogen [60]. Furthermore, post-flood vegetation-mediated declines in SOC, NO3-N, and pH may be attributed to intensified below-ground microbial competition. This competition may involve shifts in root exudate profiles, such as elevated phenolic compounds, which suppress nitrification and alter microbial activity [61]. It is generally believed that enhanced soil moisture following flooding can promote pathogen proliferation, potentially amplifying synergistic effects on negative plant–soil feedback [62]. These results underscore the profound impact of flooding on the mechanisms of plant–microbe interactions, as evidenced by marked shifts in vegetation-mediated regulatory pathways governing soil microbial communities between pre- and post-flood conditions. Given the pivotal role of plant–soil feedback in sculpturing plant community dynamics and ecosystem function [63], future research should prioritize understanding the continuous reciprocal feedback between flooding, vegetation, and soil systems.

5. Conclusions

The ecological consequences of extreme flooding on wetland soil ecosystems were demonstrated in this study. The flood event significantly altered key soil properties by introducing external substances and inducing pH fluctuations, which subsequently modulated the dissolution and adsorption–desorption dynamics of soil mineral constituents. Additionally, flooding substantially elevated key soil enzyme activities: urease activity increased due to nitrogen limitation from reduced TN; protease activity rose in response to concurrent increases in SWC and SOC; and phosphatase activity was promoted by decreased soil pH. Although the flooding event did not modify the dominant phyla-level bacterial taxa across various vegetation communities, it substantially diminished the community structure divergence among soil bacterial assemblages. Following the flooding event, TN emerged as a direct regulatory factor mediating the impact of vegetation communities on bacterial community composition, supplanting the previous role of soil urease activity. Overall, the soil hydrology controlled by flooding might be the most important influencing factor in wetland ecosystems. Further investigations are needed to unravel the continuous and reciprocal feedback mechanisms among flooding, vegetation, and soil systems. And the current study focuses on a single flood event, limiting the ability to generalize responses to floods with varying magnitudes or frequencies. Only select soil properties and microbial metrics were analyzed, and broader biogeochemical parameters (e.g., heavy metals, dissolved organic matter) were not investigated.

Supplementary Materials

The following supporting information can be downloaded at: https://www.mdpi.com/article/10.3390/w17121789/s1, Figure S1: Water level information map of Shengjin Lake from 2017 to 2020; Figure S2: Results of correlation analysis of the soil physicochemical properties and dominant bacterial populations (phylum level).; Table S1: RDA results of soil physicochemical properties and soil enzyme activity under bacterial community (OTU level) pre-flooding and post-flooding; Table S2: Results of correlation analysis of soil physicochemical properties and soil enzyme activity in the pre-flooding; Table S3: Results of correlation analysis of the soil physicochemical properties and soil enzyme activity in the post-flooding.

Author Contributions

X.D.: Conceptualization, investigation, formal analysis, writing—original draft, W.X.: conceptualization, investigation, Y.R.: investigation, N.Z.: investigation, X.Z.: investigation, X.Y.: funding acquisition, conceptualization, investigation, resources, project administration, writing-review and editing. All authors have read and agreed to the published version of the manuscript.

Funding

The research was supported by the Natural Science Project of Anhui Provincial Department of Education-Key project (KJ2020A0045) and the 2018 National Natural Science Foundation of China (K110139002).

Data Availability Statement

The raw data supporting the conclusions of this article will be made available by the authors on request.

Acknowledgments

We thank the Shengjin Lake Wetland Ecosystem Research Station (Anhui University) for field assistance.

Conflicts of Interest

The authors declare no conflicts of interest.

References

  1. Sunil, C.; Somashekar, R.K.; Nagaraja, B.C. Riparian vegetation assessment of Cauvery River Basin of South India. Environ. Monit. Assess. 2010, 170, 545–553. [Google Scholar] [CrossRef] [PubMed]
  2. Prado, R.B.; Damasceno, G.M.S.; Aquino, F.G.A. Overview of studies on ecosystem services in riparian zones: A systematic review. Acta Limnol. Bras. 2022, 34, e19. [Google Scholar] [CrossRef]
  3. Xu, L.; Hu, Q.; Liu, Z.; Jian, M.; Peng, Y.; Shen, R.; Liao, W.; Zhong, A. Hydrological alteration drives chemistry of dissolved organic matter in the largest freshwater lake of China (Poyang Lake). Water Res. 2024, 251, 121154. [Google Scholar] [CrossRef] [PubMed]
  4. Fu, B.; Li, Y.; Wang, Y.; Zhang, B.; Yin, S.; Zhu, H.; Xing, Z. Evaluation of ecosystem service value of riparian zone using land use data from 1986 to 2012. Ecol. Indic. 2016, 69, 873–881. [Google Scholar] [CrossRef]
  5. Belmar, O.; Bruno, D.; Martínez-Capel, F.; Barquín, J.; Velasco, J. Effects of flow regime alteration on fluvial habitats and riparian quality in a semiarid Mediterranean basin. Ecol. Indic. 2013, 30, 52–64. [Google Scholar] [CrossRef]
  6. Sendek, A.; Kretz, L.; van der Plas, F.; Seele-Dilbat, C.; Schulz-Zunkel, C.; Vieweg, M.; Bondar-Kunze, E.; Weigelt, A.; Wirth, C. Topographical factors related to flooding frequency promote ecosystem multifunctionality of riparian floodplains. Ecol. Indic. 2021, 132, 108312. [Google Scholar] [CrossRef]
  7. Tockner, K.; Stanford, J.A. Riverine flood plains: Present state and future trends. Environ. Conserv. 2002, 29, 308–330. [Google Scholar] [CrossRef]
  8. Riis, T.; Kelly-Quinn, M.; Aguiar, F.C.; Manolaki, P.; Bruno, D.; Bejarano, M.D.; Clerici, N.; Fernandes, M.R.; Franco, J.C.; Pettit, N.; et al. Global overview of ecosystem services provided by riparian vegetation. BioScience 2020, 70, 501–514. [Google Scholar] [CrossRef]
  9. Tahsin, S.; Medeiros, S.C.; Singh, A. Assessing the resilience of coastal wetlands to extreme hydrologic events using vegetation indices: A review. Remote Sens. 2018, 10, 1390. [Google Scholar] [CrossRef]
  10. Garssen, A.G.; Baattrup-Pedersen, A.; Voesenek, L.A.C.J.; Verhoeven, J.T.A.; Soons, M.B. Riparian plant community responses to increased flooding: A meta-analysis. Glob. Change Biol. 2015, 21, 2881–2890. [Google Scholar] [CrossRef]
  11. Ou, Y.; Rousseau, A.N.; Wang, L.; Yan, B.; Gumiere, T.; Zhu, H. Identification of the alteration of riparian wetland on soil properties, enzyme activities and microbial communities following extreme flooding. Geoderma 2019, 337, 825–833. [Google Scholar] [CrossRef]
  12. Garssen, A.G.; Baattrup-Pedersen, A.; Riis, T.; Raven, B.M.; Hoffman, C.C.; Verhoeven, J.T.A.; Soons, M.B. Effects of increased flooding on riparian vegetation: Field experiments simulating climate change along five European lowland streams. Glob. Change Biol. 2017, 23, 3052–3063. [Google Scholar] [CrossRef] [PubMed]
  13. Osunkoya, O.O.; Ali, S.; Nguyen, T.; Perrett, C.; Shabbir, A.; Navie, S.; Belgeri, A.; Dhileepan, K.; Adkins, S. Soil seed bank dynamics in response to an extreme flood event in a riparian habitat. Ecol. Res. 2014, 29, 1115–1129. [Google Scholar] [CrossRef]
  14. Thoms, M.C. Floodplain–river ecosystems: Lateral connections and the implications of human interference. Geomorphology 2003, 56, 335–349. [Google Scholar] [CrossRef]
  15. Zuijdgeest, A.L.; Zurbrügg, R.; Blank, N.; Fulcri, R.; Senn, D.B.; Wehrli, B. Seasonal dynamics of carbon and nutrients from two contrasting tropical floodplain systems in the Zambezi River basin. Biogeosciences 2015, 12, 7535–7555. [Google Scholar] [CrossRef]
  16. Bai, J.; Yu, L.; Du, S.; Wei, Z.; Liu, Y.; Zhang, L.; Zhang, G.; Wang, X. Effects of flooding frequencies on soil carbon and nitrogen stocks in river marginal wetlands in a ten-year period. J. Environ. Manag. 2020, 267, 110618. [Google Scholar] [CrossRef]
  17. Ye, F.; Ma, M.H.; Wu, S.J.; Jiang, Y.; Zhu, G.B.; Zhang, H.; Wang, Y. Soil properties and distribution in the riparian zone: The effects of fluctuations in water and anthropogenic disturbances. Eur. J. Soil Sci. 2019, 70, 664–673. [Google Scholar] [CrossRef]
  18. Zhang, M.; O’Connor, P.J.; Zhang, J.; Ye, X. Linking soil nutrient cycling and microbial community with vegetation cover in riparian zone. Geoderma 2021, 384, 114801. [Google Scholar] [CrossRef]
  19. Patel, K.F.; Fansler, S.J.; Campbell, T.P.; Bond-Lamberty, B.; Smith, A.P.; RoyChowdhury, T.; McCue, L.A.; Varga, T.; Bailey, V.L. Soil texture and environmental conditions influence the biogeochemical responses of soils to drought and flooding. Commun. Earth Environ. 2021, 2, 127. [Google Scholar] [CrossRef]
  20. Unger, I.M.; Motavalli, P.P.; Muzika, R.-M. Changes in soil chemical properties with flooding: A field laboratory approach. Agric. Ecosyst. Environ. 2009, 131, 105–110. [Google Scholar] [CrossRef]
  21. Gutknecht, J.L.M.; Goodman, R.M.; Balser, T.C. Linking soil process and microbial ecology in freshwater wetland ecosystems. Plant Soil 2006, 289, 17–34. [Google Scholar] [CrossRef]
  22. Ren, C.J.; Zhang, W.; Zhong, Z.K.; Han, X.; Yang, G.; Feng, Y.; Ren, G. Differential responses of soil microbial biomass, diversity, and compositions to elevation gradient depend on plant and soil characteristics. Sci. Total Environ. 2018, 610, 750–758. [Google Scholar] [CrossRef] [PubMed]
  23. Yin, S.; Bai, J.; Wang, W.; Zhang, G.; Jia, J.; Cui, B.; Liu, X. Effects of soil moisture on carbon mineralization in floodplain wetlands with different flooding frequencies. J. Hydrol. 2019, 574, 1074–1084. [Google Scholar] [CrossRef]
  24. Lan, Z.; Chen, Y.; Shen, R.; Cai, Y.; Luo, H.; Jin, B.; Chen, J. Effects of flooding duration on wetland plant biomass: The importance of soil nutrients and season. Freshw. Biol. 2020, 66, 211–222. [Google Scholar] [CrossRef]
  25. Taylor, J.P.; Wester, D.B.; Smith, L.M. Soil disturbance, flood management, and riparian woody plant establishment in the Rio Grande floodplain. Wetlands 1999, 19, 372–382. [Google Scholar] [CrossRef]
  26. Unger, I.M.; Kennedy, A.C.; Muzika, R.-M. Flooding effects on soil microbial communities. Appl. Soil Ecol. 2009, 42, 1–8. [Google Scholar] [CrossRef]
  27. Fox, A.D.; Cao, L.; Zhang, Y.; Barter, M.; Zhao, M.; Meng, F.; Wang, S. Declines in the tuber-feeding waterbird guild at Shengjin Lake National Nature Reserve, China—A barometer of submerged macrophyte collapse. Aquat. Conserv. Mar. Freshw. Ecosyst. 2011, 21, 82–91. [Google Scholar] [CrossRef]
  28. Soil Survey Staff. Keys to Soil Taxonomy, 12th ed.; United States Department of Agriculture, Natural Resources Conservation Service: Washington, DC, USA, 2014. [Google Scholar]
  29. Xu, W.; Wang, X.; Ren, Y.; Ye, X. Change in the Ecological Stoichiometry of Carex thunbergii in Response to Seasonal Dynamics and Environmental Factors in Shengjin Lake, China. Diversity 2024, 16, 198. [Google Scholar] [CrossRef]
  30. Anhui Provincial Department of Water Resources. 22 May 2022. Available online: http://yc.wswj.net/ahyc/ (accessed on 22 May 2022).
  31. Guo, W.; Zhou, Z.; Chen, J.; Zheng, X.; Ye, X. Effects of extreme flooding on aquatic vegetation cover in Shengjin Lake, China. Hydrol. Process. 2022, 36, e14459. [Google Scholar] [CrossRef]
  32. Bao, S. Soil and Agrochemical Analysis, 3rd ed.; China Agricultural Press: Beijing, China, 2000. [Google Scholar]
  33. Dick, R.P. Methods of Soil Enzymology; Soil Science Society of America: Madison, WI, USA, 2011; p. 95. [Google Scholar] [CrossRef]
  34. Guan, S.Y. Soil Enzyme and Its Analysis Method; Agriculture Press: Beijing, China, 1986. [Google Scholar]
  35. Xu, N.; Tan, G.; Wang, H.; Gai, X. Effect of biochar additions to soil on nitrogen leaching, microbial biomass and bacterial community structure. Eur. J. Soil Biol. 2016, 74, 1–8. [Google Scholar] [CrossRef]
  36. Caporaso, J.G.; Kuczynski, J.; Stombaugh, J.; Bittinger, K.; Bushman, F.D.; Costello, E.K.; Fierer, N.; Gonzalez Peña, A.; Goodrich, J.K.; Gordon, J.I.; et al. QIIME allows analysis of high-throughput community sequencing data. Nat. Methods 2010, 7, 335–336. [Google Scholar] [CrossRef] [PubMed]
  37. Lefcheck, J.S.; Freckleton, R. piecewiseSEM: Piecewise structural equation modelling in R for ecology, evolution, and systematics. Methods Ecol. Evol. 2015, 7, 573–579. [Google Scholar] [CrossRef]
  38. Shipley, B. Confirmatory path analysis in a generalized multilevel context. Ecology 2009, 90, 363–368. [Google Scholar] [CrossRef] [PubMed]
  39. Sánchez-Rodríguez, A.R.; Hill, P.W.; Chadwick, D.R.; Jones, D.L. Typology of extreme flood event leads to differential impacts on soil functioning. Soil Biol. Biochem. 2019, 129, 153–168. [Google Scholar] [CrossRef]
  40. Eltohamy, K.M.; Menezes-Blackburn, D.; Klumpp, E.; Liu, C.; Jin, J.; Xing, C.; Lu, Y.; Liang, X. Microbially induced soil colloidal phosphorus mobilization under anoxic conditions. Environ. Sci. Technol. 2024, 58, 7554–7566. [Google Scholar] [CrossRef]
  41. Wu, G.; Liang, F.; Wu, Q.; Feng, X.-G.; Shang, W.-D.; Li, H.-W.; Li, X.-X.; Che, Z.; Dong, Z.-R.; Song, H. Soil pH differently affects N2O emissions from soils amended with chemical fertilizer and manure by modifying nitrification and denitrification in wheat-maize rotation system. Biol. Fertil. Soils 2024, 60, 101–113. [Google Scholar] [CrossRef]
  42. Malik, A.A.; Puissant, J.; Buckeridge, K.M.; Goodall, T.; Jehmlich, N.; Chowdhury, S.; Gweon, H.S.; Peyton, J.M.; Mason, K.E.; van Agtmaal, M.; et al. Land use driven change in soil pH affects microbial carbon cycling processes. Nat. Commun. 2018, 9, 3591. [Google Scholar] [CrossRef]
  43. Jiru, E.B.; Wegari, H.T. Soil and water conservation practice effects on soil physicochemical properties and crop yield in Ethiopia: Review and synthesis. Ecol. Process. 2022, 11, 21. [Google Scholar] [CrossRef]
  44. Qiu, Y.; Zhang, Y.; Zhang, K.; Xu, X.; Zhao, Y.; Bai, T.; Zhao, Y.; Wang, H.; Sheng, X.; Bloszies, S.; et al. Intermediate soil acidification induces highest nitrous oxide emissions. Nat. Commun. 2024, 15, 2695. [Google Scholar] [CrossRef]
  45. Bao, B.; Chang, M.; Jin, S.; Li, X.; Xie, H. Periodic flooding decoupled the relations of soil C, N, P, and K ecological stoichiometry in a coastal shelterbelt forest of eastern China. Forests 2023, 14, 2270. [Google Scholar] [CrossRef]
  46. Zuccarini, P.; Sardans, J.; Asensio, L.; Peñuelas, J. Altered activities of extracellular soil enzymes by the interacting global environmental changes. Glob. Change Biol. 2023, 29, 2067–2091. [Google Scholar] [CrossRef] [PubMed]
  47. He, L.; Lu, S.; Wang, C.; Mu, J.; Zhang, Y.; Wang, X. Changes in soil organic carbon fractions and enzyme activities in response to tillage practices in the Loess Plateau of China. Soil Tillage Res. 2021, 209, 104940. [Google Scholar] [CrossRef]
  48. Zhu, Q.; Liu, L.; Liu, J.; Wan, Y.; Yang, R.; Mou, J.; He, Q.; Tang, S.; Dan, X.; Wu, Y.; et al. Land use change from natural tropical forests to managed ecosystems reduces gross nitrogen production rates and increases the soil microbial nitrogen limitation. Environ. Sci. Technol. 2024, 58, 2786–2797. [Google Scholar] [CrossRef] [PubMed]
  49. Qu, X.; Liao, Y.; Pan, C.; Li, X. Positive effects of intercropping on soil phosphatase activity depend on the application scenario: A meta-analysis. Soil Tillage Res. 2024, 235, 105914. [Google Scholar] [CrossRef]
  50. Li, Y.; Li, Z.; Gong, P.; He, X.; Liu, H.; Li, L.; Wang, C.; Li, P.; Wei, J.; Yu, X. Enhanced irrigation volume reduces salinity and improves deep root zone soil nutrients, phosphatase activity and changes root traits of fruit trees. Agric. Water Manag. 2024, 302, 109001. [Google Scholar] [CrossRef]
  51. Zhao, Y.; Liu, C.; Kang, E.; Li, X.; Deng, Y.; Feng, X. Plant–microbe interactions underpin contrasting enzymatic responses to wetland drainage. Nat. Clim. Change 2024, 14, 1078–1086. [Google Scholar] [CrossRef]
  52. Eisenhauer, N.; Dobies, T.; Cesarz, S.; Hobbie, S.E.; Meyer, R.J.; Worm, K.; Reich, P.B. Plant diversity effects on soil food webs are stronger than those of elevated CO₂ and N deposition in a long-term grassland experiment. Proc. Natl. Acad. Sci. USA 2013, 110, 6889–6894. [Google Scholar] [CrossRef]
  53. Doering, M.; Freimann, R.; Antenen, N.; Roschi, A.; Robinson, C.T.; Rezzonico, F.; Smits, T.H.; Tonolla, D. Microbial communities in floodplain ecosystems in relation to altered flow regimes and experimental flooding. Sci. Total Environ. 2021, 788, 147497. [Google Scholar] [CrossRef]
  54. Philippot, L.; Chenu, C.; Kappler, A.; Rillig, M.C.; Fierer, N. The interplay between microbial communities and soil properties. Nat. Rev. Microbiol. 2024, 22, 226–239. [Google Scholar] [CrossRef]
  55. He, H.; Miao, Y.; Gan, Y.; Wei, S.; Tan, S.; Rask, K.A.; Wang, L.; Dai, J.; Chen, W.; Ekelund, F. Soil bacterial community response to long-term land use conversion in Yellow River Delta. Appl. Soil Ecol. 2020, 156, 103709. [Google Scholar] [CrossRef]
  56. Liu, L.; Wu, Y.; Yin, M.; Ma, X.; Yu, X.; Guo, X.; Du, N.; Eller, F.; Guo, W. Soil salinity, not plant genotype or geographical distance, shapes soil microbial community of a reed wetland at a fine scale in the Yellow River Delta. Sci. Total Environ. 2023, 856, 159136. [Google Scholar] [CrossRef] [PubMed]
  57. Fu, Q.; Abadie, M.; Blaud, A.; Carswell, A.; Misselbrook, T.H.; Clark, I.M.; Hirsch, P.R. Effects of urease and nitrification inhibitors on soil N, nitrifier abundance and activity in a sandy loam soil. Biol. Fertil. Soils 2020, 56, 185–194. [Google Scholar] [CrossRef] [PubMed]
  58. Chen, Y.; Jiang, Z.; Ou, J.; Liu, F.; Cai, G.; Tan, K.; Wang, X. Nitrogen substitution practice improves soil quality of red soil (Ultisols) in South China by affecting soil properties and microbial community composition. Soil Tillage Res. 2024, 240, 106089. [Google Scholar] [CrossRef]
  59. van der Putten, W.H.; Bardgett, R.D.; Bever, J.D.; Bezemer, T.M.; Casper, B.B.; Fukami, T.; Kardol, P.; Klironomos, J.N.; Kulmatiski, A.; Schweitzer, J.A.; et al. Plant–soil feedback: The past, the present and future challenges. J. Ecol. 2013, 101, 265–276. [Google Scholar] [CrossRef]
  60. Kuzyakov, Y.; Xu, X. Competition between roots and microorganisms for nitrogen: Mechanisms and ecological relevance. New Phytol. 2013, 198, 656–669. [Google Scholar] [CrossRef]
  61. Coskun, D.; Britto, D.T.; Shi, W.; Kronzucker, H.J. Nitrogen transformations in modern agriculture and the role of biological nitrification inhibition. Nat. Plants 2017, 3, 17074. [Google Scholar] [CrossRef]
  62. Martínez-Arias, C.; Witzell, J.; Solla, A.; Martin, J.A.; Rodríguez-Calcerrada, J. Beneficial and pathogenic plant–microbe interactions during flooding stress. Plant Cell Environ. 2022, 45, 2875–2897. [Google Scholar] [CrossRef]
  63. Crawford, K.M.; Bauer, J.T.; Comita, L.S.; Eppinga, M.B.; Johnson, D.J.; Mangan, S.A.; Queenborough, S.A.; Strand, A.E.; Suding, K.N.; Umbanhowar, J.; et al. When and where plant–soil feedback may promote plant coexistence: A meta-analysis. Ecol. Lett. 2019, 22, 1274–1284. [Google Scholar] [CrossRef]
Figure 1. Soil physicochemical properties of different vegetation communities (pre- vs. post-flooding). n = 4: Results are based on 4 replicates (4 independent soil samples per vegetation community per time point. Bs, bare soil; RCE, 20% C. thunbergii + 10% E. dulcis + 40% R. dentatus cover; PC, 45% C. thunbergii + 45% P. arundinacea cover; and Ct, 95% C. thunbergii cover. Error bars: SD of means. Lowercase letters (a, b, c): significant differences between communities (p < 0.05; red = pre-flood, blue = post-flood). The asterisks (*) indicate significant differences in plant communities between pre- and post-flood periods: * p < 0.05, ** p < 0.01, *** p < 0.001.
Water 17 01789 g001
Figure 2. Soil enzyme activity of different vegetation communities (pre- vs. post-flooding). n = 4: Results are based on 4 replicates (4 independent soil samples per vegetation community per time point. Lowercase letters (a, b): significant differences between communities (p < 0.05). (a) acid phosphatase, (b) urease, (c) alkaline phosphatase, (d) protease. Error bars: SD of means. Within-color letters denote significant differences among communities (p < 0.05). The asterisks (*) indicate significant differences in plant communities between pre- and post-flood periods (* p < 0.05, *** p < 0.001, **** p < 0.0001).
Water 17 01789 g002
Figure 3. Soil bacterial diversity indicators of different vegetation communities (pre- vs. post-flooding). Alpha diversity including (a) ACE, (b) Chao 1, (c) Shannon, and (d) Simpson index. Values are mean ± SD (n = 4). Lowercase letters (a, b): significant differences between communities (p < 0.05; red = pre-flood, blue = post-flood). The asterisks (*) indicate inter-period differences for each community (** p < 0.01). PCoA (Bray–Curtis) showing bacterial operational taxonomic unit (OUT) distribution under different treatments: (e) pre-flooding, post-flooding (f). Panel e: PCo1 (explaining 44.22% of variance) and PCo2 (27.23% of variance) for pre-flood samples; Panel f: PCo1 (32.44% of variance) and PCo2 (16.56% of variance) for post-flood samples.
Water 17 01789 g003
Figure 4. Relative abundance of major phyla of soil bacteria: (a) pre-flooding, (b) post-flooding.
Water 17 01789 g004
Figure 5. Redundancy analysis (RDA) of soil bacterial communities (OTU level) and soil factors: (a) pre-flooding, (b) post-flooding. Soil physicochemical factors and soil enzyme activity are represented by black and red arrows, respectively (length = level).
Water 17 01789 g005
Figure 6. Structural equation models (SEM) revealed the effects of vegetation communities on soil bacterial community composition via altering soil properties: (a) pre-flooding, (b) post-flooding. Arrow color coding: blue = positive, red = negative; Line type: dashed = non-significant, solid = significant (significance levels: * p < 0.05; *** p < 0.001). R² values presented with response variables reflect the percentage of observed variability captured by the statistical model. Arrow labels show normalized path coefficient values.
Water 17 01789 g006
Disclaimer/Publisher’s Note: The statements, opinions and data contained in all publications are solely those of the individual author(s) and contributor(s) and not of MDPI and/or the editor(s). MDPI and/or the editor(s) disclaim responsibility for any injury to people or property resulting from any ideas, methods, instructions or products referred to in the content.

