1. Introduction
Global energy restructuring continues to transform supply systems. Environmental requirements are increasingly stringent. Liquefied natural gas (LNG) serves as a clean energy source. It is characterized by efficiency, environmental friendliness, and safety. LNG occupies a significant position in China’s energy supply [
1,
2]. LNG terminal construction and operation are developing rapidly in China. This development imposes higher demands on core equipment performance. LNG pump systems are particularly critical. These systems handle LNG storage, transportation, and pressurization. They must withstand harsh cryogenic fluid delivery conditions. Long-term stable operation is essential. Efficient performance must be maintained across load conditions. This includes both high-load and low-flow operation [
3,
4].
During LNG pump operation, complex unsteady 3D flows occur. Rotor–stator coupling effects exist among components. These components include inducers, impellers, and guide vanes. Such interactions frequently generate pressure pulsations. Local vortex structures also develop. Consequently, operational stability and service life may be compromised [
5]. Addressing these challenges, domestic researchers have made notable contributions. For instance, BI Xiaoxing et al. [
3] proposed optimization strategies for energy consumption reduction and operational stability in pump systems at LNG receiving terminals. Han Chuanjun et al. [
4] investigated the influence of impeller-guide vane width matching on pressure pulsations, revealing that rational structural parameter design effectively suppresses local vibrations and flow field non-uniformity. Peng Chao et al. [
5] introduced improvements for flow distribution and system stability during multi-pump parallel operation based on field data, offering robust support for practical engineering. For LNG ship pump towers, Luo Qiuming et al. [
6] developed an integrated model considering multi-load coupling effects and analyzed deformation and stress distribution under operational conditions, providing novel methodologies and experimental foundations for ship structural design.
Internationally, Wang et al. [
7] employed a hybrid URANS/LES approach to conduct an in-depth numerical analysis of stalled flow and rotating cavitation in the first stage of a multistage LNG cryogenic submerged pump, uncovering details of vortex structure evolution and energy conversion in the flow field under cryogenic conditions. Cui et al. [
8] performed numerical simulations of pressure pulsations in a multistage centrifugal pump based on actual dimensions, demonstrating that dominant pressure pulsation frequencies correlate closely with blade-passing frequencies and their harmonics. Yang et al. [
9] systematically studied pressure pulsation characteristics in a vertical submerged axial-flow pump under bidirectional operation, identifying distinct pulsation patterns between forward and reverse modes, thereby offering critical insights for operational safety under unconventional conditions.
Building on this background, this paper focuses on an LNG dual-submerged pump parallel pump tower system. Combining CFD numerical simulations with vortex dynamics theory, the inlet flow field characteristics and propagation mechanisms of pressure pulsations during dual-pump parallel operation are systematically analyzed. By constructing a computational model incorporating inducers, impellers, guide vanes, and pump tower base structures, and utilizing the SST k-ω turbulence model with Q-criterion for local vortex identification, the correlation between inlet low-velocity zones and pressure fluctuations under varying operating conditions is investigated. This study aims to elucidate the interaction between flow disturbances and internal pressure pulsations during dual-pump parallel operation, providing theoretical foundations and technical references for vibration control, structural optimization, and operational stability enhancement in LNG pump systems for practical engineering applications.
2. Numerical Simulation Methods
2.1. Research Object
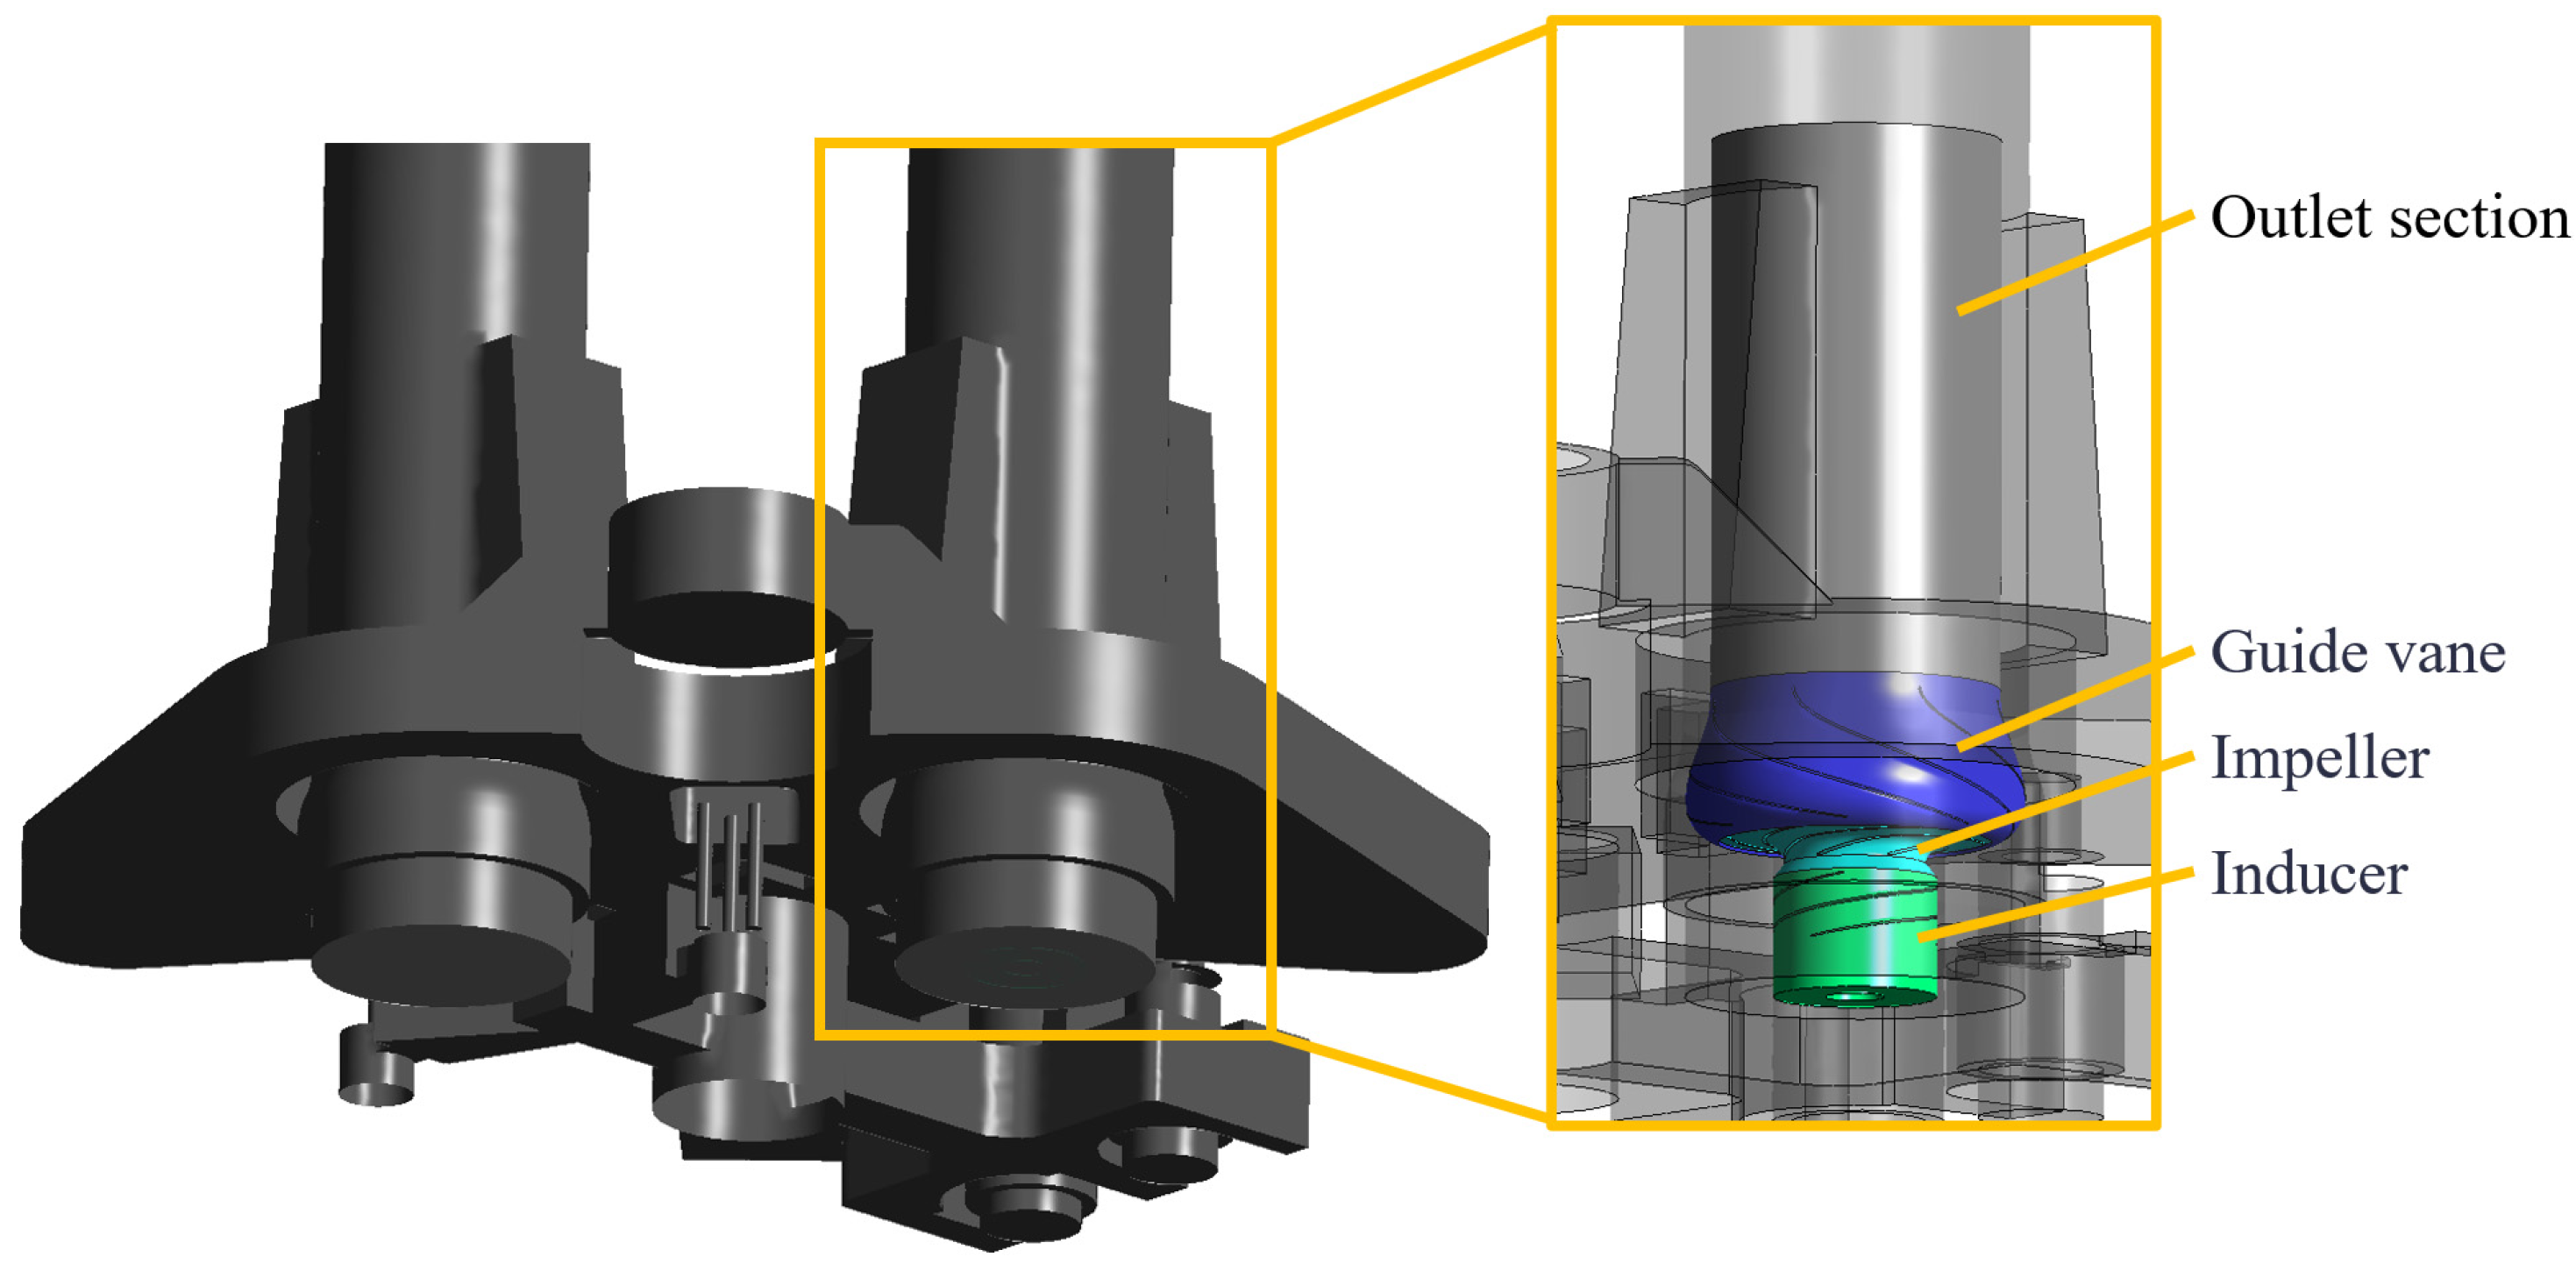
The research object is a dual-inlet, dual-outlet two-pump parallel system. It comprises two LNG centrifugal pumps. These pumps feature a submerged-type structure. They have four stages. The transported medium is liquefied natural gas. Its density is 500 kg/m3. Each LNG pump contains three components. These are an inducer, impeller, and guide vanes. The inducer has 3 blades. The impeller contains 6 blades. The guide vanes have 7 blades. The rated rotational speed is 1750 rpm. Three rated flow rates are examined. These are 1500 m3/h, 1800 m3/h, and 2100 m3/h. Additionally, the flow rate point of 1200 m3/h was added as a special abnormally low operating condition.
2.2. Computational Model
UG NX 12.0 software modeled the parallel pump system. The 3D computational model retains the base structure. External pipeline dimensions are preserved. Minor components were optimized. Small circular holes are examples. Sharp angles were eliminated. Excessive narrow gaps were removed. Through Q = 20 s
−2 vortex identification, it is shown that the simplified region did not generate abnormal vortex structures, indicating that the simplification did not significantly alter the inlet flow field and pressure pulsation characteristics, meeting the requirements for engineering simulation accuracy.
Figure 1 shows the simplified model. Boolean operations extracted the fluid domain. This domain surrounds the pump tower base. Fluid domains of both LNG pumps were assembled. They were positioned appropriately. This created the dual-pump computational domain.
2.3. Meshing of Computational Domain and Boundary Conditions
The Reynolds-averaged Navier–Stokes equations (RANS) and large eddy simulation (LES) methods are commonly employed in numerical studies [
10]. Computational fluid dynamics (CFD) enables detailed flow visualization, analysis of velocity profiles, and internal velocity and pressure fields [
11].
ANSYS 2023 R1 Meshing software was used to discretize the computational domain into grids. The model is divided into three main parts: two LNG pumps and the surrounding fluid domain near the base. Grid quality directly impacts the accuracy, convergence speed, and computational time of the CFD model. Finer grids improve solution accuracy but increase computational costs [
12]. The main water structures of the LNG pump are the following: inducer, impeller, guide vanes, and outlet section. The outlet section is set as a structured grid, while the water body around the base and the remaining parts of the pump are unstructured grids [
13,
14]. Additionally, boundary layers are set at the blades to satisfy the requirements of the SST k-ω model. The specific grid numbers for each component are shown in
Table 1.
Figure 2 illustrates the meshing details of the fluid computational domain: (a) shows the refined mesh at the pump inlet within the base-surrounding fluid domain, (b) the inducer mesh, (c) the impeller mesh, (d) the guide vane mesh, and (e) the outlet section mesh.
The main body of the pump is meshed using a three-level grid scheme (grid numbers: 1.06 million/1.38 million/1.69 million). By comparing the monitoring of key parameter head, grid independence verification is performed. The results show that when the grid amount reaches 1.38 million, the relative errors are all less than 2%, meeting the requirements for engineering accuracy.
Table 2 summarizes the grid independence verification.
The computational medium is liquefied natural gas (LNG) with a density of 500 kg/m
3. The SST turbulence model was adopted for simulations [
15,
16]. The outlet surfaces of both pumps were set as mass flow outlets, corresponding to three operating conditions: 200 kg/s, 250 kg/s, and 300 kg/s, aligned with the three rated flow rates. The inlet boundary conditions were defined as follows: the inlet encompasses the four side surfaces and the bottom surface of the fluid domain surrounding the base, configured as an open inlet. The inlet pressure was calculated based on the tower height and a 90% liquid filling level, resulting in an inlet pressure of 100 kPa. The impeller rotational speed was set to 1750 rpm. Unsteady-state calculations were performed with a time step of 2.857 × 10
−4 s, during which the impeller rotates 3° per step. The total simulation time spanned 0.2057 s.
3. Results and Discussion
3.1. Impact of Dual-Pump Operation on the Inlet Flow Field of LNG Pumps
3.1.1. Computational Parameter Settings
To facilitate the analysis of time-frequency domain characteristics of pressure pulsations, the pressure pulsation coefficient is defined as
where
p: Instantaneous pressure (Pa);
: Average pressure over the time period (Pa);
: Water density (kg/m3);
u: Velocity (m/s).
For internal analysis of the LNG pump, the velocity u is selected as the circumferential velocity at the impeller outlet, calculated using the formula u = 2πnR. Here, R is the radius at the impeller outlet (m), and n is the rotational speed of the centrifugal pump (r/s).
3.1.2. Basic Characteristics of Dual-Pump Parallel Operation
To compare the external characteristics of the two pumps during parallel operation, an additional operating condition with a flow rate of 1200 m
3/h was introduced. The flow rate–head characteristic curve of the LNG pump is shown in
Figure 3.
By comparing the external characteristics of two pumps running at the same time, it can be found that the head difference between LNG pump 2 and LNG pump 1 is small under different flow conditions.
3.1.3. Inlet Flow Field Analysis
The flow field near the LNG pump tower base was extracted, and a Q-criterion value of Q = 20 s
−2 was selected for vortex identification in the flow field. To analyze the flow behavior near the inlet more intuitively, a monitoring plane (Plane1) was established in the inlet flow field. Monitoring points were positioned at the dual-pump inlets and irregular regions of the base within Plane1 to track the reverse propagation of pressure pulsations within the pumps. The specific location of Plane1 is illustrated in
Figure 4.
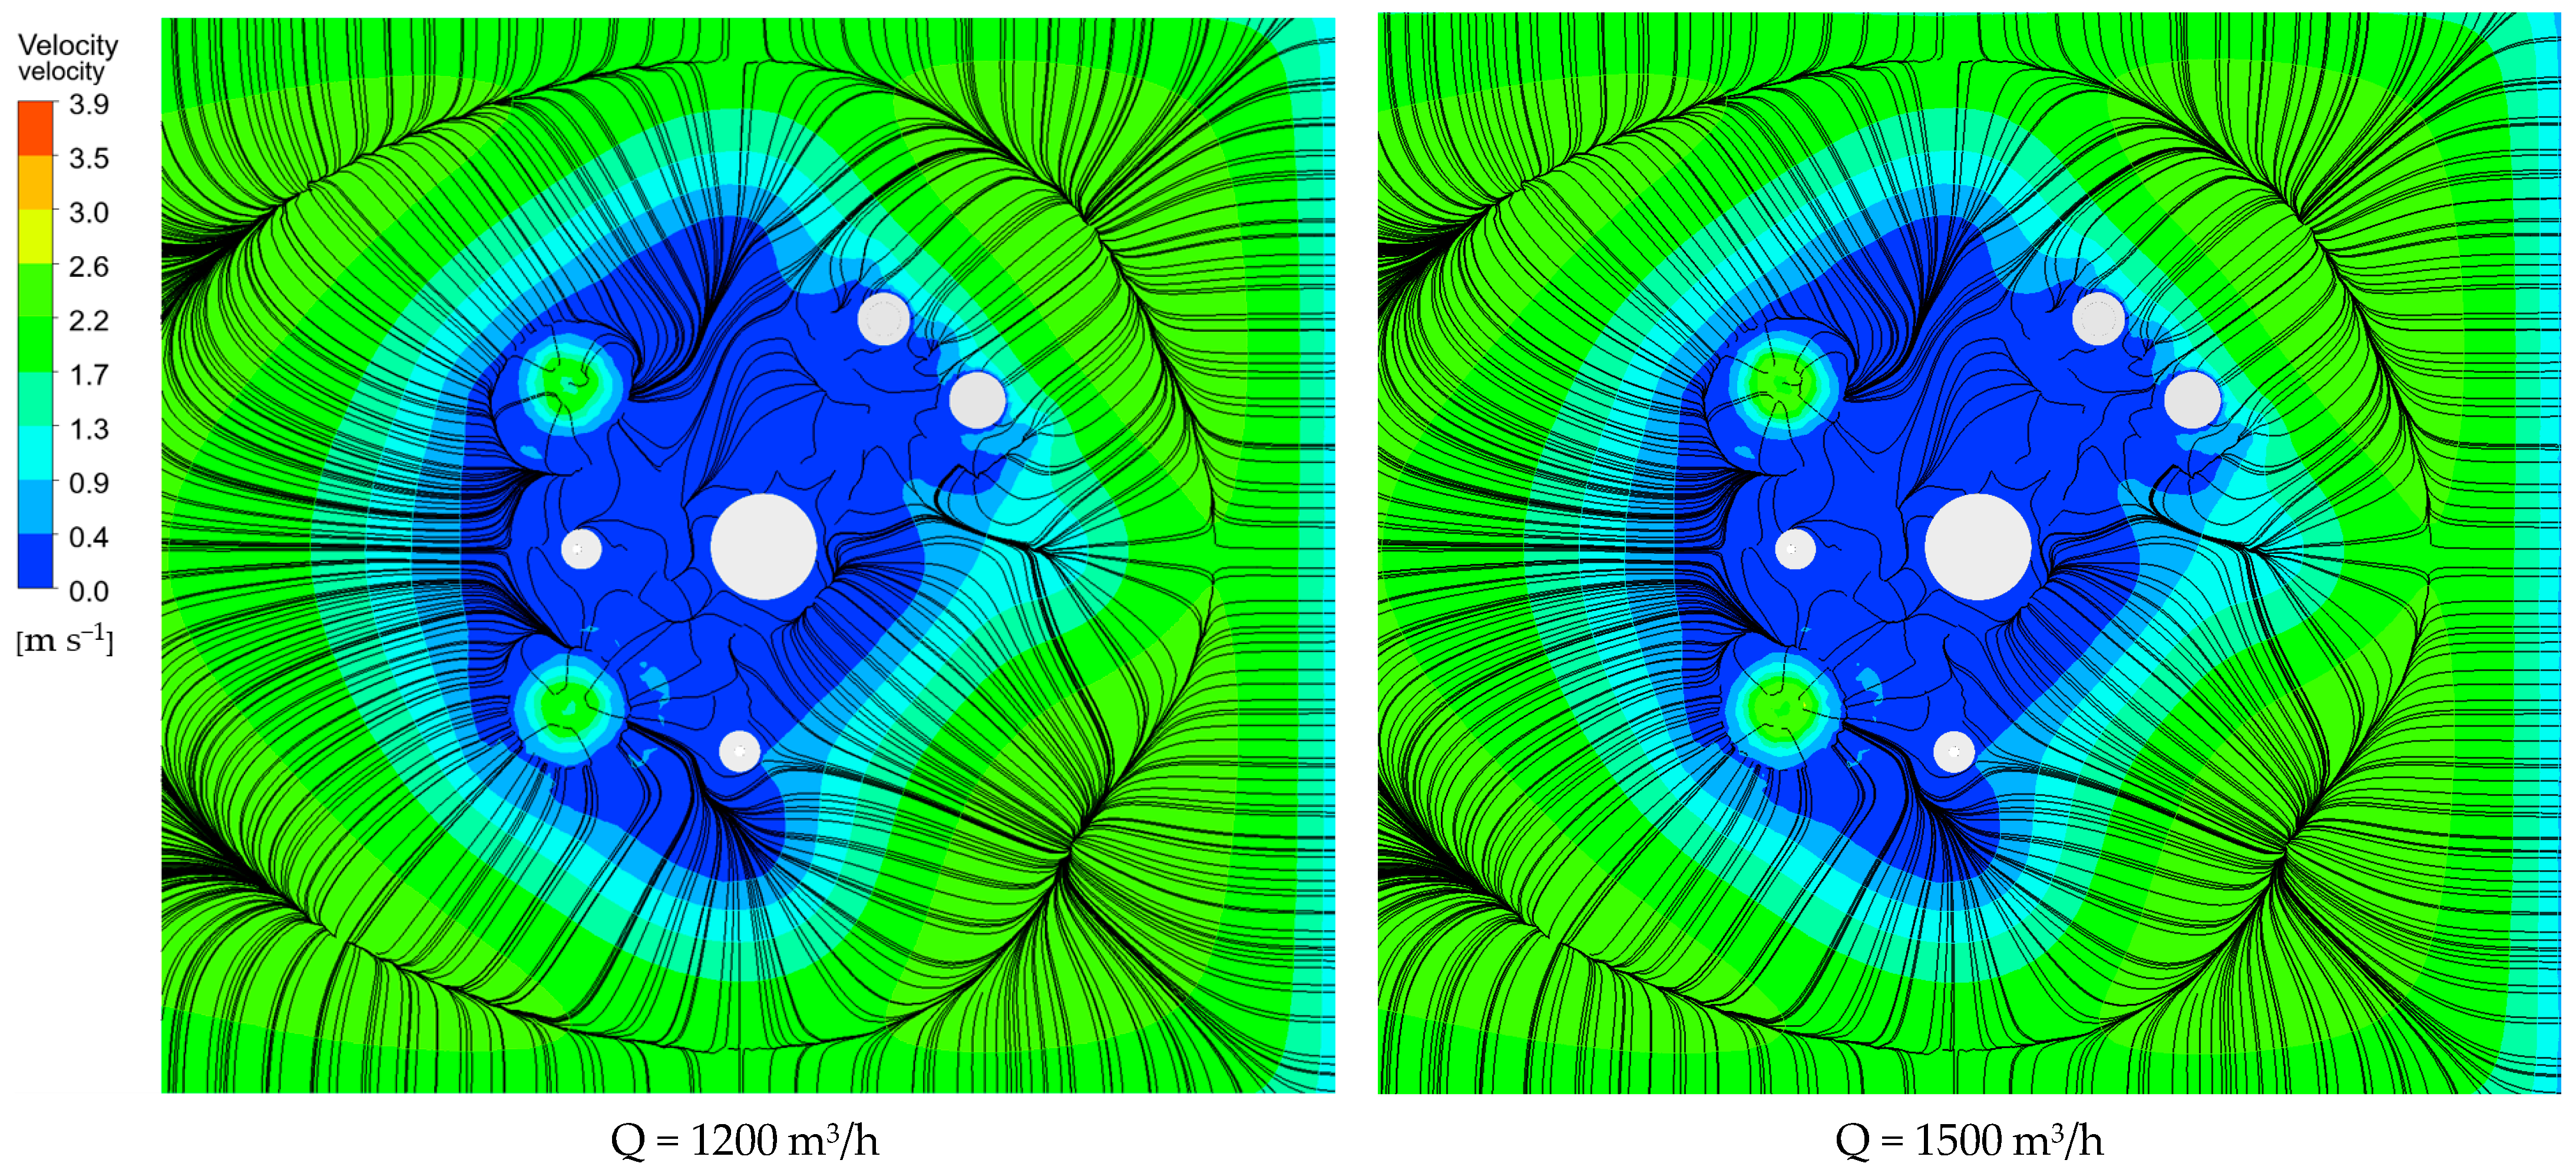
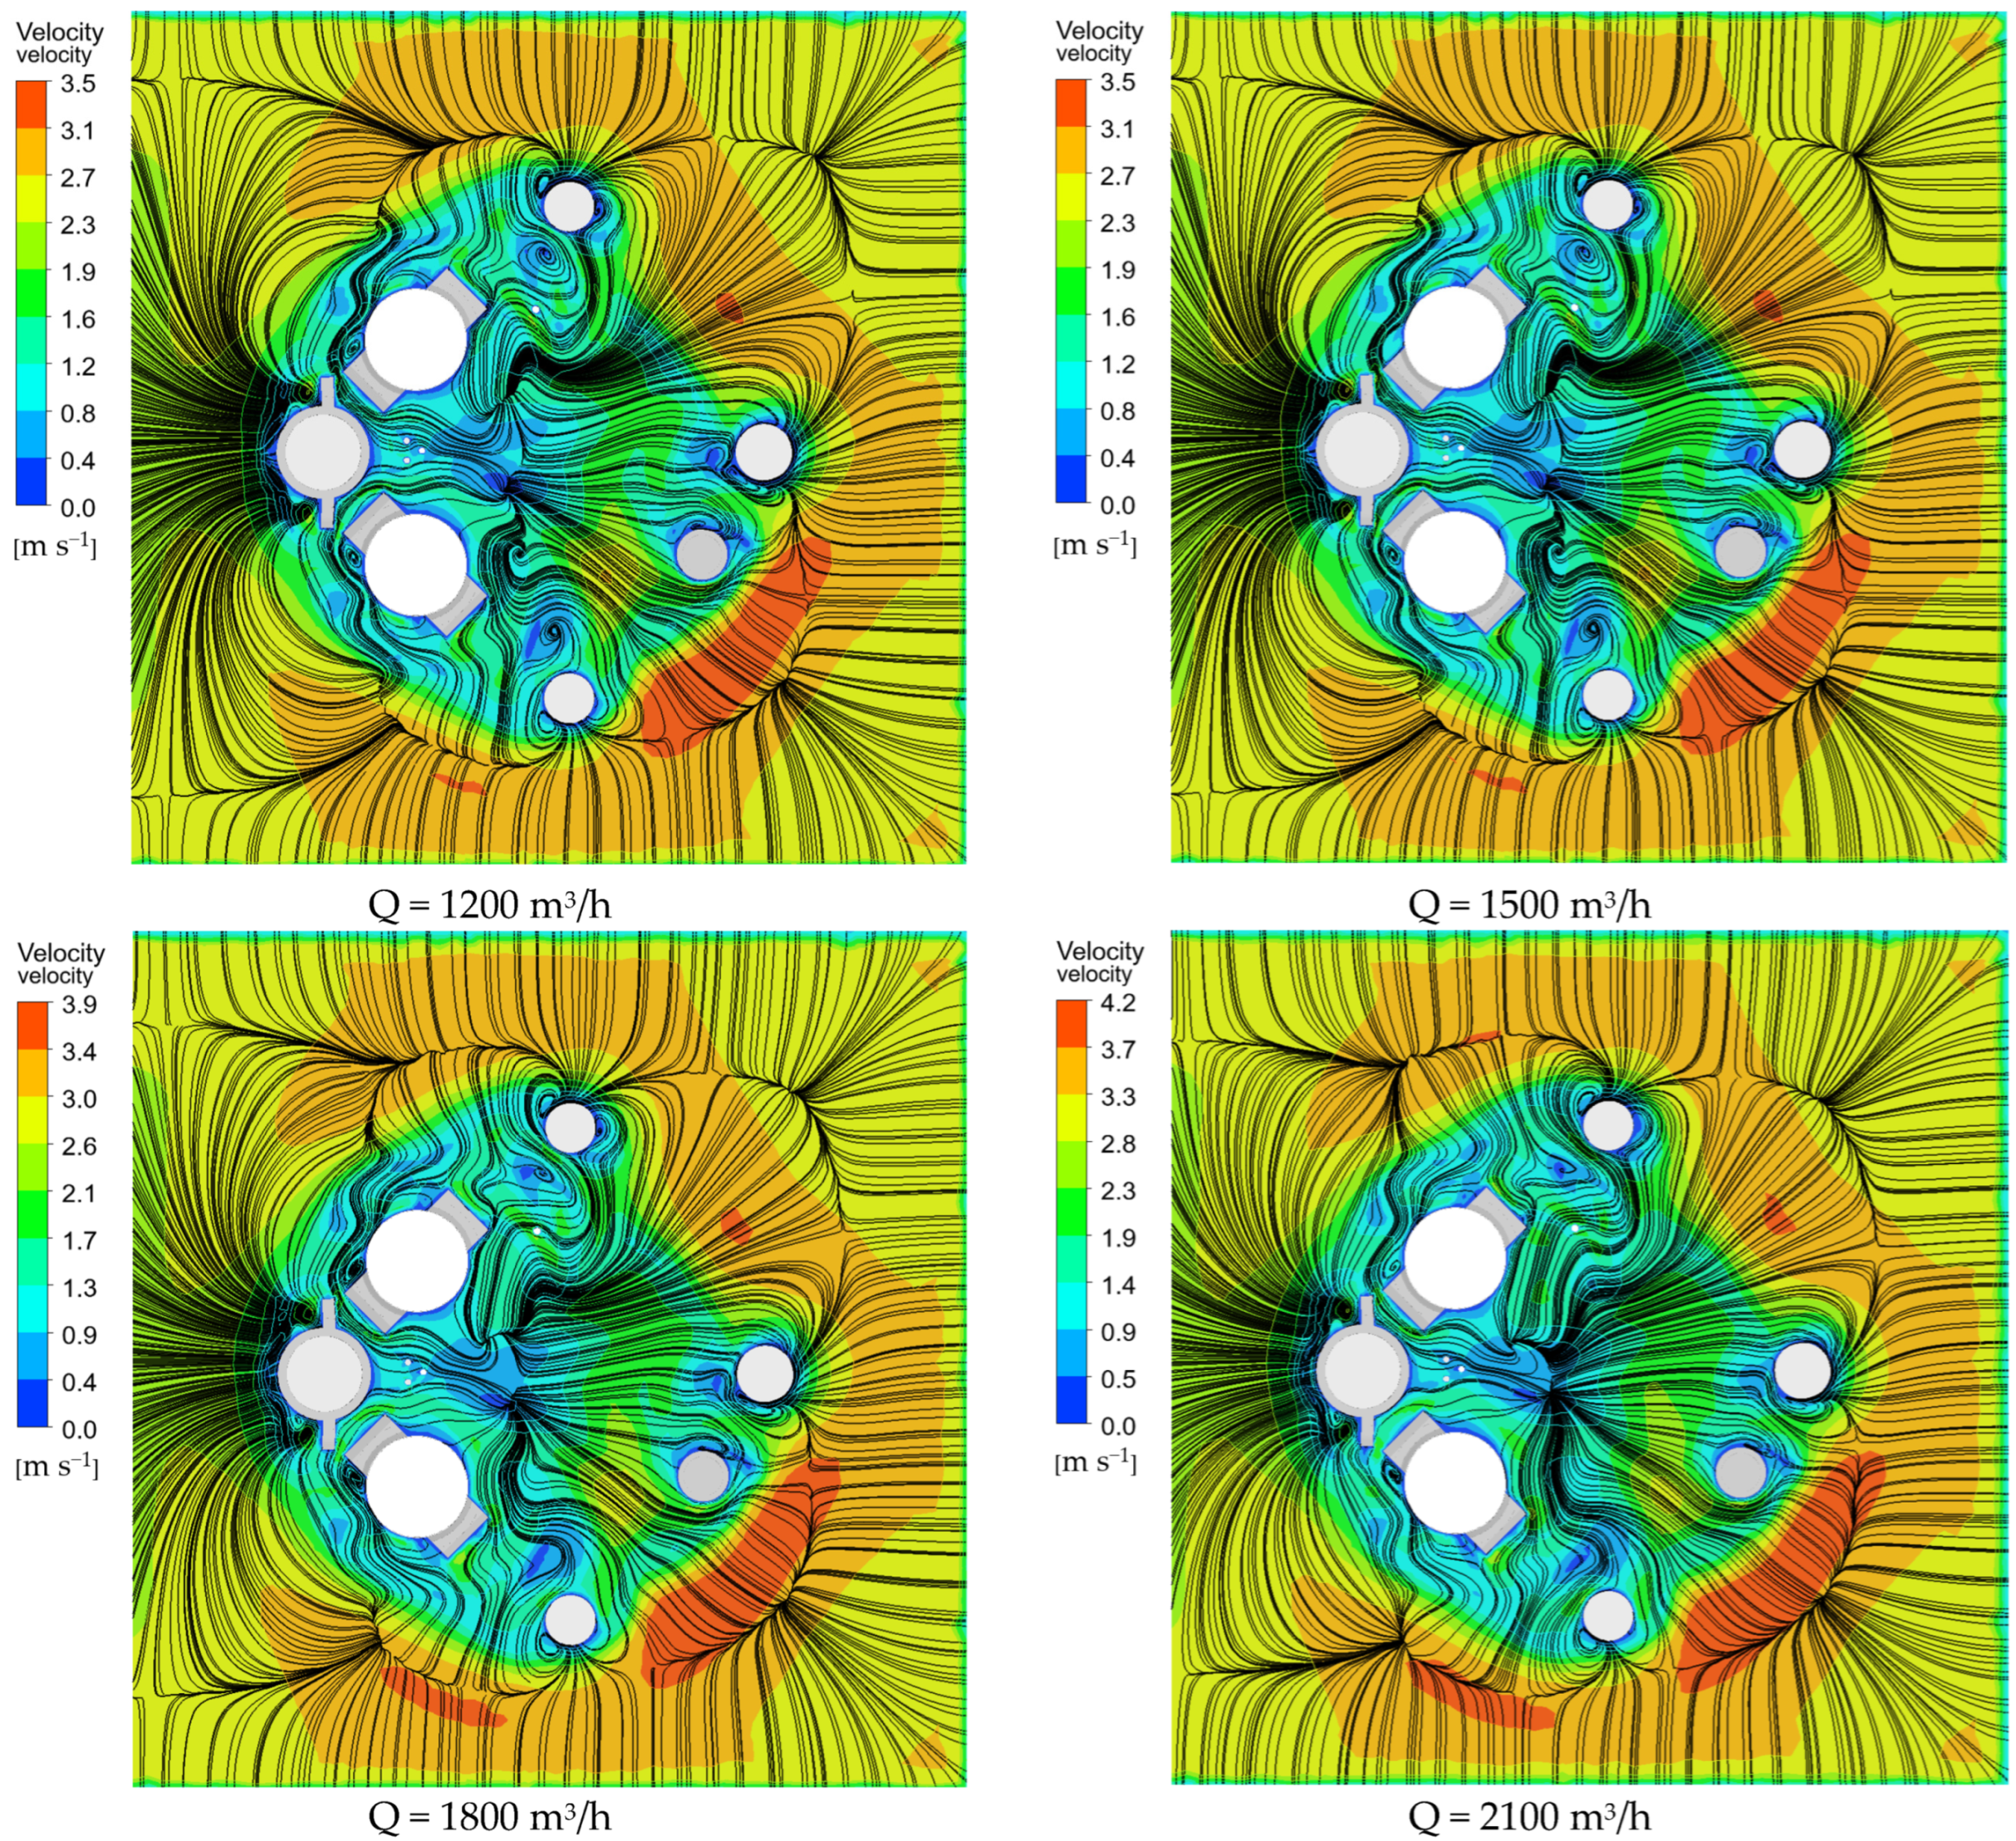
Figure 5 shows the velocity contours and streamlines at Plane1 under four flow rates, respectively.
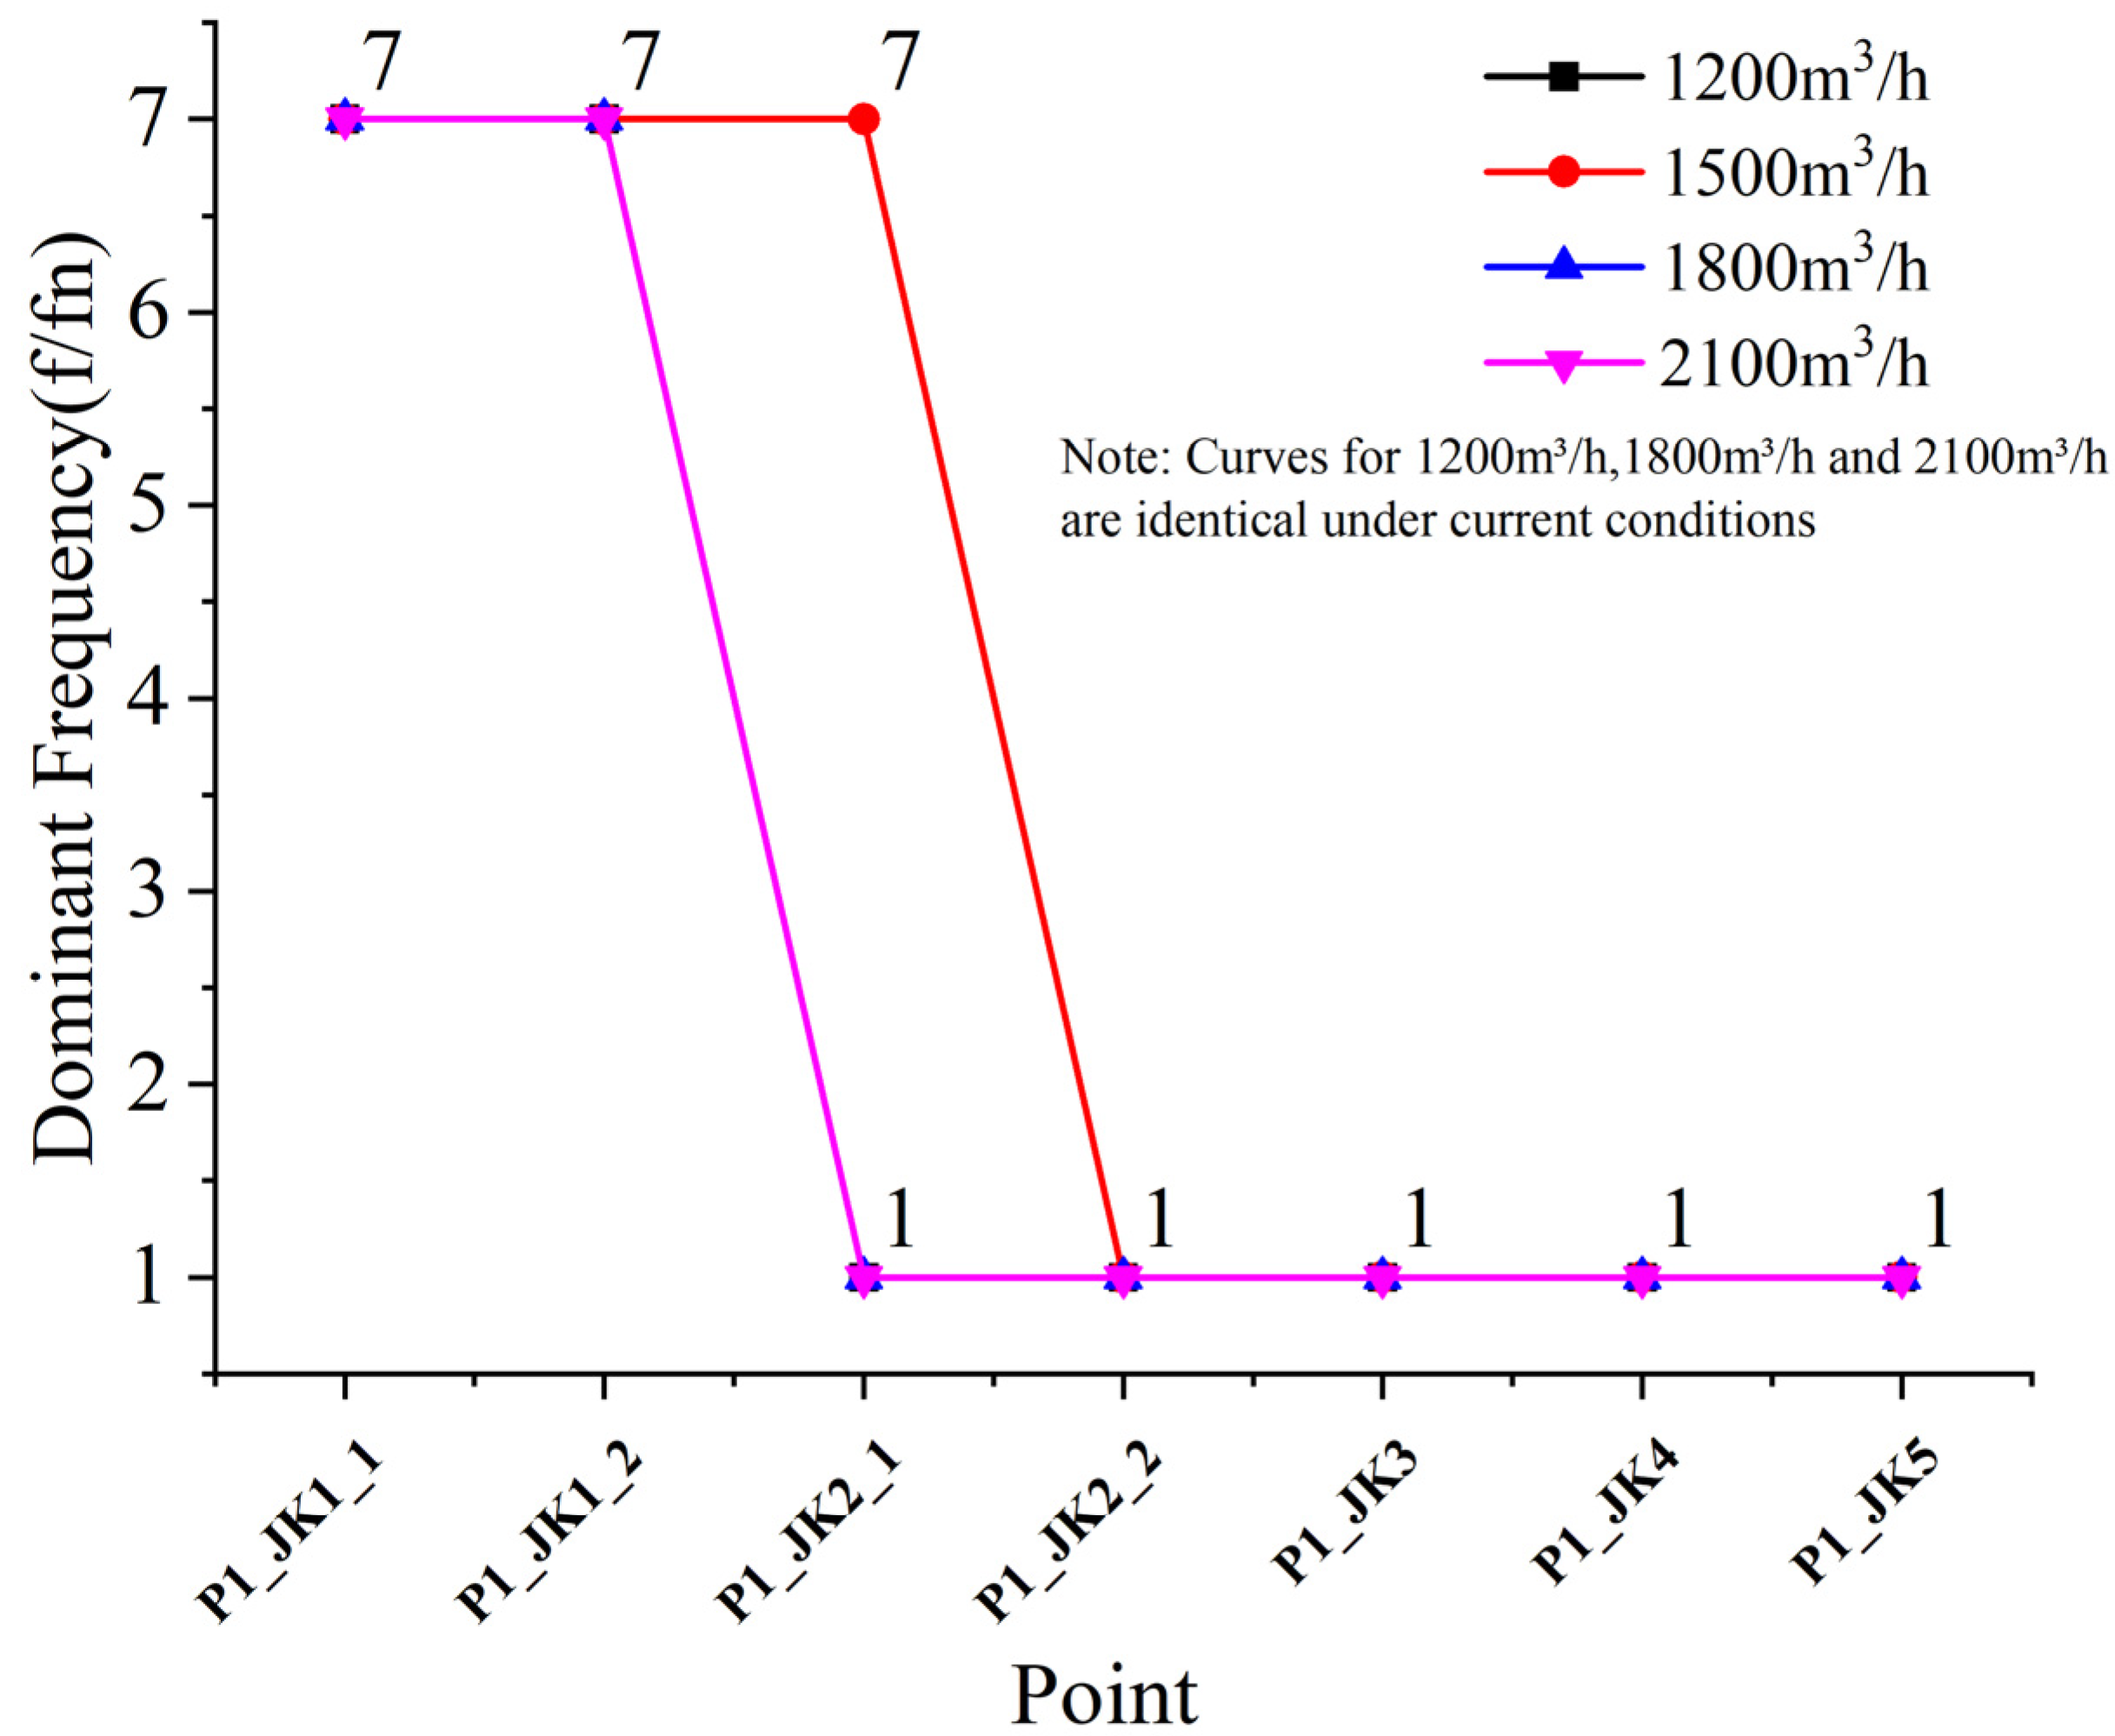
Figure 6 shows the dominant frequency of pressure pulsation at the monitoring point on Plane1 (f/f
n).
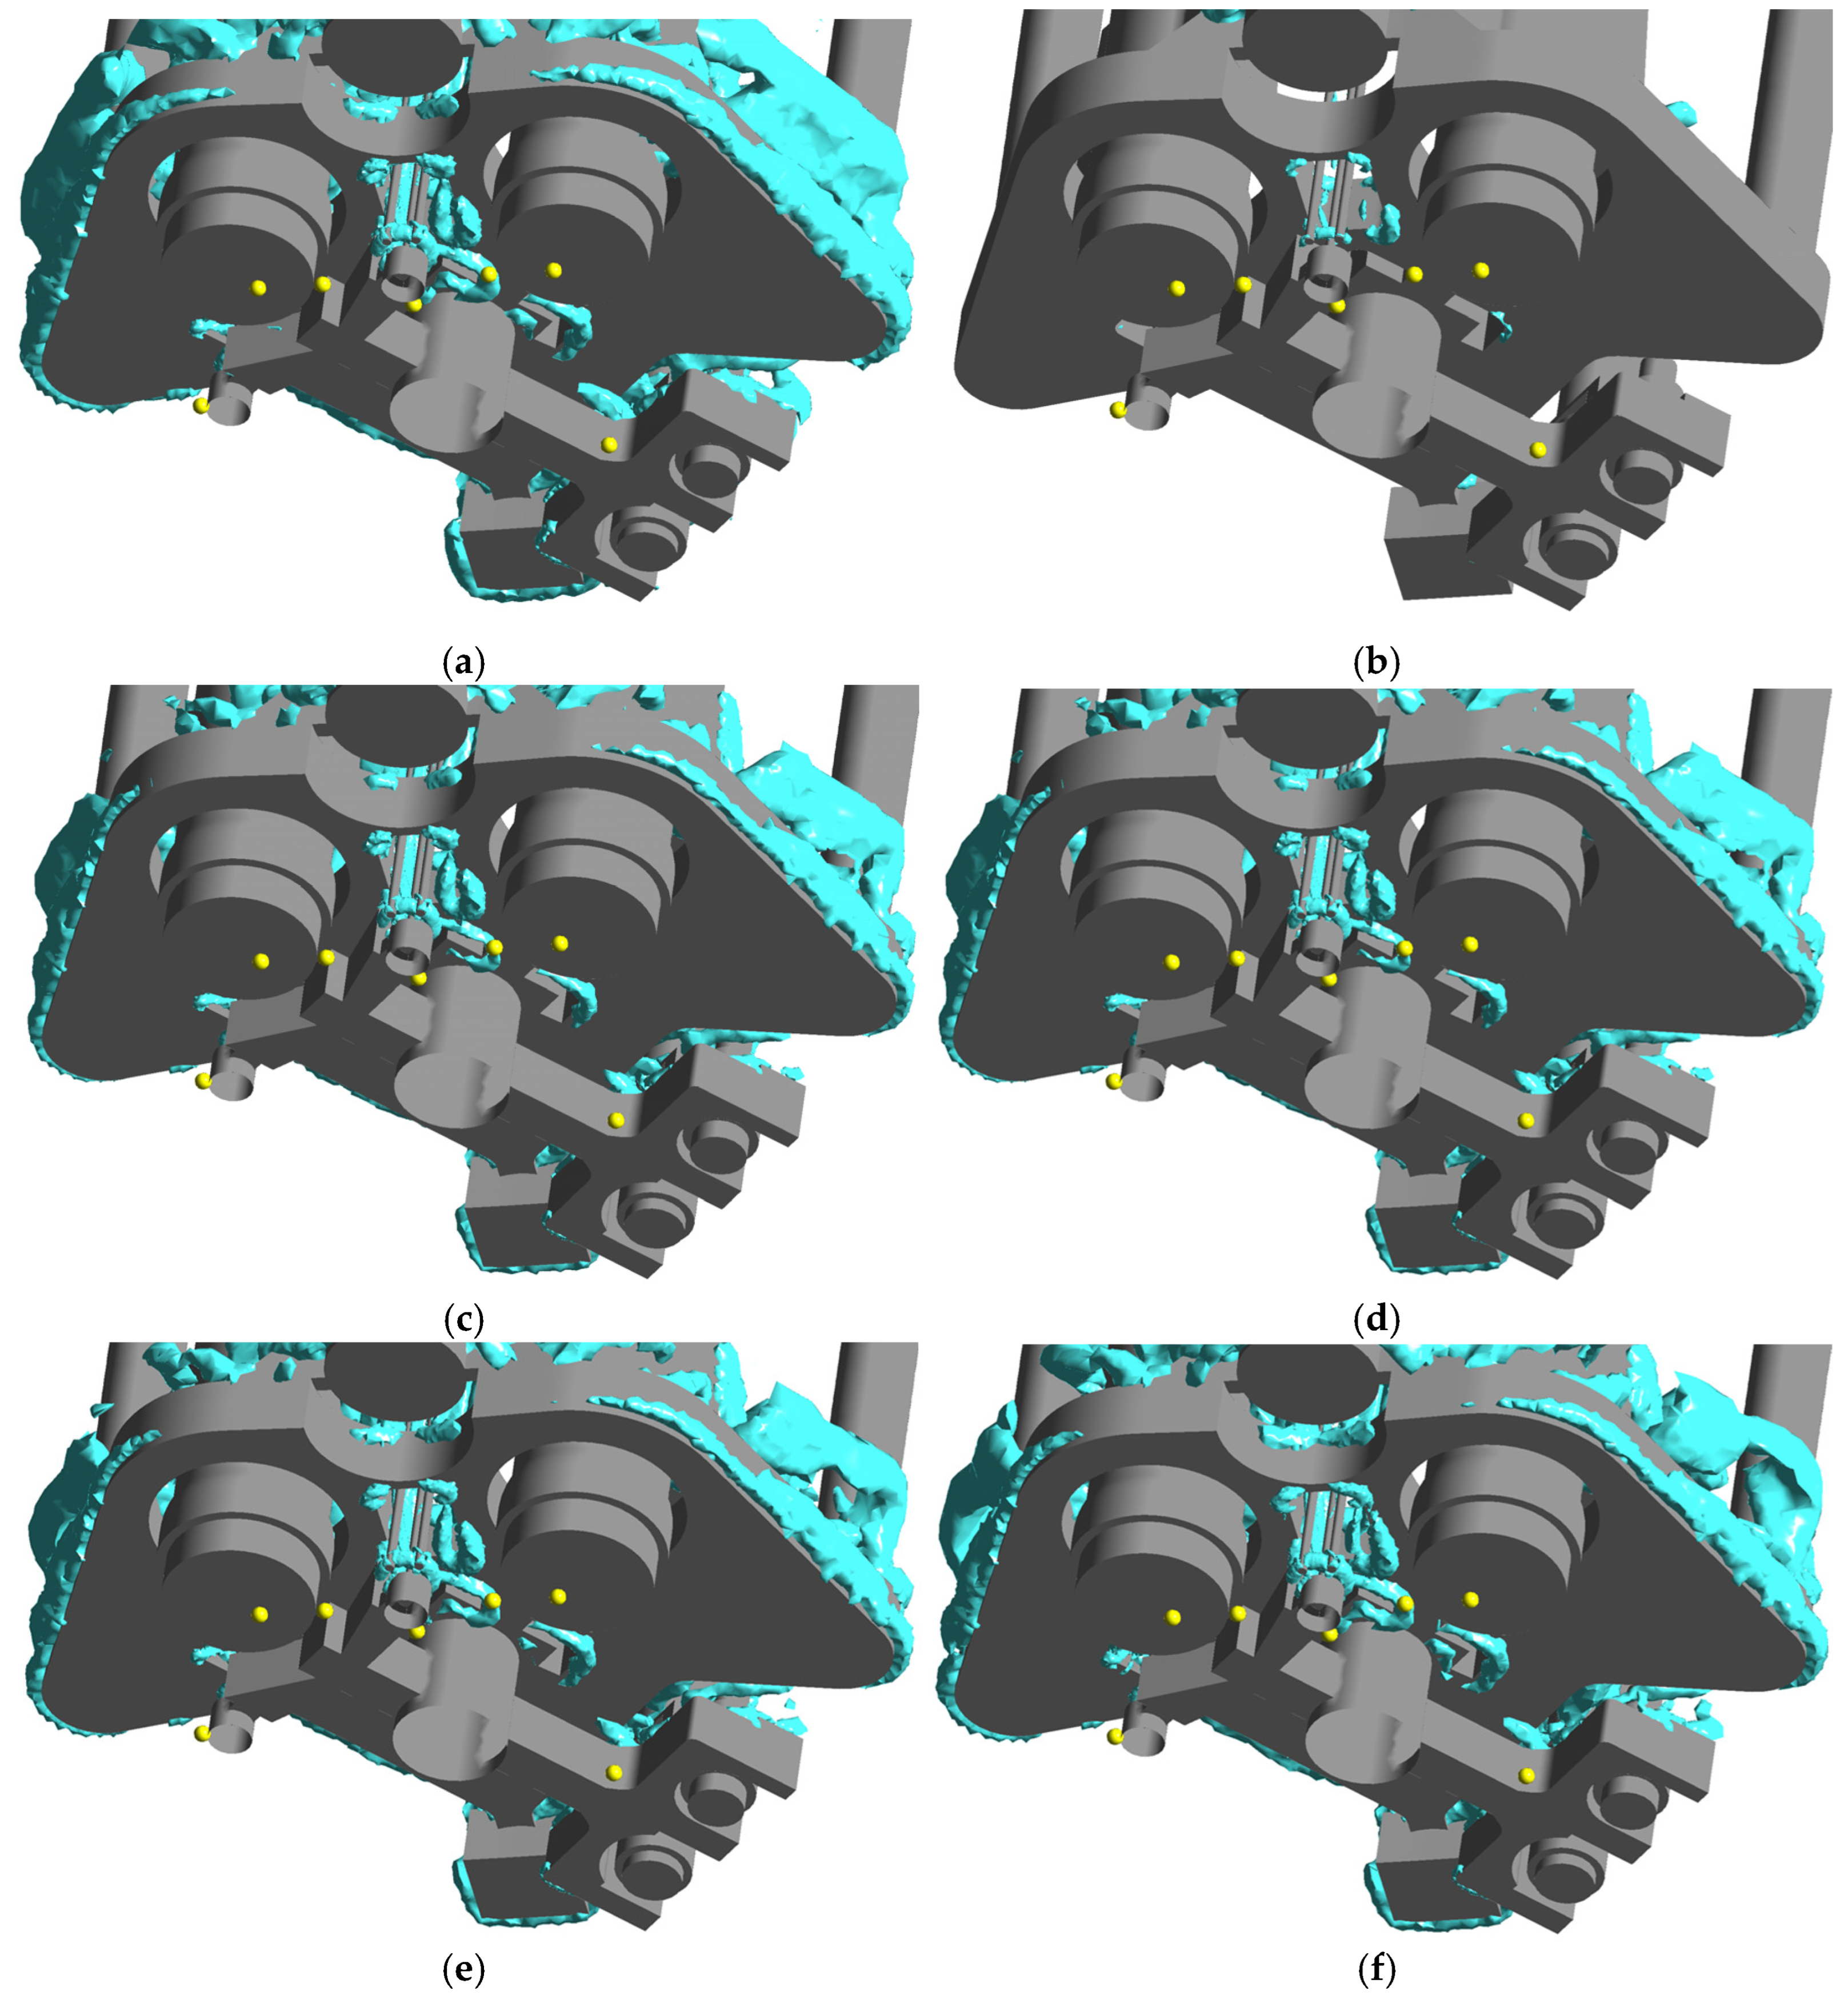
To display the vortex distribution in the inlet flow field, the Q-criterion is employed to capture vortices. The selection of the Q threshold is based on the analysis of the second invariant of the vorticity tensor: when Q = 20 s
−2, the vortex core regions (Q > 0) can be clearly captured while avoiding noise interference (
Figure 7c). Comparing the results for Q = 10 s
−2 (containing excessive pseudo-vortices) and Q = 100 s
−2 (missing small-scale vortices) (
Figure 7a,b), it is confirmed that this threshold is representative for vortex structure identification.
Figure 7 shows the vortex distribution in the inlet flow field.
The velocity contour distribution was observed. This was on the Plane1 cross-section. Velocity near the inlet is relatively uniform. Significant fluctuations occur only at pump inlets. Flow velocity beneath the base approaches zero. This occurs outside the inlets. The pump flow rate increases. Consequently, overall velocity in the base-surrounding region rises. Low-velocity zones beneath the base remain largely unchanged.
Streamlines were examined across flow rates. Their distribution shows high consistency on the P1 cross-section. Streamlines toward pump inlets remain smooth. Larger protrusions on the base obstruct flow. This induces localized disturbances. Vortices also form. These vortices weaken with increasing flow rates. Flow patterns consequently improve.
Analysis of the vortex diagrams near the inlet reveals no significant vortex structures in the vicinity of the inlet cross-section across all three flow rates. This is attributed to the absence of complex geometric structures obstructing LNG flow at the inlet, minimizing vortex generation. Pressure pulsation monitoring at the inlet cross-section shows that only at 1500 m3/h do pressure pulsations from Pump 2’s internal components propagate to regions close to the inlet. In other cases, only monitoring points directly below the pump inlets detect pressure pulsation periods matching those of internal components, while points elsewhere beneath the base exhibit dominant frequencies aligned with the LNG pump’s rotational frequency.
In summary, during dual-pump parallel operation, the flow field near the inlets demonstrates favorable patterns with no significant mutual interference between the pumps. Additionally, inlet flow patterns under higher flow rates exhibit superior stability compared to those under lower flow rates.
3.2. Impact of Dual-Pump Operation on Internal Pressure Characteristics of LNG Pumps
3.2.1. Monitoring Point Configuration
Due to differences in individual LNG pump performance characteristics and actual flow rate variations, the operational conditions of the two parallel pumps diverge. To analyze the operational stability of the pump tower under rated operating conditions, the pressure pulsation characteristics of both LNG pumps were monitored and studied.
Two sets of monitoring points were established at corresponding positions on the inducers, impellers, guide vanes, and outlet sections of the two LNG pumps to track pressure pulsations during operation. The monitoring points are designated as: YDL for inducer; YL for impeller; DY for guide vane; CK for outlet section. Letters “a” and “b” denote two spatially paired monitoring points on the same component (e.g., YDLa/YDLb), as shown in
Figure 8.
During post-processing, to ensure result stability, the final rotation cycle of the simulation was extracted for analysis, guaranteeing convergence. The extracted time segment has a step size of 2.857 × 10⁻⁴ s, with the impeller rotating 3° per time step, and a total step duration of 0.034284 s.
3.2.2. Pressure Characteristics and Analysis Inside LNG Pumps
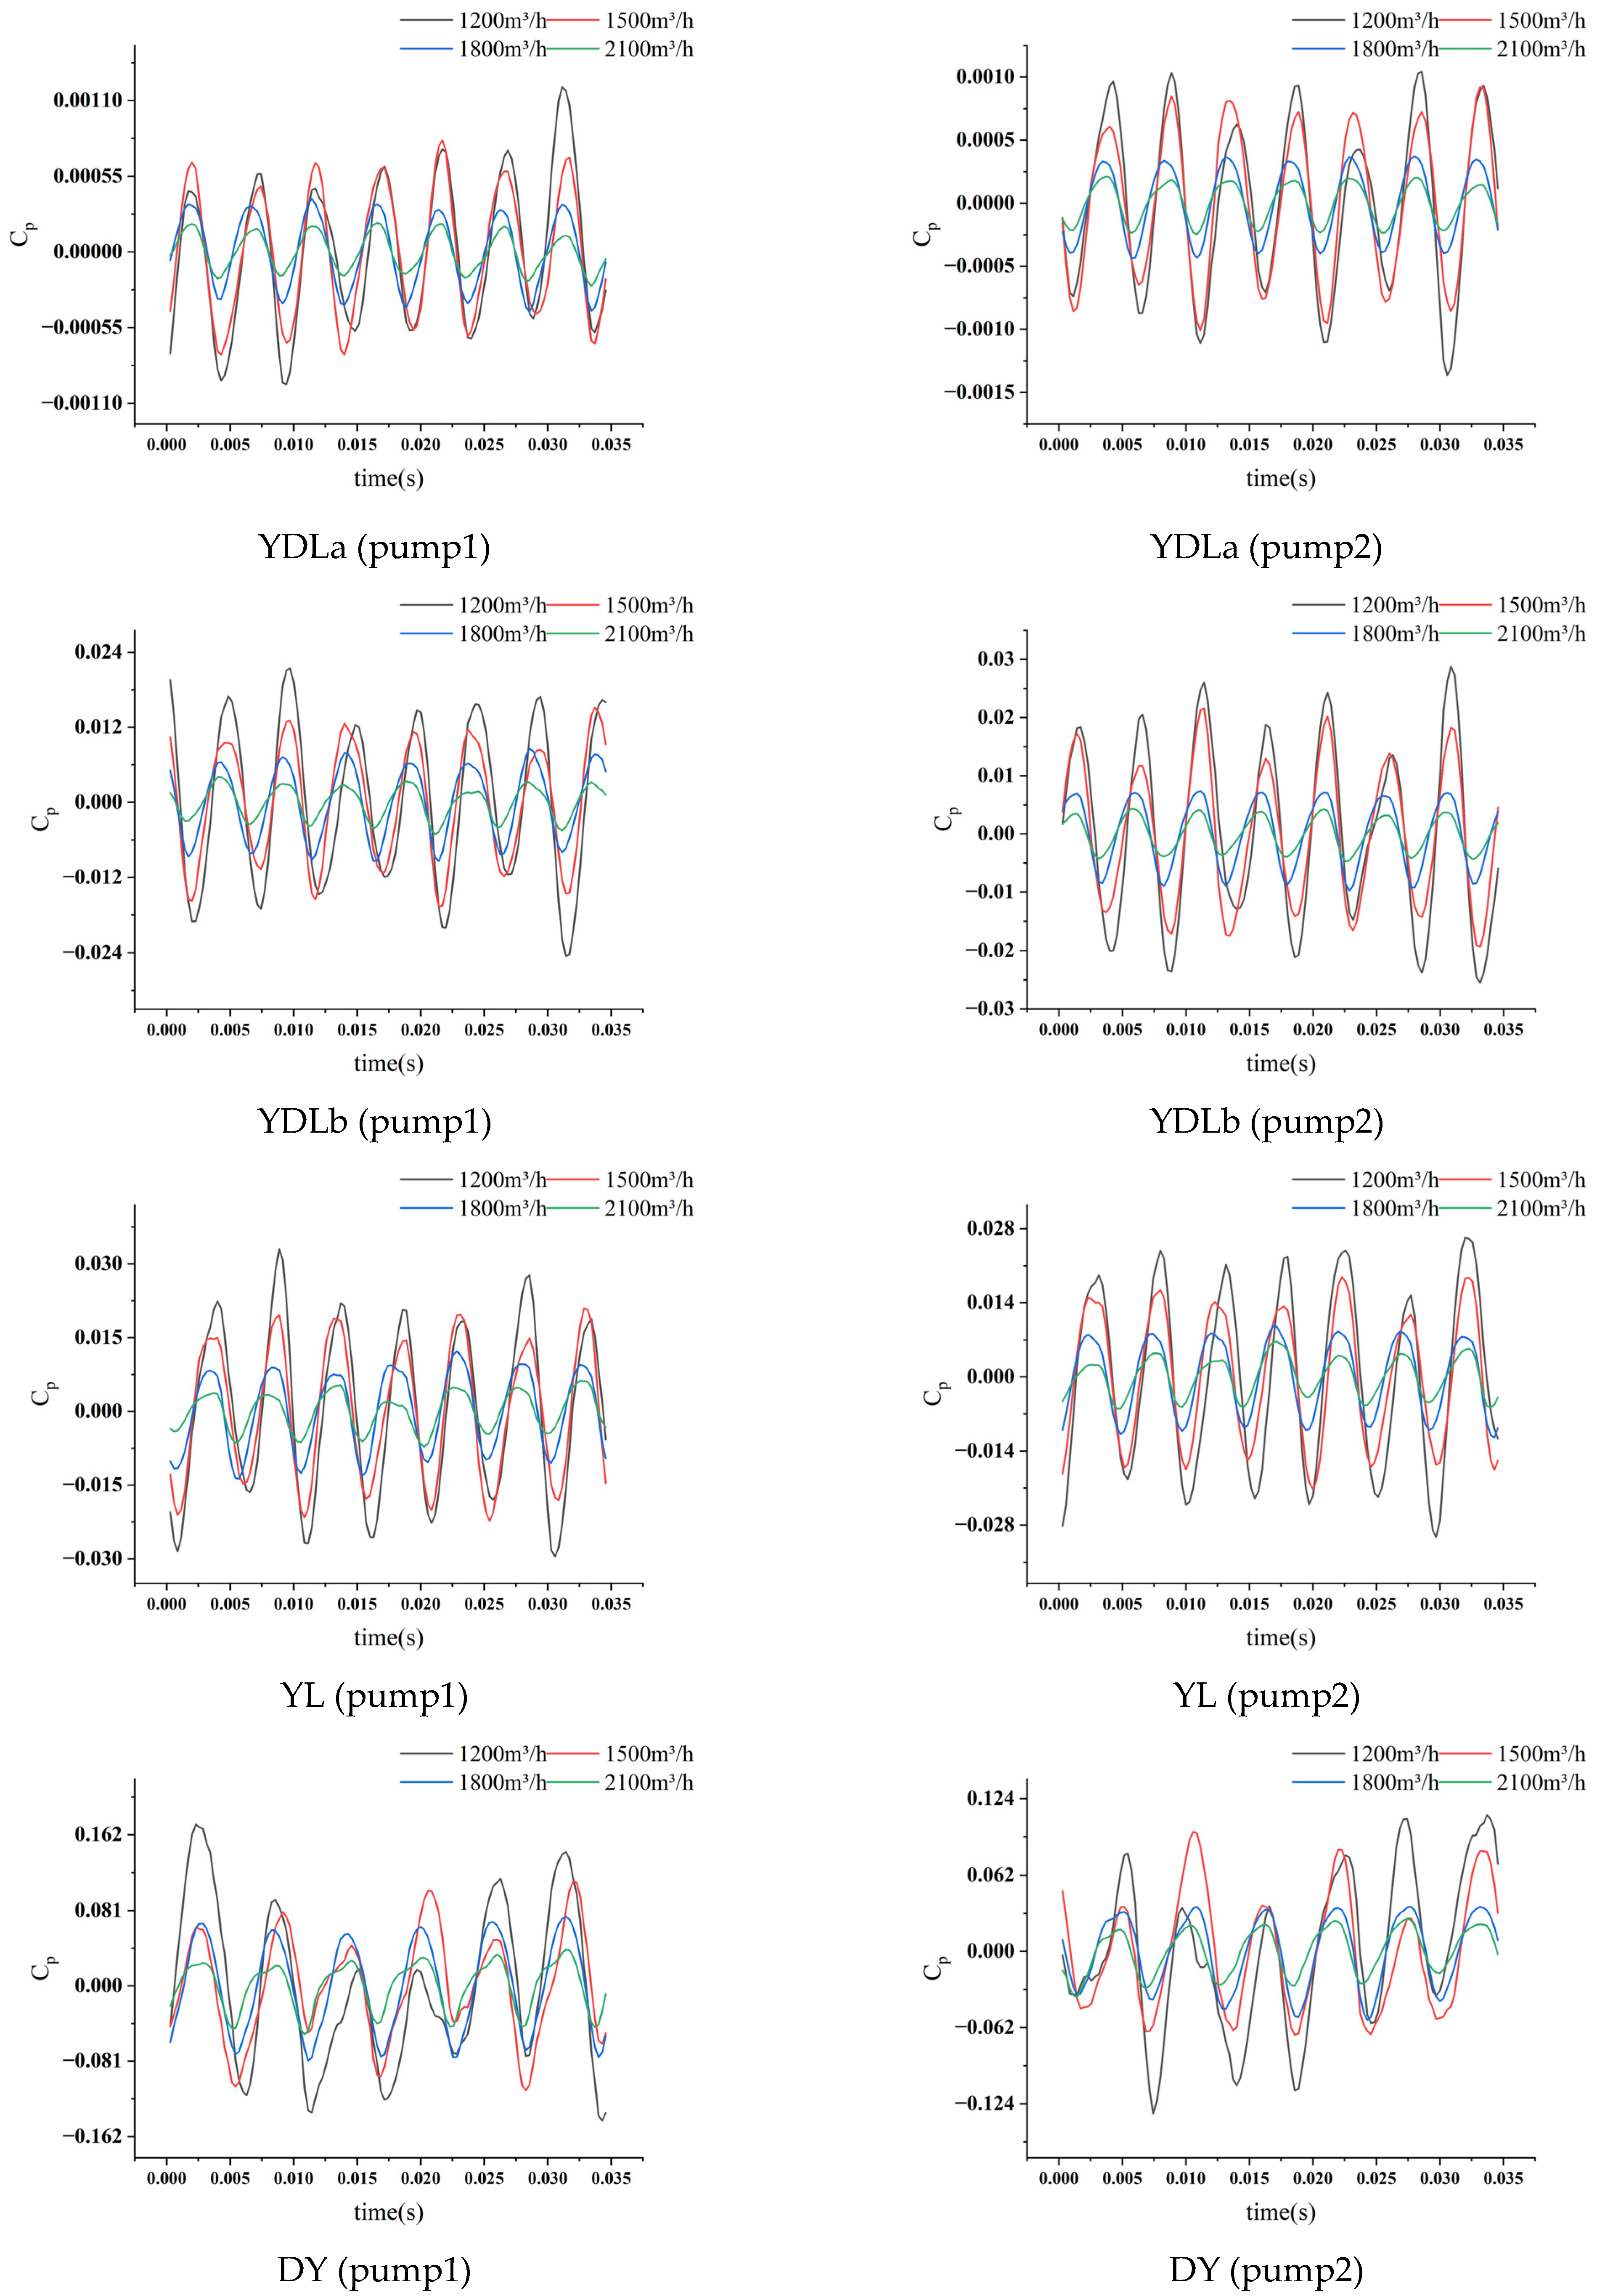
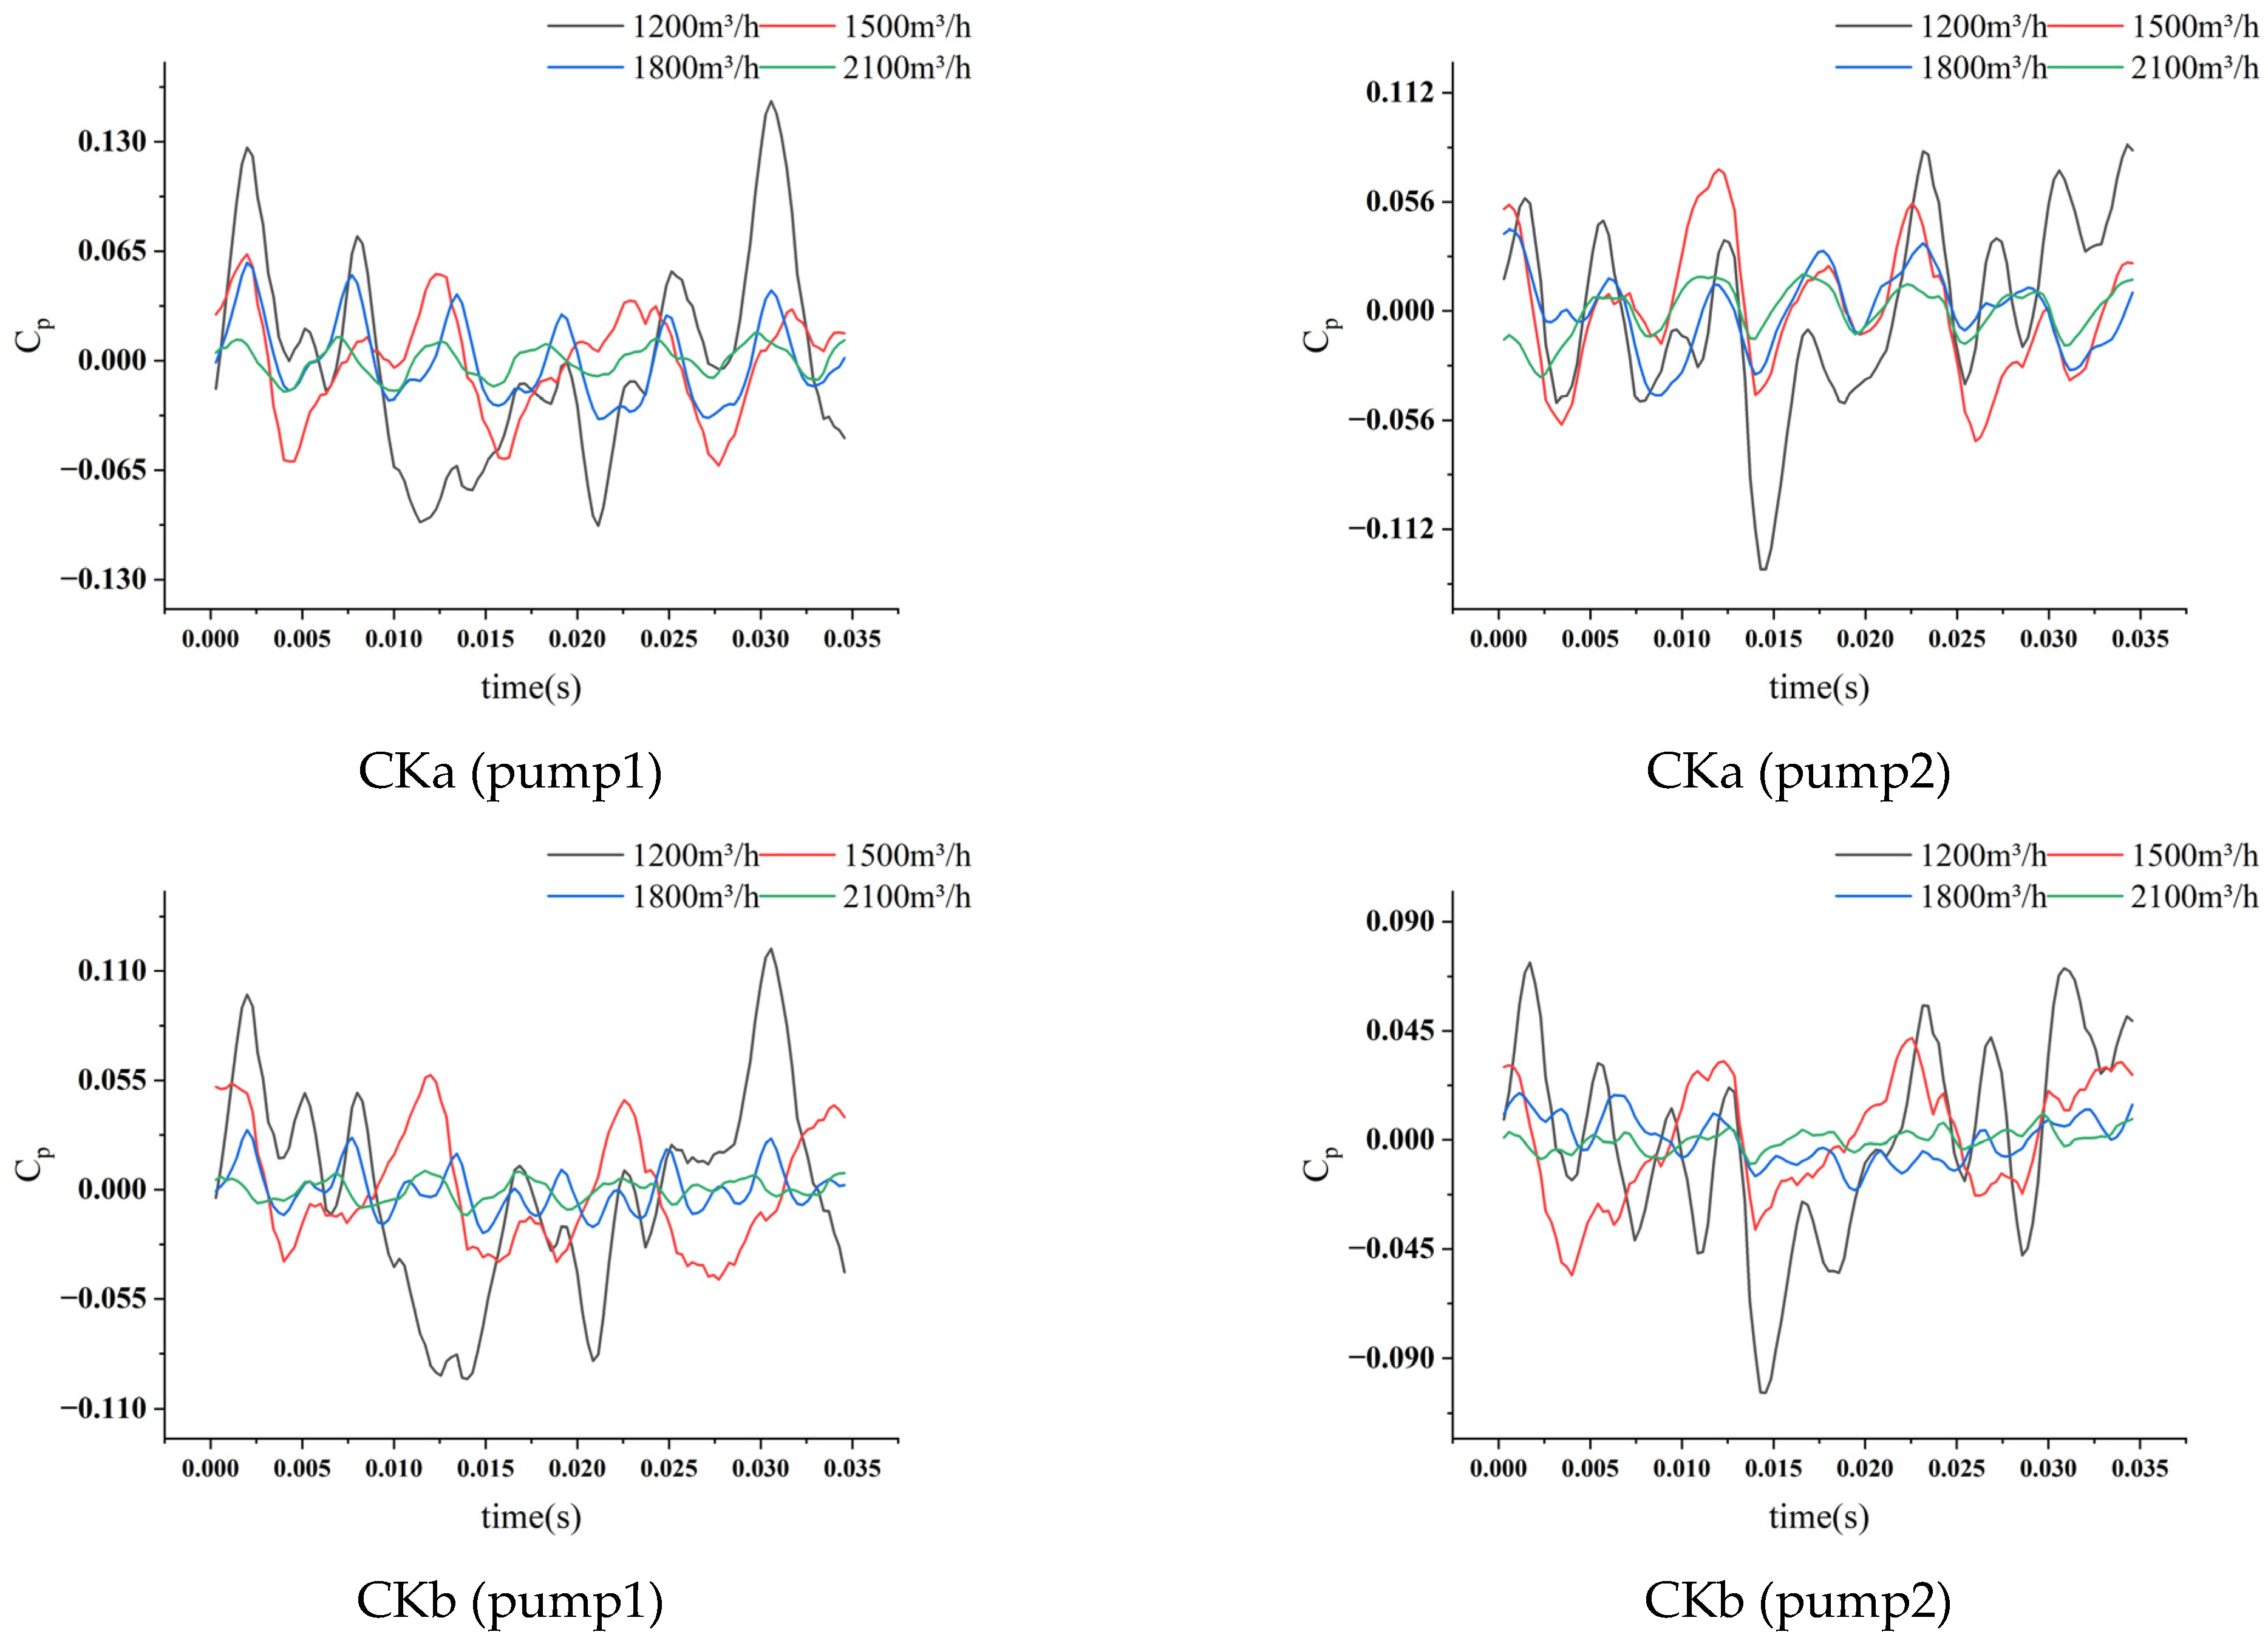
Pressure pulsations in the LNG pumps were monitored under three flow rate conditions. The time-domain plots of pressure pulsations at the monitoring points are shown in
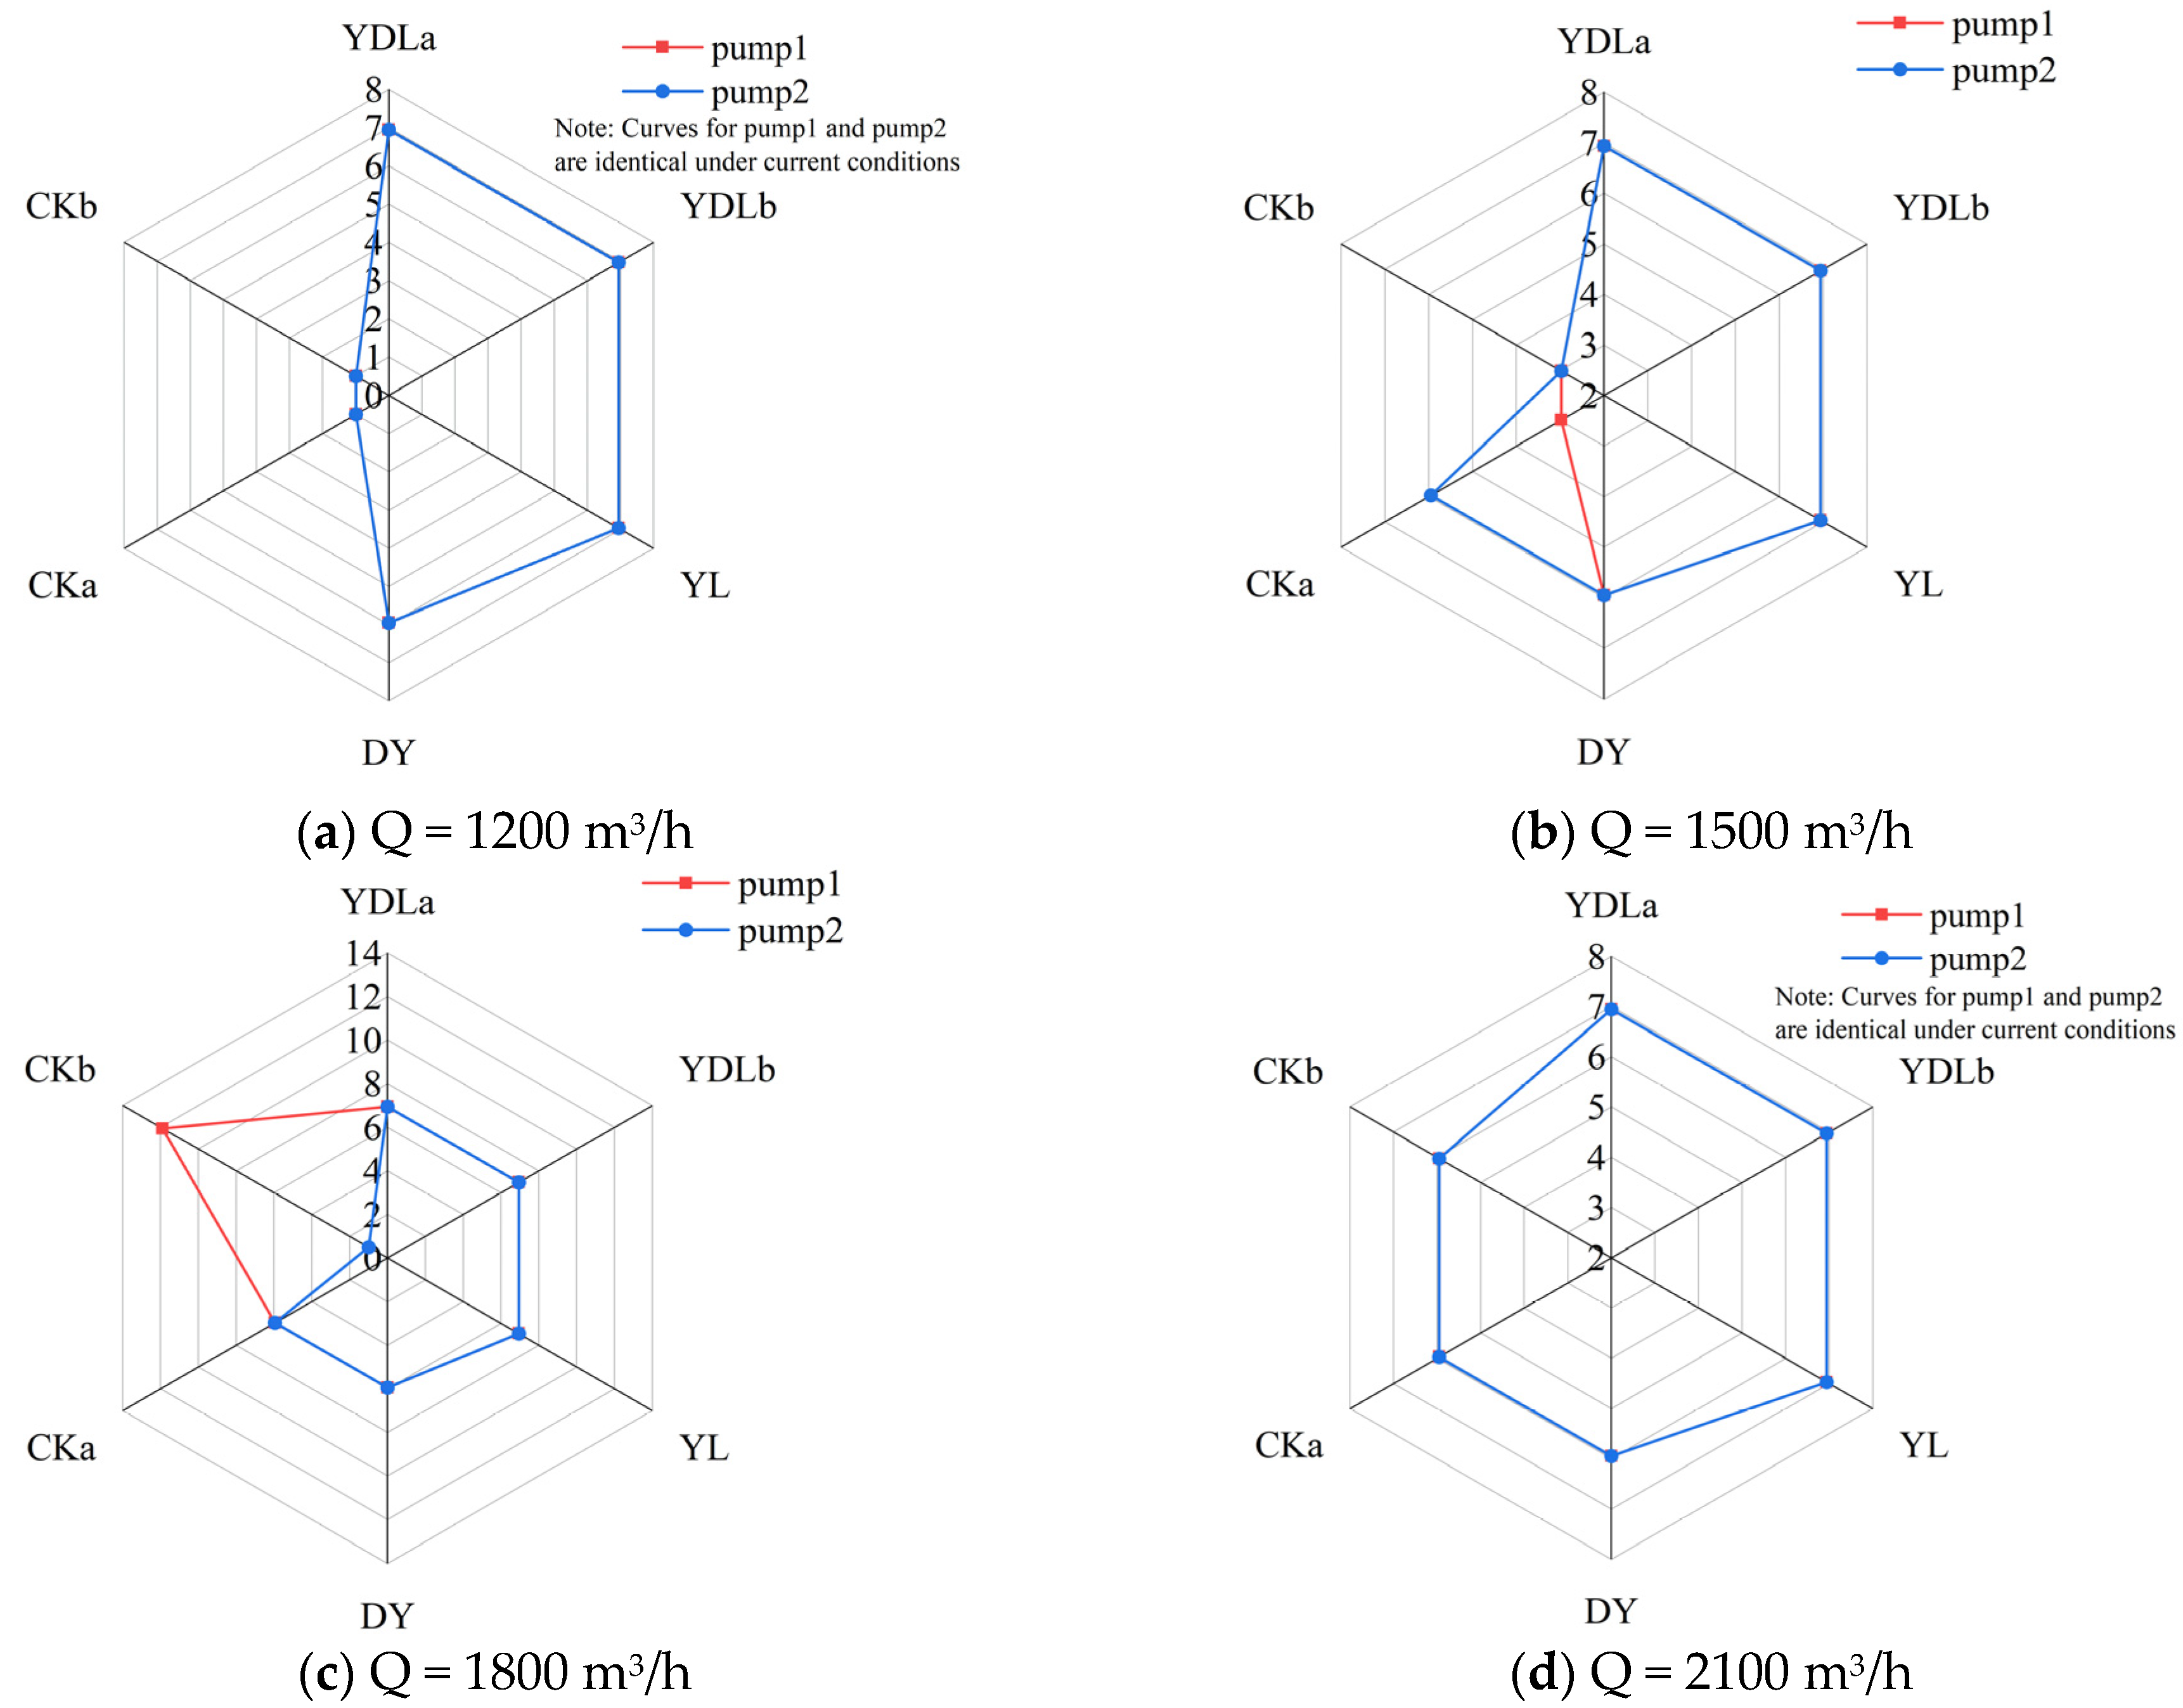
Figure 9, and the ratios of dominant pressure pulsation frequencies to the rotational frequency (f/f
n) are presented in
Figure 10.
From
Figure 9 and
Figure 10, the pressure pulsations at the inducer (YDL), impeller (YL), and guide vane (DY) monitoring points exhibit distinct periodic patterns. In contrast, pressure pulsations at the outlet section (CK) show greater instability, with periodic characteristics partially disrupted.
The dominant pressure pulsation frequencies at corresponding positions (inducers, impellers, and guide vanes) of both LNG pumps are identical, indicating no operational discrepancies between the two pumps. As the pump flow rate increases, the amplitudes of pressure pulsations at corresponding positions decrease sequentially, while the frequency distribution remains unaffected. The dominant frequency of pressure pulsations at the inducer and impeller is seven times the rotational frequency (7 × fn), which corresponds to the seven guide vane blades. This indicates that the pressure pulsations are dominated by the guide vanes. The periodic disturbances generated by rotor–stator interactions from the seven guide vane blades propagate upstream through reverse flow, causing the dominant frequency of pressure pulsations at the inducer and impeller to align with the guide vane blade count (7 × fn) rather than the inherent frequencies of the impeller (6 blades, 6 × fn) or inducer (3 blades, 3 × fn). For the guide vanes, the dominant pressure pulsation frequency is six times the rotational frequency (6 × fn), governed by rotor–stator interactions with the six-bladed impeller.
The dominant frequency characteristics of the pressure pulsation obtained from the simulation match the experimental observations of Cui et al. [
8].
Cui et al. [
8] pointed out that the dominant frequency of pulsation at the impeller outlet of a multistage centrifugal pump is the blade passing frequency (BPF) and its harmonics; the dominant frequency in the guide vane region of this paper is 6 × f
n (
Figure 9), which is precisely the BPF of the six-blade impeller (BPF = number of blades × f
n = 6 × f
n). This consistency confirms that rotor–stator interaction is the primary excitation mechanism for pressure pulsation.
In the outlet sections of both pumps, pressure pulsations under different flow rates are more unstable compared to other components. Within the outlet section, monitoring point CKa (closer to the guide vanes) exhibits greater stability than CKb (located farther from the guide vanes). As the distance from the guide vanes increases, the influence of the pump itself on the outlet section becomes more pronounced. Although the dominant pulsation frequencies in the outlet sections remain governed by internal pump components, the spatial positional differences between the two pumps relative to the base result in significant variations in pressure pulsation amplitudes at corresponding outlet positions under identical flow rates. Simultaneously, it can be clearly seen that at a flow rate of 1200 m3/h, the pressure pulsation amplitude in the outlet section increases significantly compared to the standard operating condition. The abnormally low flow rate under non-normal operating conditions will markedly increase system vibration.
In summary, the pressure pulsations within LNG pumps are predominantly dictated by rotor–stator interactions and reverse pressure propagation. During dual-pump parallel operation, both pumps operate stably without excessive mutual interference.
3.3. Analysis of Flow Field Above the LNG Pump Base
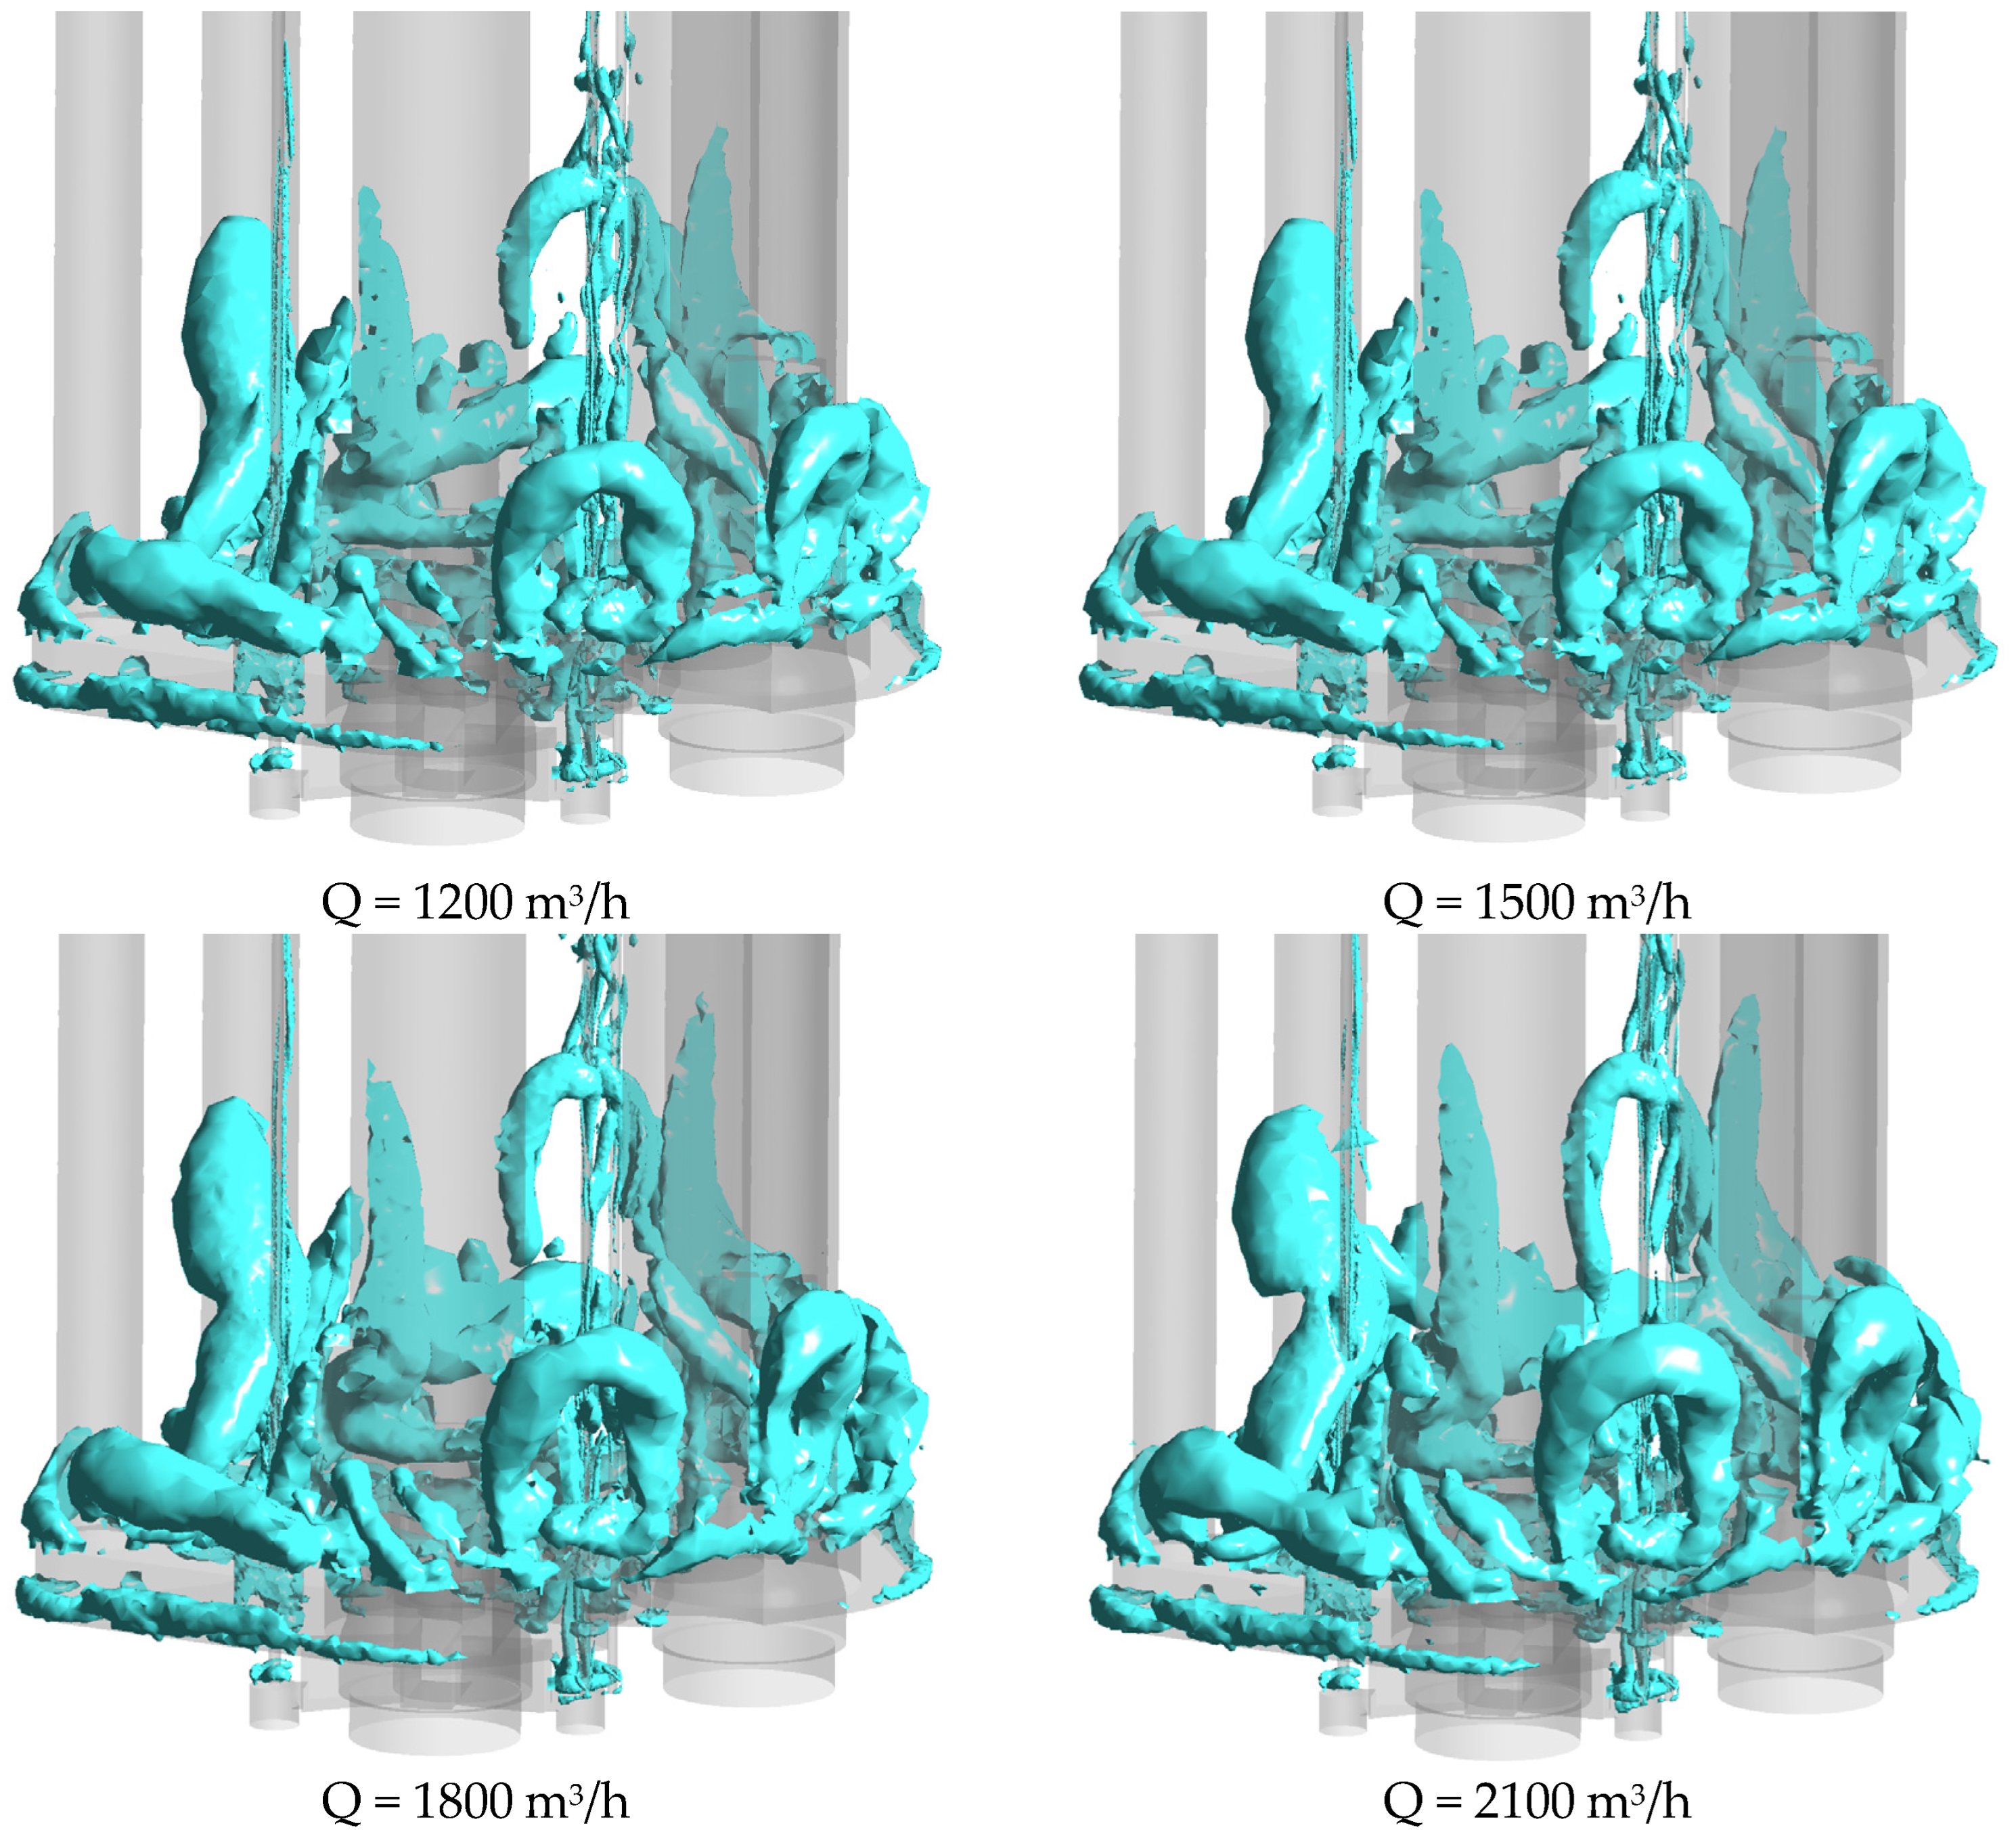
The upper region of the LNG pump tower base features a complex geometric structure that significantly influences LNG flow. The Q-criterion (Q = 20 s
−2) was applied to analyze vortices around the LNG pump base, and vortex structures were identified using this threshold. Vortex structure diagrams under different flow rates are shown in
Figure 11.
Observations from
Figure 11 reveal that due to the flow obstruction caused by the complex geometry above the base, vortices of varying sizes primarily cluster around tubular regions of the base (e.g., the outlet sections of LNG pumps) and the exterior of irregular structures on the base. Few vortices are observed beneath the pump tower base, with those present concentrated near the lower edges, primarily induced by edge flow separation. A comparative analysis across the three flow rates shows that the total number of vortices increases with higher flow rates, though their spatial distribution remains largely unchanged.
A monitoring plane (Plane2) was established above the base to facilitate flow pattern analysis, as illustrated in
Figure 12.
Velocity contours and streamline diagrams for the three flow rates on the Plane2 cross-section are extracted and shown in
Figure 13.
From
Figure 13, the velocity distribution on the P2 cross-section is notably more uneven compared to the inlet region. Low-velocity zones dominate areas corresponding to the base structure, while high-velocity regions are localized near the base edges. Comparing the three operating conditions, the overall velocity magnitudes increase with higher flow rates, but the non-uniform velocity distribution persists. Streamline patterns reveal distinct vortices and flow separation, particularly at 1200 m
3/h, where vortices encircle the tubular structures on the base. As the flow rate increases, the vortices weaken, and streamlines become smoother.
In summary, the irregular geometry of the pump tower base—including structural corners, cylindrical peripheries, and boundary edges—promotes vortex generation and flow separation. However, the induced vortices exhibit low intensity across all operating conditions, exerting minimal impact on pump tower performance.
4. Conclusions
This study investigated inlet flow characteristics. Pressure pulsation evolution mechanisms were analyzed. Their operational stability impacts were assessed. CFD simulations were combined with vortex dynamics theory. Spectral analysis was also used. Flow patterns were systematically examined. This included patterns within pumps, near inlets, and around the base.
Key conclusions follow. Head differences between pumps are minimal during parallel operation. This indicates strong synchronization. The inlet flow field shows favorable patterns. Velocity distribution is uniform. No significant vortex structures exist. This is under Q = 20 s−2 threshold. However, local low-velocity zones exist beneath the base. These may become flow separation regions at low flows.
Pressure pulsations propagate toward inlets. Their energy is low. Only points directly below inlets detect periodic pulsations. These match the impeller’s rotational frequency. Internal pump disturbances thus have limited inlet impact. Complex structures exist above the base. These include tubular regions and irregular protrusions. They induce localized flow separation. Small-scale vortices are generated. Vortex intensity is low. Minimal influence on system stability occurs. Flow rate increases from 1200 to 2100 m3/h. This improves streamline smoothness. Localized flow separation intensity reduces.
Internal pressure pulsations have dominant frequencies. These are governed by dynamic interactions. Moving components include inducers, impellers, and guide vanes. Outlet section pulsations show greater irregularity. They are influenced by internal components. Spatial positional effects also contribute. Pulsation characteristics differ between pump outlets. These differences may challenge system stability.
Based on the flow field analysis results, the following engineerable improvement measures are proposed:
- (1)
Modify the right-angled edges in the low-velocity region shown in
Figure 13 into an arc transition; to reduce flow separation downstream of the tubular structure, thereby suppressing vibration.
- (2)
Avoid long-term operation in the low flow rate range of 1200–1500 m
3/h. Within this range, the pressure pulsation amplitude increases abruptly, and the head difference between dual pumps has already increased (based on the head-flow curve in
Figure 3), which will further amplify system instability.
Author Contributions
Conceptualization, W.S.; Writing—original draft, J.L. and Y.Z.; Writing—review & editing, Y.L.; Project administration, Z.W. All authors have read and agreed to the published version of the manuscript.
Funding
This research was funded by the Joint Open Research Fund Program of State 381; the Key Laboratory of Hydroscience and Engineering and Tsinghua-Ningxia Yinchuan Joint 382; and the Institute of Internet of Waters on Digital Water Governance (sklhse-2024-Iow07).
Data Availability Statement
The original contributions presented in this study are included in the article. Further inquiries can be directed to the corresponding author.
Conflicts of Interest
The authors declare no conflict of interest.
References
- Yang, J. Analysis of Sustainable Development of Natural Gas Market in China. Nat. Gas Ind. B 2018, 5, 644–651. [Google Scholar] [CrossRef]
- Zheng, M.; Wang, P.; Zhong, C. Forecast of China’s Natural Gas Demand from 2020 to 2030. China Min. Mag. 2021, 30, 7–13. [Google Scholar] [CrossRef]
- Independent Research and Development of LNG Cryogenic. Available online: https://trqgy.paperonce.org/en/#/digest?ArticleID=10439 (accessed on 6 May 2025).
- Han, C.; Li, Y.; Cheng, H. Effect of Matching Parameters Between Impeller and Guide Vane Width on Pressure Pulsation Characteristics of LNG Pump. Mech. Sci. Technol. Aerosp. Eng. 2024, 43, 1359–1366. [Google Scholar] [CrossRef]
- Peng, C. Optimization and Improvement of Multiple LNG High-Pressure Pumps in Parallel Operation. Nat. Gas Ind. 2019, 39, 110–116. [Google Scholar]
- Luo, Q.; Shen, X.; Ding, S.; Zhou, L.; Xu, J. Structural Modeling and Strength Analysis of the Pump Tower of LNG Carrier Based on Multi-Load Combined Action. Ship Eng. 2024, 46, 67–74,82. [Google Scholar] [CrossRef]
- Wang, C.; Guo, L.; Liu, Z.; Zhang, Y.; Li, Z. Unsteady Flow Analysis Regarding Stall Flow and Rotating Cavitation in the First-Stage of a Multistage LNG Cryogenic Submerged Pump. Cryogenics 2023, 129, 103546. [Google Scholar] [CrossRef]
- Cui, B.; Zhang, Y.; Huang, Y.; Zhu, Z. Analysis of Unsteady Flow and Pressure Pulsation of Multistage Centrifugal Pump Based on Actual Size. Proc. Inst. Mech. Eng. Part A J. Power Energy 2024, 238, 1037–1050. [Google Scholar] [CrossRef]
- Yang, F.; Chang, P.; Li, C.; Shen, Q.; Qian, J.; Li, J. Numerical Analysis of Pressure Pulsation in Vertical Submersible Axial Flow Pump Device under Bidirectional Operation. AIP Adv. 2022, 12, 025107. [Google Scholar] [CrossRef]
- Jiang, Y.; Li, H.; Hua, L.; Zhang, D. Three-Dimensional Flow Breakup Characteristics of a Circular Jet with Different Nozzle Geometries. Biosyst. Eng. 2020, 193, 216–231. [Google Scholar] [CrossRef]
- Xu, L.Z.; Hansen, A.C.; Li, Y.M. Numerical and Experimental Analysis of Airflow in a Multi-Duct Cleaning System for a Rice Combine Harvester. Trans. ASABE 2016, 59, 1101–1110. [Google Scholar] [CrossRef]
- Chen, X.; Hou, T.; Liu, S.; Guo, Y.; Hu, J.; Xu, G.; Ma, G.; Liu, W. Design of a Micro-Plant Factory Using a Validated CFD Model. Agriculture 2024, 14, 2227. [Google Scholar] [CrossRef]
- Yun, L.; Yuan, X.; Xi’an, G.; Mingyu, Z. Analysis of Internal Flow Excitation Characteristics of Reactor Coolant Pump Based on POD. Ann. Nucl. Energy 2025, 216, 111286. [Google Scholar] [CrossRef]
- Yun, L.; Wu, Z.; Zhang, M.; Xu, Y. Research on the Transient Flow and Vortex Structure Evolution Mechanism of Reactor Coolant Pump under Non-Uniform Inflow. Ann. Nucl. Energy 2025, 217, 111346. [Google Scholar] [CrossRef]
- Cao, P.; Yue, R.; Zhang, J.; Liu, X.; Wu, G.; Zhu, R. Proper Orthogonal Decomposition Based Response Analysis of Inlet Distortion on a Waterjet Pump. Water 2024, 16, 1282. [Google Scholar] [CrossRef]
- Wang, W.; Qiu, G.; Pei, J.; Pavesi, G.; Tai, G.; Yuan, S. Effect of Return Channel on Performance and Pressure Fluctuation of Pump Turbine. Phys. Fluids 2024, 36, 105129. [Google Scholar] [CrossRef]
| Disclaimer/Publisher’s Note: The statements, opinions and data contained in all publications are solely those of the individual author(s) and contributor(s) and not of MDPI and/or the editor(s). MDPI and/or the editor(s) disclaim responsibility for any injury to people or property resulting from any ideas, methods, instructions or products referred to in the content. |
© 2025 by the authors. Licensee MDPI, Basel, Switzerland. This article is an open access article distributed under the terms and conditions of the Creative Commons Attribution (CC BY) license (https://creativecommons.org/licenses/by/4.0/).


