Article

Numerical Investigation of Subcooled Boiling Flow and Patterns’ Transitions in a High-Heat-Flux Rectangular Small Channel

1
Zhejiang Key Laboratory of Multiflow and Fluid Machinery, Zhejiang Sci-Tech University, Hangzhou 310018, China
2
State Key Laboratory of High-End Compressor and System Technology, Hefei 230031, China
*
Author to whom correspondence should be addressed.
Water 2025, 17(11), 1580; https://doi.org/10.3390/w17111580
Submission received: 15 April 2025 / Revised: 14 May 2025 / Accepted: 20 May 2025 / Published: 23 May 2025
(This article belongs to the Special Issue Hydrodynamics Science Experiments and Simulations, 2nd Edition)

Abstract

:
The escalating thermal demands of high-power electronic devices and energy systems necessitate advanced thermal management solutions. Flow boiling in small/micro channels has emerged as a promising approach, yet its practical implementation is hindered by flow instabilities and heat transfer deterioration under high-heat fluxes. This study presents a systematic numerical investigation of subcooled boiling flow and heat transfer in a rectangular small channel under high-heat-flux conditions, employing the VOF method coupled with the Lee phase change model. The increasing heat flux accelerates bubble nucleation and coalescence while reduced mass flux promotes early local slug formation, shifting flow transitions upstream and degrading thermal performance. A local vapor volume fraction threshold of αν = 0.2 is identified for the bubbly-to-sweeping flow transition and αν = 0.4 for the sweeping-to-churn transition. Furthermore, a novel dimensionless parameter β is proposed to classify dominant flow regimes, with critical β ranges of 12–16 and 24–32 corresponding to the two transitions, respectively. These findings provide new quantitative tools for identifying flow regimes and improve the understanding and design of compact boiling-based thermal management systems under extreme heat- flux conditions.

1. Introduction

The development of high-power, highly integrated electronic and energy systems has significantly increased heat-flux levels, creating urgent demands for advanced thermal management solutions. Conventional cooling techniques, such as air or single-phase liquid cooling, are no longer sufficient to cope with these extreme heat fluxes [1]. Phase change heat transfer technology, which utilizes boiling flow processes in small/micro channels for efficient heat dissipation, has emerged as a promising approach to address high-heat-flux cooling challenges. On the one hand, flow boiling enhances heat transfer efficiency by leveraging the substantial latent heat absorption during liquid–vapor phase change in forced convection systems. It offers superior thermal performance characterized by significantly higher heat transfer rates, reduced coolant mass flow requirements, and more uniform wall temperature distributions compared to single-phase cooling methods [2]. Furthermore, small/micro channels provide a superior surface-area-to-volume ratio, allowing compact integration in thermal systems [3]. However, the practical implementation of small/micro channel phase change heat transfer technology faces critical challenges, particularly inherent flow instabilities in small channels and limitations imposed by heat transfer deterioration under high-heat-flux conditions. These technical barriers currently restrict the broader application and performance optimization of the boiling flow thermal management approach.
Phase change heat transfer in small/micro channels exhibits fundamentally different characteristics from conventional macro-scale systems due to pronounced size and structural effects. The structure and dimension of the channel significantly influence bubble dynamics, flow pattern transitions, and heat transfer characteristics. Kandlikar et al. [4] demonstrated that when the channel hydraulic diameter is reduced below 200 μm, surface tension-dominated flow characteristics substantially alter boiling mechanisms. The enhanced heat transfer was accompanied by the increasing flow instabilities. Jiang et al. [5] conducted experimental studies on water flow boiling in silicon-based triangular micro channels. They found that the micro channel size had significant effects on bubble nucleation and growth mechanisms at lower power inputs. Yin et al. [6] quantitatively characterized confined bubble growth in rectangular micro channels (300 μm height × 6 mm width) under high-heat fluxes (631–987 kW/m2) using advanced imaging techniques. They identified the key parameters including instantaneous diameter, maximum local void fraction, and contact angle. Their work demonstrated how isolated bubbles evolve into confined or elongated bubbles through coalescence. Recent research investigated how channel shape, dimensions, and structured surfaces affect boiling behavior. Ma et al. [7] systematically studied the effects of rectangular channel dimensions on the bubble dynamics and boiling heat transfer characteristics. A channel with the size of 0.5 mm suffered severe bubble coalescence and heat transfer deterioration. Additionally, the excessive spacing of 2.5 mm reduced bubble turbulence and weakened the heat transfer performance. Recent innovations in micro channel design showed promising performance improvements. Xie et al. [8] introduced rigid filamentary tail structures downstream of ribs, achieving an enhanced flow boiling performance under heat fluxes of 50–300 kW/m2. Although the rigid tail structure was beneficial to maintain the small bubble sizes and uniform distribution in the mainstream, the pressure drop was increased accordingly. Li et al. [9] investigated the transcritical flow and heat transfer mechanism for methane in a zigzag channel. The heat transfer coefficients were superior compared to straight channels, with only modest pressure drop penalties. Surface modification strategies have also proven effective. Chen et al. [10] developed gradient-distributed surface micro textures that improved the overall heat transfer evaluation coefficient by 36.5% compared to uniformly textured micro channels. Zhang et al. [11] investigated the boiling heat transfer performance, pressure drop, and flow pattern in ribbed micro channels with porous sidewalls. Compared with the conventional ribbed channels, the porous-ribbed designs showed remarkable heat transfer enhancement. Song et al. [12] used experimental methods and numerical simulations to study the dynamic behavior of M-shaped jumpers in a gas–liquid two-phase flow. The results showed that there were multiple coexisting flow modes; among which, flow parameters significantly affected pressure fluctuations. Slug flow can cause strong vibrations, and higher liquid velocities can increase the speed, frequency, and length of the slug. The alternating large bubbles and clustered flow generate a large amount of pulsation, resulting in low-frequency vibration, usually manifested as a flapping phenomenon. Shu et al. [13] analyzed the evolution and formation mechanisms of various convective flow patterns in annular water tanks heated by inner cylinders at different depths. The results indicated that, after flow instability, the basic flow can be divided into a second type of hydrothermal wave, standing wave, petal-shaped structure, and spoke type. The formation mechanisms of these four flow modes are all caused by phase lag between temperature and velocity fluctuations.
Beyond channel dimensions and structural configurations, operational conditions significantly influence boiling flow and heat transfer characteristics in small/micro channels. Sun et al. [14] experimentally investigated the evolution of flow patterns and heat transfer characteristics of deionized water in vertically oriented rectangular narrow channels (720 mm × 240 mm × 2.75 mm). Although the inlet temperature (50–90 °C), mass fluxes (4.04–24.24 kg/(m2·s)), and heat fluxes (3.32–64.12 kW/m2) substantially affected the spatial development of flow patterns, the fundamental trends in local heat transfer coefficients during flow regime transitions remained consistent. Brutin and Tadrist [15] focused on the boiling flow patterns of n-pentane in a rectangular micro channel with Dh = 0.889 mm. They further demonstrated the critical role of inlet conditions in determining both pressure drop and heat transfer performance during flow boiling. Katiyar et al. [16] identified the key parametric influences on bubble dynamics in a two-dimensional micro channel. The larger contact angles, higher wall superheats, and reduced pressures accelerated bubble growth, while surface tension predominantly affected bubble shape rather than growth rates. Gravity effects were systematically examined by Wang et al. [17] for R134a flow boiling in 1 mm horizontal channels with a heat flux of 20 kW/m2. The minimal flow pattern differences were revealed between normal and zero gravity conditions, though bubble distribution varied significantly. Remarkably, the heat transfer coefficient maintained consistent trends with vapor quality across gravity conditions. Wang and Chen [18] dramatically demonstrated the exceptional heat removal capability and micro-bubble emission boiling (MEB) in trapezoidal micro channels with Dh = 155 μm. The MEB enabled heat-flux removal up to 14.41 MW/m2 at 883.8 kg/(m2·s) with only a moderate wall temperature rise. Zhu et al. [19] examined the narrow gap channels with heights of 0.5–2 mm and mapped the progression from bubbly to churn-annular flows with increasing heat flux. The critical heat flux was found to be enhanced with both mass flux and gap height. These studies collectively reveal the complex but potentially controllable nature of a small/micro channel phase change heat transfer. The operational parameters can be strategically tuned to optimize performance. He et al. [20] accurately and efficiently assessed the dynamic behavior of an isolated slug driven by pressurized air in a voided line with an end orifice. The dynamic variation in the pressure at both the tail and front of the slug, the variation in the slug length, and the frictional resistance coefficient in the model were obtained by three-dimensional (3D) computational fluid dynamics (CFD). Tan et al. [21] proposed a new numerical simulation method for complex gas reservoir water invasion units based on intelligent agents and optimal control theory, which provides new insights into water transport in water invasion channels. Song et al. [22] proposed an improved shadow-based imaging method, combined with a ray-tracing algorithm, for the 3D reconstruction of a bubble microstructure.
The boiling flow patterns in small/micro channels exhibited distinct size-dependent characteristics that significantly influenced their heat transfer performance. The predominant flow regimes included bubbly, slug, annular, and mist flows, along with special patterns like a sweeping flow under specific conditions [23]. The accurate characterization of these flow patterns remains both crucial and challenging for optimizing the phase change heat transfer in small/micro channels. Current research employs diverse approaches ranging from experimental visualization to advanced computational techniques. Based on the visualization data, mechanical models, and empirical formulas, Gu et al. [24] developed new flow pattern transition criteria and heat transfer correlations for vertical rectangular narrow channels. Revellin et al. [25] employed advanced optical measurement techniques to characterize two-phase flow patterns in microtubes. They established a quantitative framework for flow regime identification through the systematic analysis of bubble dynamics parameters including nucleation frequency, coalescence rates, size distribution, and translational velocities within micro-evaporator configurations. Wilmarth and Ishii [26] utilized charge-coupled device (CCD) camera systems to systematically map flow regimes in rectangular channels with gaps of 1 and 2 mm. Four distinct patterns in vertical flows and five in horizontal configurations along with their transition zones were identified. Chalgeri and Jeong [27] combined electrical impedance tomography with digital image analysis to study air–water flows in 2.35 mm rectangular channels. The mechanical models for flow regime transitions in downward flows were developed and the criteria was compared to a flow regime map under ambient temperature and pressure conditions. Viggiano et al. [28] applied proper orthogonal decomposition (POD) to characterize slug flows, deriving key parameters like slug frequency and length from spatiotemporal mode information. However, Oliveira et al. [29] employed fast Fourier transform (FFT) analysis to identify characteristic pressure drop frequencies under various flow boiling conditions.
Current research on boiling flow and heat transfer in small/micro channels faces several critical limitations that hinder its comprehensive understanding and practical applications. Although significant progress has been made in flow pattern characterization, existing studies predominantly focus on micro channel or low-heat-flux conditions. Under high-heat-flux conditions, experimental visualization becomes increasingly difficult due to rapid interfacial motion and optical distortion [4]. Moreover, existing models often lack generalizable methods for real-time flow pattern identification and predictive control [10]. Therefore, a more robust and quantifiable approach is needed to characterize flow regimes and optimize heat transfer in micro-scale boiling systems. In this context, the present study conducted a systematic numerical investigation of subcooled boiling flow in a rectangular small channel under high-heat-flux conditions. A VOF-based two-phase model incorporating the Lee phase change formulation was used to resolve bubble dynamics and phase distribution. A flow regime identification method based on local vapor volume fraction thresholds and a novel dimensionless parameter for classifying dominant flow patterns along the channel were proposed. Through comprehensive computational analysis, this work provides critical insights into the complex interplay between thermal-hydraulic parameters and two-phase flow dynamics, offering valuable guidelines for optimizing miniature cooling systems operating under extreme thermal loads.

2. Methodology

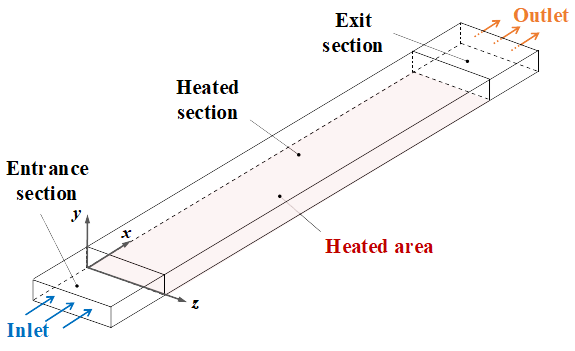
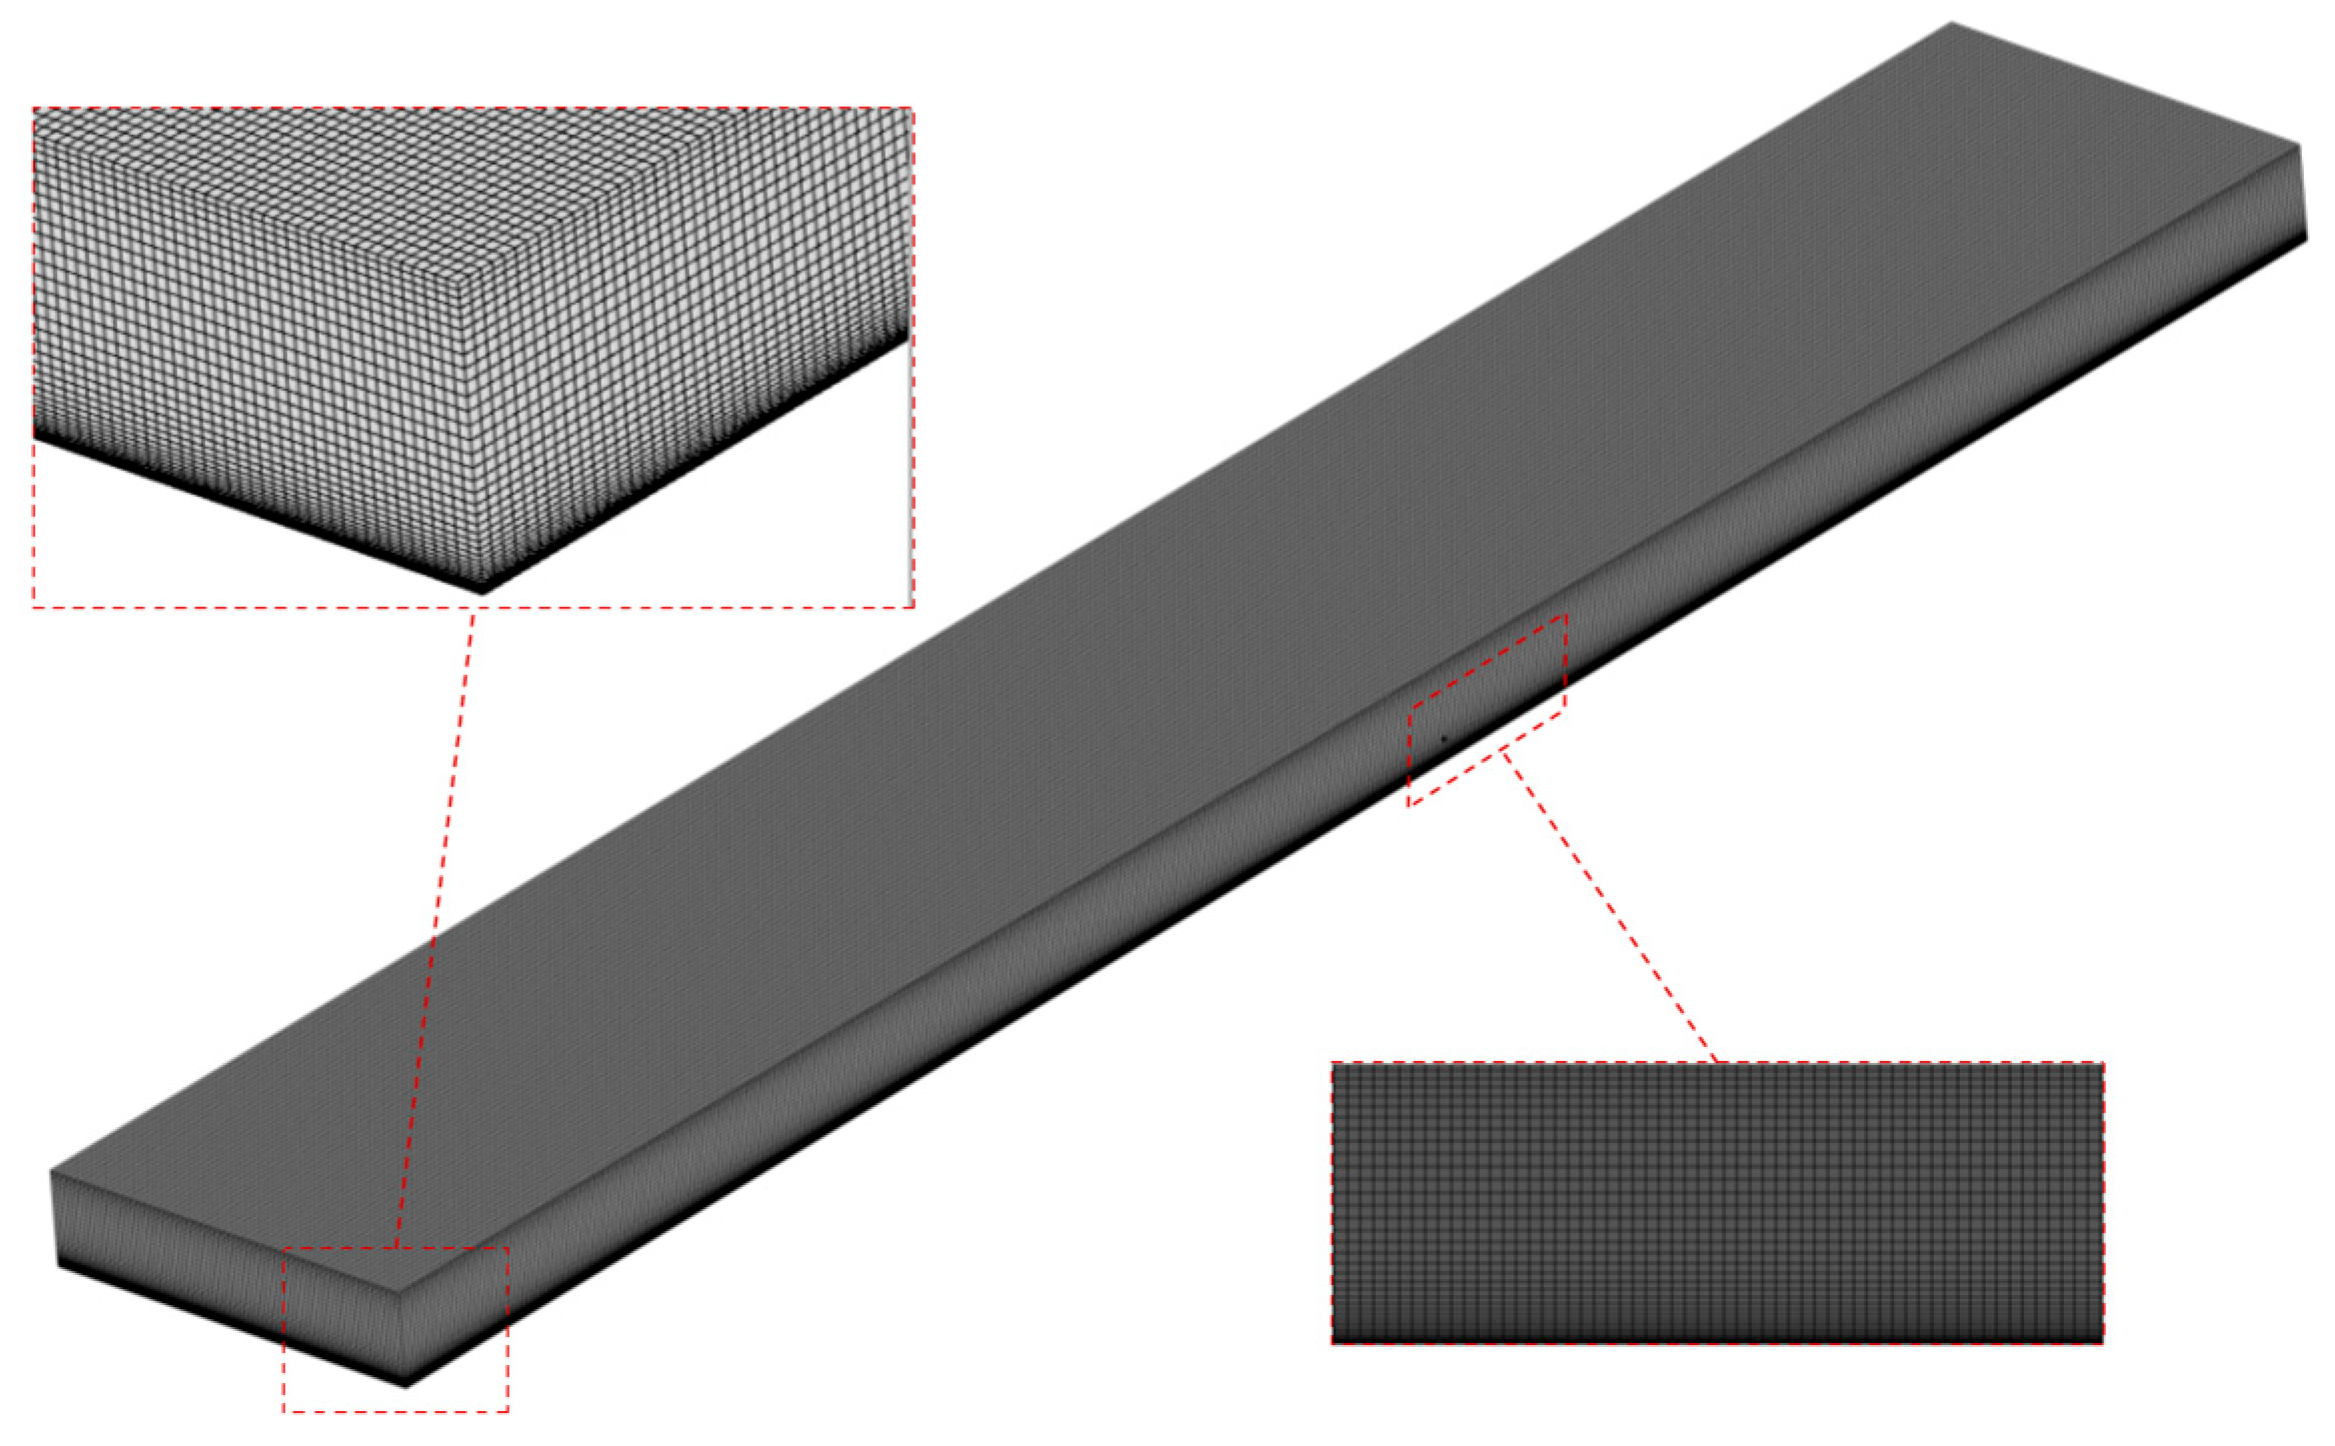
2.1. Grid Geometry and Boundary Conditions

The rectangular small channel geometry was selected for this study due to its ease of fabrication, predictable flow behavior, high surface-to-volume ratio, and numerical modeling advantages. Figure 1 illustrates the calculation domain and boundary conditions. The length, width, and height of the channel were L = 54 mm, W = 10 mm, and H = 2 mm, which are consistent with the experimental setup in Ref. [19]. The bottom surface, indicated in red, was subjected to a constant heat-flux boundary condition as the heated wall. To eliminate entrance effects and achieve a fully developed outflow, 10 mm extensions were added to both the entrance and exit sections. A mass-flux inlet condition and a pressure outlet condition were applied accordingly. Specifically, for the inlet boundary, a fixed total mass flux along with a uniform temperature corresponding to the subcooled liquid state were imposed. A low level of turbulence intensity of 5% and no artificial temperature fluctuations were specified at the inlet. All other surfaces of the calculation domain were set as non-slip and smooth walls with adiabatic conditions. The gravitational acceleration vector (g = 9.81 m/s2) acted in the negative y-direction of the defined coordinate system. The simulation conditions are summarized in Table 1.
Figure 2 shows the grid conditions of the calculation domain. The structured grid was applied to enhance the grid quality and contribute to convergence. A minimum grid size definition method was adopted to effectively achieve an ideal refinement in the boundary layer near the walls. As shown in the enlarged partial view, the grid near the heated wall was refined to capture the turbulent structures and wall heat transfer phenomena. After the grid refinement, the y+ near the heated wall was kept below 0.02.

2.2. Fluid Properties

The heated fluid in the rectangular small channel was deionized water. The temperature-dependent thermophysical properties for both phases (liquid/vapor), including dynamic viscosity μ, thermal conductivity λ, isobaric specific heat cp, density ρ, and surface tension σ, were implemented through third-order polynomial correlations with coefficients obtained from REFPROP data. The saturation temperature of water at 101.325 kPa was set as 100 °C.

2.3. Numerical Model

2.3.1. Governing Equations

The mathematical models employed in this simulation study are introduced in this paragraph. The two-phase flow was calculated based on the volume of fluid (VOF) method, which can track and describe the liquid–vapor interface behavior precisely by solving the continuity equation for the volume fraction α. The liquid and vapor phases correspond to the primary and secondary phases. The continuity equations for each phase are as follows:
( α l ρ l ) t + ( α l ρ l u ) = S l
( α v ρ v ) t + ( α v ρ v u ) = S v
where the subscripts l and v represent the parameters for liquid and vapor phases. The sum of their volume fractions keeps the unit in the control volume, namely, αl + αv = 1.
The VOF method treats the liquid and vapor phases as a single continuum medium, employing a shared momentum equation, given in Equation (3), to simulate two-phase flow behavior while neglecting inter-phase velocity slip.
( ρ u ) t + ( ρ u u ) = p + μ u + u T + ρ g + F v o l
The surface tension effects on liquid–vapor curved interfaces during boiling flow were modeled using the continuum surface force (CSF) approach, which transforms surface tension into a volumetric force incorporated as a source term in the momentum equation, as provided in Equation (3). The converted volumetric force is mathematically expressed as:
F v o l = σ α l ρ l κ l α l + α v ρ v κ v α v 0.5 ( ρ l + ρ v )
where the curvatures κl and κv of the liquid and vapor are defined as in Equation (5).
κ l = κ v = Δ α l α l
where αl is the local vapor volume fraction. The gradient ∇α is evaluated using a least-squares reconstruction method, which improves numerical robustness in high-aspect-ratio geometries. To further reduce spurious flows and interfacial smearing, an interface compression scheme is applied. Grid refinement is used near wall regions and channel corners to mitigate curvature estimation errors caused by large gradient variations.
In addition, the continuum liquid and gas phases also share an energy equation, as given in Equation (6):
( ρ E ) t + u ( ρ E + p ) = ( λ T ) + S E
where E is derived as a mass-averaged internal energy, as given in Equation (7).
E = α l ρ l E l + α v ρ v E v α l ρ l + α v ρ v
Under conditions of significant temperature differences between phases, the calculation accuracy of interfacial temperature fields can be severely compromised. The large thermal gradient induces anisotropic coefficients in the governing equations, resulting in substantial numerical errors. Therefore, the thermophysical properties φ of the fluid, including λ, μ, and ρ, were determined through volume fraction-weighted interpolation, as given in Equation (8).
ϕ = α l ϕ l + α v ϕ v

2.3.2. Turbulence Equation

The shear stress transport (SST) k-ω turbulence model was employed to simulate turbulent flow within the rectangular small channel. This model accounts for low Reynolds number effects while combining the advantages of both k-ω and k-ε models. Additionally, it demonstrates particular effectiveness in capturing turbulent characteristics and vortex dissipation phenomena during phase change processes.

2.3.3. Phase Change Model

The phase change process between liquid and vapor phases was simulated using the Lee model. This model considers the temperature difference between each computational cell and the saturation temperature as the primary driving force for phase transition. Specifically, liquid evaporation occurs when the local liquid temperature exceeds the saturation value (TTsat), while vapor condensation takes place when the vapor temperature falls below the saturation value (T < Tsat). The mass transfer rate between phases is governed by Equation (9) and implemented as a user-defined function (UDF) incorporated into the source terms of the governing equations.
S v = S l = r l α l ρ l ( T T s a t ) T s a t , T T s a t r v α v ρ v ( T T s a t ) T s a t , T < T s a t
In the Lee model, the mass transfer rates through the phase interface during the evaporation and condensation process are critically dependent on the evaporation coefficient rl and condensation coefficient rv. Increasing rl and rv may lead to numerical divergence, while decreasing them will increase the difference between the interfacial temperature and saturation temperature, which does not conform to physical laws [30]. For the selection of rl and rv, researchers mostly chose based on previous research experience and their own case studies. It is generally believed that, when the temperature difference between the phase interface and the saturation temperature does not exceed 1K, the rl and rv are more appropriate [30,31]. This study adopted rl = 102 s−1 and rv = 106 s−1 in the simulations, which referred to the numerical simulation example of flow boiling in a serpentine tube by Yang et al. [32] and the bubble condensation example by Liu et al. [33], respectively.
The phase change process involves concomitant heat absorption and release. The corresponding energy source term SE was determined by the latent heat of evaporation ilv through Equation (10).
S E = S l i l v

2.4. Solution Methods

This study employed ANSYS 2022 R1 Fluent coupled with UDF to numerically simulate the boiling flow phenomenon of subcooled water in a rectangular small channel. The governing equations were solved using the finite volume method (FVM). Transient calculations were performed to capture the flow pattern evolution during the liquid–vapor phase change. To conserve computational resources, steady-state calculations were first conducted to establish the initial flow conditions within the channel before proceeding to transient simulations. The resulting flow field from the steady-state solution served as the initial condition for the transient analysis. In this model, the time step exceeding 10−3 s was found to violate the local Courant number, leading to numerical instability and simulation divergence. To ensure both accuracy and computational efficiency, the bubble dynamics were systematically evaluated across varying time steps. Based on this analysis, a time step of 10−5 s was selected as it provided a sufficient temporal resolution to capture key interfacial phenomena while maintaining a reasonable computational cost. Given the significant influence of gravity and surface tension on liquid–vapor two-phase flow patterns, implicit body force treatment was incorporated to enhance numerical stability and convergence. Detailed numerical simulation settings are presented in Table 2.

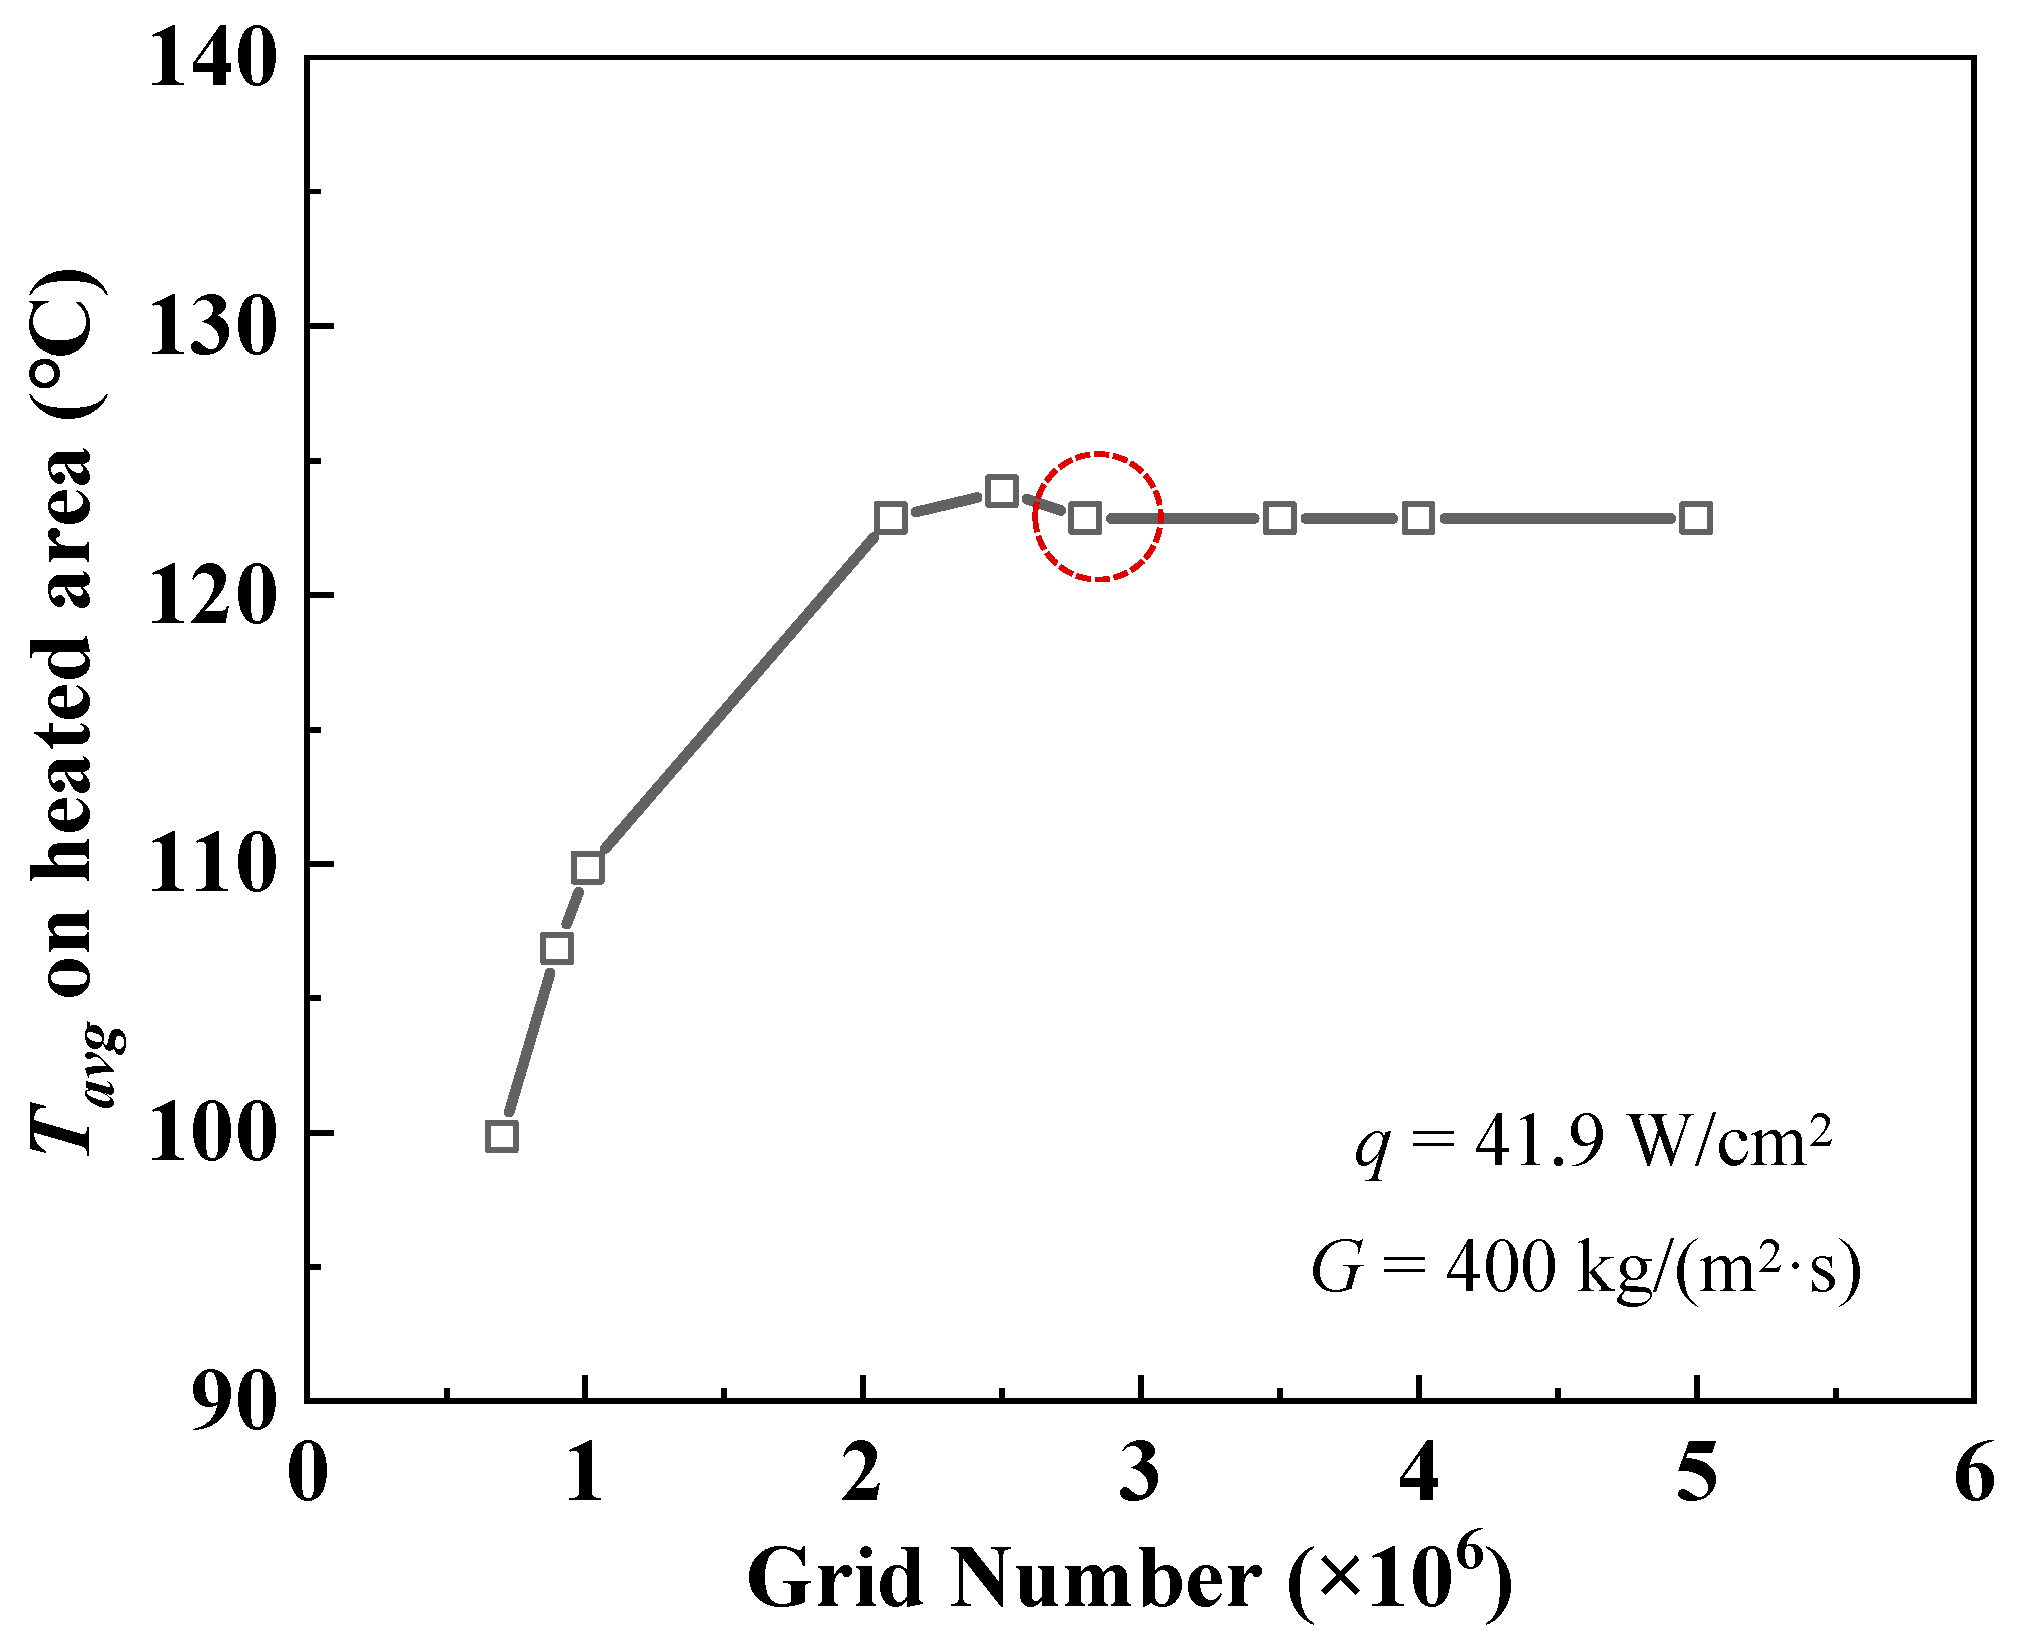
2.5. Validation of Grid Independence and Numerical Model

The calculation time and numerical accuracy were directly influenced by the grid resolution. Generally, a finer mesh improves numerical precision but at the cost of increased calculation effort. Therefore, a grid independence study was first conducted to determine the optimal mesh size. Under the operating conditions of G = 400 kg/(m2·s) and q = 41.9 W/cm2, nine different grid configurations were tested to simulate the boiling flow in the rectangular small channel. Figure 3 illustrates the variation in the average wall temperature Tavg of the heated area with an increasing grid number. The results showed that the Tavg initially rose as the grid number increased. However, when the grid number exceeded about 2.8 million, the Tavg stabilized, indicating that further mesh refinement had a negligible impact on the solution. Thus, it can be concluded that the grid number of about 2.8 million ensures sufficient calculation accuracy while optimizing calculation efficiency. The same grid configuration was adopted for numerical simulations under other operating conditions in this study.
To validate the reliability of the numerical model, qualitative and quantitative comparisons were conducted between the simulation results and experimental data provided in Reference [19]. Figure 4 presents the comparison between simulated liquid–vapor flow patterns and the corresponding visualization images under G = 400 kg/(m2·s) for different heat-flux conditions. The simulated channel section matched the field of view captured by the high-speed camera to ensure a consistent comparison. As shown in the figure, at q = 41.9 W/cm2, small discrete vapor bubbles were observed in the channel. These bubbles, originating from closely spaced nucleation sites, grew and coalesces upon contact, forming larger vapor structures that adhered to the heated wall. This merging behavior is typical in high-density nucleation regions under confined boiling conditions. When the heat flux increased to q = 90.5 W/cm2, the bubbles grew significantly. The elongated bubbles confined by the channel height emerged near the exit section, accompanied by liquid bridges connecting smaller bubbles. In addition, further increasing the heat flux to q = 178.4 W/cm2 led to shorter liquid bridges, axially elongated gas slugs, and a reduced number of irregularly shaped bubbles in the channel. Since the simulated flow patterns exhibited a strong agreement with the experimental visualization across all tested conditions, the validity and accuracy of the numerical model can be qualitatively confirmed.
Figure 5 compares the simulated and experimentally measured heat transfer coefficients at various monitoring points under G = 400 kg/(m2·s) for different heat-flux conditions. The four monitoring points were located along the intersection line between the heated area and the central axial plane, positioned at axial distances of 6, 20, 34, and 48 mm from the entrance of the heated section. These locations corresponded precisely to the axial positions of the embedded K-type thermocouples used for temperature measurements in the experiments. The results under the conditions of q = 41.9, 90.5 and 178.4 W/cm2 are denoted with the orange, blue, and green symbols. Error margins of ±20% are indicated with the dashed lines. As shown in the figure, the local heat transfer coefficient on the heated area increased with rising heat flux. The simulations systematically underestimated the experimental values, with the discrepancy becoming more pronounced at higher heat fluxes. Notably, the simulated heat transfer coefficients fell within ±20% of the measured data across all test conditions. This level of agreement quantitatively validated the reliability of the numerical model for predicting boiling heat transfer characteristics in the rectangle small channel.

3. Results and Discussion

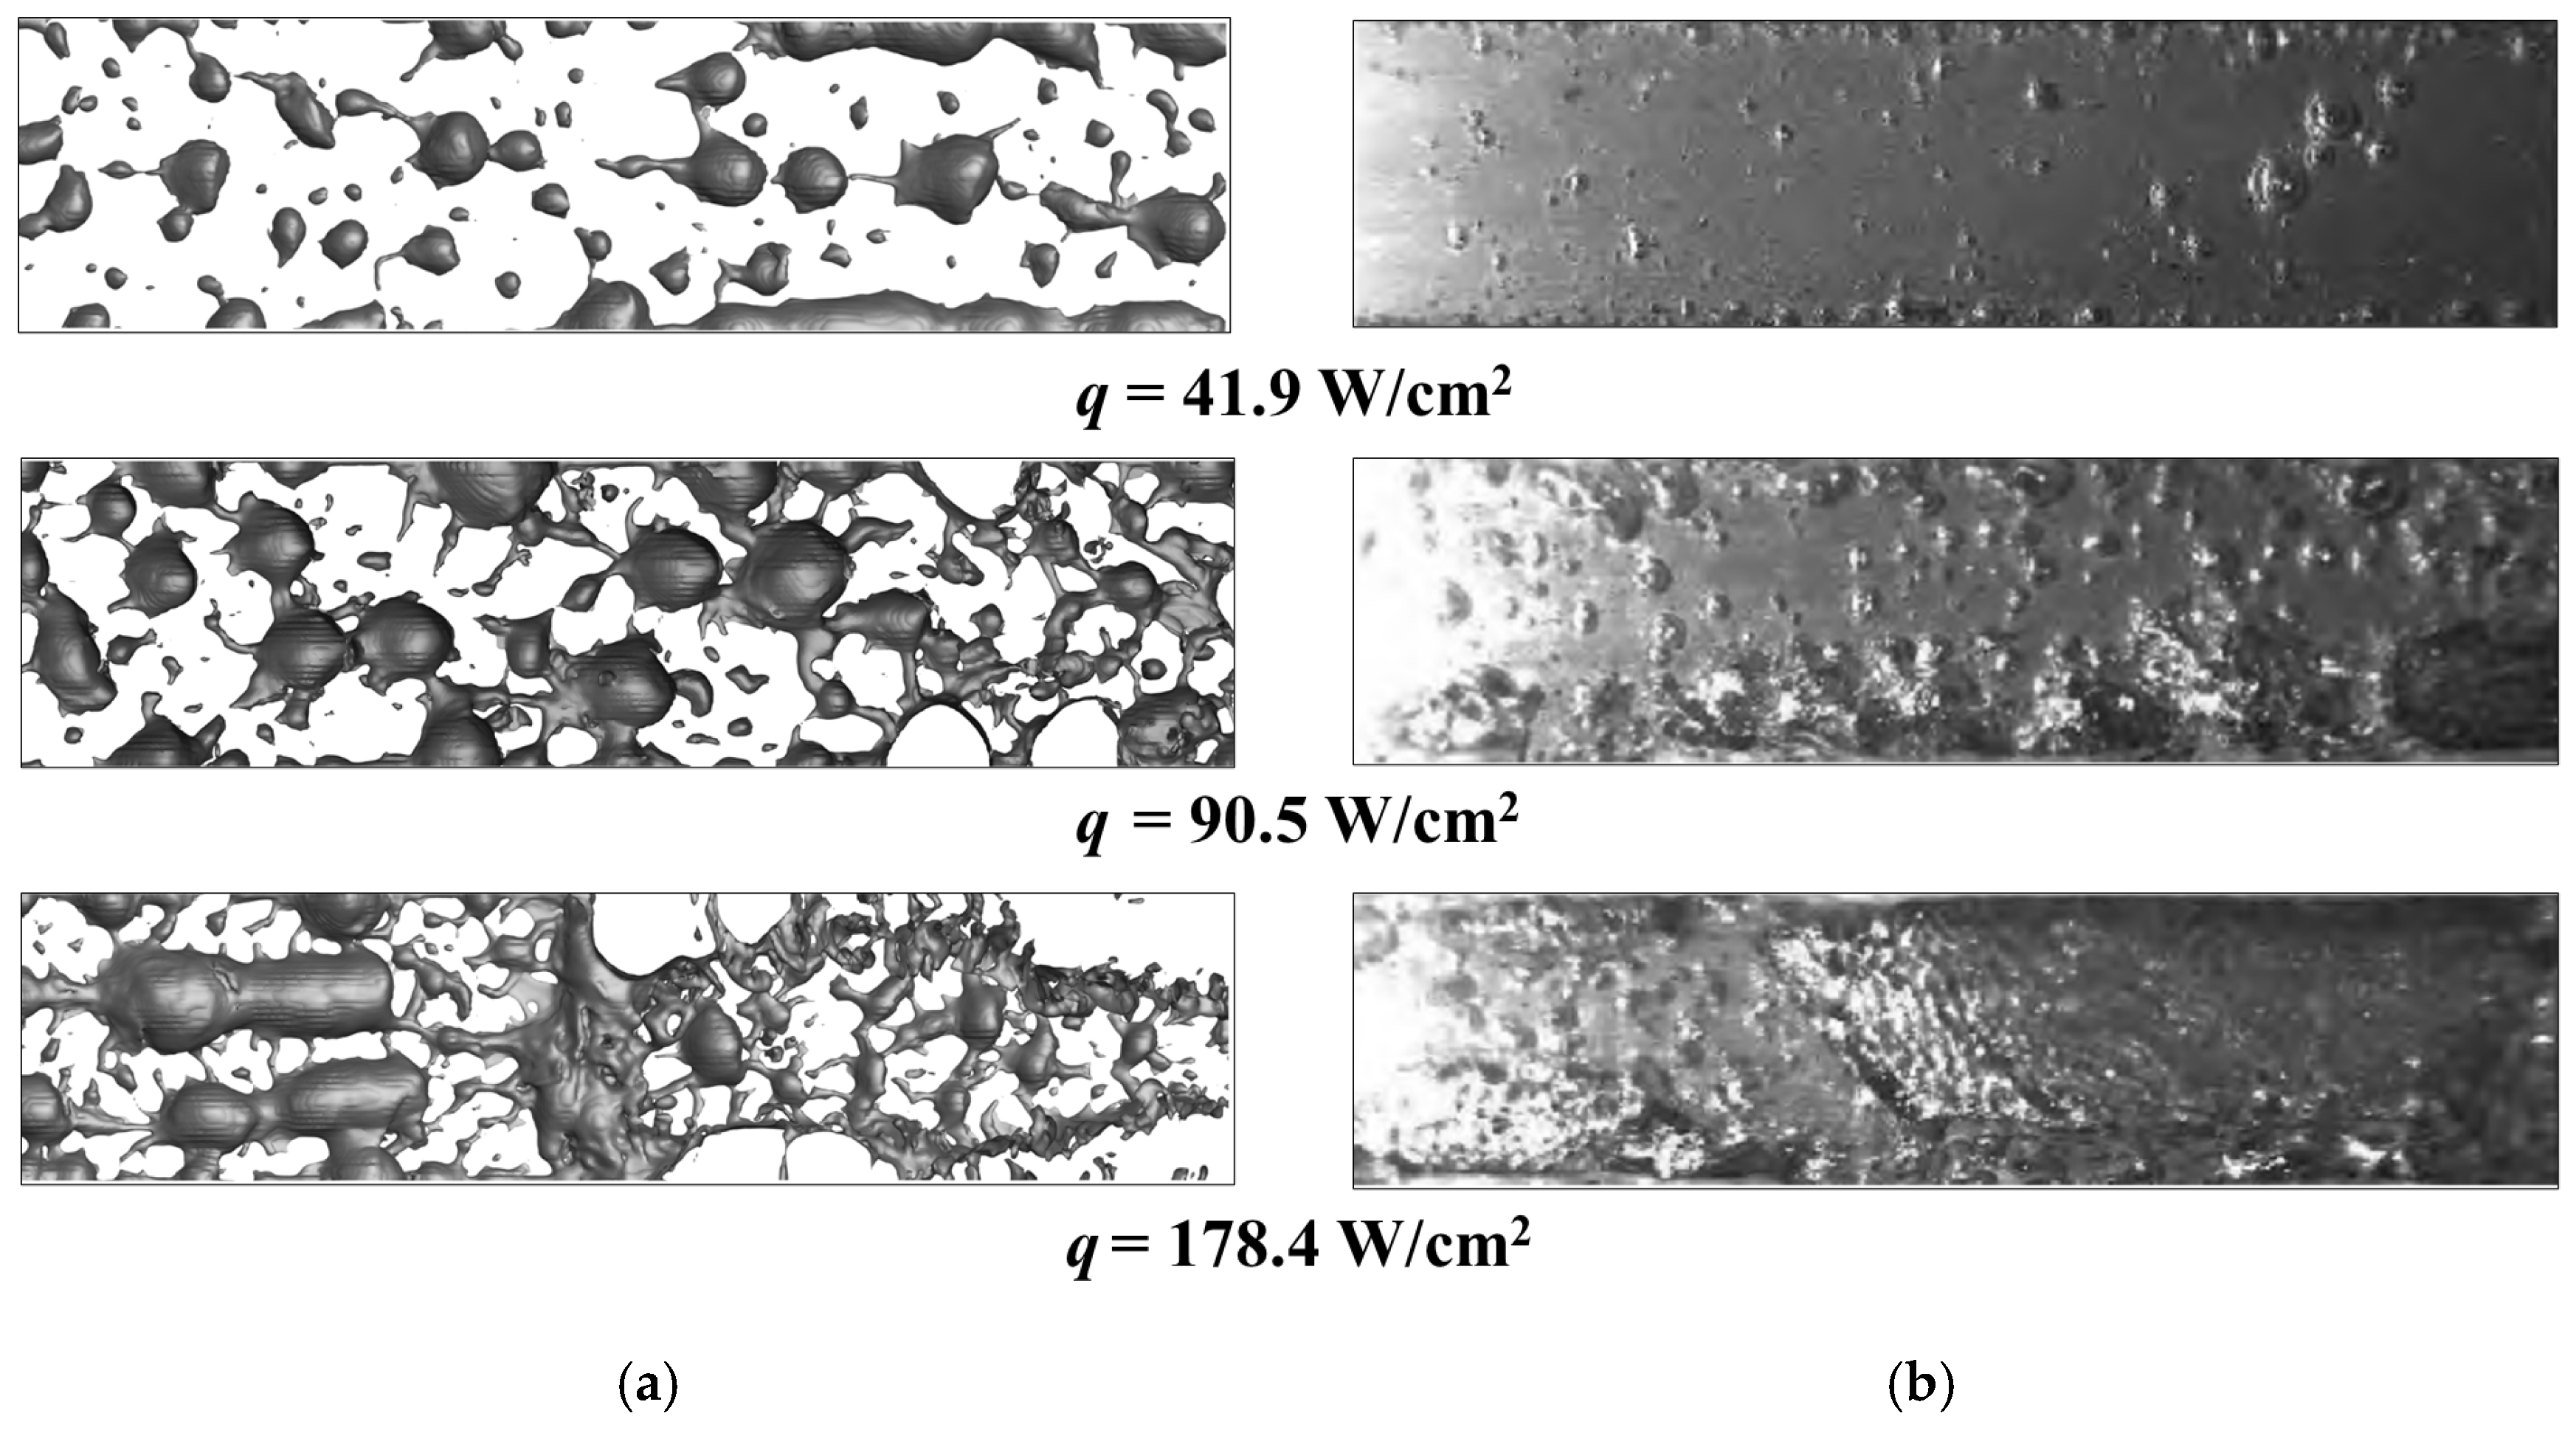
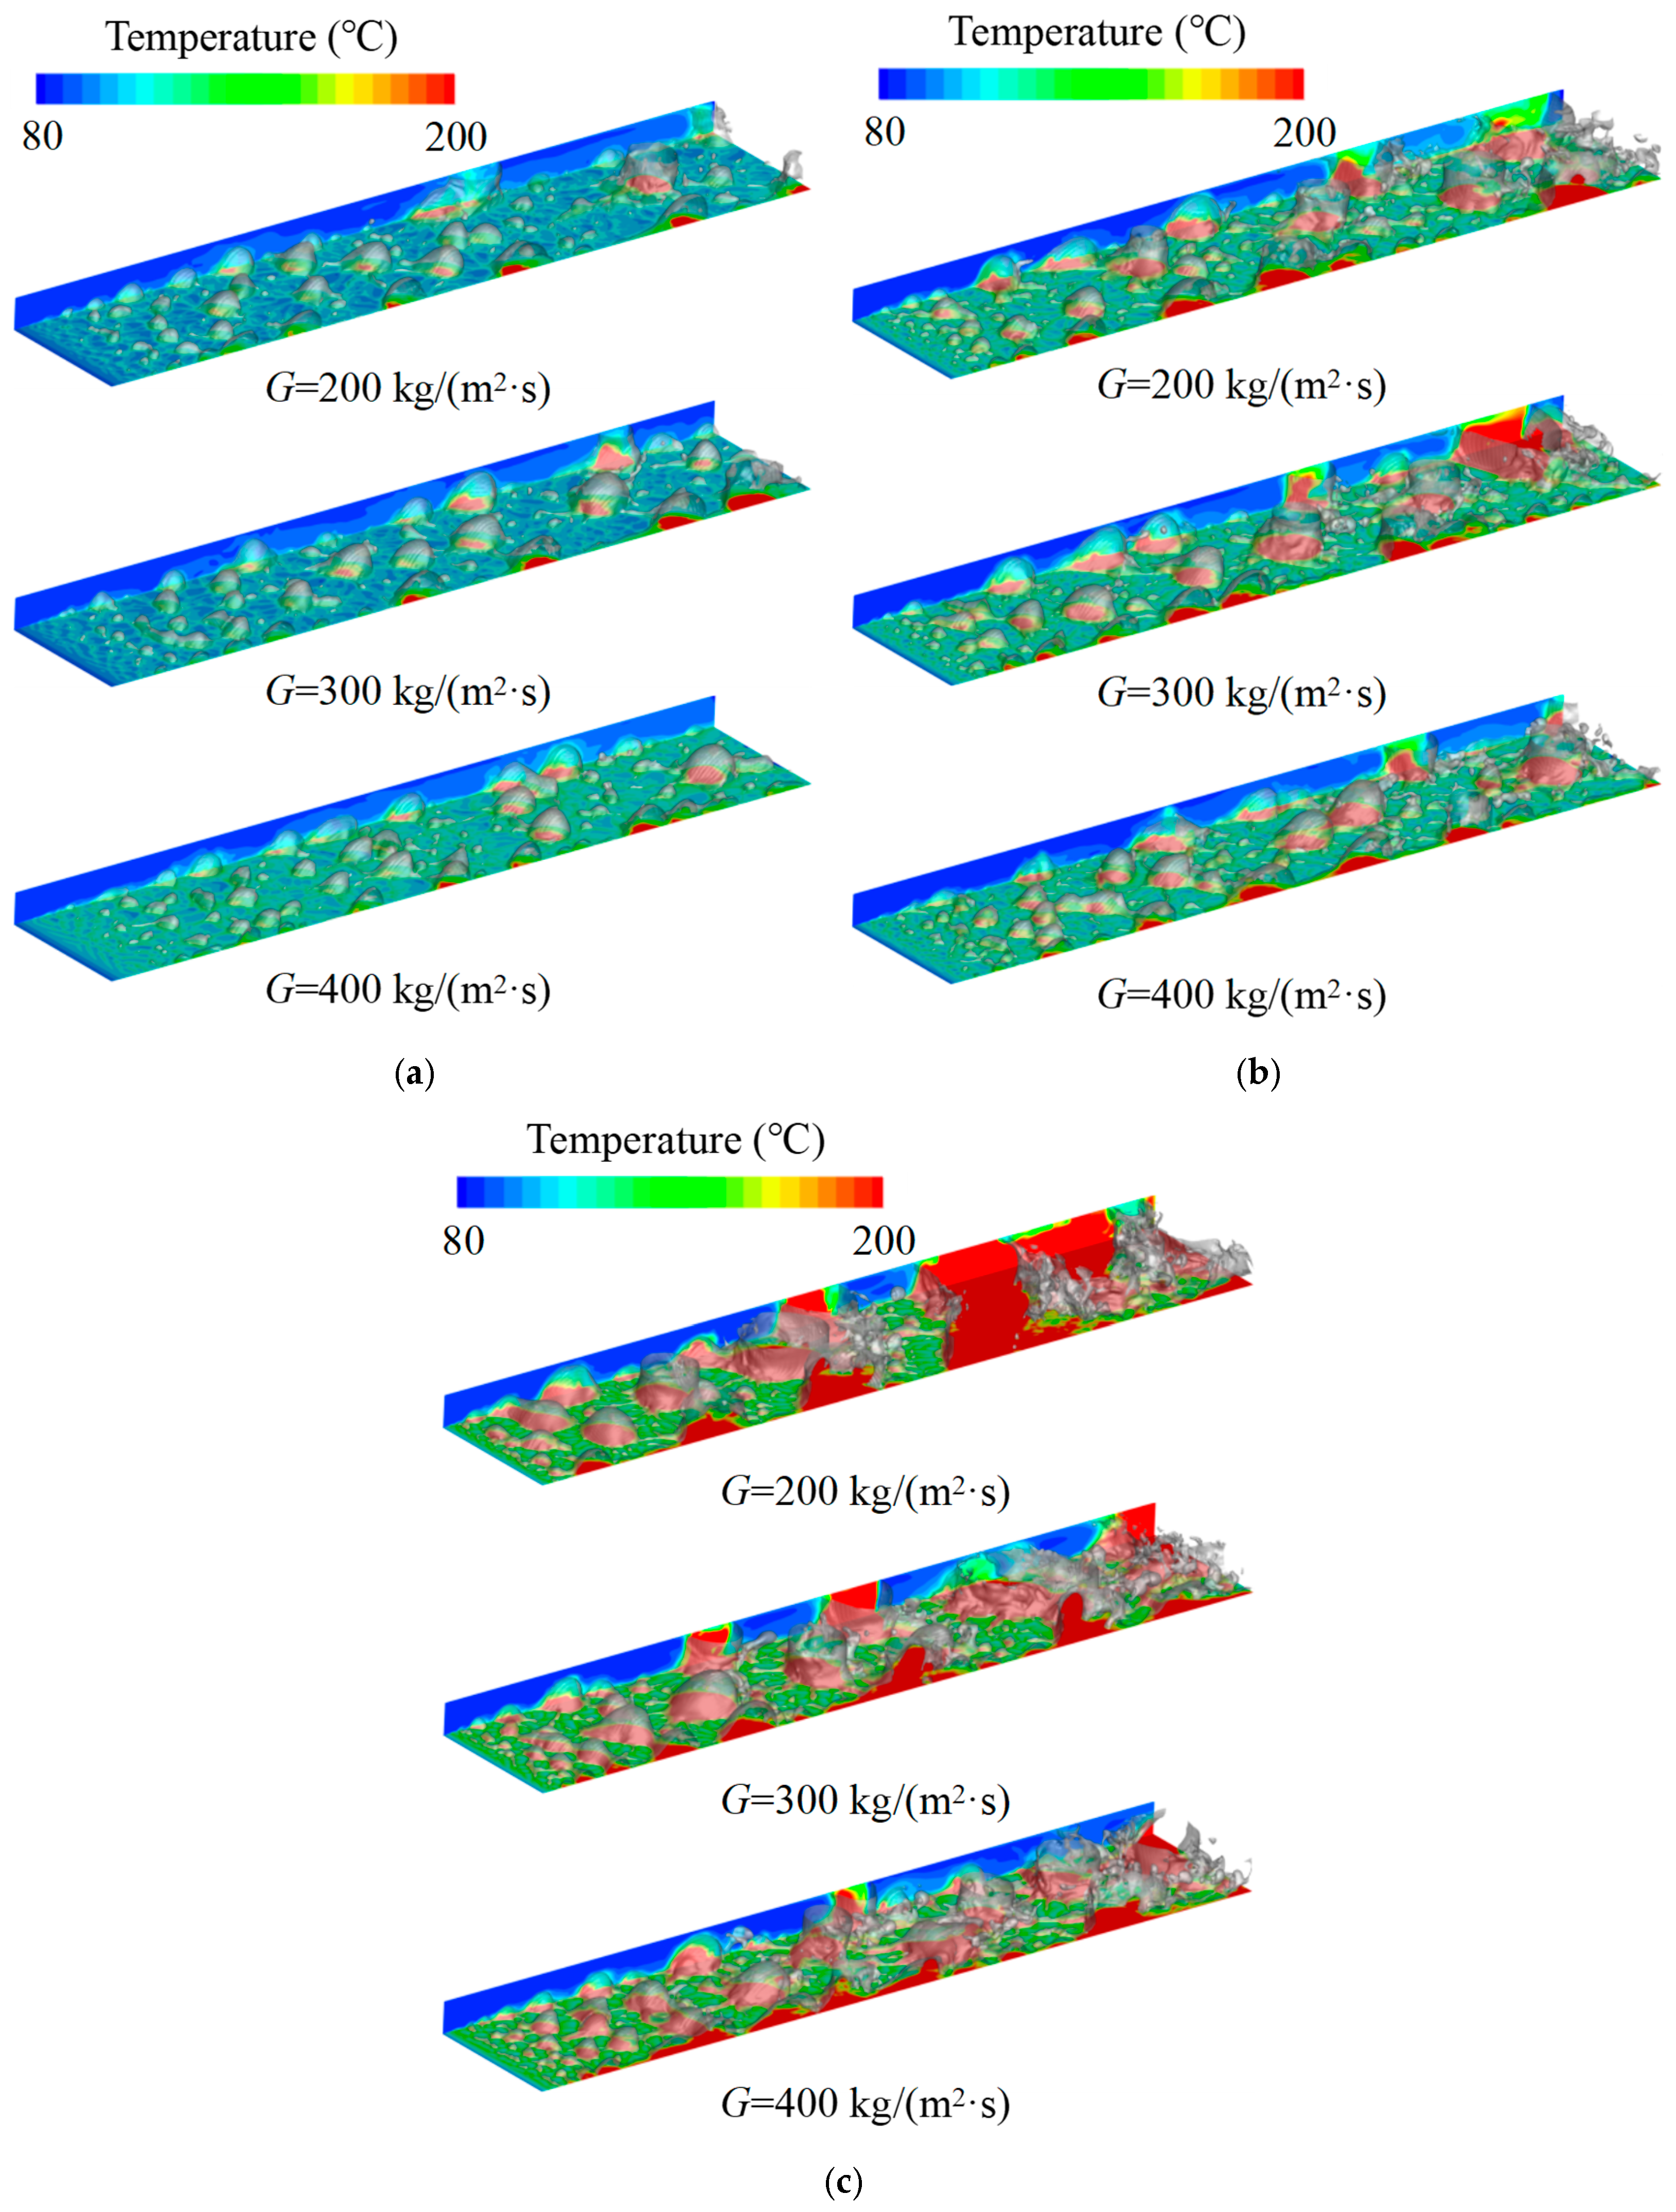
3.1. Boiling Flow Patterns Under Different Conditions

The boiling flow pattern within the rectangular small channel exhibited a strong dependence on the wall cooling intensity. Therefore, the fundamental investigation into boiling flow patterns was conducted first for this section. When subcooled water undergoes heating and phase transitions in the channel, the volumetric ratio of liquid and vapor phases as well as their spatial distributions vary significantly with operating conditions, such as heat flux and mass flux, resulting in distinct flow patterns. Under high-heat-flux conditions, the boiling flow behavior becomes particularly complex. The enhanced heating rate induces progressive flow pattern transitions along the axial direction of the channel, where different flow patterns may coexist simultaneously. In other words, the bubbles may initially nucleate near the inlet and develop to be fully evaporated toward the outlet section. This spatial evolution of flow patterns reflects the dynamic interaction between the phase change heat transfer and hydrodynamic development throughout the heated channel.
Figure 6, Figure 7 and Figure 8 illustrate the evolution of boiling flow patterns and corresponding wall temperature distributions within the channel under G = 400 kg/(m2·s) for q = 41.9, 90.5 and 178.4 W/cm2. The flow field characteristics within the entrance and exit extension sections are not presented in this analysis. The initial time t0 denotes an arbitrary reference instant after fully developed unsteady flow conditions were established. At this mass flux, the complete transit time for water through the heated section measured 135 ms. Thus, the unsteady calculations were conducted for a minimum duration of 135 ms before flow pattern observations commenced. This approach ensured the complete purging of the liquid–vapor phases from the channel that was established during the preceding steady-state calculation. In addition, the bubble dynamics over a full flow cycle could be clearly observed within a 140 ms timeframe. The bubble clusters of primary interest are highlighted with circular, dashed frames, with their temporal evolution indicated approximately by dashed trajectories marking their positions at different time instances.
As shown in Figure 6 for the relatively low q = 41.9 W/cm2, the bubble nucleation initiated consistently at the upstream location. The nucleation sites maintained remarkable temporal stability along the heated surface. The nucleated bubbles underwent downstream advection with the mainstream flow while exhibiting simultaneous growth and coalescence yet retaining an overall discrete distribution pattern. Therefore, the bubbly flow was dominated under this condition. The bubble tops demonstrated distinct downstream deflection due to mainstream flow interaction. However, their growth remained constrained by the condensation effects of the subcooled mainstream liquid, preventing the formation of detached discrete bubbles in the flow channel. The circular, dashed frame highlights a significant size-dependent dynamic where larger bubbles exhibited substantially higher sliding velocities compared to the downstream smaller counterparts, leading to frequent coalescence events as faster-moving bubbles overtook and merged with slower ones. This coalescence phenomenon became particularly pronounced near the side walls, where the combined viscous effects from both side and bottom surfaces reduced bubble mobility, facilitating the incorporation of faster-moving bubbles from the central flow region. In addition, the comparative analysis of the bubble distribution and temperature fields revealed distinct thermal characteristics. The wall regions beneath the bubbles showed significantly elevated temperatures compared to the inter-bubble zones, which maintained temperatures similar to the mainstream. This thermal contrast stemmed from the substantially lower thermal conductivity of vapor relative to liquid, creating localized thermal resistance and consequent heat transfer deterioration in bubble-covered regions. The impaired conductive heat transfer through vapor pockets resulted in these characteristic hot spots on the heated area.
As shown in Figure 7, under the higher heat-flux condition of q = 90.5 W/cm2, the bubbles attached to the heating surface exhibited significantly larger dimensions within the channel. The accelerated heating rate caused bubble nucleation to initiate further upstream. Following nucleation, the bubbles underwent rapid growth and coalescence, where the bubbly flow occurred. At the instant of t0 + 100 ms, the coalescence of three nose-shaped bubbles resulted in the formation of a large vapor slug whose upper interface contacted the channel ceiling, creating a localized flow obstruction. This kind of morphological feature typically indicates the transition from a bubbly to sweeping flow. However, the rectangular channel geometry, characterized by limited height but considerable width, prevented complete flow blockage as the liquid phase maintained continuous passage along both sides of the elongated bubbles. Compared to the relatively lower heat-flux condition (q = 41.9 W/cm2), the expanded vapor phase coverage caused more extensive high-temperature zones along the heated area, reflecting the greater proportion of bubble-influenced areas where heat transfer was impeded by the inferior thermal conductivity of the vapor phase. The flow pattern evolution demonstrated a clear dependence on the applied heat flux, with an increased thermal loading promoting earlier flow regime transitions and more pronounced vapor phase dominance in the channel.
As illustrated in Figure 8, under the highest heat-flux condition of q = 178.4 W/cm2, bubbles began to develop a nose-shaped morphology as early as the axial position of about x/L = 0.2. The rapid temperature rise in the subcooled mainstream fluid significantly weakened its condensation effect on bubbles, allowing the nose-shaped bubbles to undergo accelerated growth and coalescence during their downstream migration. The bubble cluster marked by the dashed frame coalesced into a locally obstructing vapor slug at t0 + 80 ms, which subsequently underwent rapid expansion while interacting with downstream vapor pockets at t0 + 120 ms. The channel-height-constrained vapor slugs nearly occupied the entire cross-section, with the intervening liquid bridges between adjacent slugs exhibiting splash-like patterns due to their intense interactions. These violent collisions created highly disturbed vapor–liquid interfaces, leading to a transition to a churn flow-dominated regime. The continuous growth and elongation of vapor slugs progressively shortened the liquid bridge lengths. Throughout the channel, a complex coexistence of bubbly, sweeping, and churn flow patterns was observed. The formation of large vapor slugs significantly deteriorated the heat transfer performance on the heated area. The high-temperature zones between bubbles were expanded and the wall temperature rose to exceed 150 °C. This temperature elevation reflected the substantial heat transfer impairment caused by extensive vapor coverage and flow regime transitions under extreme heating conditions.
Figure 9 presents the effects of mass flux on boiling flow patterns and wall temperature distributions in the channel under heat-flux conditions of q = 41.9, 90.5, and 178.4 W/cm2. The flow patterns shown were captured at an arbitrary instance after the flow had reached steady-state conditions in the unsteady calculations. Under the three tested heat-flux conditions, decreasing mass flux led to larger bubble sizes at a specified axial position and the expansion of the high-temperature areas on bubble-covered heated surfaces. For the relatively lower heat-flux condition of q = 41.9 W/cm2, Figure 9a reveals that channel-height-constrained vapor slugs (indicating sweeping flow) emerged near the outlet at lower mass fluxes of G = 200 and 300 kg/(m2·s). However, these localized obstructions disappeared at the highest tested mass flux of G = 400 kg/(m2·s), where only a discrete bubbly flow persisted. This demonstrated that reduced mass fluxes promote flow regime multiplicity in the channel, attributable to an extended liquid heating duration and prolonged bubble residence time. As for the boiling flow patterns at elevated heat fluxes of q = 90.5 and 178.4 W/cm2, shown in Figure 9b,c, although bubbly, sweeping, and churn flows coexisted axially, the transition locations between these regimes shifted progressively upstream with a decreasing mass flux. Under the most extreme condition (q = 178.4 W/cm2, G = 200 kg/(m2·s)), Figure 9c shows unstable annular flow with partial dryout developing in mid-to-downstream channel regions. This suggests that a further reduction in mass flux combined with an increased heat flux would enhance annular flow dominance, ultimately leading to a complete channel dryout. The continuous vapor films would fully cover the heating surface, severely compromising the heat transfer performance.
Figure 10 shows a statistical analysis of the axial distribution of dominant flow patterns along the channel for the cases shown in Figure 9. The bubbly flow, sweeping flow, and churn flow are denoted with orange, blue, and green blocks. The proportion of the axial region controlled by the dominant flow pattern in the channel is marked on the corresponding color block. In this study, the transition from bubbly to sweeping flow was defined at the axial location where the channel-height-constrained vapor slugs first appeared, while the transition from sweeping to churn flow was identified when two or more local vapor slugs coexisted in the same channel cross-section. This qualitative characterization provides clear criteria for flow regime transitions in small channel boiling systems. As shown in the figure, a distinct trend was visible, where an increasing heat flux coupled with a decreasing mass flux led to a significant reduction in the proportion of bubbly flow. An upstream shift in the bubbly-to-sweeping flow transition position was also revealed. However, the distribution patterns and transition characteristics between sweeping flow and churn flow demonstrated a more complex behavior. For instance, at a constant mass flux of G = 400 kg/(m2·s), the sweeping flow regime occupied a greater proportion of the channel under q = 178.4 W/cm2 compared to a lower q = 90.5 W/cm2. Furthermore, at q = 90.5 W/cm2, the sweeping-to-churn flow transition occurred further upstream for G = 300 kg/(m2·s) than for a lower G = 200 kg/(m2·s). These observed anomalies may be attributed to the inherently ambiguous transition boundaries between sweeping and churn flows, combined with minor variations introduced by the selected steady boiling state observation times. These findings highlight the requirement for more quantitative characterization methods to precisely determine the dominant regions of each boiling flow pattern.

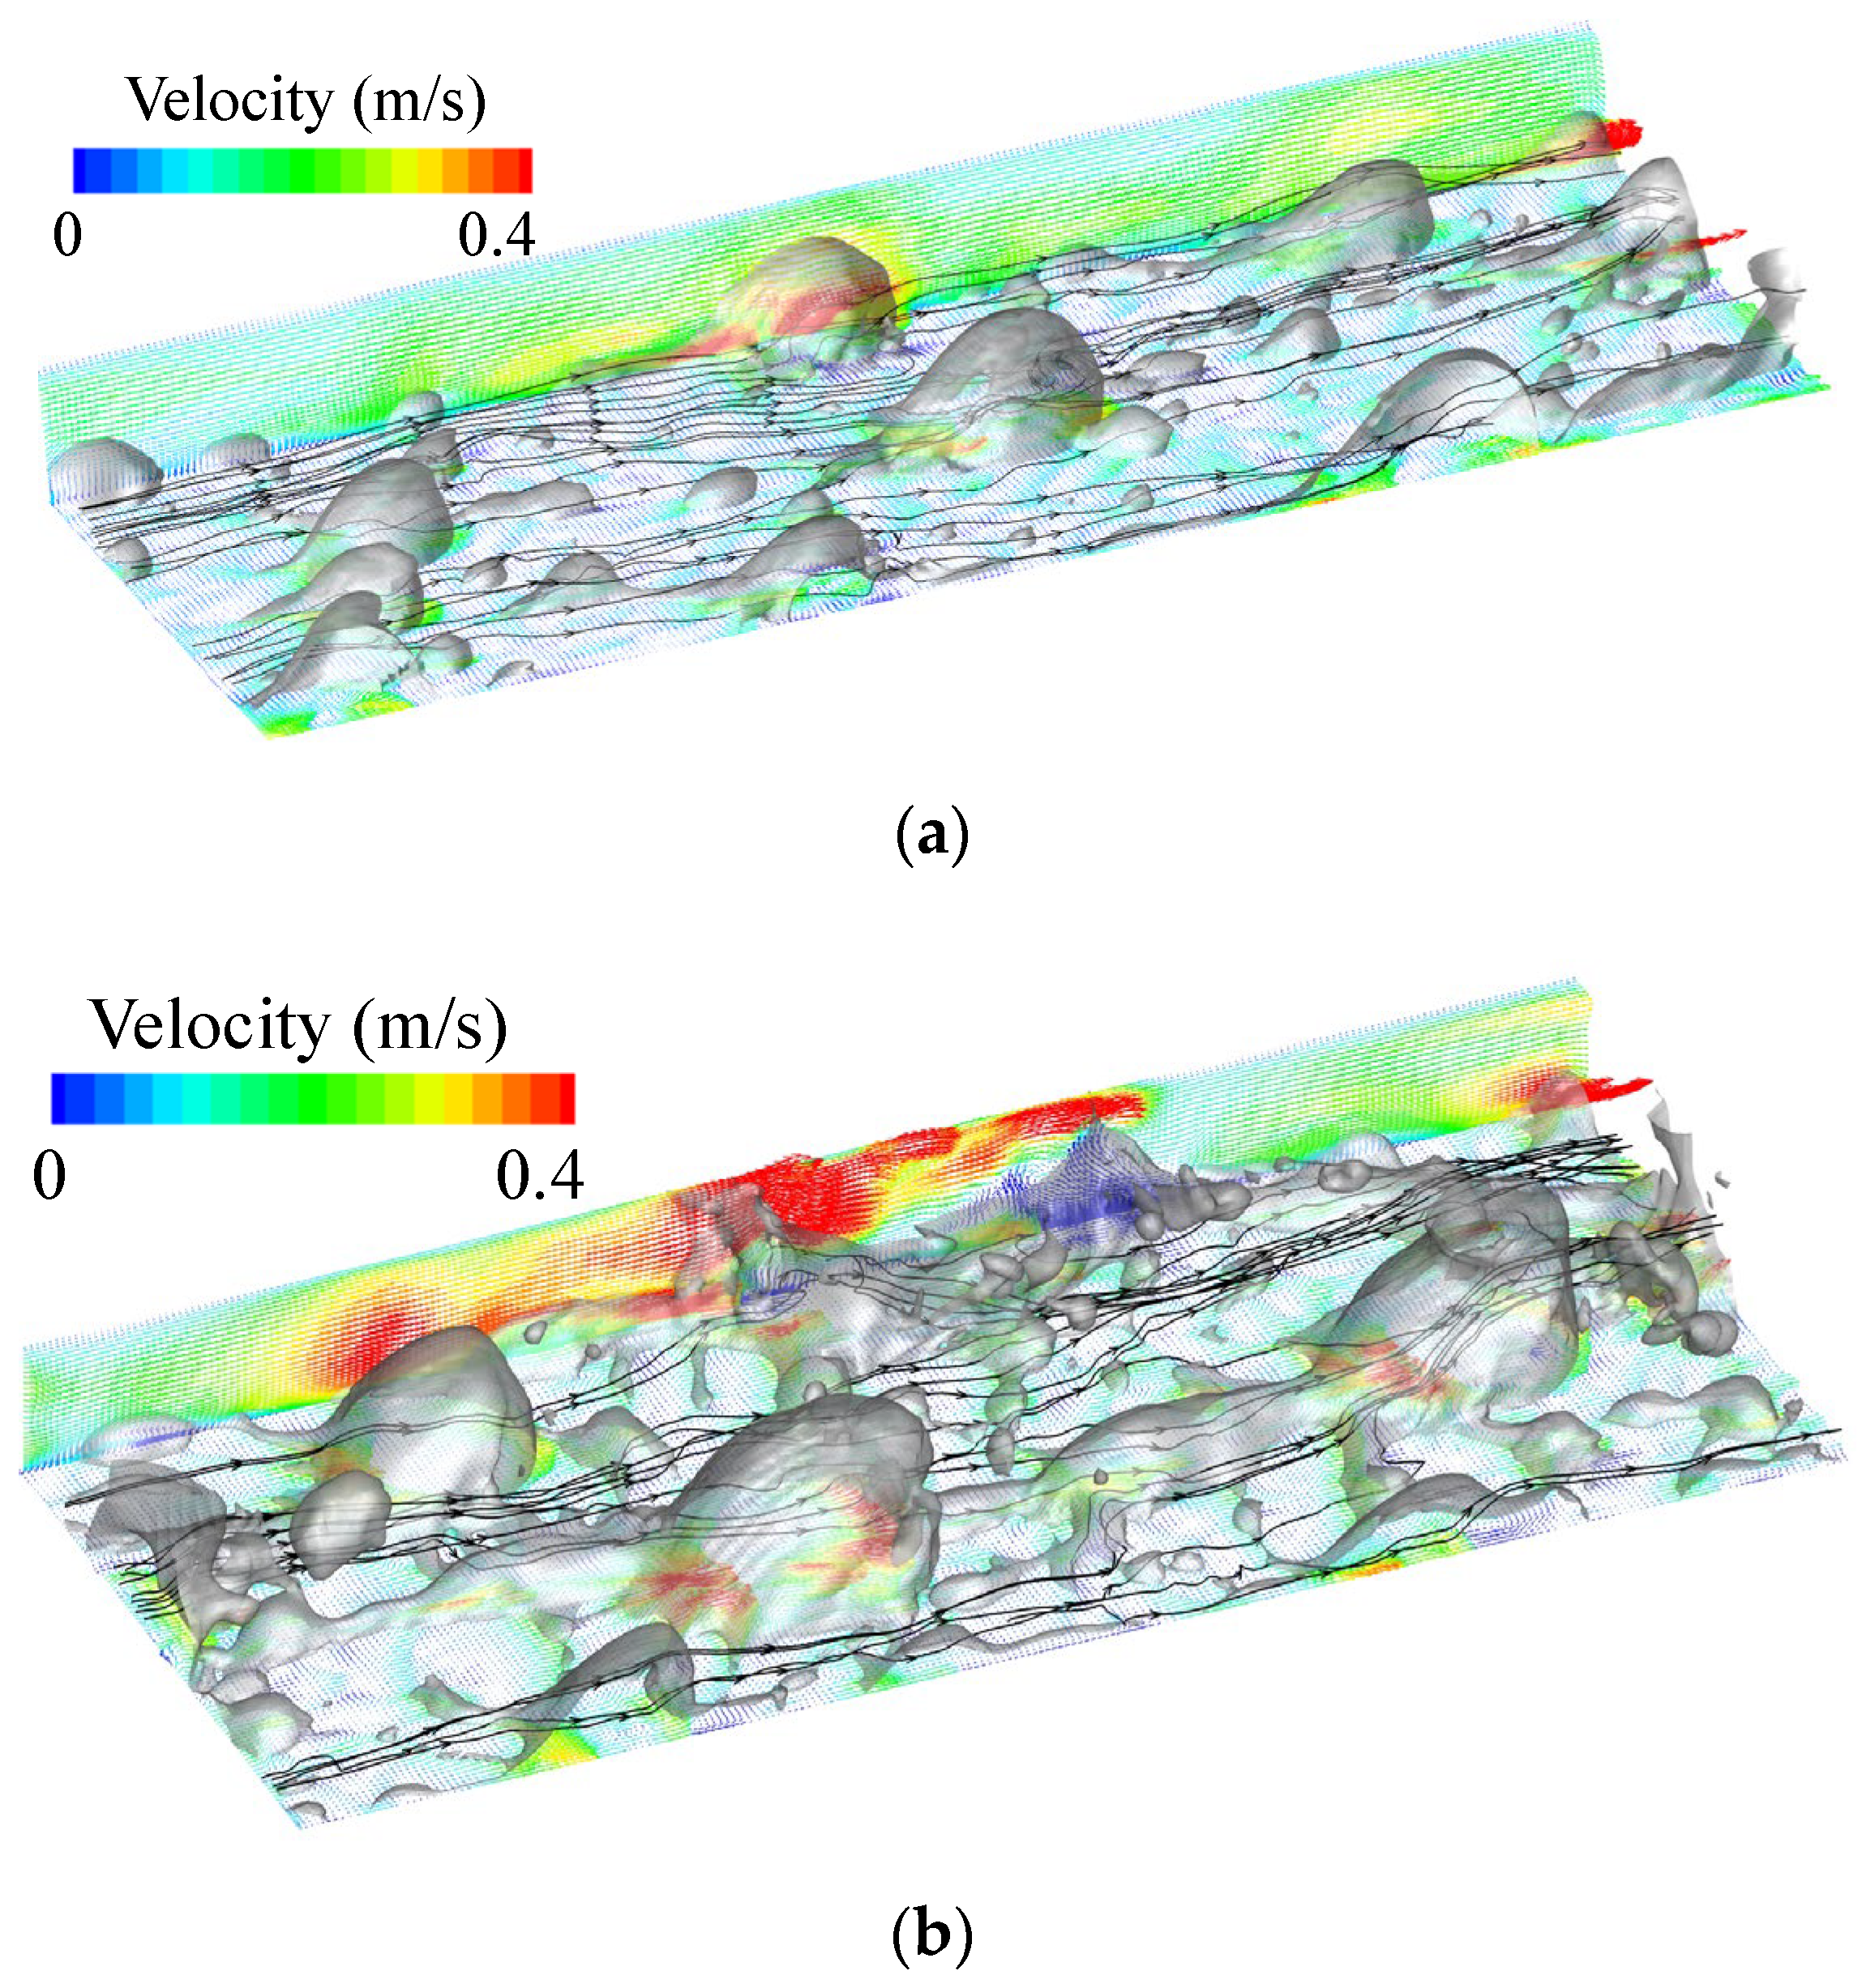
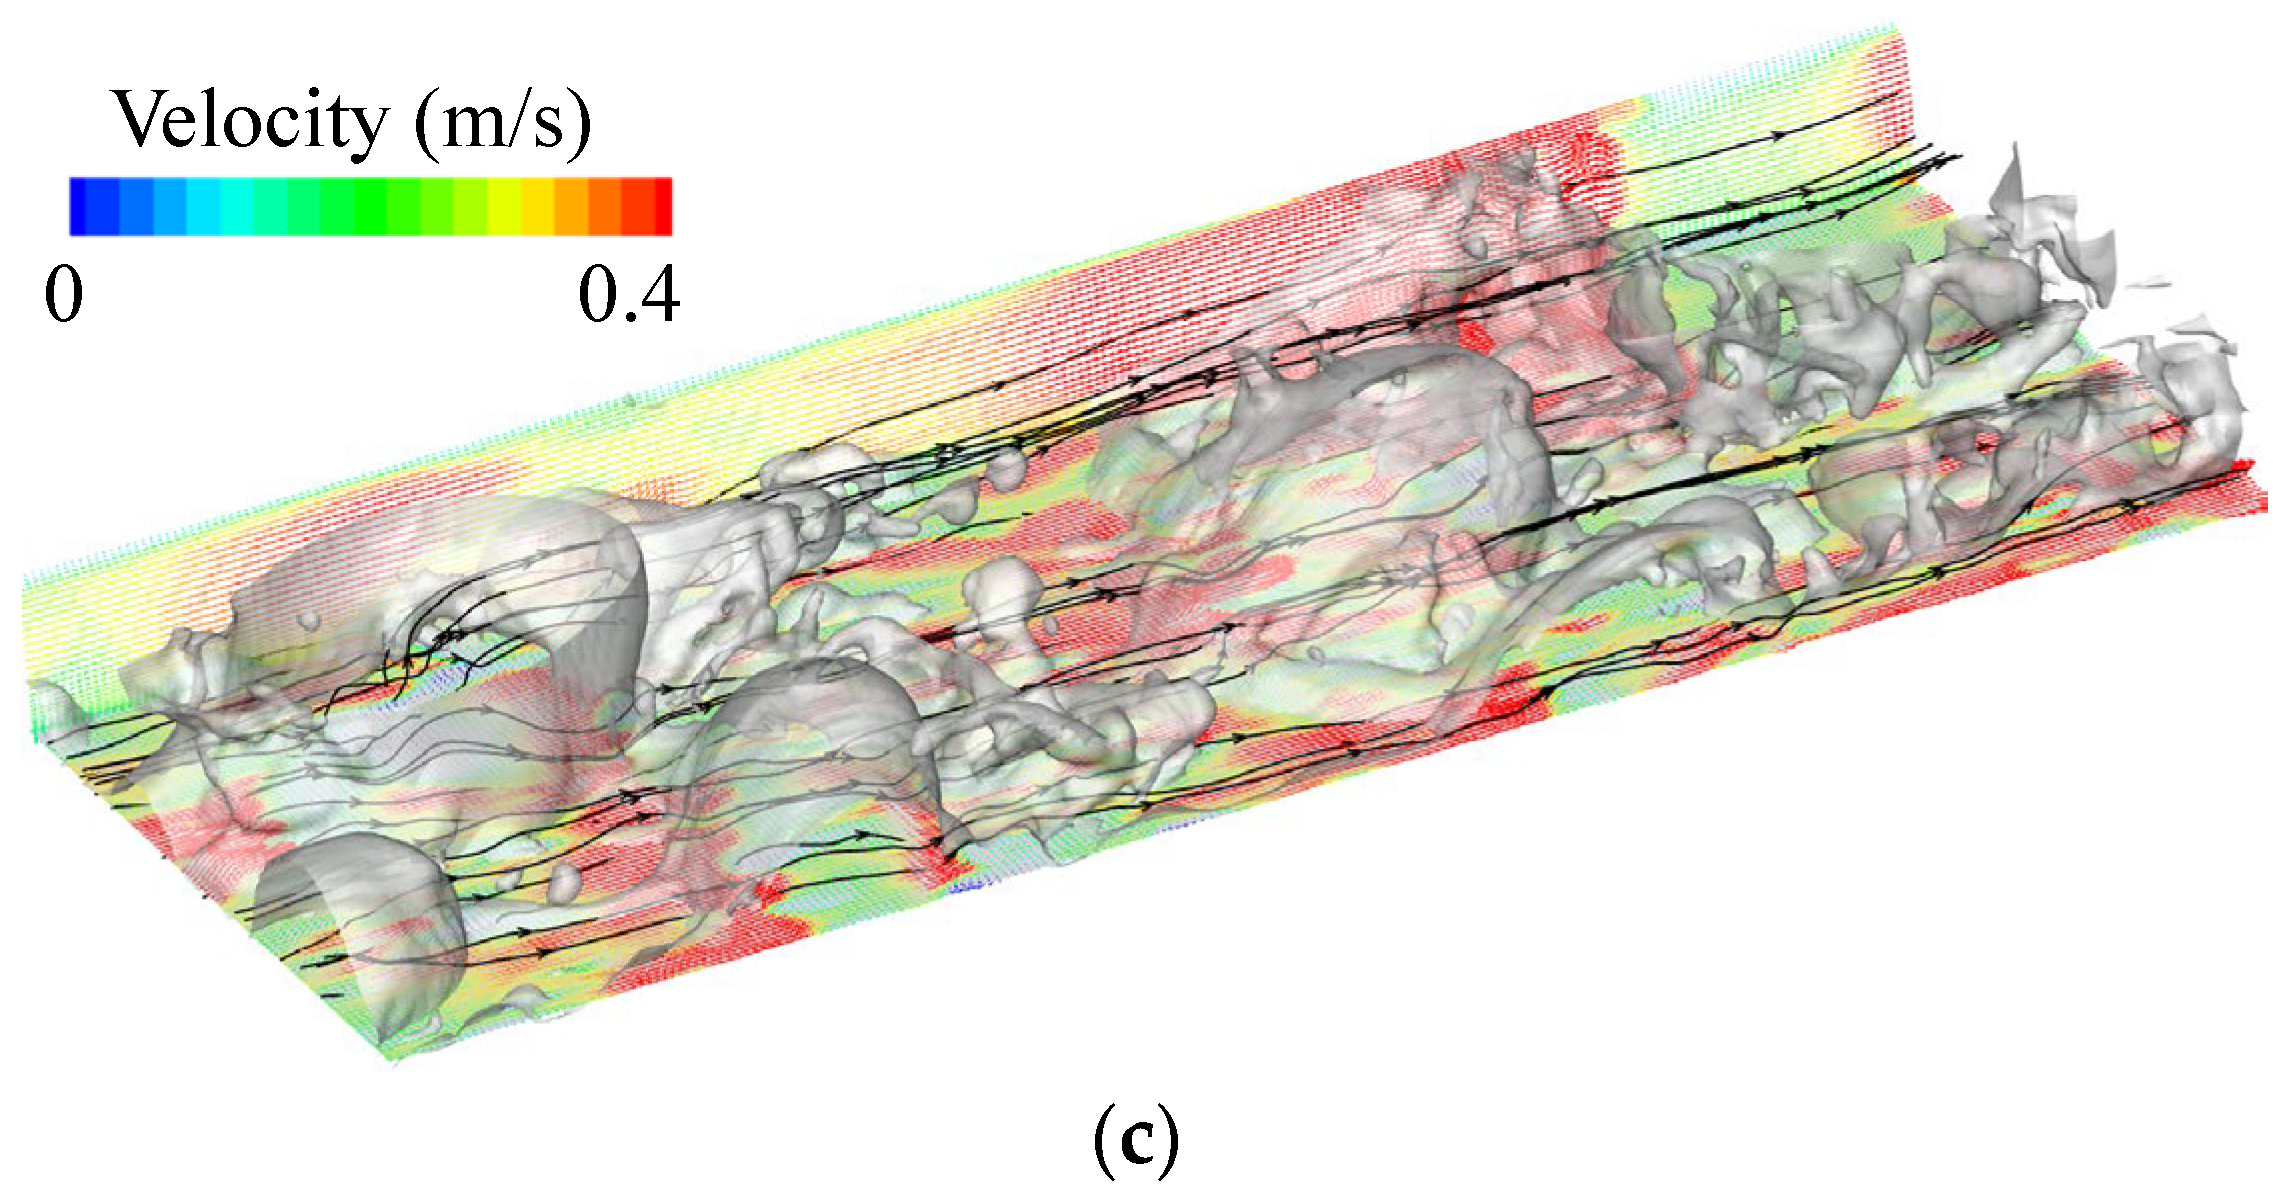
3.2. Flow Characteristics Around Bubbles Under Typical Boiling Flow Pattern

Figure 11 illustrates the streamline patterns and velocity distributions around bubbles under three typical boiling flow patterns. The streamlines are plotted at equal intervals along the channel width starting from the inlet, while the displayed velocities correspond to data from the first grid layer adjacent to the wall.
In the bubbly flow regime, as shown in Figure 11a, the streamlines maintained a relatively uniform distribution across the channel width, exhibiting only a slight deflection near discrete bubbles due to liquid–vapor interactions while remaining predominantly aligned with the mainstream flow direction. The velocity field showed similar uniformity, though higher velocities were observed near side walls where bubbles slid downstream, creating significant velocity gradients due to the no-slip boundary condition.
The sweeping flow regime, shown in Figure 11b, demonstrated markedly different characteristics, with streamlines showing pronounced curvature and convergence, particularly for nose-shaped bubbles or local vapor slugs. Large velocity gradients developed near liquid–vapor interfaces, and the side walls exhibited enhanced gradients due to frequent sweeping by larger bubbles.
Compared with the above flow patterns, the churn flow regime, shown in Figure 11c, featured highly non-uniform streamline distributions and elevated bulk velocities resulting from vapor expansion. Substantial velocity gradients developed near both heating and side walls, while intense liquid–vapor mixing generated strong turbulent fluctuations. Although this turbulence could theoretically enhance convective heat transfer, the significant temperature rise, observed on the heated area in Figure 9, suggested that its beneficial effects became limited under high-heat-flux conditions, where vapor coverage dominated the thermal performance. This systematic analysis revealed how fundamental differences in flow structures among regimes lead to distinct hydrodynamic and thermal characteristics, providing mechanistic explanations for the observed heat transfer behaviors in rectangular small channel boiling systems.

3.3. Characterization of Local Boiling Flow Patterns

The heat transfer characteristics in the rectangular small channel demonstrated a strong correlation with boiling flow patterns. Thus, the accurate prediction of flow regime transition thresholds became particularly crucial. Although the qualitative flow pattern analysis mentioned in the previous section provided fundamental understanding, it proved insufficient for precisely determining the dominant regions of distinct flow patterns. A more rigorous approach employing appropriate dimensionless parameters becomes essential for an accurate identification under high-heat-flux conditions in a rectangular small channel. This quantitative methodology is illustrated in Figure 12, which presents the axial distribution of cross-sectional volume fraction αv of the vapor phase under different conditions. The simulated results, distinguished by orange, blue, and green symbols, represent mass fluxes of G = 200, 300, and 400 kg/(m2·s). In addition, they are further classified by shape according to the flow pattern categorization established in Figure 10. The bubbly flow, sweeping flow, and churn flow regimes are denoted with squares, circles, and triangles. This comprehensive representation enables a systematic analysis of the αv evolution in relation to flow pattern transitions.
As shown in Figure 12a,b, under relatively low-heat-flux conditions, of q = 41.9 and 90.5 W/cm2, the αv exhibited a general increasing trend along the axial direction for all tested mass fluxes, with a corresponding growth in fluctuation amplitudes. At q = 41.9 W/cm2, the αv remained below 0.2 for most axial positions, exceeding this threshold only in downstream regions (x/L > 0.8) at lower mass fluxes of G = 200 and 300 kg/(m2·s). This area corresponds to the sweeping flow identified in the qualitative analysis of Figure 10. For the q = 90.5 W/cm2 condition, although αv predominantly stayed below 0.4, values surpassing this level emerged in far downstream locations (x/L > 0.9) at G = 200 and 300 kg/(m2·s). The αv for the G = 400 kg/(m2·s) showed a peak approaching 0.4 around x/L = 0.95. These regions align with the churn flow in Figure 10, while intermediate αv ranging from 0.2 to 0.4 consistently corresponded to sweeping flow. Under the highest heat-flux condition of q = 178.4 W/cm2, as shown in Figure 12c, the αv demonstrated an initial overall increase followed by large amplitude fluctuations along the axial direction. The extreme case of G = 200 kg/(m2·s) showed near-unity αv peaks around x/L = 0.75. This area indicates the near-complete local dryout that matched the flow pattern observed in Figure 9a. The axial positions where the αv first exceeded 0.2 occurred near x/L = 0.15 for G = 200 kg/(m2·s), x/L = 0.28 for G = 300 kg/(m2·s), and x/L = 0.34 for G = 400 kg/(m2·s), while the threshold of 0.4 was first reached at approximately x/L = 0.28, 0.45, and 0.8 for the respective mass fluxes. These critical locations where αv initially surpassed the specified thresholds showed close agreement with the flow regime transition positions qualitatively identified in Figure 10. Consequently, for the current model and tested operating conditions, the thresholds of αv = 0.2 and 0.4 can be established as reliable indicators for identifying the bubbly-to-sweeping flow and sweeping-to-churn flow transitions, respectively. The critical αv = 0.2 for the bubbly-to-sweeping flow transition aligned well with the values for the bubbly-to-slug flow reported in reference [34]. This is primarily because the slug flow in the present channel manifested as a sweeping flow with localized slugs. However, the threshold of αv = 0.4 for the sweeping-to-churn flow transition was slightly lower than the 0.5 obtained in reference [35]. This discrepancy suggests that, in the rectangular small channel, elevated heat fluxes predominantly influenced the transition characteristics from sweeping to churn flow, likely due to enhanced bubble coalescence and vapor accumulation under high thermal-loading conditions.
The boiling flow patterns exhibited strong correlations with heat transfer characteristics in the rectangular small channel. Figure 13 presents the axial distribution of heat transfer coefficient h on the heated area under different heat-flux and mass-flux conditions. The local h at each axial position was calculated based on the width-averaged wall temperature and the width-averaged fluid temperature in the first grid layer adjacent to the wall. For analytical purposes, h = 0.3 W/(cm2·°C) was established as the critical threshold for heat transfer deterioration, indicated by a red, horizontal, dashed line. The regions whose h was below this value were defined as the heat transfer deterioration zones.
Under the relatively low-heat-flux condition of q = 41.9 W/cm2, as shown in Figure 13a, the heat transfer coefficients along the upstream heating surface remained almost stable at approximately 1.6 W/(cm2·°C). The fluctuation amplitude increased in the axial direction and reached a maximum of 1.5 W/(cm2·°C). The heat transfer deterioration occurred only at x/L = 0.92 for G = 200 kg/(m2·s), with other conditions maintaining satisfactory heat transfer performances throughout the channel. At the intermediate heat flux of q = 90.5 W/cm2, as shown in Figure 13b, although peak h increased, the axial range of severe fluctuations expanded significantly and amplitudes achieved 2.3 W/(cm2·°C). The heat transfer deterioration occurred more frequently, but the affected axial spans remained relatively limited. As for the most extreme condition of q = 178.4 W/cm2, Figure 13c demonstrates markedly reduced peak occurrences but shows interconnected deterioration zones along the channel, exemplified by the continuous heat transfer deterioration between x/L = 0.62 and 0.8 at G = 200 kg/(m2·s).
Comparative with the flow regime distributions in Figure 10, the distinct heat transfer characteristics for different boiling flow patterns could be concluded. The bubbly flow-dominated regions maintain stable heat transfer performances. The sweeping flow zones exhibited frequent but localized deterioration. Furthermore, the churn flow areas developed extended axial spans of impaired heat transfers. These observations systematically demonstrated how flow regime transitions fundamentally alter heat transfer mechanisms in small channel boiling systems.
Figure 14 presents the variation in heat transfer coefficient h with a volume fraction of vapor phase αv under different heat-flux and mass-flux conditions. The orange, blue, and green symbols represent data for q = 41.9, 90.5, and 178.4 W/cm2, while the squares, circles, and triangles correspond to that for G = 200, 300, and 400 kg/(m2·s). The results demonstrate that h under various operating conditions followed similar trends with increasing αv. When the αv was below around 0.1, the h decreased gradually with increasing αv, corresponding to the bubbly flow regime. For αv exceeding around 0.1, the h declined rapidly, characteristic of the bubbly flow wake region, sweeping flow, and churn flow regimes. Increased mass flux enhanced the h at a given αv, primarily due to intensified convective heat transfer. Although heat flux significantly influenced the αv distribution within the channel, its effect on the h at a specific αv was relatively minor.

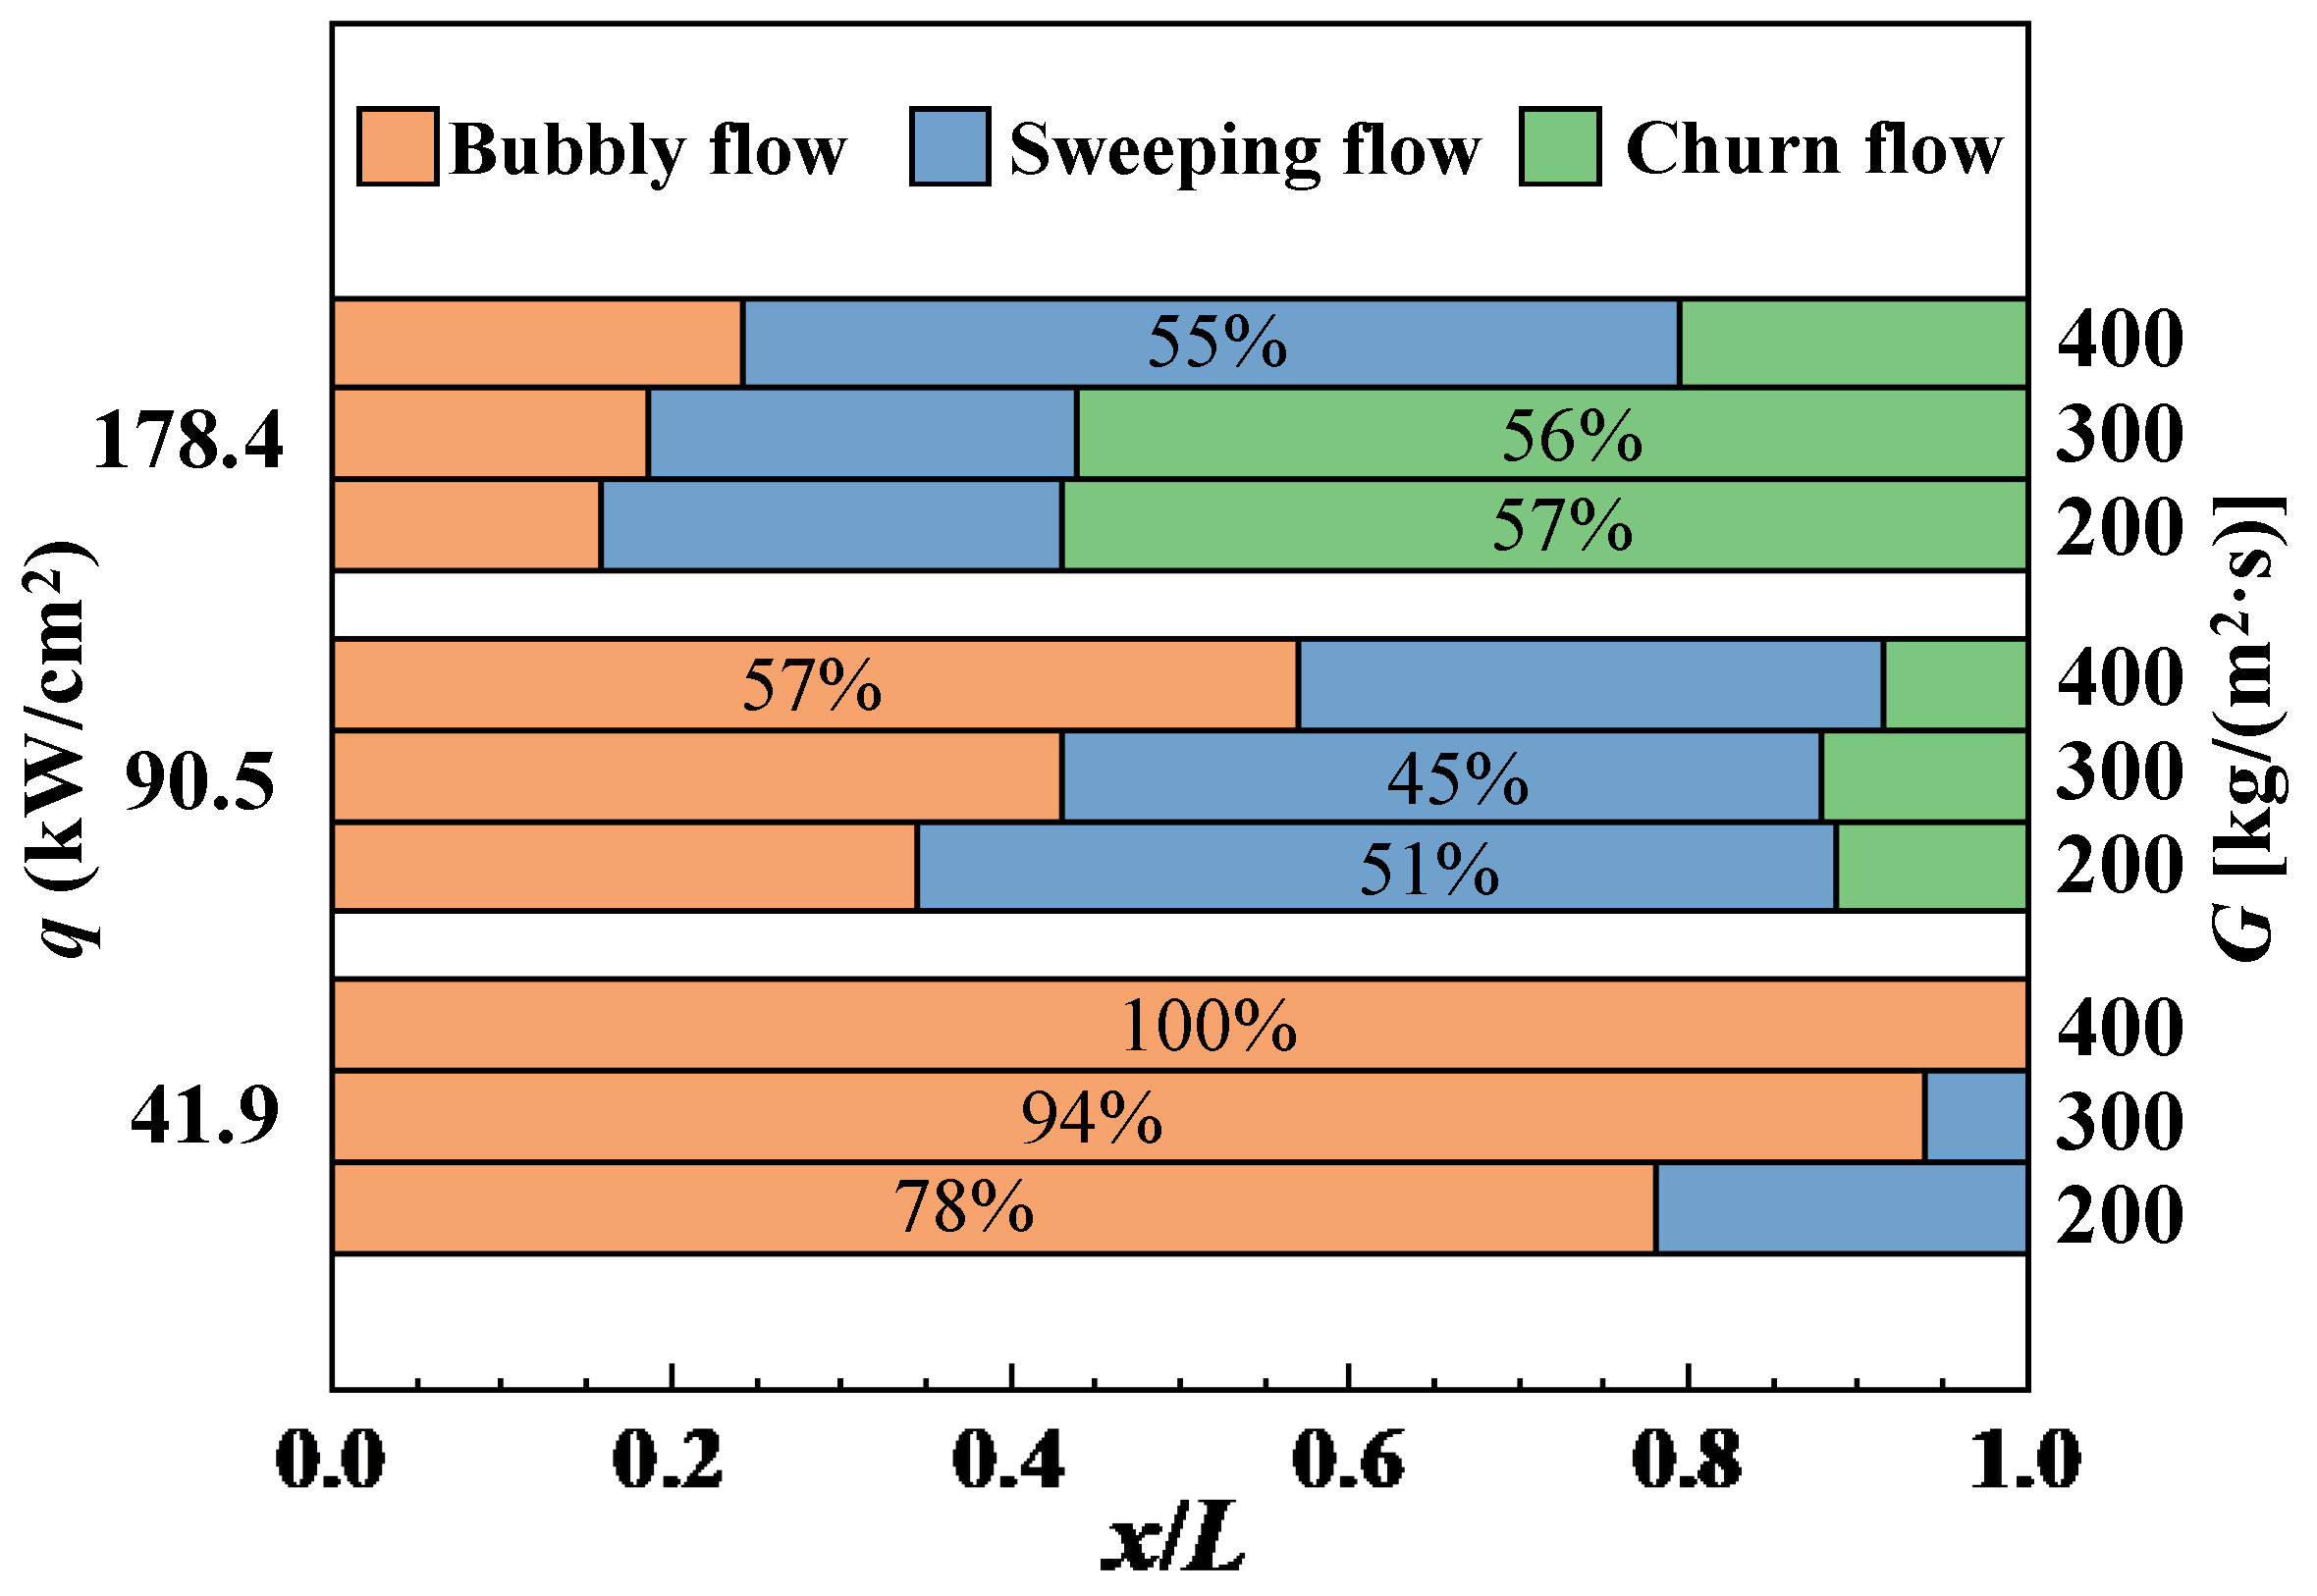
3.4. Characterization of Dominant Boiling Flow Pattern

In fact, the overall heat transfer characteristics of the rectangular small channel were predominantly determined by the dominant flow pattern, despite the coexistence of different liquid–vapor flow patterns at various axial locations. Although the critical thresholds of cross-sectional αv could effectively predict regional flow pattern transitions, this single indicator proved insufficient for a comprehensive characterization. There exists an urgent demand to develop an appropriate dimensionless parameter for a quantitative identification of the dominant flow pattern in the rectangular small channel under high-heat-flux conditions. Following the methodology proposed by Oliveira et al. [29], this study investigated the applicability of the dimensionless parameter β under high-heat-flux conditions in a rectangular small channel. The mathematical definition of this dimensionless parameter is expressed as follows:
β = S Bo 10 5
where Bo represents the boiling number (=q/Gilv) and S indicates the slip ratio, which can be calculated as the velocity ratio between the vapor and liquid phases, given below:
S = u v u l = x ρ l ( 1 α v ) α v ρ v ( 1 x )
where x means the local vapor quality on the channel cross-section. Due to the inherent challenges in directly measuring vapor quality and its unavailability as a direct output in numerical simulations, the calculation was performed using a correlation between αv and x, which is given in Equation (13) [29].
α v = x ρ l ( 0.833 + 0.167 x ) x ρ l + ( 1 x ) ρ g
Figure 15 presents the axial distribution of cross-sectional β under different heat-flux and mass-flux conditions. The orange, blue, and green symbols represent the calculated results for mass fluxes of G = 200, 300, and 400 kg/(m2·s), respectively. The dominant flow regime in the channel for each case was determined as the most prevalent pattern identified in Figure 10. Unlike the cross-sectional αv, the β exhibited fluctuations around characteristic values along the dimensionless axial position x/L for the specified conditions.
As shown in Figure 15a for the relatively low-heat flux of q = 41.9 W/cm2, the characteristic values of β decreased from 11 to 5 as the mass flux increased from 200 to 400 kg/(m2·s), while maintaining pulsation amplitudes within 2. Since bubbly flow dominated all three mass-flux conditions, the critical β for the bubbly-to-sweeping flow transition should have exceeded 11. At the intermediate heat flux of q = 90.5 W/cm2, as shown in Figure 15b, the characteristic values of β rose to 24, 16, and 12 for G = 200, 300, and 400 kg/(m2·s), respectively, with expanded fluctuation ranges up to 10. The transition threshold between bubbly and sweeping flows should lie between 12 and 16. It is because the dominant flow pattern for G = 200 and 300 kg/(m2·s) was sweeping flow while that for higher mass fluxes turned to bubbly flow. For the highest heat-flux condition of q = 178.4 W/cm2, Figure 15c shows that the characteristic values of β further increased to 48, 32, and 24, with maximum fluctuations of over 50 observed at G = 200 kg/(m2·s). The critical β for the sweeping-to-churn flow transition should be positioned between 24 and 32, corresponding to the regime shift observed between G = 400 kg/(m2·s) (sweeping flow) and lower mass fluxes (churn flow). The critical β for the bubbly-to-sweeping and sweeping-to-churn flow transitions obtained in the present study is comparable with 10 for plug-to-slug and 25 for slug-to-churn flow transitions reported in reference [29]. It suggests the significant heat flux and channel dimension effects on the transitional criteria of flow patterns in rectangular small channel boiling systems.

4. Conclusions

This paper presents a comprehensive numerical investigation of subcooled boiling flow and heat transfer characteristics in a rectangular small channel under high-heat-flux conditions. The fundamental mechanisms are elucidated by which various operating parameters influence bubble evolution processes and flow pattern distributions. Additionally, innovative characterization methods for both local and dominant flow patterns during boiling flow in the channel are developed. The principal findings can be summarized as follows:
(1)
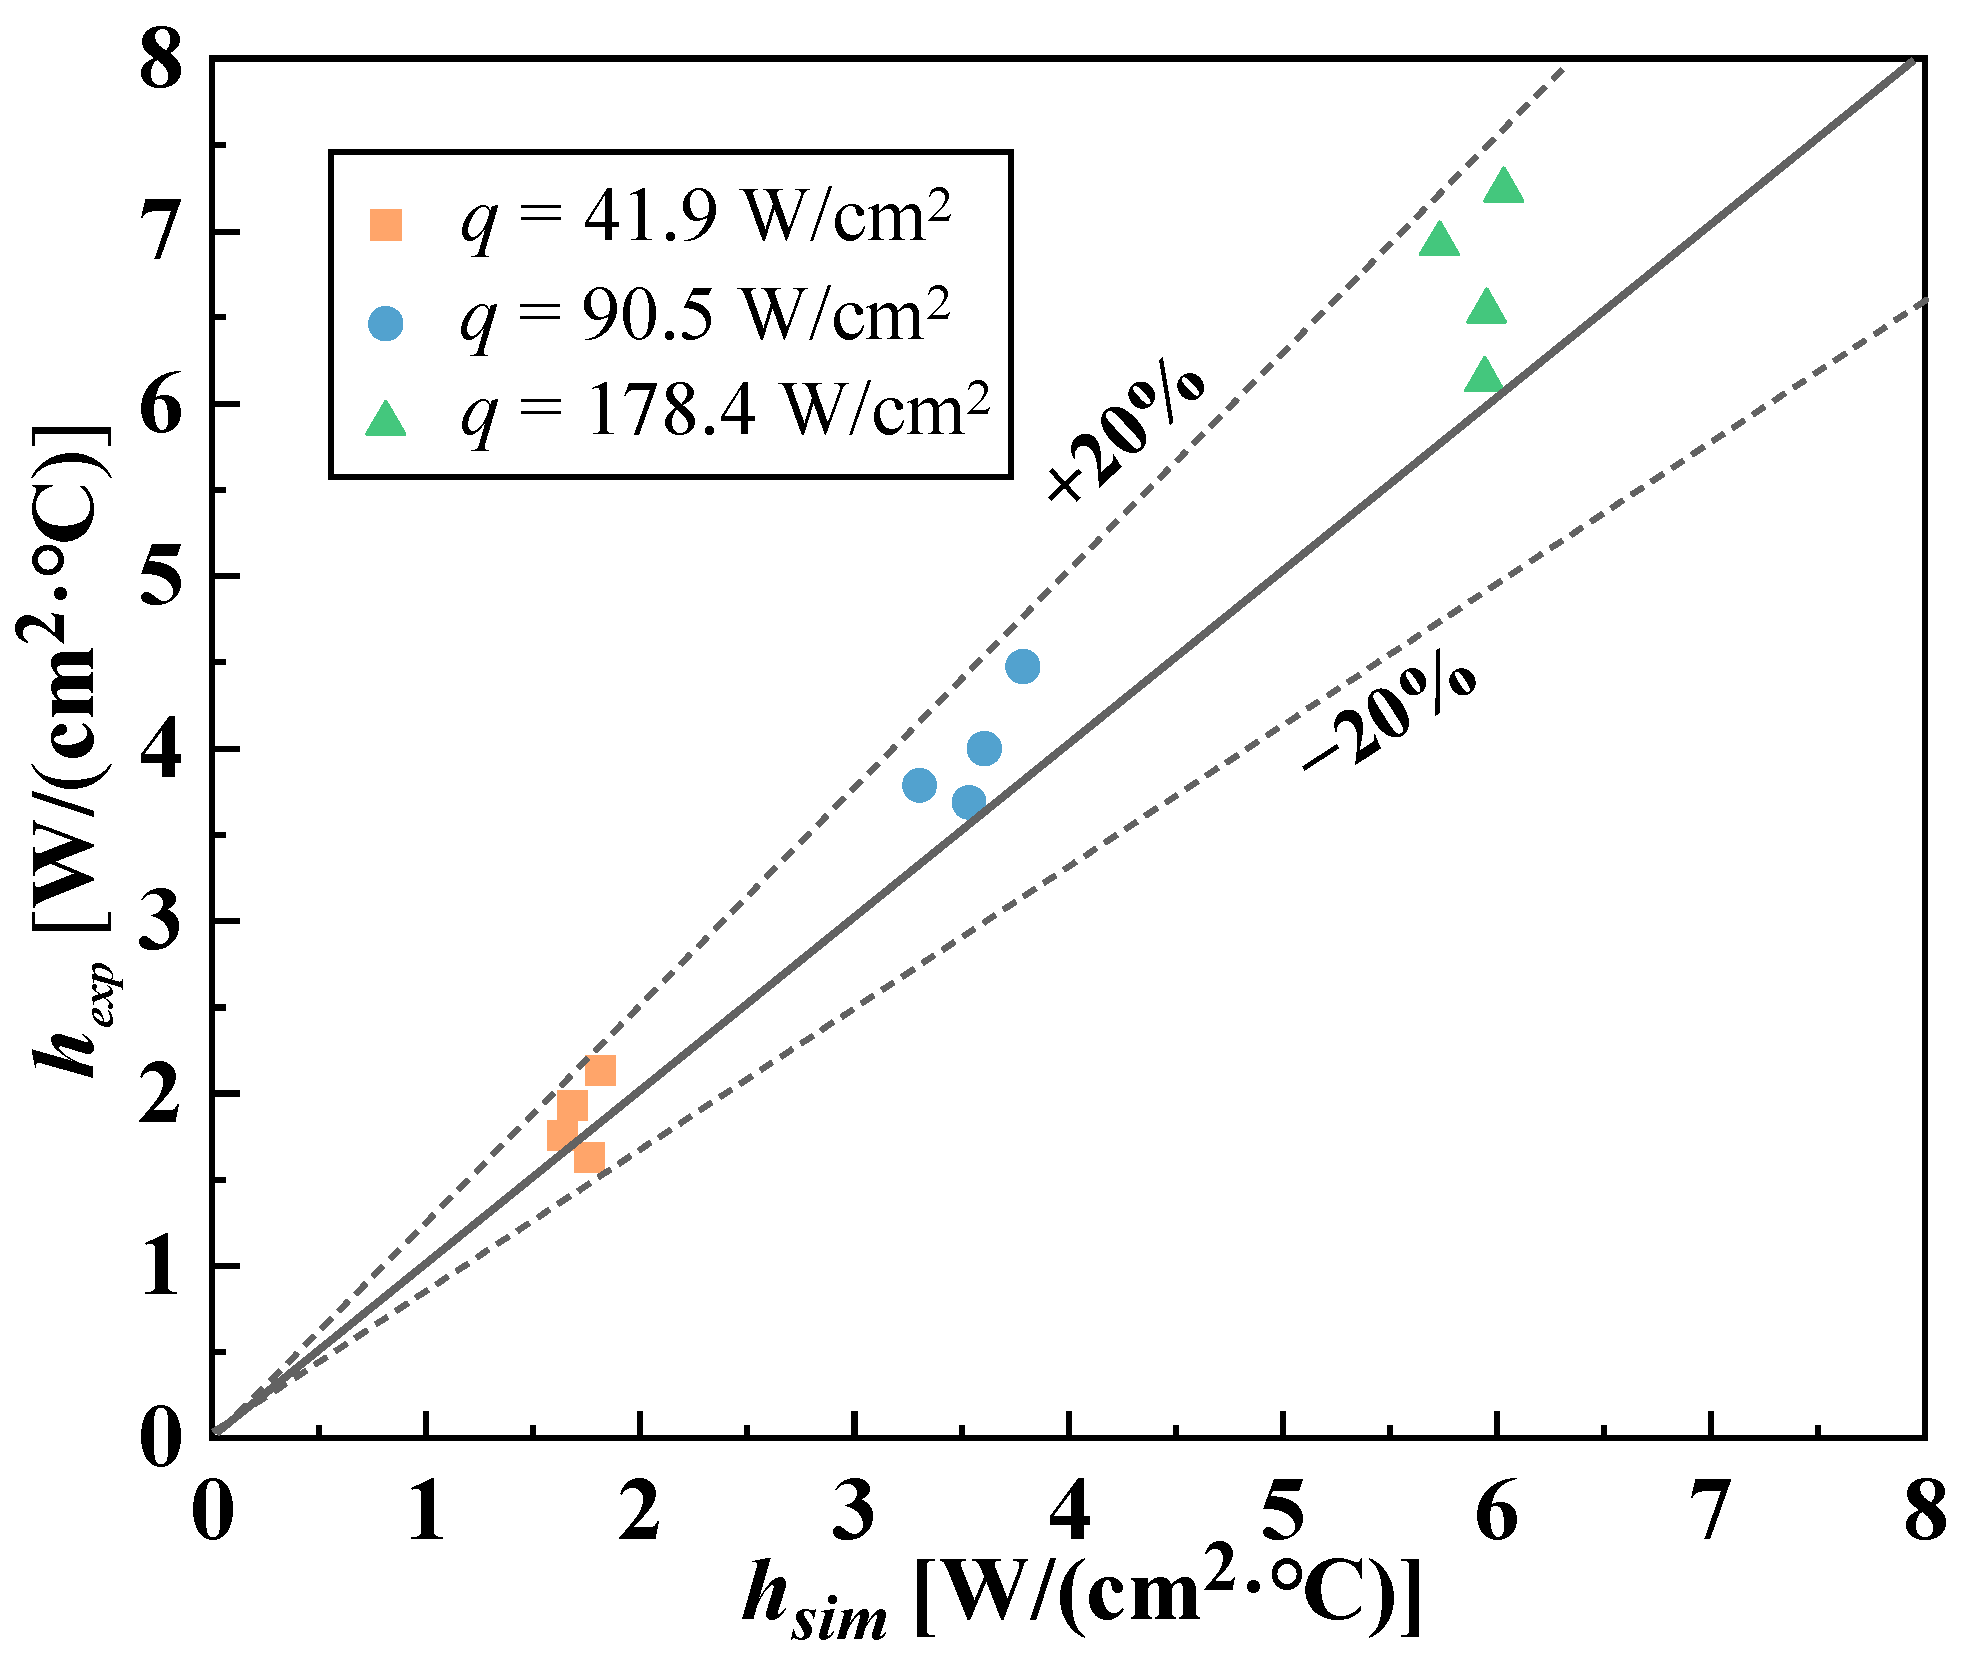
The model accurately captures boiling behavior, with average heat transfer coefficient predictions deviating within ±20% of experimental results.
(2)
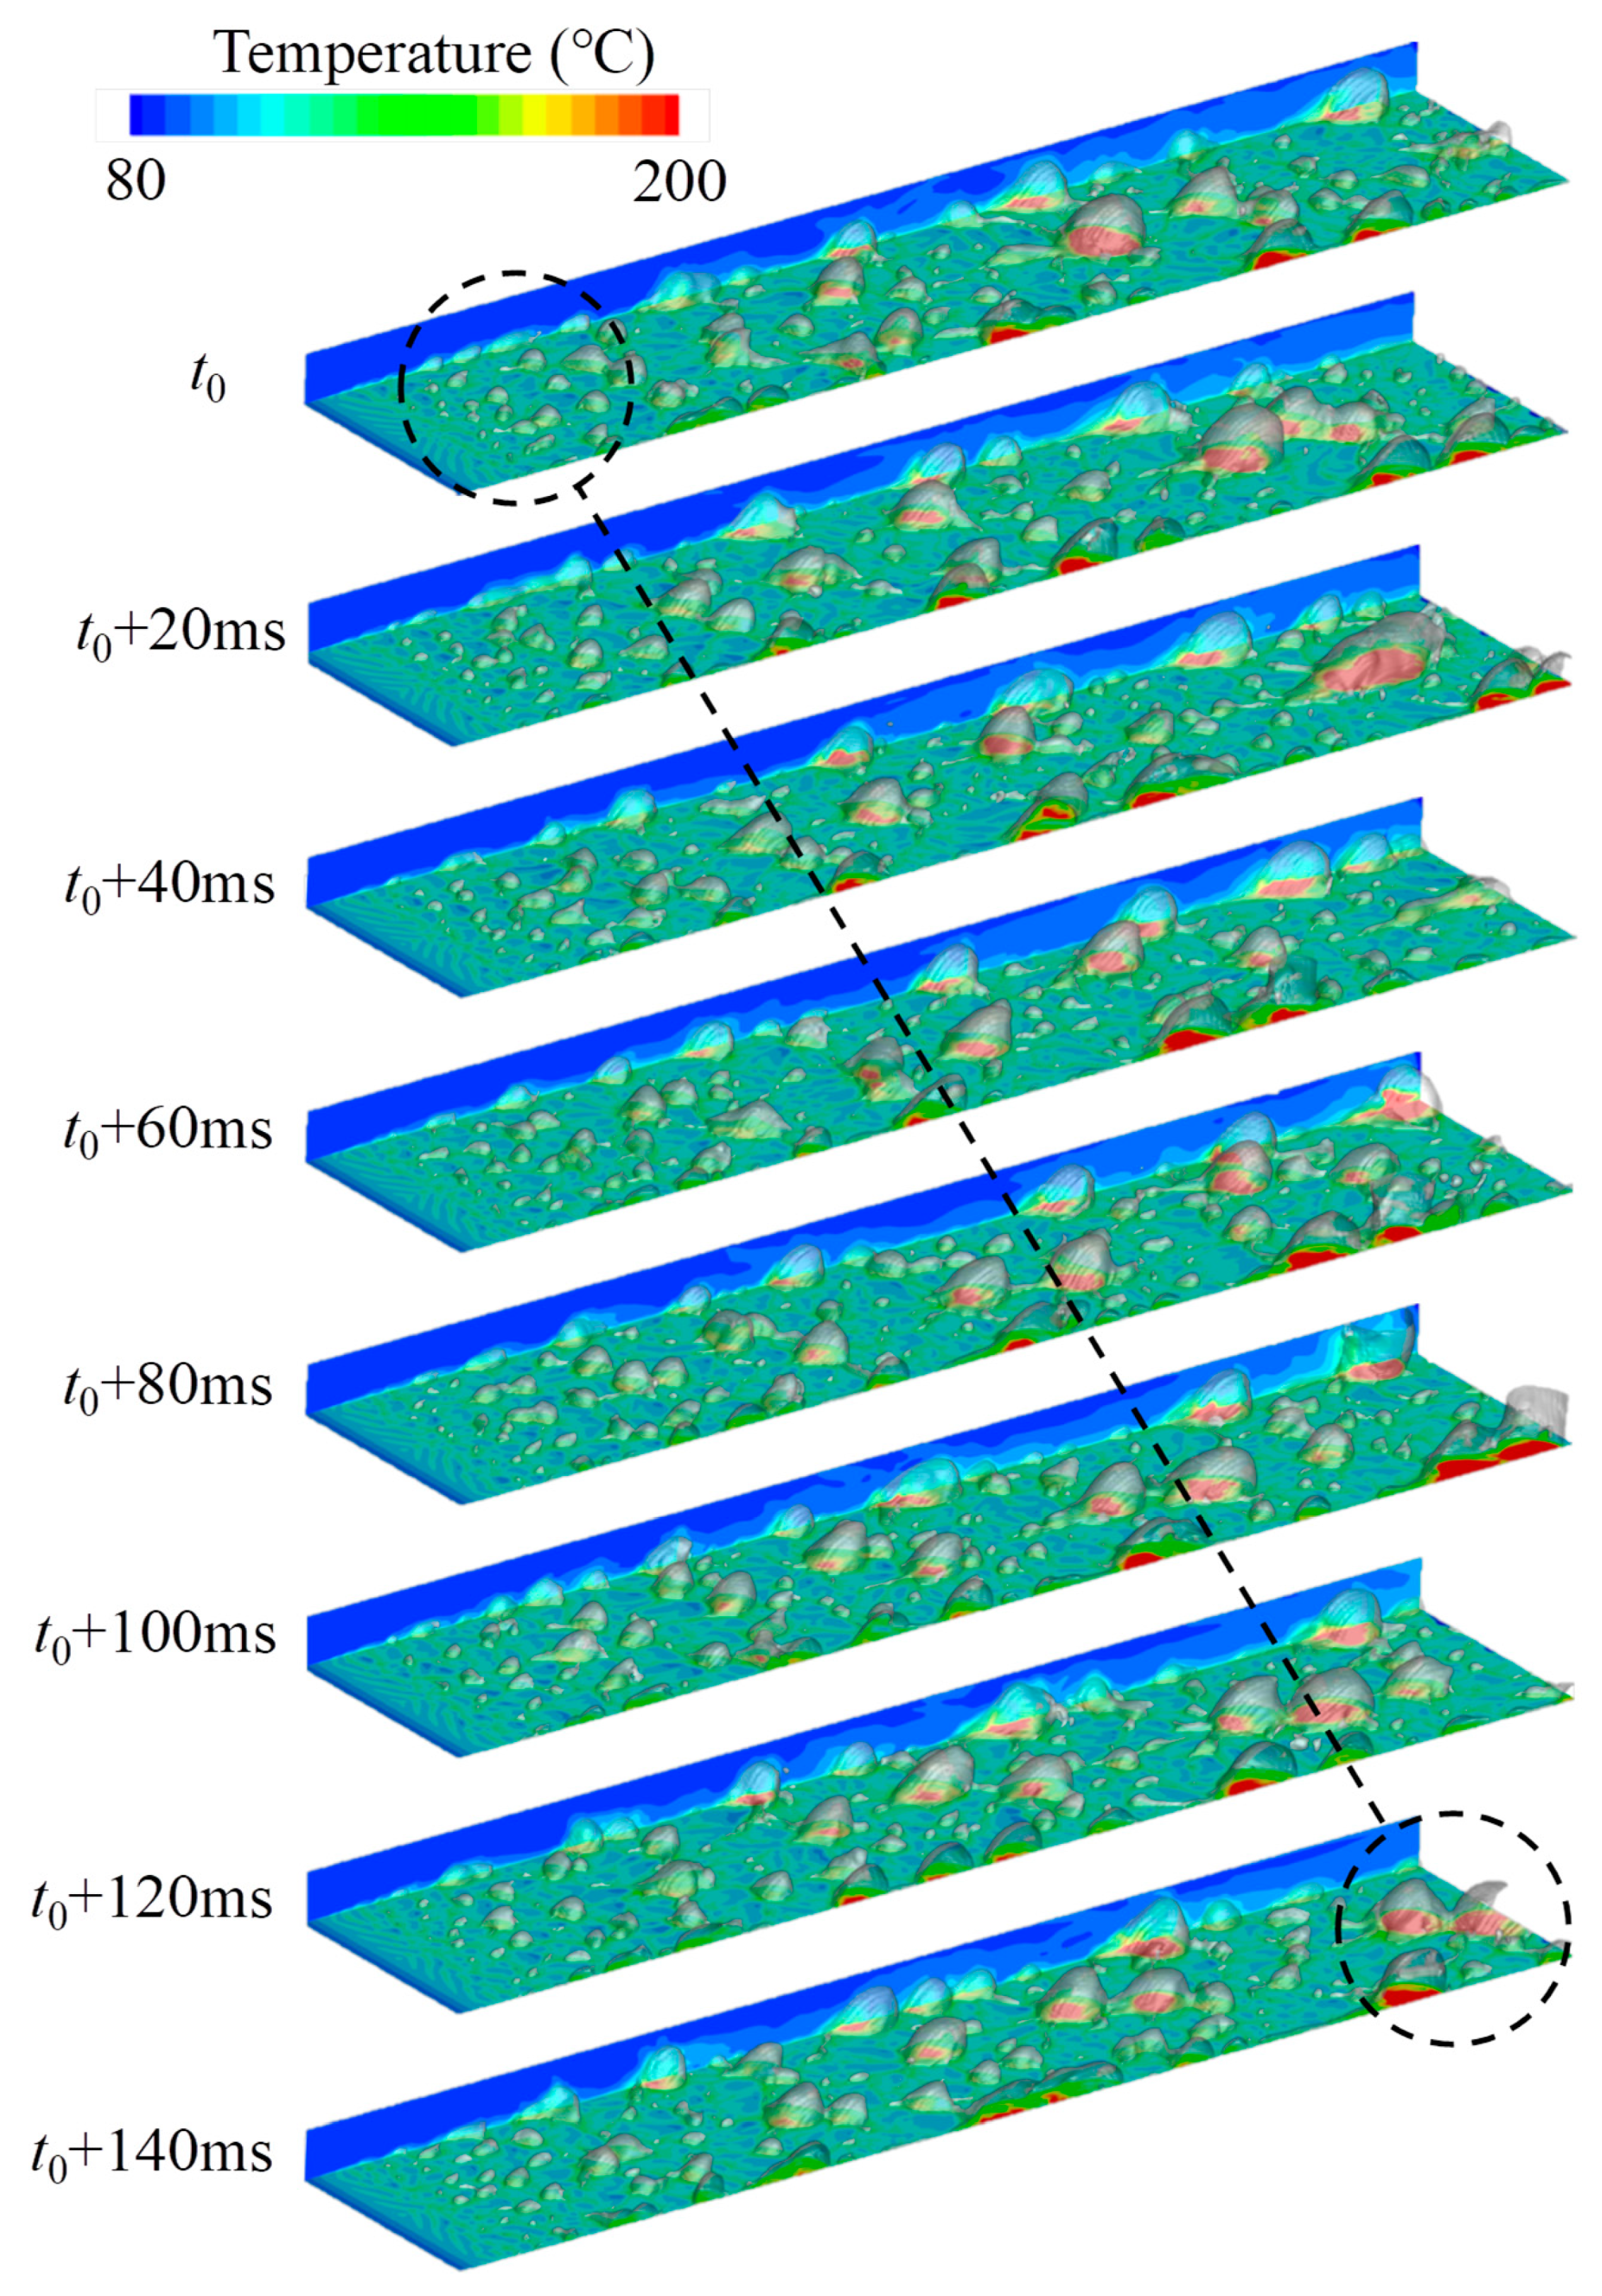
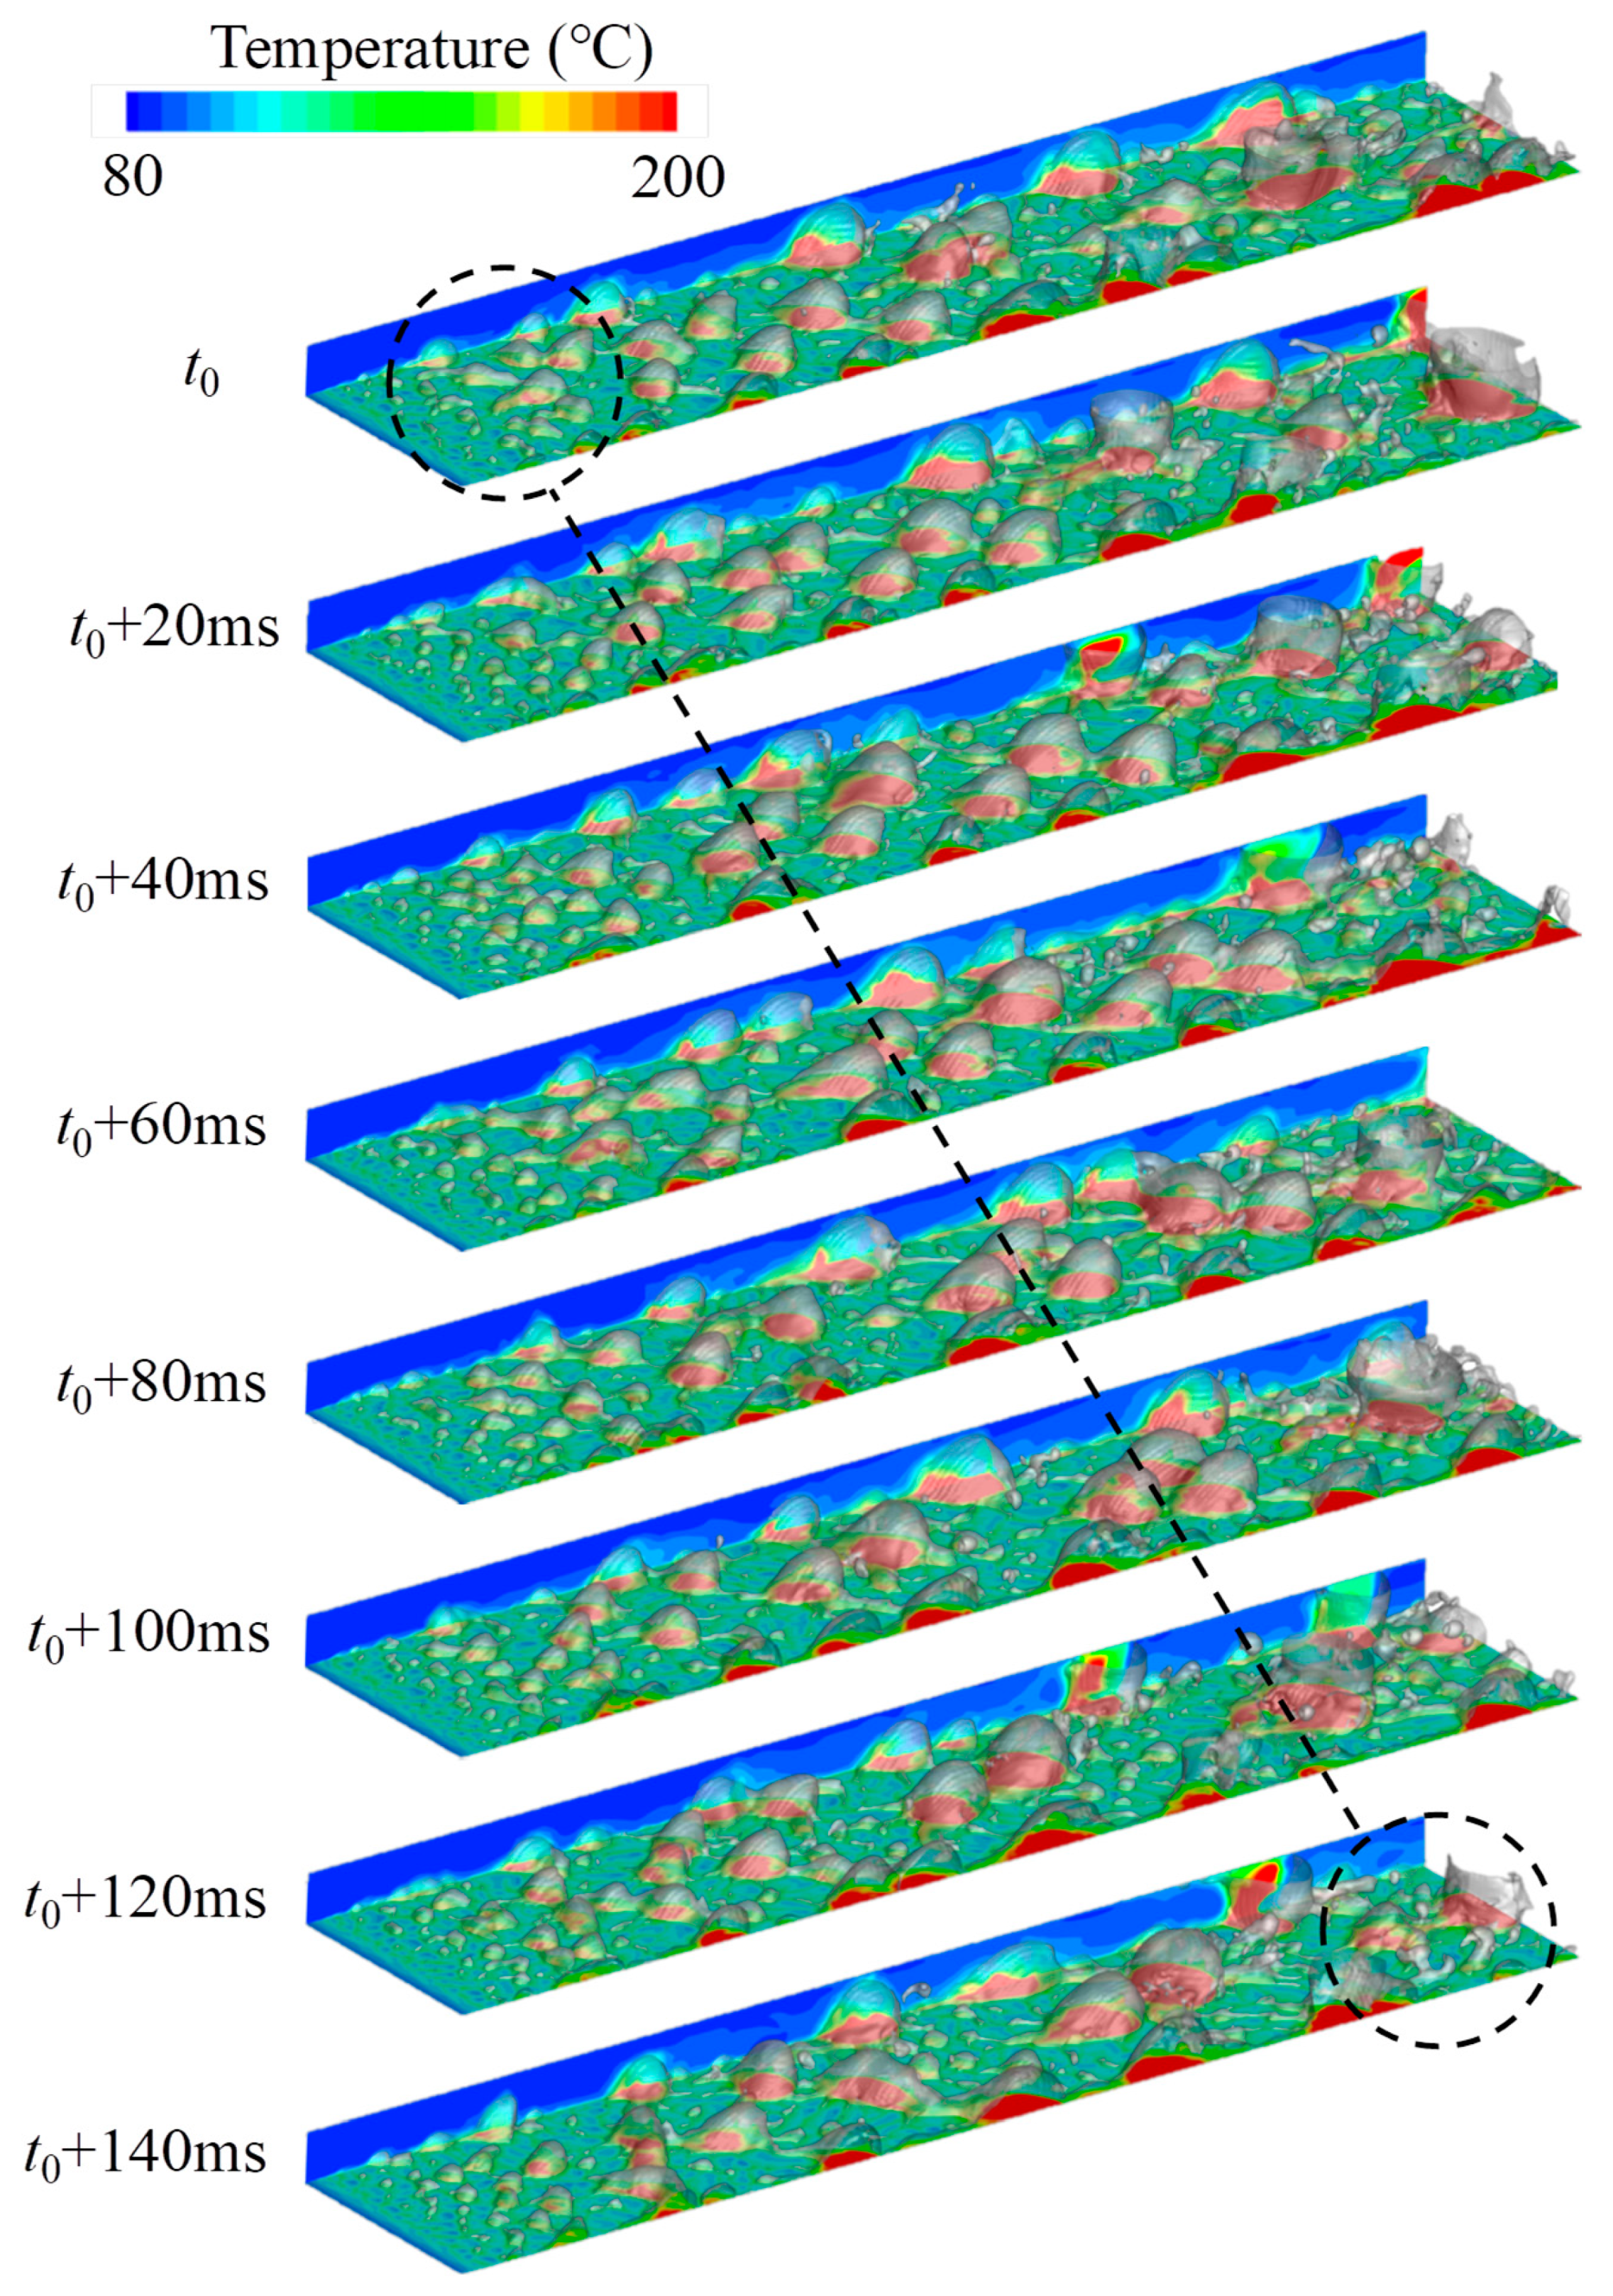
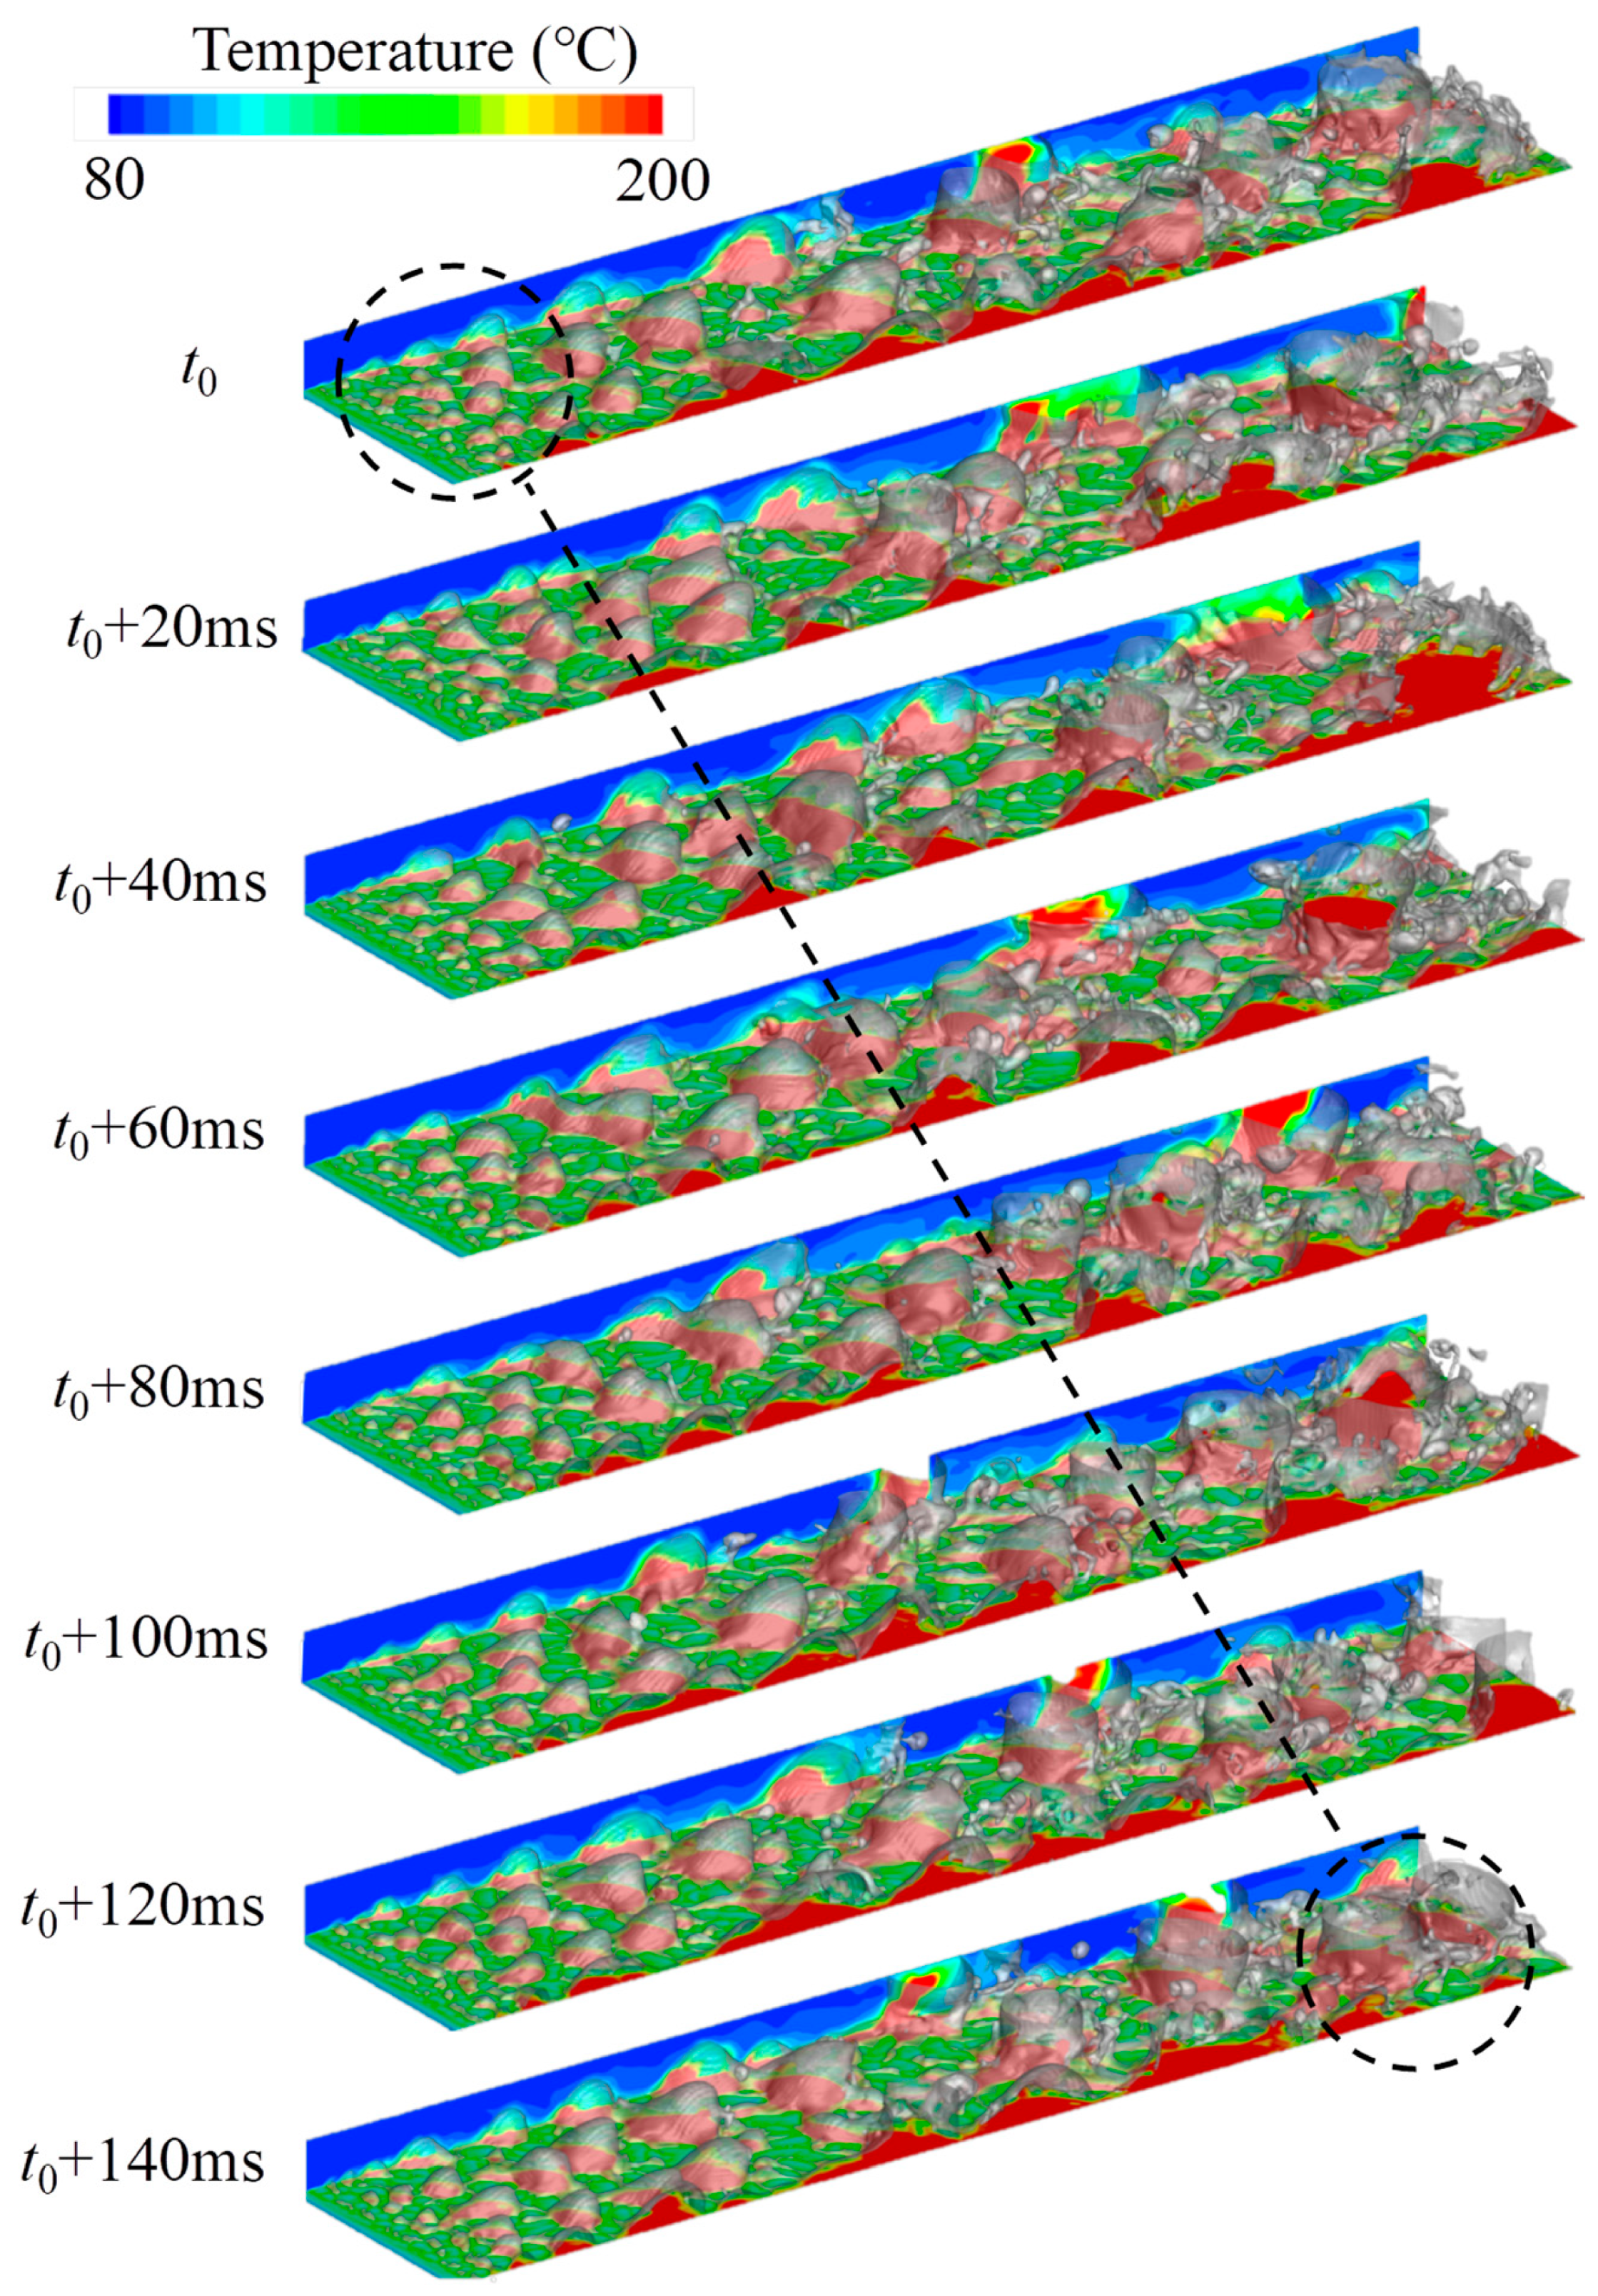
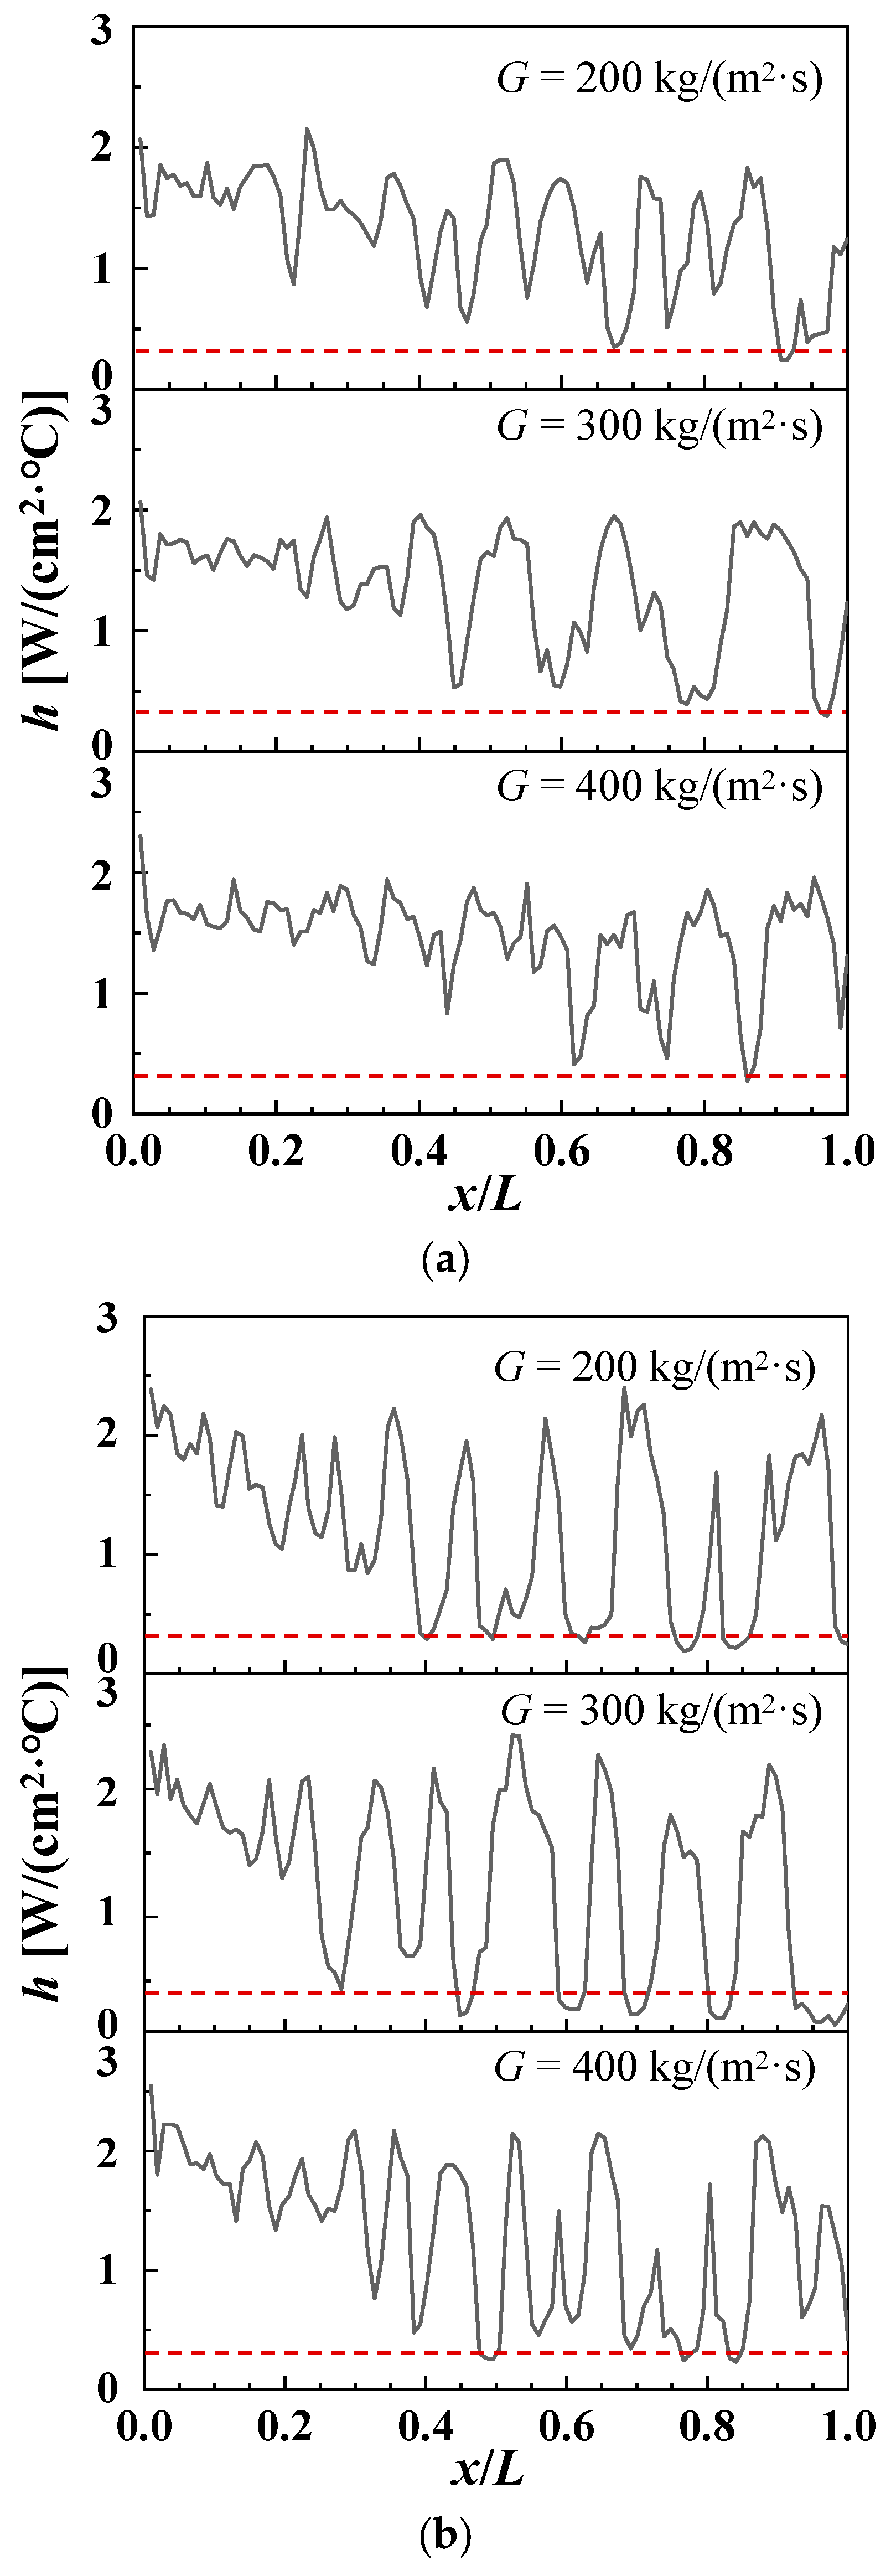
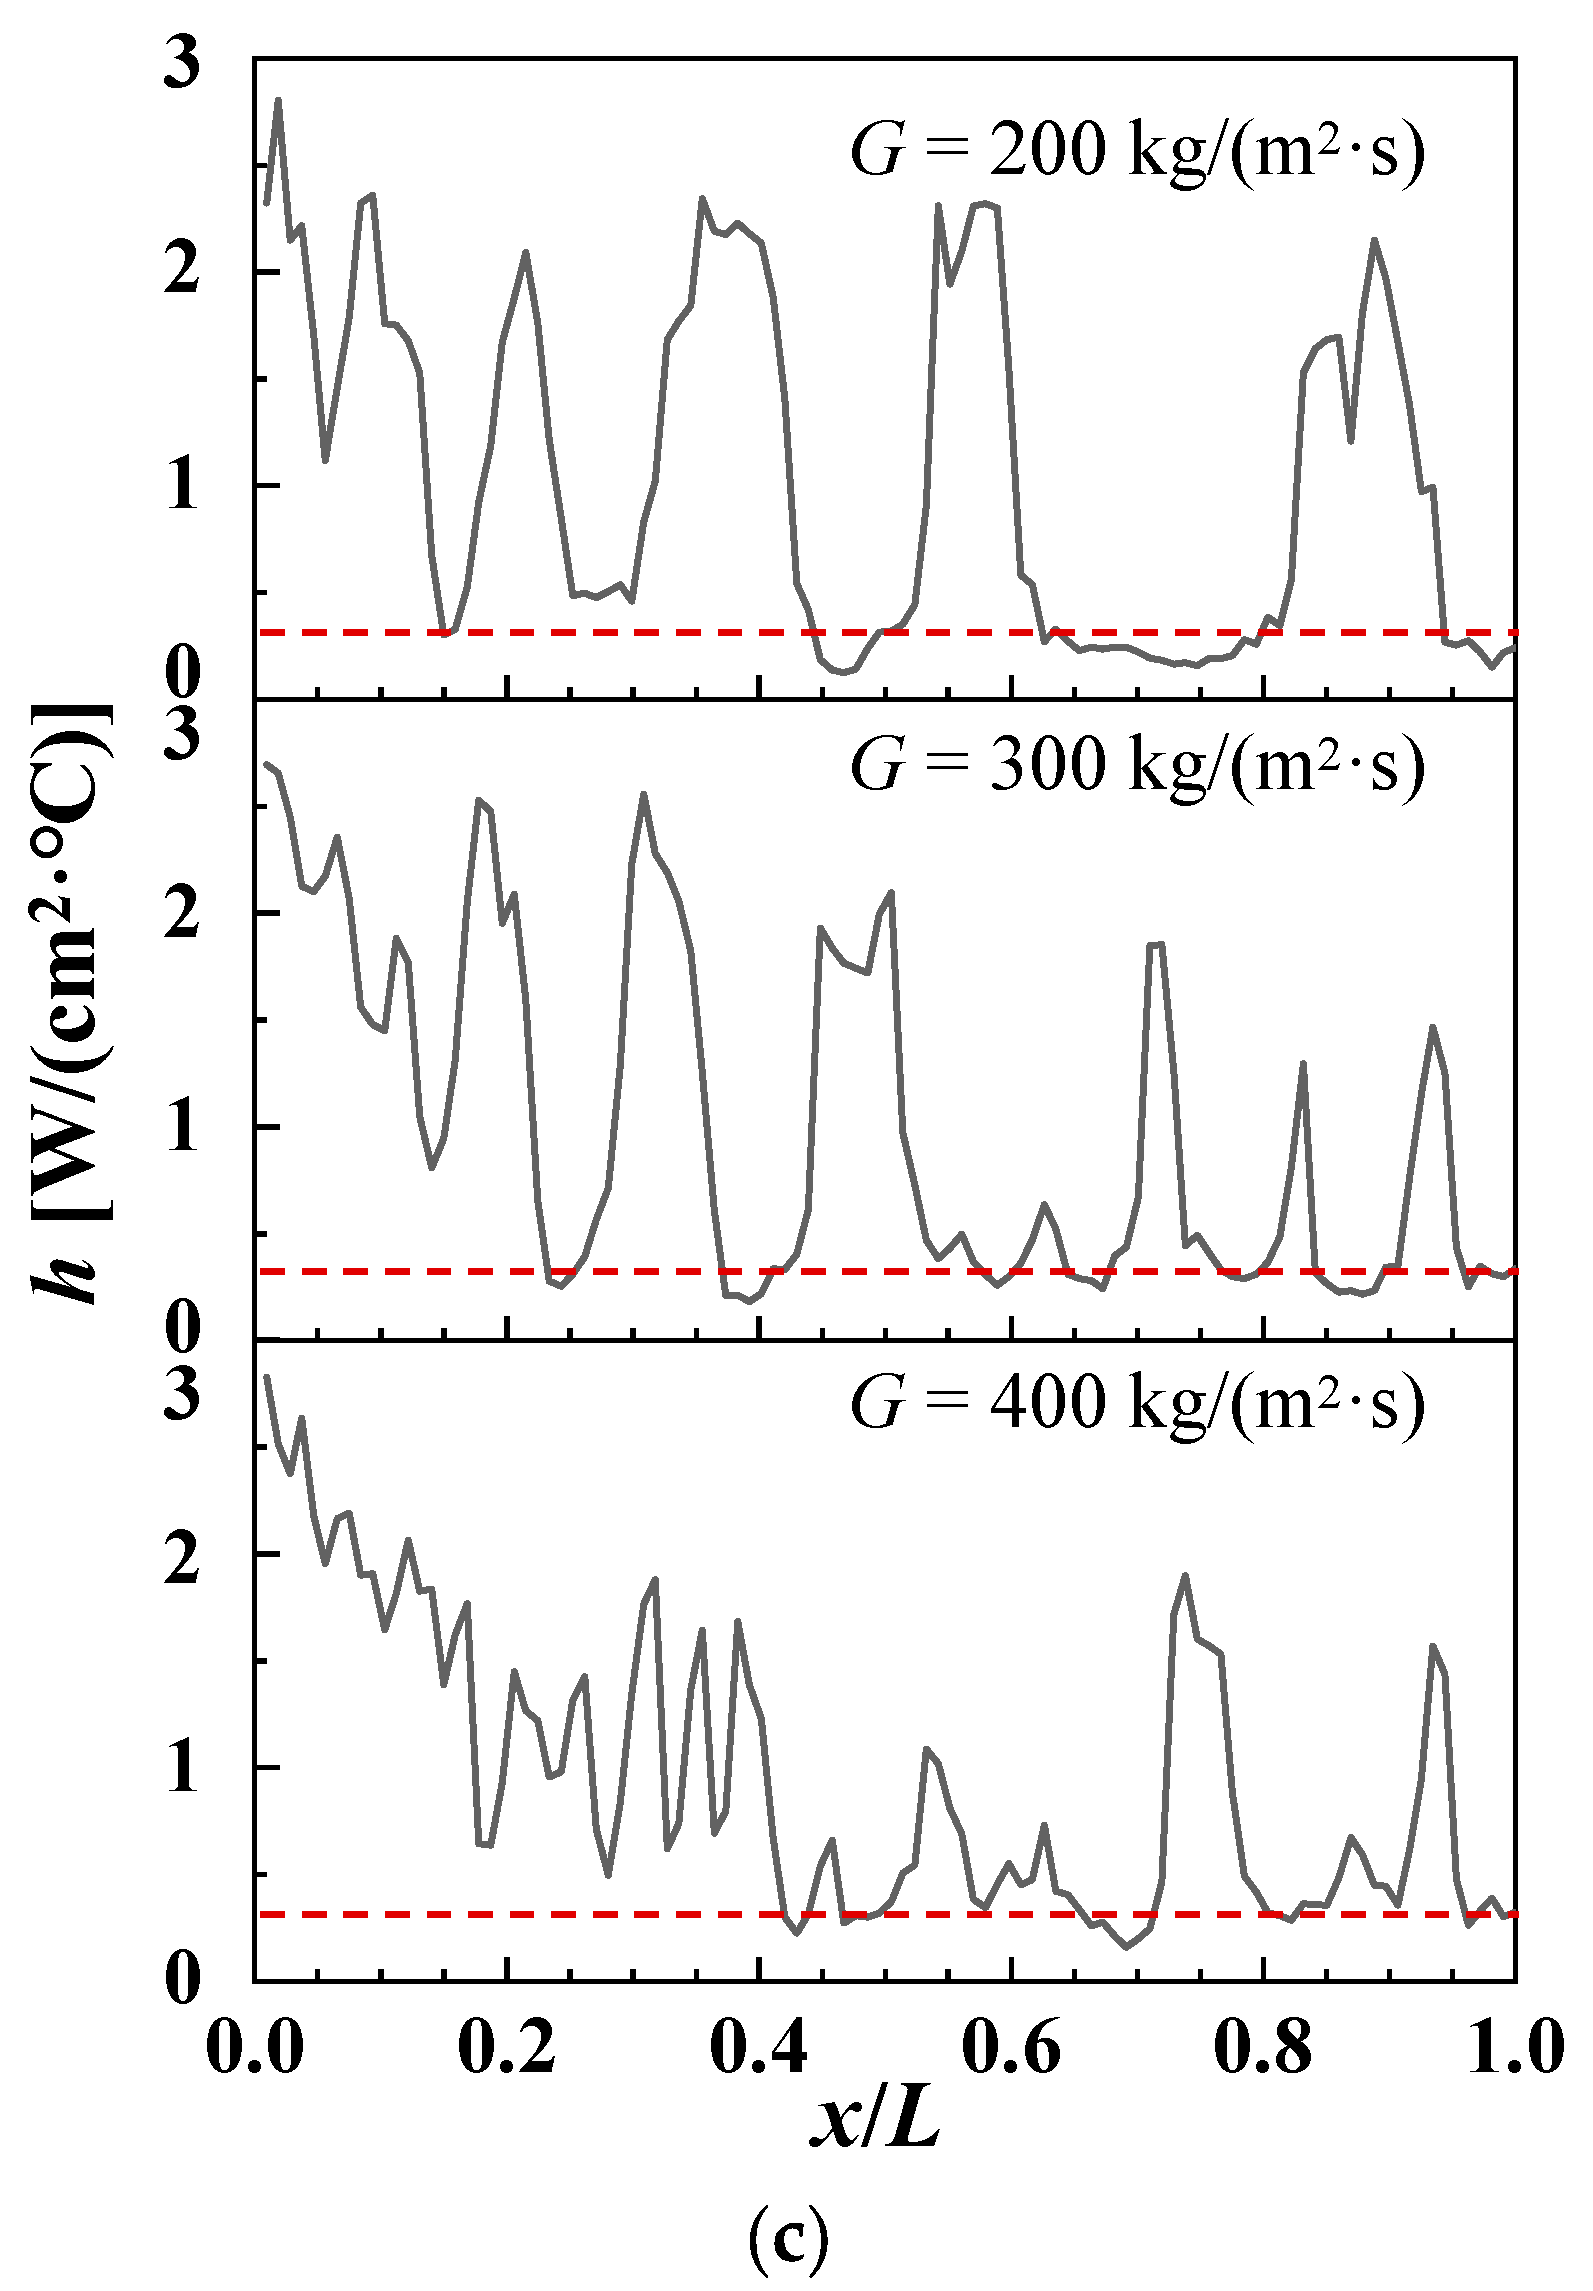
Multiple flow regimes coexist under high-heat flux. Increased heat flux accelerates bubble nucleation and coalescence, while reduced mass flux promotes earlier slug formation and upstream flow regime transitions, resulting in thermal performance degradation.
(3)
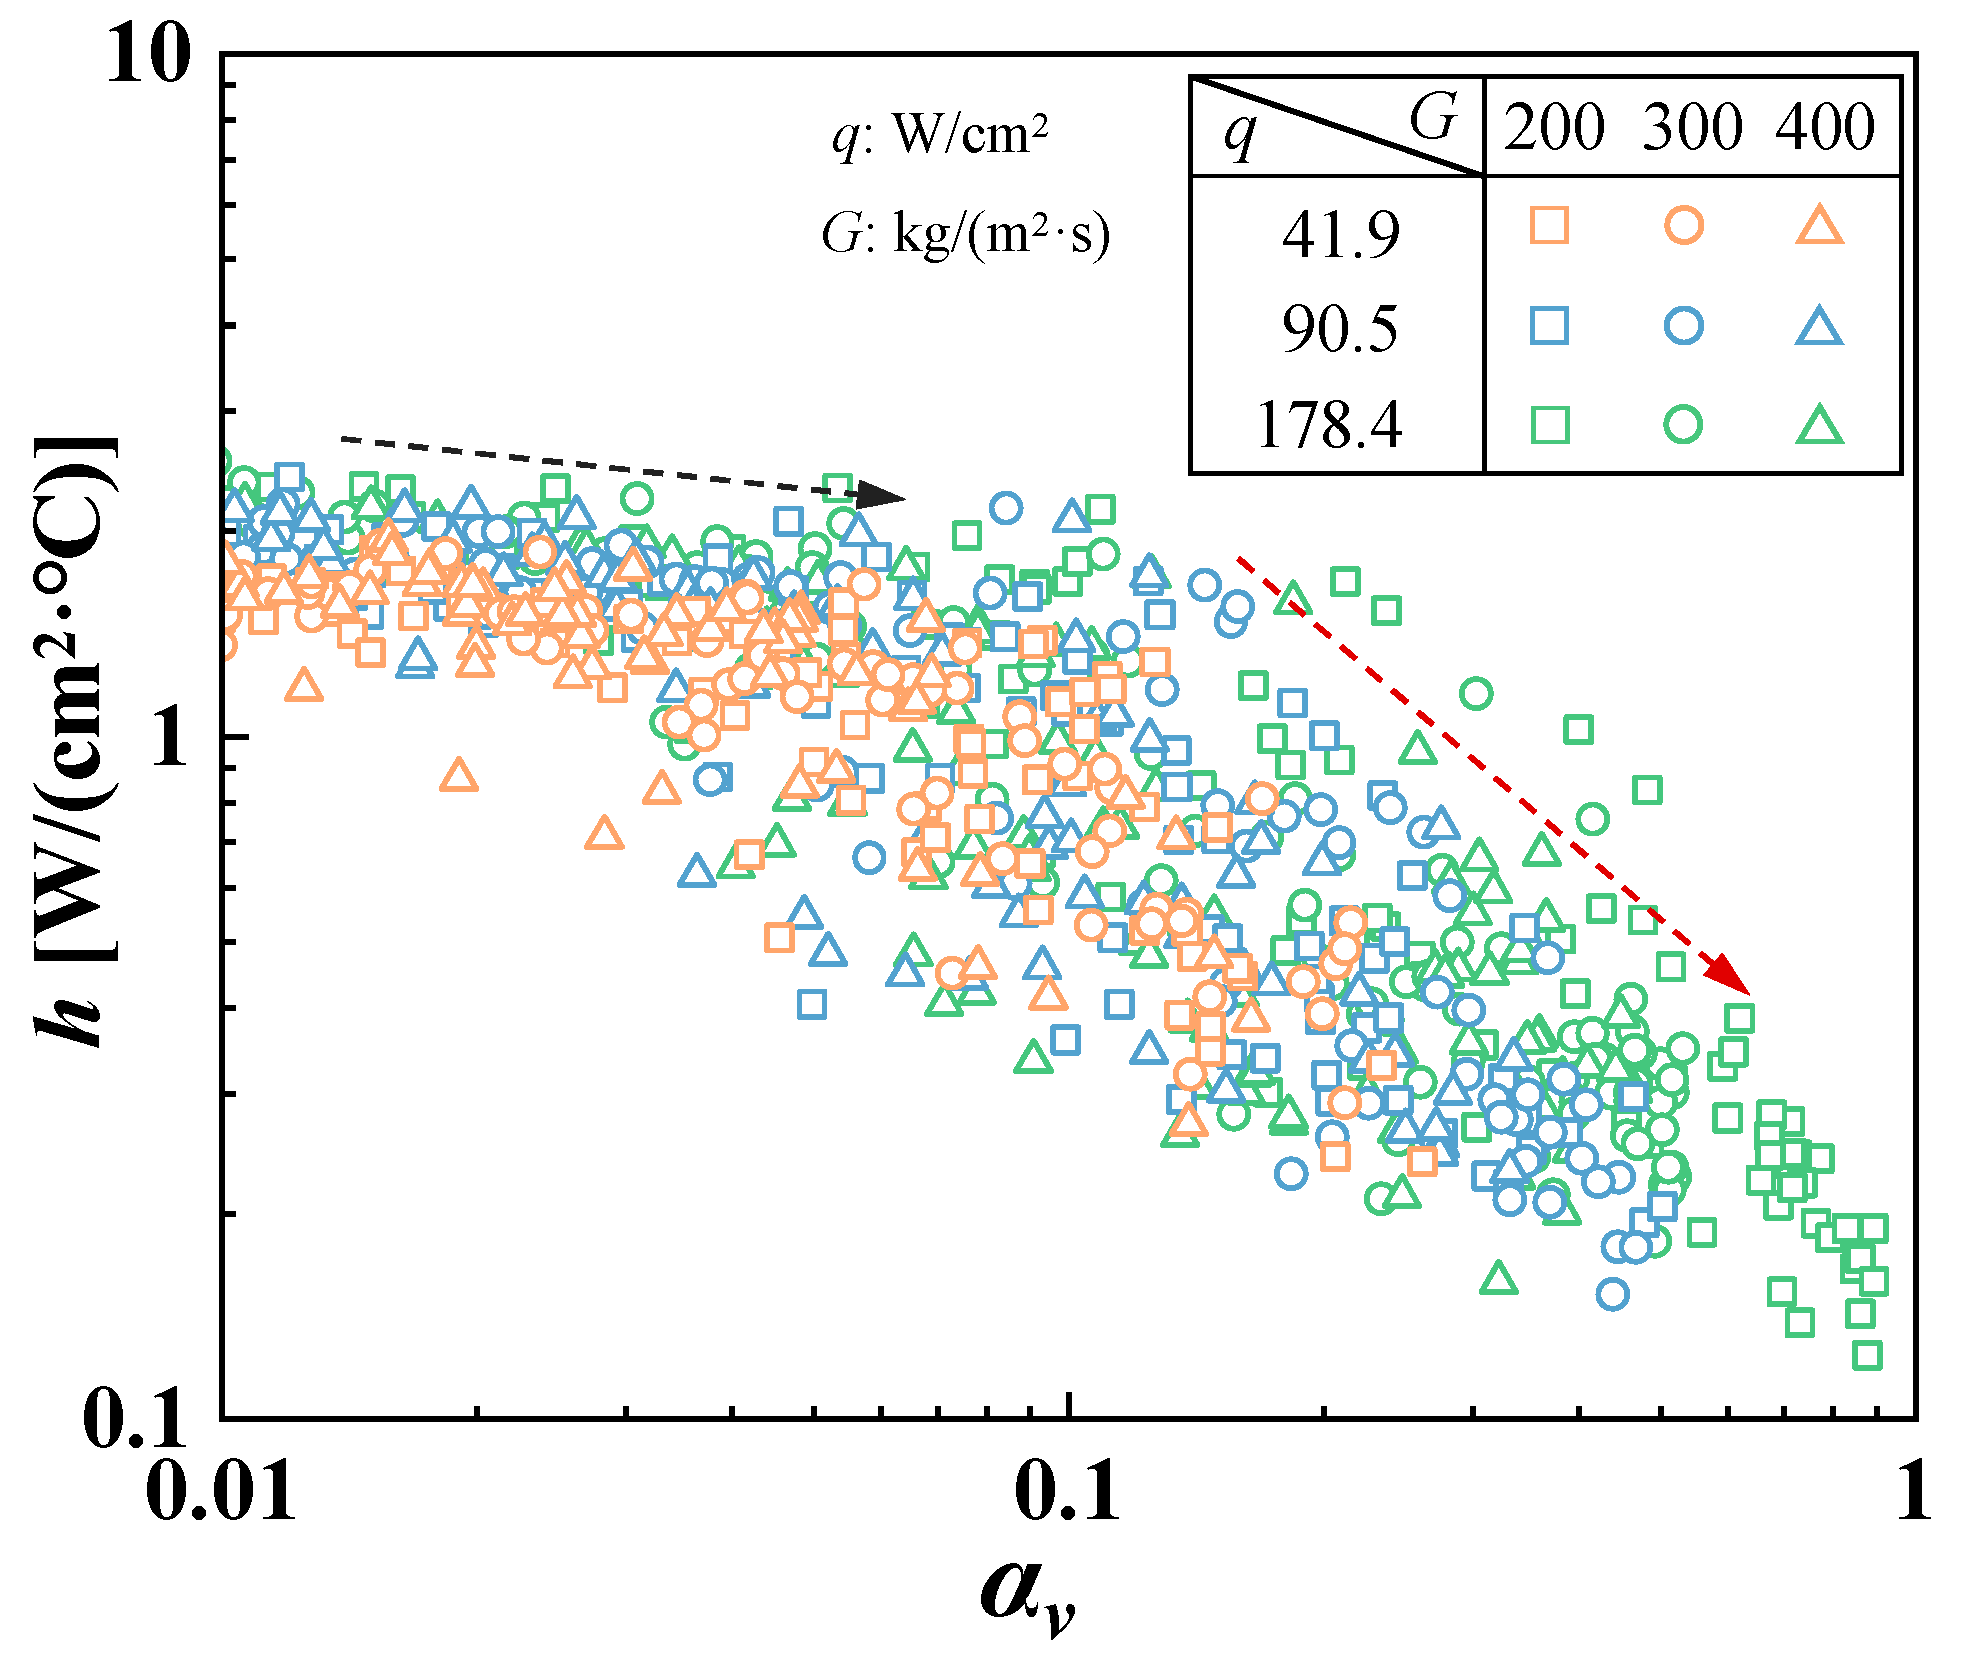
The local vapor volume fraction effectively identifies flow regime transitions, with critical values of 0.2 and 0.4 marking the transitions from bubbly to sweeping and sweeping to churn flows, respectively.
(4)
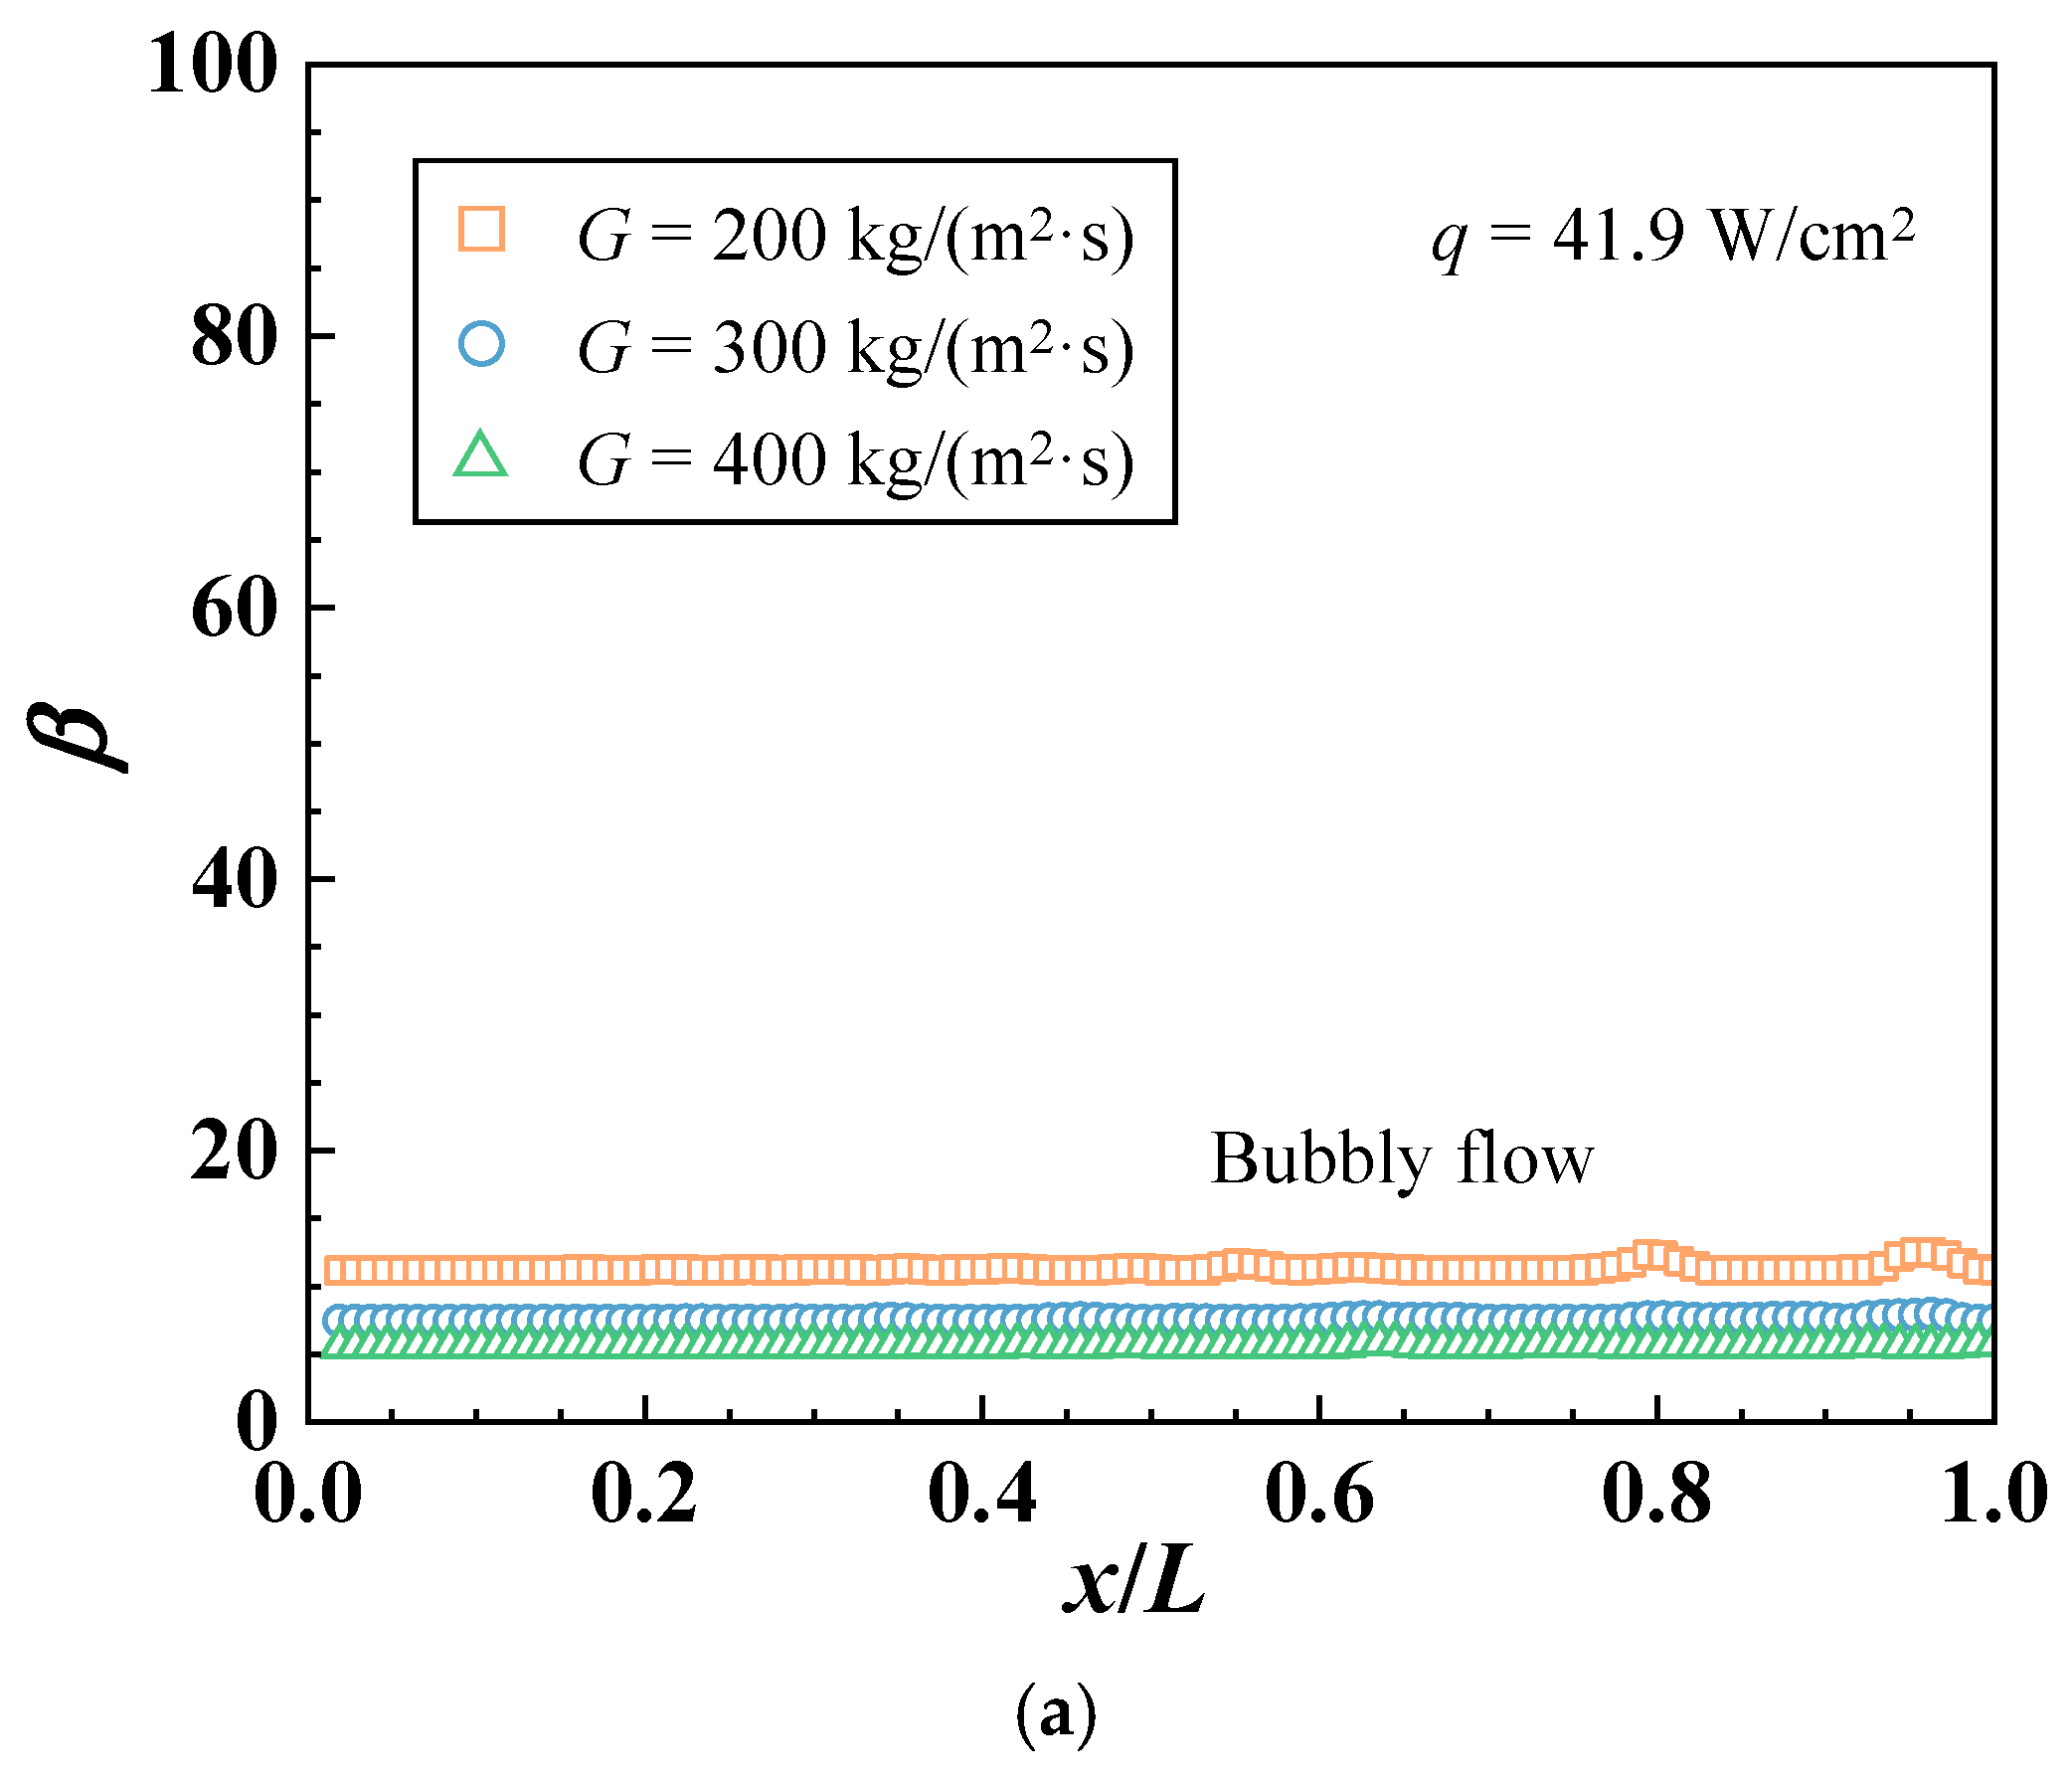
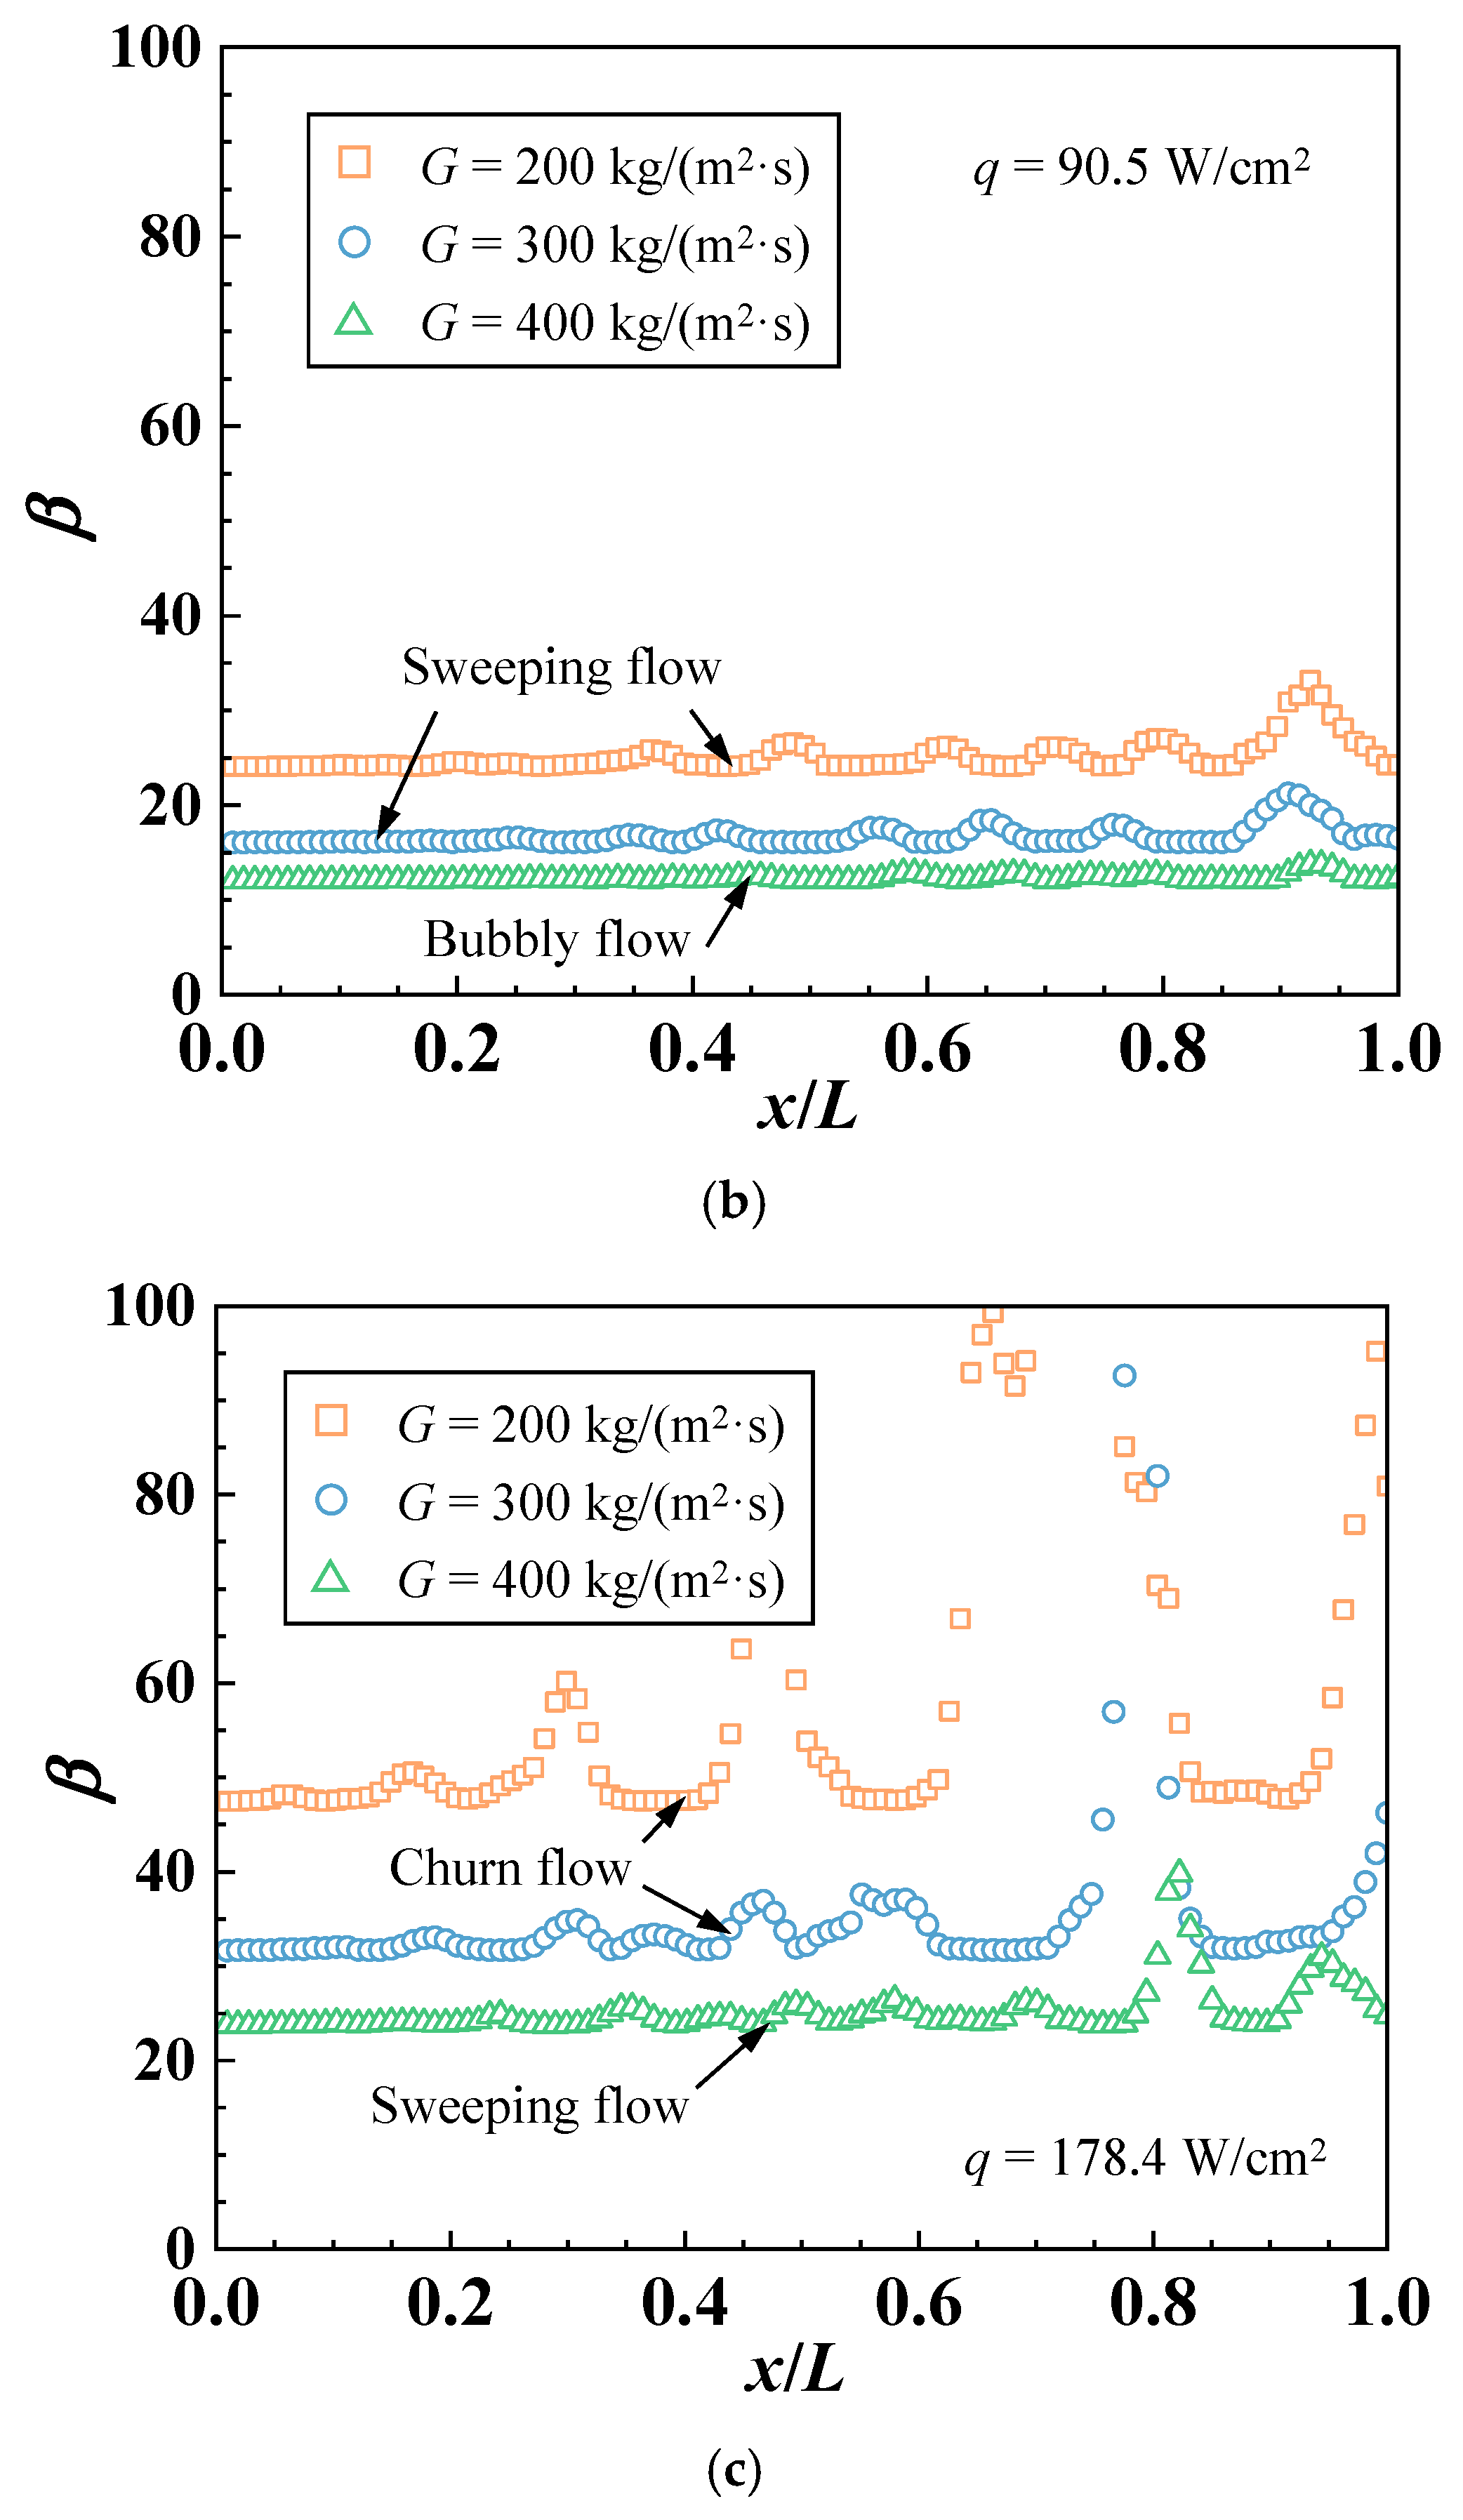
A dimensionless parameter β is introduced to classify dominant boiling flow regimes, with transition ranges of 12–16 and 24–32 corresponding to bubbly-to-sweeping and sweeping-to-churn regimes, respectively.

Author Contributions

Conceptualization, X.W. (Xianyang Wu); methodology, X.W. (Xianyang Wu); validation, X.W. (Xianyang Wu) and X.W. (Xiao Wang); formal analysis, X.W. (Xianyang Wu); investigation, X.W. (Xianyang Wu); resources, Y.L. and L.L.; data curation, X.W. (Xiao Wang); writing—original draft preparation, X.W. (Xianyang Wu); writing—review and editing, Y.L.; supervision, Y.L. and L.L.; project administration, Y.L.; funding acquisition, Y.L. All authors have read and agreed to the published version of the manuscript.

Funding

This research was funded by the National Natural Science Foundation of China [No. 52206057], the Open Foundation of State Key Laboratory of High-end Compressor and System Technology [No. SKL-YSJ202406], the National Natural Science Foundation of China [No. U24A20140], and the Zhejiang Provincial Key Research and Development Project [No. 2024C01117].

Data Availability Statement

The original contributions presented in the study are included in the article; further inquiries can be directed to the corresponding authors.

Conflicts of Interest

The authors declare no conflicts of interest.

Nomenclature

Roman symbolsWchannel width, m
Boboiling numberxaxial position, m/vapor quality
cpisobaric specific heat, J/(kg·K)
Dhhydraulic diameter, mGreek symbols
Einternal energy, Jαvolume fraction
Fvolconverted volumetric force, Nβdimensionless parameter
ggravitational acceleration, m/s2ρdensity, kg/m3
Gmass flux, kg/(m2·s)κcurvatures, 1/m
hheat transfer coefficient, W/(m2·K)φthermophysical properties
Hchannel height, mσsurface tension, N/m
ilvlatent heat of vaporization, J/kgμdynamic viscosity, Pa·s
Lchannel length, mλthermal conductivity, W/(m·K)
ppressure, Pa
qheat flux, W/m2Subscripts
rlevaporation coefficient, 1/savgaveraged value
rvcondensation coefficient, 1/ssatsaturation point
Ssource term/slip ratiolliquid phase
ttime, svvapor phase
t0initial time, sexpexperimental data
Ttemperature, Ksimsimulation results
uvelocity, m/s

References

  1. Joshi, S.N.; Dede, E.M. Two-phase jet impingement cooling for high heat flux wide band-gap devices using multi-scale porous surfaces. Appl. Therm. Eng. 2017, 110, 10–17. [Google Scholar] [CrossRef]
  2. Bertsch, S.S.; Groll, E.A.; Garimella, S.V. Effects of heat flux, mass flux, vapor quality, and saturation temperature on flow boiling heat transfer in microchannels. Int. J. Multiph. Flow 2009, 35, 142–154. [Google Scholar] [CrossRef]
  3. Qu, W.; Mudawar, I. Flow boiling heat transfer in two-phase micro-channel heat sinks-I. Experimental investigation and assessment of correlation methods. Int. J. Heat Mass Tran. 2003, 46, 2755–2771. [Google Scholar] [CrossRef]
  4. Kandlikar, S.G.; Grande, W.J. Evolution of microchannel flow passages-thermohydraulic performance and fabrication technology. Heat Transfer Eng. 2003, 24, 3–17. [Google Scholar] [CrossRef]
  5. Jiang, L.; Wong, M.; Zohar, Y. Forced Convection Boiling in a Microchannel Heat Sink. J. Microelectromech. Syst. 2001, 10, 80–87. [Google Scholar] [CrossRef]
  6. Yin, L.; Xu, R.; Jiang, P.; Cai, H.; Jia, L. Subcooled flow boiling of water in a large aspect ratio microchannel. Int. J. Heat Mass Tran. 2017, 112, 1081–1089. [Google Scholar] [CrossRef]
  7. Ma, D.; Pang, L.; Wu, H. Numerical investigation on boiling heat transfer in a rectangular channel under sub-atmospheric environment. Therm. Sci. Eng. Prog. 2023, 46, 102182. [Google Scholar] [CrossRef]
  8. Xie, L.; Hu, B.; Xu, Y.; Lin, M.; Wang, Q. Experimental study on flow boiling heat transfer in rigid-tail rib-channel under rolling motion conditions. Appl. Therm. Eng. 2025, 258, 124468. [Google Scholar] [CrossRef]
  9. Li, Q.; Fu, X.; Lin, Z.; Liu, X.; Zhao, B.; Cai, W. Analysis of complex methane transcritical flow and heat transfer mechanism in PCHE Zigzag channel. Int. J. Therm. Sci. 2025, 210, 109678. [Google Scholar] [CrossRef]
  10. Chen, Z.; Hu, J.; Zhang, Z.; Li, J.; Zhang, G.; Han, F. Gradient distribution surface texture for enhancing the surface heat transfer performance of the mini-channel. Appl. Therm. Eng. 2025, 270, 126237. [Google Scholar] [CrossRef]
  11. Zhang, Z.; Cui, K.; Zhao, H.; Han, T.; He, K.; Yan, X. Experimental investigation into flow boiling heat transfer in ribbed micro-channel with porous-decorated sidewalls. Int. J. Therm. Sci. 2025, 214, 109883. [Google Scholar] [CrossRef]
  12. Song, W.; Li, W.; Lin, S.; Ye, H.; Li, G. Experimental and numerical investigation of flow pattern evolution and flow-induced vibrations in an M-shaped subsea jumper under gas-liquid two-phase flow conditions. Ocean Eng. 2025, 327, 120964. [Google Scholar] [CrossRef]
  13. Shu, Q.; Mo, D.-M.; Hu, Y.-P.; Wu, C.-M.; Li, Y.-R. Formation mechanism and evolution of flow patterns for thermal convection in an inner cylinder-heated annular pool. Int. Commun. Heat Mass Transfer 2024, 158, 107963. [Google Scholar] [CrossRef]
  14. Sun, C.; Dai, R.; Tao, L.; Huang, L.; Gu, S.; Zhang, Y.; Gu, Z. Experimental study on the relationship between the flow pattern and heat transfer characteristics of flow boiling in a vertical upward rectangular narrow channel. Int. J. Heat Mass Tran. 2025, 242, 126844. [Google Scholar] [CrossRef]
  15. Brutin, D.; Tadrist, L. Pressure drop and heat transfer analysis of flow boiling in a minichannel: Influence of the inlet condition on two-phase flow stability. Int. J. Heat Mass Tran. 2004, 47, 2365–2377. [Google Scholar] [CrossRef]
  16. Katiyar, G.; Karagadde, S.; Saha, S.K.; Sharma, A. Numerical modelling of bubble growth in microchannel using level set method. Int. J. Heat Mass Tran. 2016, 101, 719–732. [Google Scholar] [CrossRef]
  17. Wang, Q.; Cao, J.; Su, D.; Li, M.; Dang, C.; Liu, X.; Song, R.; Li, J. Numerical simulation of R134a flow boiling heat transfer in a horizontal mini-channel under various gravity levels. Int. J. Heat Mass Tran. 2024, 235, 126141. [Google Scholar] [CrossRef]
  18. Wang, G.; Cheng, P. Subcooled flow boiling and microbubble emission boiling phenomena in a partially heated microchannel. Int. J. Heat Mass Tran. 2009, 52, 79–91. [Google Scholar] [CrossRef]
  19. Zhu, Y.; Li, X.; Liu, Y.; Mubarak, S.; Wang, S. Experimental study of flow boiling characteristics in minigap channels over a wide heat flux range. Int. J. Heat Mass Tran. 2023, 201, 123567. [Google Scholar] [CrossRef]
  20. He, J.; Hou, Q.; Yang, X.; Duan, H.; Lin, L. Isolated slug traveling in a voided line and impacting at an end orifice. Phys. Fluids 2024, 36, 027105. [Google Scholar] [CrossRef]
  21. Tan, X.; Han, X.; Li, X.; Meng, Z.; Zhang, F.; Li, L.; Li, T.; Peng, X.; Yuan, H. Modeling the water transport in water invasion channel with water invasion unit numerical simulation based on intelligent proxies. Phys. Fluids 2025, 37, 023330. [Google Scholar] [CrossRef]
  22. Song, Y.; Huang, G.; Yin, J.; Wang, D. Three-dimensional reconstruction of bubble geometry from single-perspective images based on ray tracing algorithm. Meas. Sci. Technol. 2024, 36, 016010. [Google Scholar] [CrossRef]
  23. Yin, L.; Jiang, P.; Xu, R.; Wang, W.; Jia, L. Visualization of flow patterns and bubble behavior during flow boiling in open microchannels. Int. Commun. Heat Mass Transfer 2017, 85, 131–138. [Google Scholar] [CrossRef]
  24. Gu, S.; Tao, L.; Jin, C.; Ju, Y.; Zhao, X. Study of flow pattern transition criterion and heat transfer characteristics in vertical rectangular narrow channel for steam heating. Int. J. Heat Mass Tran. 2024, 220, 124877. [Google Scholar] [CrossRef]
  25. Revellin, R.; Dupont, V.; Ursenbacher, T.; Thome, J.R.; Zun, I. Characterization of diabatic two-phase flows in microchannels: Flow parameter results for R-134a in a 0.5 mm channel. Int. J. Multiph. Flow 2006, 32, 755–774. [Google Scholar] [CrossRef]
  26. Wilmarth, T.; Ishii, M. Two-phase flow regimes in narrow rectangular vertical and horizontal channels. Int. J. Heat Mass Tran. 1994, 37, 1749–1758. [Google Scholar] [CrossRef]
  27. Chalgeri, V.S.; Jeong, J.H. Flow regime transition criteria for vertical downward two-phase flow in rectangular channel. Nucl. Eng. Technol. 2022, 54, 546–553. [Google Scholar] [CrossRef]
  28. Viggiano, B.; Skjæraasen, O.; Schümann, H.; Tutkun, M.; Cal, R.B. Characterization of flow dynamics and reduced-order description of experimental two-phase pipe flow. Int. J. Multiph. Flow 2018, 105, 91–101. [Google Scholar] [CrossRef]
  29. Oliveira, J.D.; Copetti, J.B.; Indrusiak, M.L.S.; Souza, R.R.; Lima, R. On the nature of flow patterns and pressure drop fluctuations during flow boiling. Int. J. Multiph. Flow 2021, 144, 103793. [Google Scholar] [CrossRef]
  30. Da Riva, E.; Del Col, D.; Garimella, S.V.; Cavallini, A. The importance of turbulence during condensation in a horizontal circular minichannel. Int. J. Heat Mass Tran. 2012, 55, 3470–3481. [Google Scholar] [CrossRef]
  31. Zhang, J.; Li, W.; Minkowycz, W. Numerical simulation of condensation for R410A at varying saturation temperatures in mini/micro tubes. Numer. Heat Transf. Part A Appl. 2016, 69, 464–478. [Google Scholar] [CrossRef]
  32. Yang, Z.; Peng, X.; Ye, P. Numerical and experimental investigation of two phase flow during boiling in a coiled tube. Int. J. Heat Mass Tran. 2008, 51, 1003–1016. [Google Scholar] [CrossRef]
  33. Liu, H.; Tang, J.; Sun, L.; Mo, Z.; Xie, G. An assessment and analysis of phase change models for the simulation of vapor bubble condensation. Int. J. Heat Mass Tran. 2020, 157, 119924. [Google Scholar] [CrossRef]
  34. Chalgeri, V.S.; Jeong, J.H. Flow patterns of vertically upward and downward air-water two-phase flow in a narrow rectangular channel. Int. J. Heat Mass Tran. 2019, 128, 934–953. [Google Scholar] [CrossRef]
  35. Hibiki, T.; Mishima, K. Flow regime transition criteria for upward two-phase flow in vertical narrow rectangular channels. Nucl. Eng. Des. 2001, 203, 117–131. [Google Scholar] [CrossRef]
Figure 1. Schematic diagram of calculation domain and boundary conditions.
Water 17 01580 g001
Figure 2. Grid conditions of the calculation domain.
Water 17 01580 g002
Figure 3. Average wall temperature of heated area calculated with different grid numbers.
Water 17 01580 g003
Figure 4. Comparison between simulated boiling flow patterns and the corresponding visualization images under G = 400 kg/(m2·s) for different heat-flux conditions. (a) Simulation results. (b) Visualization images [19].
Water 17 01580 g004
Figure 5. The comparison between the simulated and experimentally measured heat transfer coefficients at various monitoring points under G = 400 kg/(m2·s) for different heat-flux conditions.
Water 17 01580 g005
Figure 6. Evolution of boiling flow patterns and corresponding wall temperature distributions within the channel under G = 400 kg/(m2·s) and q = 41.9 W/cm2.
Water 17 01580 g006
Figure 7. Evolution of bubble flow patterns and corresponding wall temperature distributions within the channel under G = 400 kg/(m2·s) and q = 90.5 W/cm2.
Water 17 01580 g007
Figure 8. Evolution of bubble flow patterns and corresponding wall temperature distributions within the channel under G = 400 kg/(m2·s) and q = 178.4 W/cm2.
Water 17 01580 g008
Figure 9. Effects of mass flux on liquid–vapor flow patterns and wall temperature distributions in the channel under heat-flux conditions of q = 41.9, 90.5 and 178.4 W/cm2: (a) q = 41.9 W/cm2; (b) q = 90.5 W/cm2; (c) q = 178.4 W/cm2.
Water 17 01580 g009
Figure 10. Statistical analysis of the axial distribution of dominant flow regimes along the channel under different mass-flux and heat-flux conditions.
Water 17 01580 g010
Figure 11. Streamline patterns and velocity distributions around bubbles under three typical boiling flow patterns. (a) Bubbly flow. (b) Sweeping flow. (c) Churn flow.
Water 17 01580 g011aWater 17 01580 g011b
Figure 12. Axial distribution of cross-sectional αv under different mass-flux and heat-flux conditions: (a) q = 41.9 W/cm2; (b) q = 90.5 W/cm2; (c) q = 178.4 W/cm2.
Water 17 01580 g012
Figure 13. Axial distribution of heat transfer coefficient on the heated area under different heat-flux and mass-flux conditions: (a) q = 41.9 W/cm2; (b) q = 90.5 W/cm2; (c) q = 178.5 W/cm2.
Water 17 01580 g013aWater 17 01580 g013b
Figure 14. The variation in heat transfer coefficient with volume fraction of vapor phase under different heat-flux and mass-flux conditions.
Water 17 01580 g014
Figure 15. Axial distribution of cross-sectional β under different mass-flux and heat-flux conditions: (a) q = 41.9 W/cm2; (b) q = 90.5 W/cm2; (c) q = 178.4 W/cm2.
Water 17 01580 g015aWater 17 01580 g015b
Table 1. Simulation conditions of subcooled boiling flow in a rectangular small channel.
ParametersSymbolUnitValue
Inlet temperatureTin80
Outlet pressurepoutkPa101.325
Mass fluxGkg/(m2·s)200/300/400
Heat fluxqW/cm241.9/90.5/178.4
Table 2. Numerical simulation settings.
ItemContent
Transient formulationFirst-order implicit
GradientLeast-square cell based
Pressure–velocity couplingCoupled
PressurePRSETO!
Momentum and energyBounded Central Differencing
Max iterations20
Time step10−5 s
Disclaimer/Publisher’s Note: The statements, opinions and data contained in all publications are solely those of the individual author(s) and contributor(s) and not of MDPI and/or the editor(s). MDPI and/or the editor(s) disclaim responsibility for any injury to people or property resulting from any ideas, methods, instructions or products referred to in the content.

