Article

Restoring Lakeshore Vegetation in the Face of Hysteresis: A Water-Level and Sediment-Based Strategy for Shallow Lakes

1
The Miyagi Prefectural Izunuma-Uchinuma Environmental Foundation, 17-2 Shikimi, Wakayanagi, Kurihara-shi 989-5504, Miyagi, Japan
2
Japan Wildlife Research Center, 3-3-7 Kotobashi, Sumida-ku, Tokyo 130-8606, Japan
3
Graduate School of Engineering, Tohoku University, 6-6-06 Aoba, Sendai 980-8579, Miyagi, Japan
4
Department of Biology, Faculty of Science, Yamagata University, 1-4-12 Kojirakawa, Yamagata 990-8560, Japan
*
Author to whom correspondence should be addressed.
Water 2025, 17(12), 1760; https://doi.org/10.3390/w17121760
Submission received: 1 April 2025 / Revised: 28 May 2025 / Accepted: 3 June 2025 / Published: 12 June 2025
(This article belongs to the Section Water, Agriculture and Aquaculture)

Abstract

Long-term sedimentation patterns influence the ecological succession of shallow lakes. However, human-induced impacts can disrupt these processes, leading to prolonged hysteresis. Using historical sedimentation data, we simulated the future terrestrialization of Lake Izunuma-Uchinuma, a Ramsar-listed wetland in Japan. The results indicated that ecotone recovery would take over 150 years, highlighting the strong legacy effects of shoreline vegetation loss. To accelerate restoration, we implemented an integrated approach that combined water-level management with sediment stabilization structures, including fences and coconut mat rolls. Over three years, these interventions successfully restored shoreline sediment accumulation, facilitated the re-establishment of Zizania latifolia (from 328 m2 to 1537 m2 in Ecotone 1), and improved water quality and waterbird use. Waterbird abundance significantly increased (p < 0.05) in the treated zones, and sediment exposure led to a reduction in COD release, indicating improved substrate conditions. Our results suggest that proactive ecotone restoration strategies, including hydrological regulation and sediment management, are essential in lakes where natural recovery is hindered by long-term sedimentation deficits and water-level changes. This study highlights the importance of integrating these measures to mitigate hysteresis and enhance ecosystem resilience in degraded shallow lakes.

1. Introduction

Freshwater fauna are declining worldwide, causing serious ecological concerns [1]. Ecotones, which are the transition zones between terrestrial and aquatic ecosystems, are critical in lake environments because they serve as essential interfaces that maintain hydrological connectivity, support diverse aquatic vegetation, and sustain high biodiversity. Frequent flooding promotes seed dispersal and seedling establishment in aquatic plants, whereas water-level fluctuations and sediment dynamics influence species composition and community structure [2,3,4]. These vegetation communities provide spawning and nursery habitats for fish and amphibians, spawning and shelter for insects, and breeding sites for birds, thereby sustaining high biodiversity [5,6,7,8,9,10].
Despite their ecological importance, lakeshore vegetation communities have declined in many regions due to altered water levels, eutrophication, invasive species, floods, and herbivory [11,12,13,14,15]. This decline compromises the water purification capacity, accelerates terrestrial and aquatic biodiversity loss, and reduces the ecological functions of these transitional zones [16,17]. High water-level management for water use is a major driver of these impacts [18], and studies from around the world have documented the resulting loss of lakeshore vegetation [15,19,20]. In response, various restoration methods have been implemented, such as adjusting water levels, adding sediment, and introducing woody structures [21,22,23,24,25,26]. However, owing to site-specific geomorphology and hydrology, a systematic framework is needed to effectively combine these strategies [27,28]. Moreover, it is important to recognize that interventions such as modifying water-level regimes or altering shoreline structures can sometimes trigger unexpected ecological responses [27,28,29,30,31].
In Japan, Lake Izunuma-Uchinuma exemplifies both the ecological richness of such zones and the challenges faced by them. Designated under the Ramsar Convention for its significance as a habitat for overwintering geese and other waterbirds, this wetland supports over 100,000 geese [32] and is extensively covered by the lotus Nelumbo nucifera and water chestnut (Trapa spp.), fostering a high diversity of aquatic organisms [33]. Records indicate approximately 40 freshwater fish species and many dragonfly taxa, including endangered species, such as the small-scale bitterling (Acheilognathus typus) and the endangered damselfly Paracercion plagiosum [34,35]. These native species have been the focus of long-term monitoring, and active conservation efforts have been undertaken, such as implementing control projects when ecosystem impacts by largemouth bass (Micropterus nigricans) were detected [35,36]. Nonetheless, the lake has undergone land reclamation, water-level regulation, and eutrophication, all of which have accelerated changes in its lakeshore vegetation [37,38,39,40], although some aquatic plants and animals continue to thrive in certain areas.
To address these challenges, this study assessed the effects of water-level management on shoreline vegetation, predicted ecotone regeneration for up to 300 years based on past sediment accumulation, proposed a restoration strategy focused on sediment retention, and evaluated its effectiveness in terms of vegetation growth, aquatic organisms, and water quality. Through these investigations, we aimed to develop an integrated restoration framework for lakeshore vegetation affected by ongoing anthropogenic pressures.

2. Materials and Methods

2.1. Study Site

This study was conducted at Lake Izunuma-Uchinuma (38°43′ N, 141°07′ E) in northeastern Japan (Figure 1a). The lake is a natural freshwater ecosystem encompassing 491 ha, with a shoreline of approximately 20 km (Figure 1b [32]). Situated at an elevation of 6 m in a lowland basin, it has gradually become shallower over several thousand years owing to sediment accumulation. The water body consists of two basins, Lakes Izunuma and Uchinuma, which are connected by a channel. Consequently, management activities have treated these two basins as a single ecological unit [32]. Therefore, we refer to the lakes collectively as “Lake Izunuma-Uchinuma” unless specifically referring to one basin or the other.
The maximum depth of the lake is 1.6 m, with an average depth of 0.77 m [32]. As Lake Izunuma-Uchinuma is eutrophic, most of the lakebeds are muddy, although some shoreline areas consist of sandy substrates [41]. Recent water-quality data reflect this eutrophic condition, with a chemical oxygen demand (COD) of approximately 10 mg/L, total nitrogen of approximately 1.0 mg/L, total phosphorus of approximately 0.1 mg/L, suspended solids of approximately 25 mg/L, and dissolved oxygen of approximately 4 mg/L [32]. The watershed spans approximately 5000 ha and receives inflow from multiple rivers and channels on its western side, discharging through a single outflow on the eastern side. A weir on the outflow regulates the lake levels, which are referenced to the Kitakami River Peil (hereafter K.P.).

2.2. Analysis of Water Levels and Lakebed Elevation

2.2.1. Water-Level Data and Long-Term Trends

We analyzed historical changes in the water level using data from the Numakuchi Observation Station (Ministry of Land, Infrastructure, Transport and Tourism; Arakawa of the Kitakami River system) (https://www.river.go.jp/kawabou/pcfull/tm?itmkndCd=4&ofcCd=1025&obsCd=8&isCurrent=true&fld=0, accessed on 9 February 2025). The monthly mean water levels from 1983 to 2016 were calculated to identify the maximum (high) and minimum (low) values of each year. Both the water level and lakebed elevation were expressed relative to the K.P.

2.2.2. Creation of Bathymetric Maps and Digital Elevation Models

Bathymetric maps from 1985 and 2007 (compiled by Miyagi Prefecture) were used to generate digital elevation models (DEMs). In some areas, data gaps were supplemented with a 5 m DEM from the Geospatial Information Authority of Japan (https://service.gsi.go.jp/kiban/app/, accessed on 9 February 2025). These data were processed in a geographic information system (GIS) using the UTM Zone 54N (JGD2000) coordinate system.
As no bathymetric data were available for the channel connecting Lakes Izunuma and Uchinuma, this area was excluded.

2.2.3. Calculation of Annual Sediment Accumulation

After creating separate 5 m grid DEMs for 1985 and 2007, the difference in lakebed elevation between the two years was calculated for each cell. The total grid comprised 216,586 cells (160,260 cells from Lake Izunuma and 56,326 cells from Lake Uchinuma). The annual sedimentation rate was calculated by dividing the change in elevation in each cell by the number of years between them in 0.1 mm increments.

2.3. Future Sedimentation Simulation

We performed a future shallowing simulation based on the sediment accumulation data (Figure 2). Between 1985 and 2007, some cells showed positive sedimentation, whereas others showed erosion (Figure 2a). Two initial methods—assuming uniform sedimentation across all cells (Figure 2b) and extending each cell’s observed trend—led to unrealistic results, such as large artificial ridges or perpetual erosion in certain areas.
To address these issues, we developed a “gradient allocation” method (Figure 2c). Cells with higher historical sedimentation rates were assigned proportionally larger future increments, whereas those that experienced greater erosion received smaller increments. When a cell’s elevation exceeded K.P. 6.00 m (based on Nakagawa & Hibino 1988 [42]), we assumed it became terrestrial and ceased accumulating additional sediment; i.e., that sediment was redistributed to other cells (Figure 2d).
Beginning in 2007, when Miyagi Prefecture conducted its second bathymetric survey, we ran the simulation until all cells reached the terrestrial elevation. As finer intervals caused computational failures owing to the large number of grid cells, we settled on 25-year time steps. Calculations were performed using Excel 2013, and the resulting maps were produced using QGIS version 2.18 (QGIS Association: Basel, Switzerland) and GRASS GIS version 7.2 (GRASS Development Team: Beaverton, OR, USA).

2.4. Construction of Artificial Ecotones

Two artificial ecotones were created along the southern shoreline of Lake Izunuma (Figure 1c,d). Ecotone 1 is located in an area once covered by Indian rice (Zizania latifolia), hereafter ‘Zizania latifolia’, around 1978 [43], but is now dominated by lotus and water chestnut [33]. A muddy layer (~100 mm) covered the substrate, and the Phragmites australis stand along the shore had a drop-off of 30 cm (Figure 1e). The substrate elevation before construction ranged from K.P. 6.00 to 6.17 m. In October 2021, we placed a wooden plank fence measuring 90 m in length approximately 50 m offshore (Figure 1c,e), with its top edge at K.P. 6.4 m. This design allowed water to overtop the fence at high water levels while fully draining at low water levels, promoting sedimentation and substrate consolidation and reducing herbivory by swans and wave-induced vegetation damage. Because of an existing Z. latifolia patch (~328 m2) being present, no additional planting was performed. Substrate elevations at 23 locations were measured before the fence installation (June 2021) and were remeasured three years later (October 2024).
Ecotone 2, on the eastern side of Ecotone 1, was covered by Z. latifolia in 1978 [43], but is now predominantly sandy [41] (Figure 1d). A 40 cm drop-off separated the P. australisSalix spp. stand from the lakebed (Figure 1f). In November 2020 and November 2021, we installed coconut mat rolls (20 cm in diameter [44]) 2 m offshore and filled the gap between the mats and the shore with locally sourced sand (Figure 1f). Because Z. latifolia was absent, we planted a 10 m2 stand in the newly elevated substrate at K.P. 6.4 m to ensure exposure during the autumn drawdown.
Since 2019, an improved water-level management regime has been used to enhance the ecotones (Figure 3a). Although regulations called for lowering the water level to K.P. 5.9 m in September–October for typhoon management, this was rarely practiced owing to conflicting stakeholder interests. After negotiating with land improvement districts and fisheries cooperatives, we established annual drawdowns to K.P. 5.9 m during September–October.

2.5. Evaluation of the Artificial Ecotones

2.5.1. Assessment of Z. latifolia Coverage

We surveyed the coverage of Z. latifolia in Ecotones 1 and 2 from September to November each year. We mapped the communities using a GPS logger and tape measure, and then computed the total coverage. As a reference, five Z. latifolia communities located elsewhere in Lake Izunuma (Figure 1b) were similarly surveyed in 2019 and 2023 to compare the changes in stand area.

2.5.2. Waterbird Usage

Ecotone 2 and a nearby shoreline with a similar 40 cm drop-off were selected for waterbird monitoring (Figure 1d). Two trail cameras (RECONYX Inc., HS2X, Holmen, WI, USA) were deployed from 1 September to 31 December 2021, and photographs were taken every 15 min. Herons, ducks, and coots were the main groups of birds. As ducks and coots were often indistinguishable on camera, we classified them together as “duck/coot”, and the daily maximum count for each group was defined as the “number of observed birds”. The average daily number of birds was calculated during the monitoring period.

2.5.3. COD Release from Sediment

We also evaluated the potential water-quality benefits by measuring the COD release rates from the sediment [45]. Between October and December 2021, we collected undisturbed sediment cores from five exposed (emergent) and five submerged sampling points within each ecotone (a total of 20 samples). These sampling points were paired and located only a few meters apart within each ecotone. As the lakebed in these areas was nearly flat, and as the elevation differences between paired points were less than 10 cm before restoration, we judged that the main difference between the sites was if they had become exposed or remained submerged. Therefore, we treated these paired samples as functionally equivalent in all other respects and interpreted the COD differences primarily as the effects of exposure. We added lake water (collected on the same day) to each core, incubated them for seven days in the dark at 20 °C with surface aeration, and ran parallel controls using lake water only. After seven days, the COD release (mg/m2) was calculated as follows:
COD release (mg/m2) = (CODsample−CODcontrol) × water volume/surface area
We used Excel 2021 for the data analysis and applied t-tests to compare emergent and submerged sampling points.

3. Results

3.1. Seasonal and Long-Term Water-Level Changes

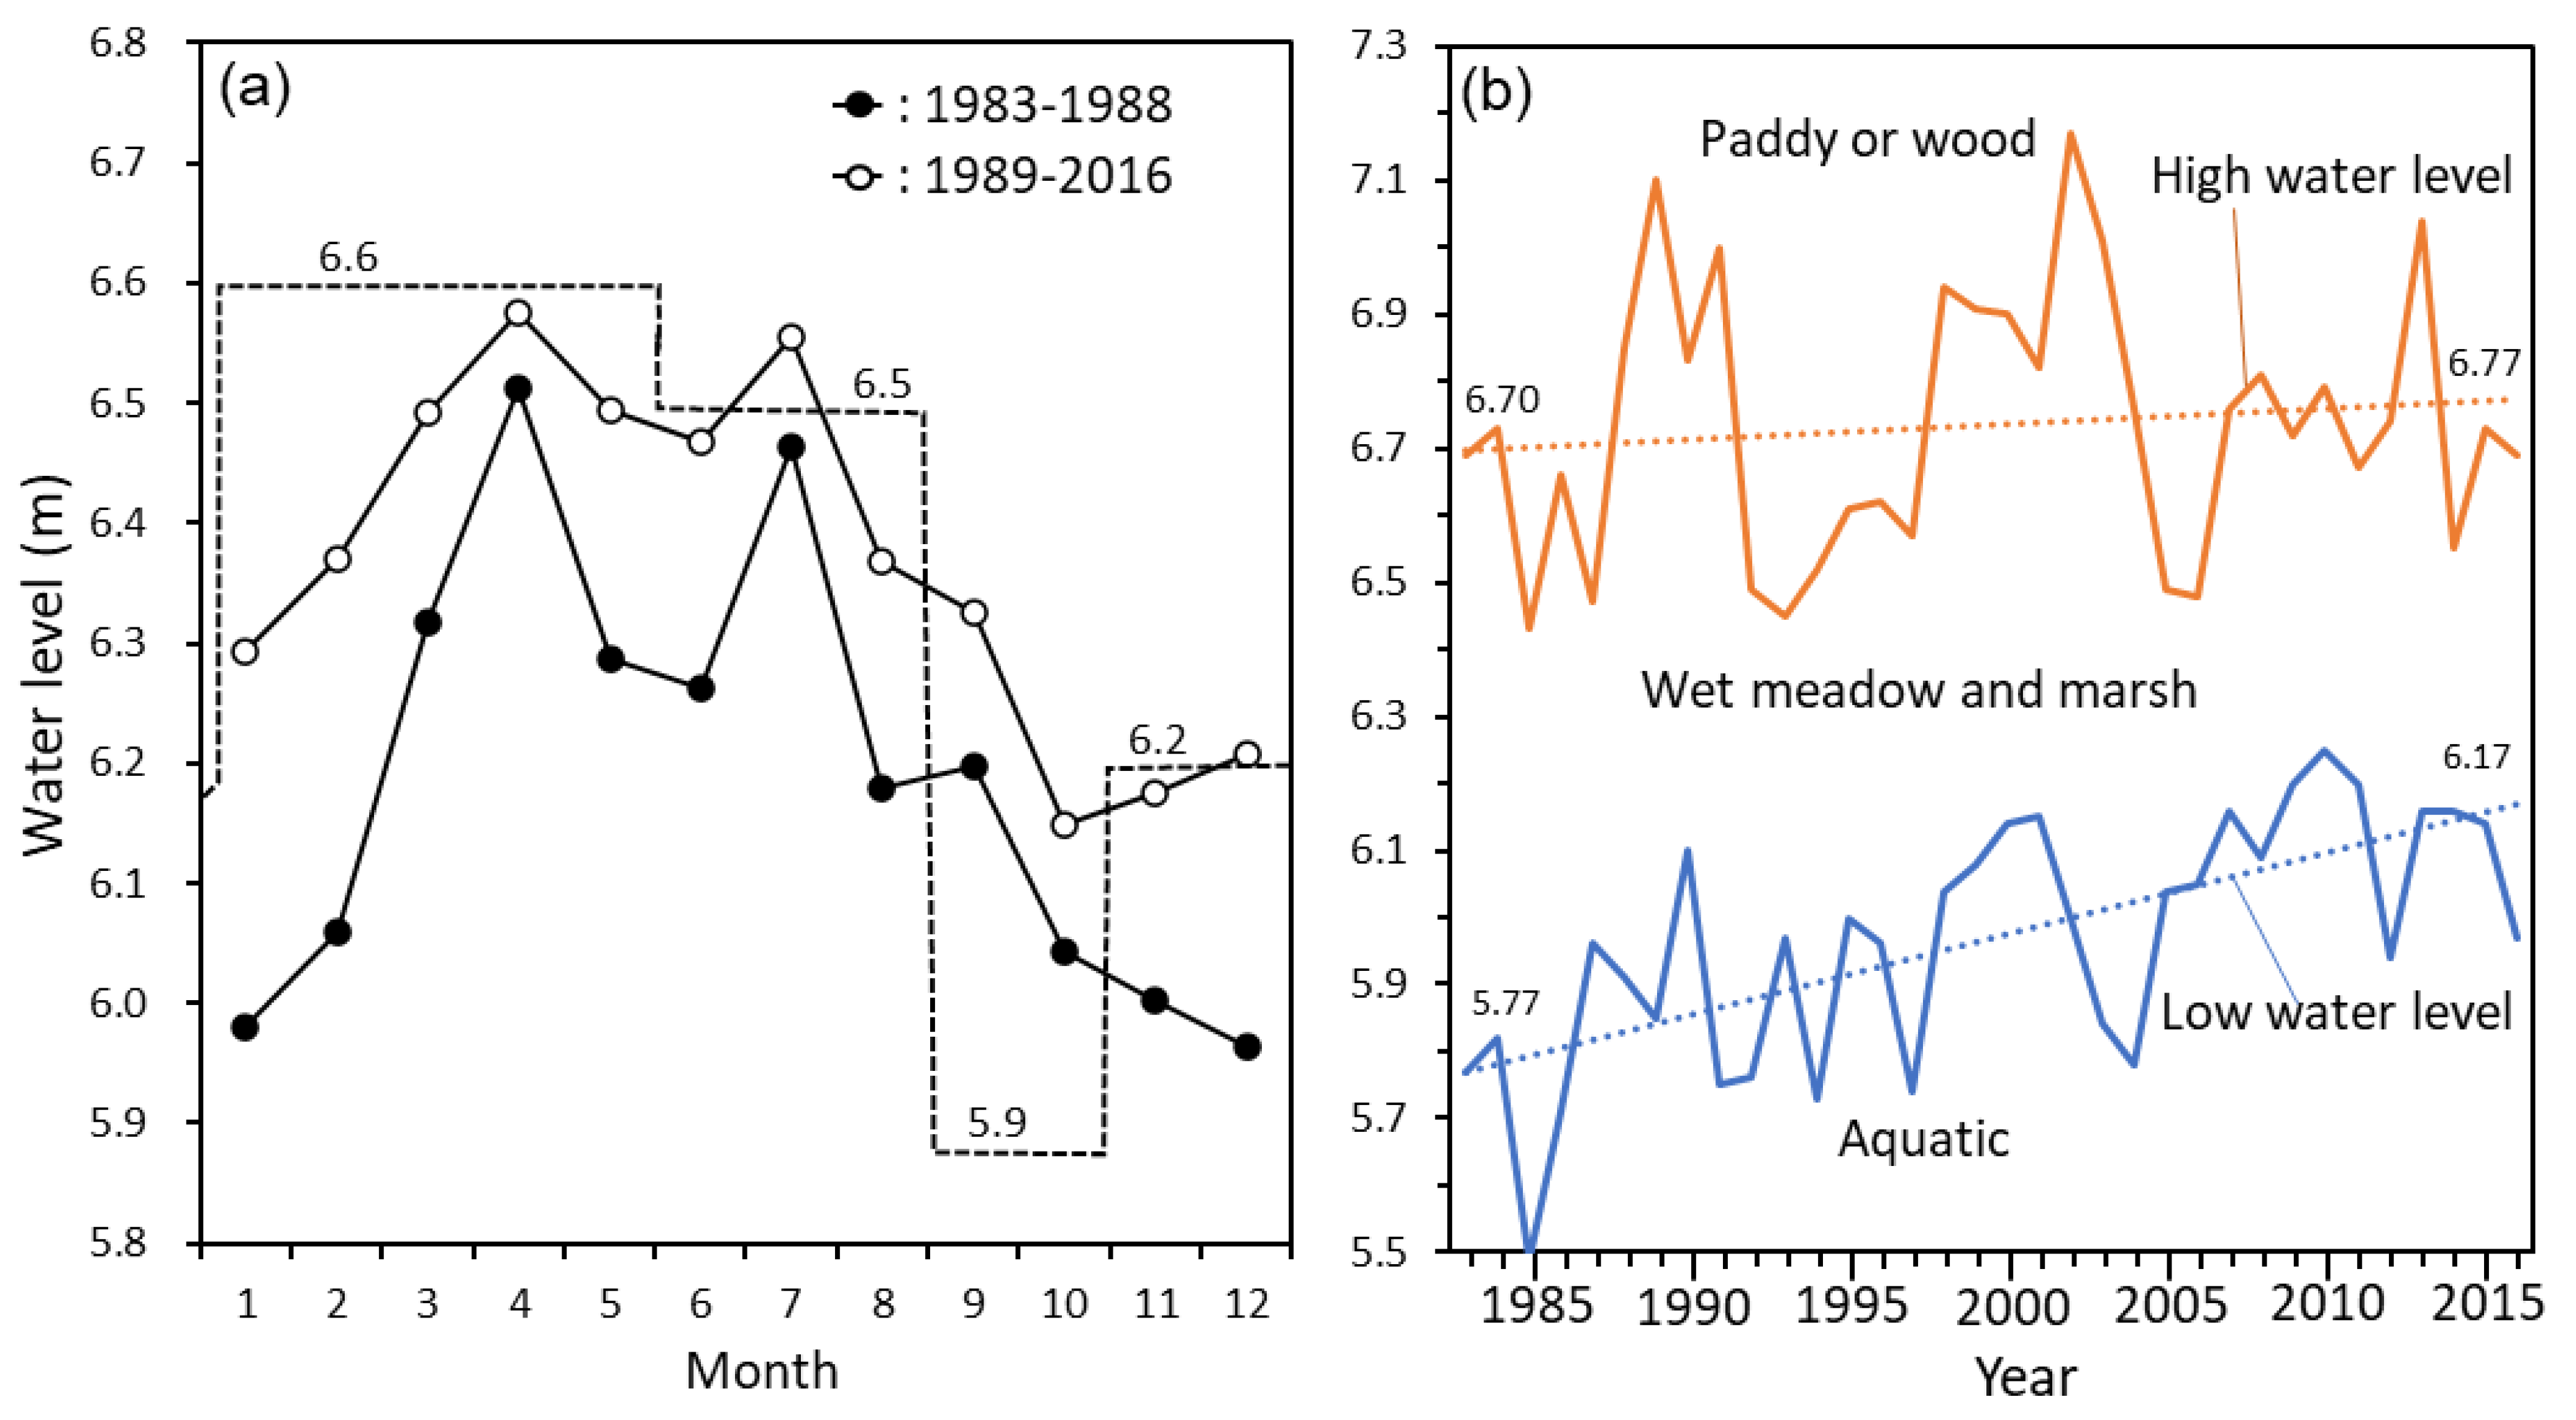
Figure 3 summarizes both the seasonal and long-term changes in the water level of Lake Izunuma-Uchinuma. The seasonal pattern was divided into two periods. These were before and after the renovation of the weir, which regulated the lake level in 1989 (Figure 3a). Before 1988, the water level for rice cultivation began to increase in February and reached its first peak in April. After 1989, the increase shifted to November and peaked in April. From May to June, the water levels decreased for irrigation, increased in July during the rainy season, and gradually declined until the next storage period.
A linear approximation from 1983 to 2016 showed that high water levels increased by 7 cm (from 6.70 m to 6.77 m); however, this change was not statistically significant (r = 0.12, n = 34, and p > 0.05). In contrast, low water levels increased by 40 cm (from 5.77 m to 6.17 m), and a significant positive correlation was observed (r = 0.67, n = 34, and p < 0.01). Consequently, the range between the high and low levels narrowed from 93 to 60 cm. This marked increase in low water levels was probably due to changes in artificial water management rather than purely natural factors because the water level of Lake Izunuma-Uchinuma is regulated by the aforementioned weir.

3.2. Changes in Lakebed Elevation and Future Sedimentation Simulations

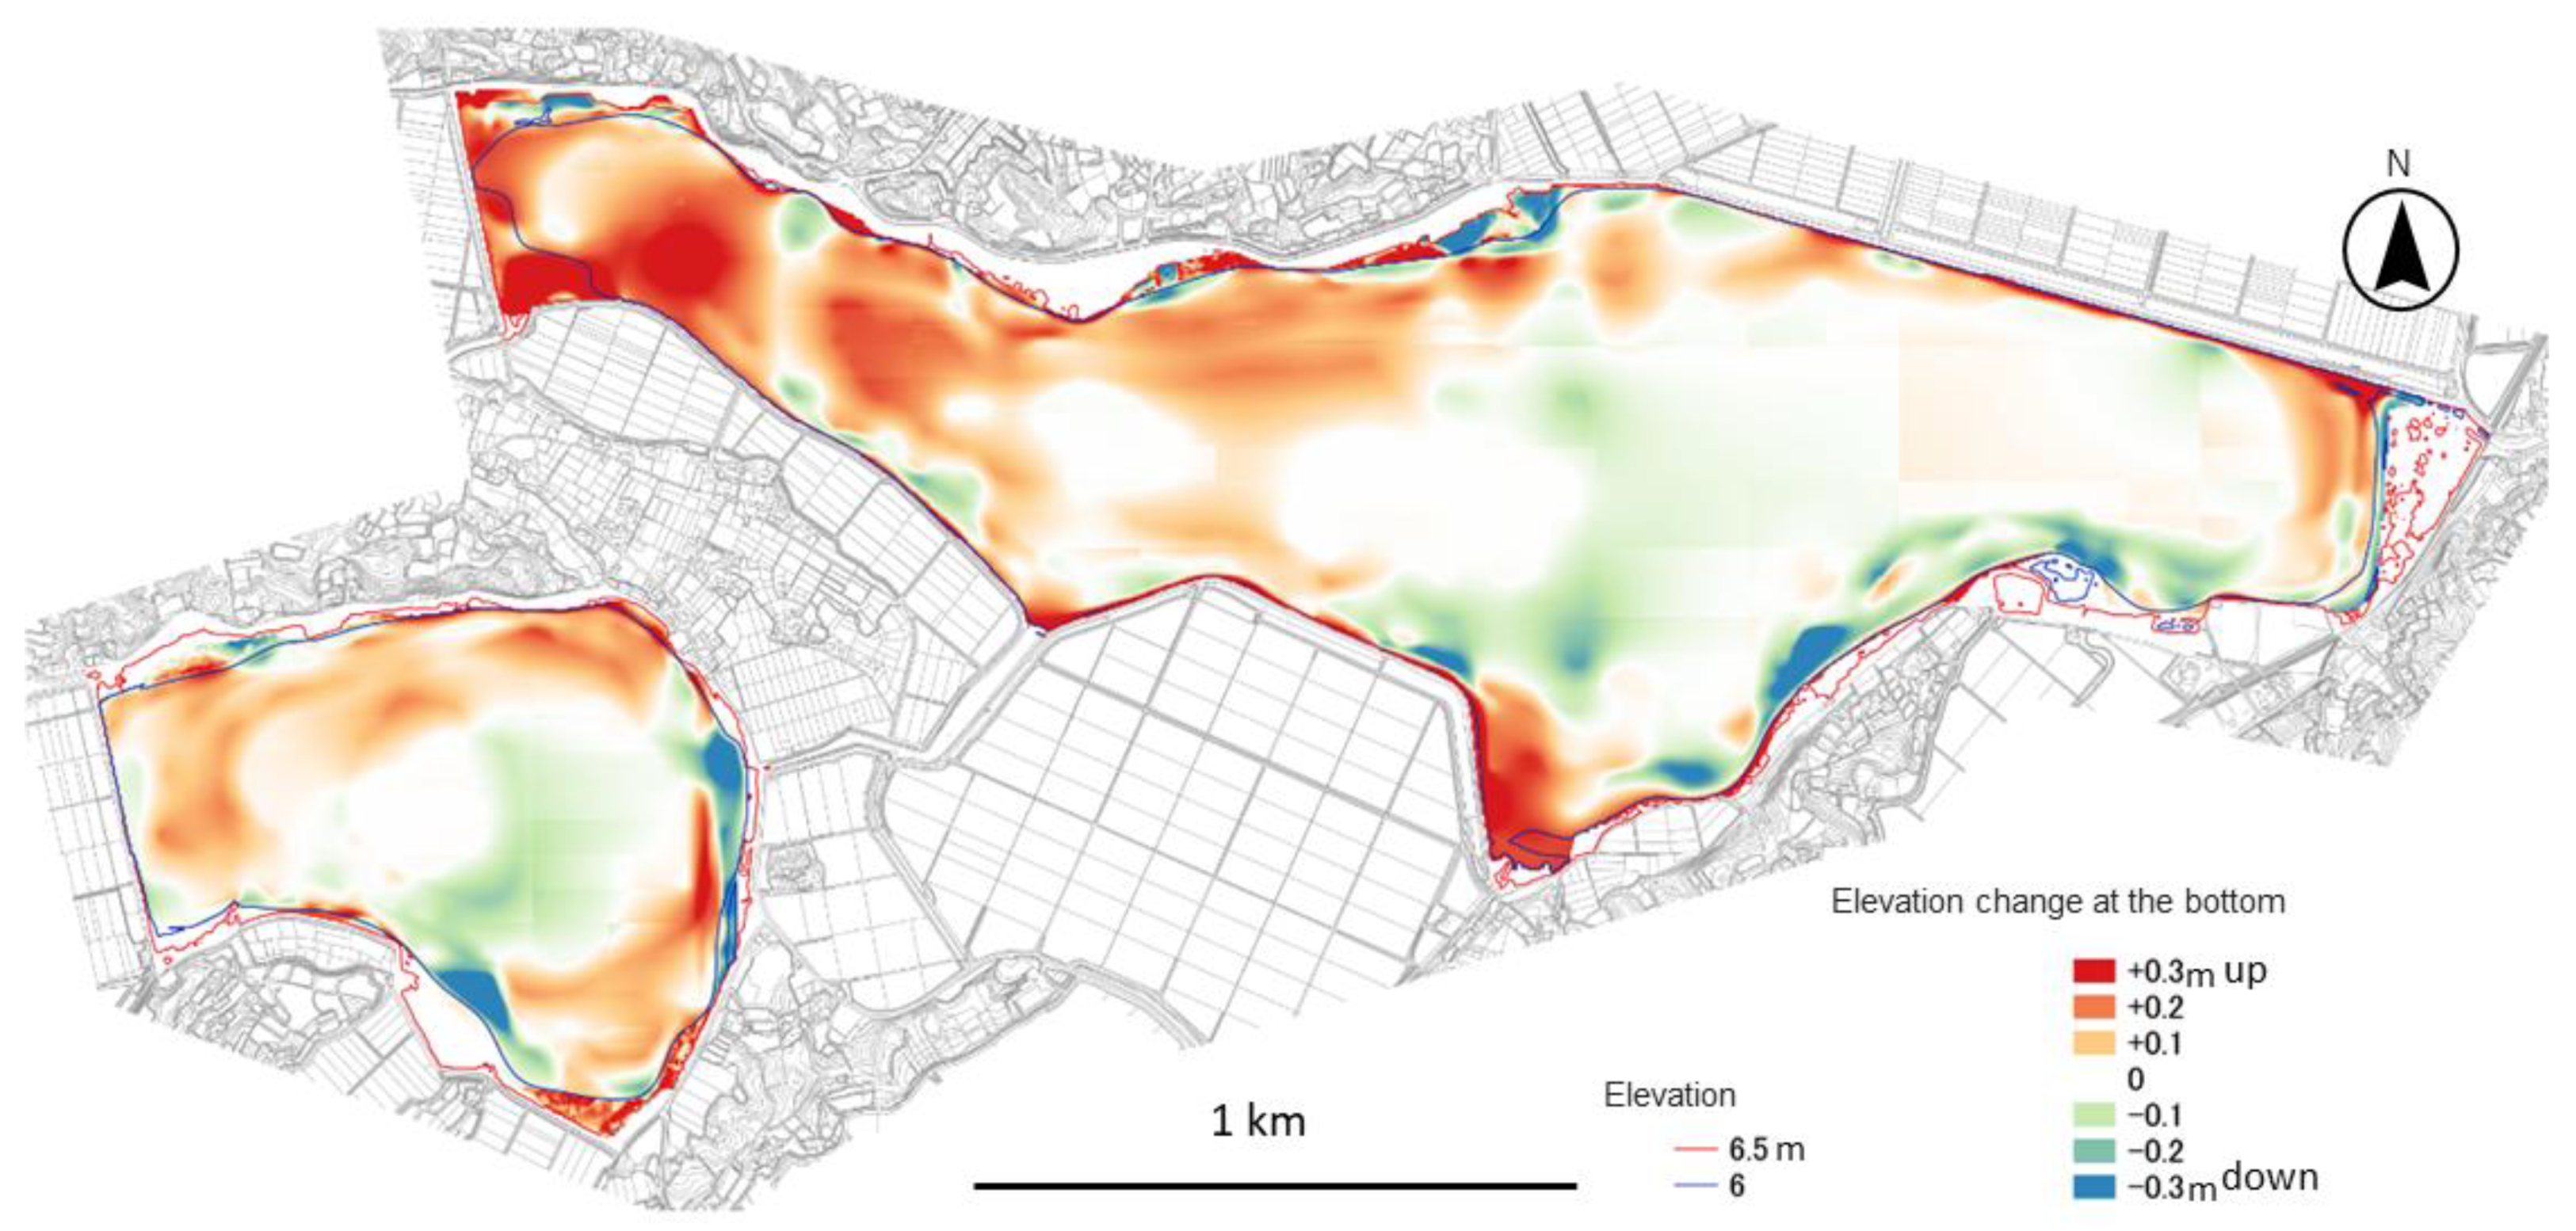
In 1978, stands of Z. latifolia extended lakeward from the P. australis belt to K.P. 6.0 m (Figure 1b–d). In the present study, during the low-water phase (K.P. 5.9 m), the shoreline was generally situated landward of the former Z. latifolia stands, indicating substantial substrate loss following the 1980 flood. Figure 4 illustrates the changes in lakebed elevation at Lake Izunuma-Uchinuma from 1985 to 2007, showing how sedimentation and erosion occurred after a large-scale outflow event. Annual sediment input averaged 10,229 m3 in Lake Izunuma and 2871 m3 in Lake Uchinuma, corresponding with mean accretion rates of 2.6 mm/yr and 2.1 mm/yr, respectively. Although most areas changed by less than 10 cm, some locations showed sedimentation or erosion of more than 20 cm. Both areas accumulated sediments near the western inflows and southern shores around Ecotone 1, with weaker alongshore currents.
Future sedimentation simulations were conducted using these bathymetric changes. For the first 150 years (2007–2157), sedimentation remained localized to the western inflows and southern areas with weaker currents (Figure 5a), exposing approximately 20% of the lakebed (Figure 5b). However, between 2157 and 2257, the lake rapidly transitioned to a terrestrial habitat, with Lake Izunuma fully converted to land by approximately 2282 (275 years after 2007) and Uchinuma by approximately 2307 (300 years after 2007). The terrestrial zone (ecotone) was projected to regain its 1978 extent after approximately 142 years (2149; Figure 5b, triangle).

3.3. Effects of the Constructed Ecotones

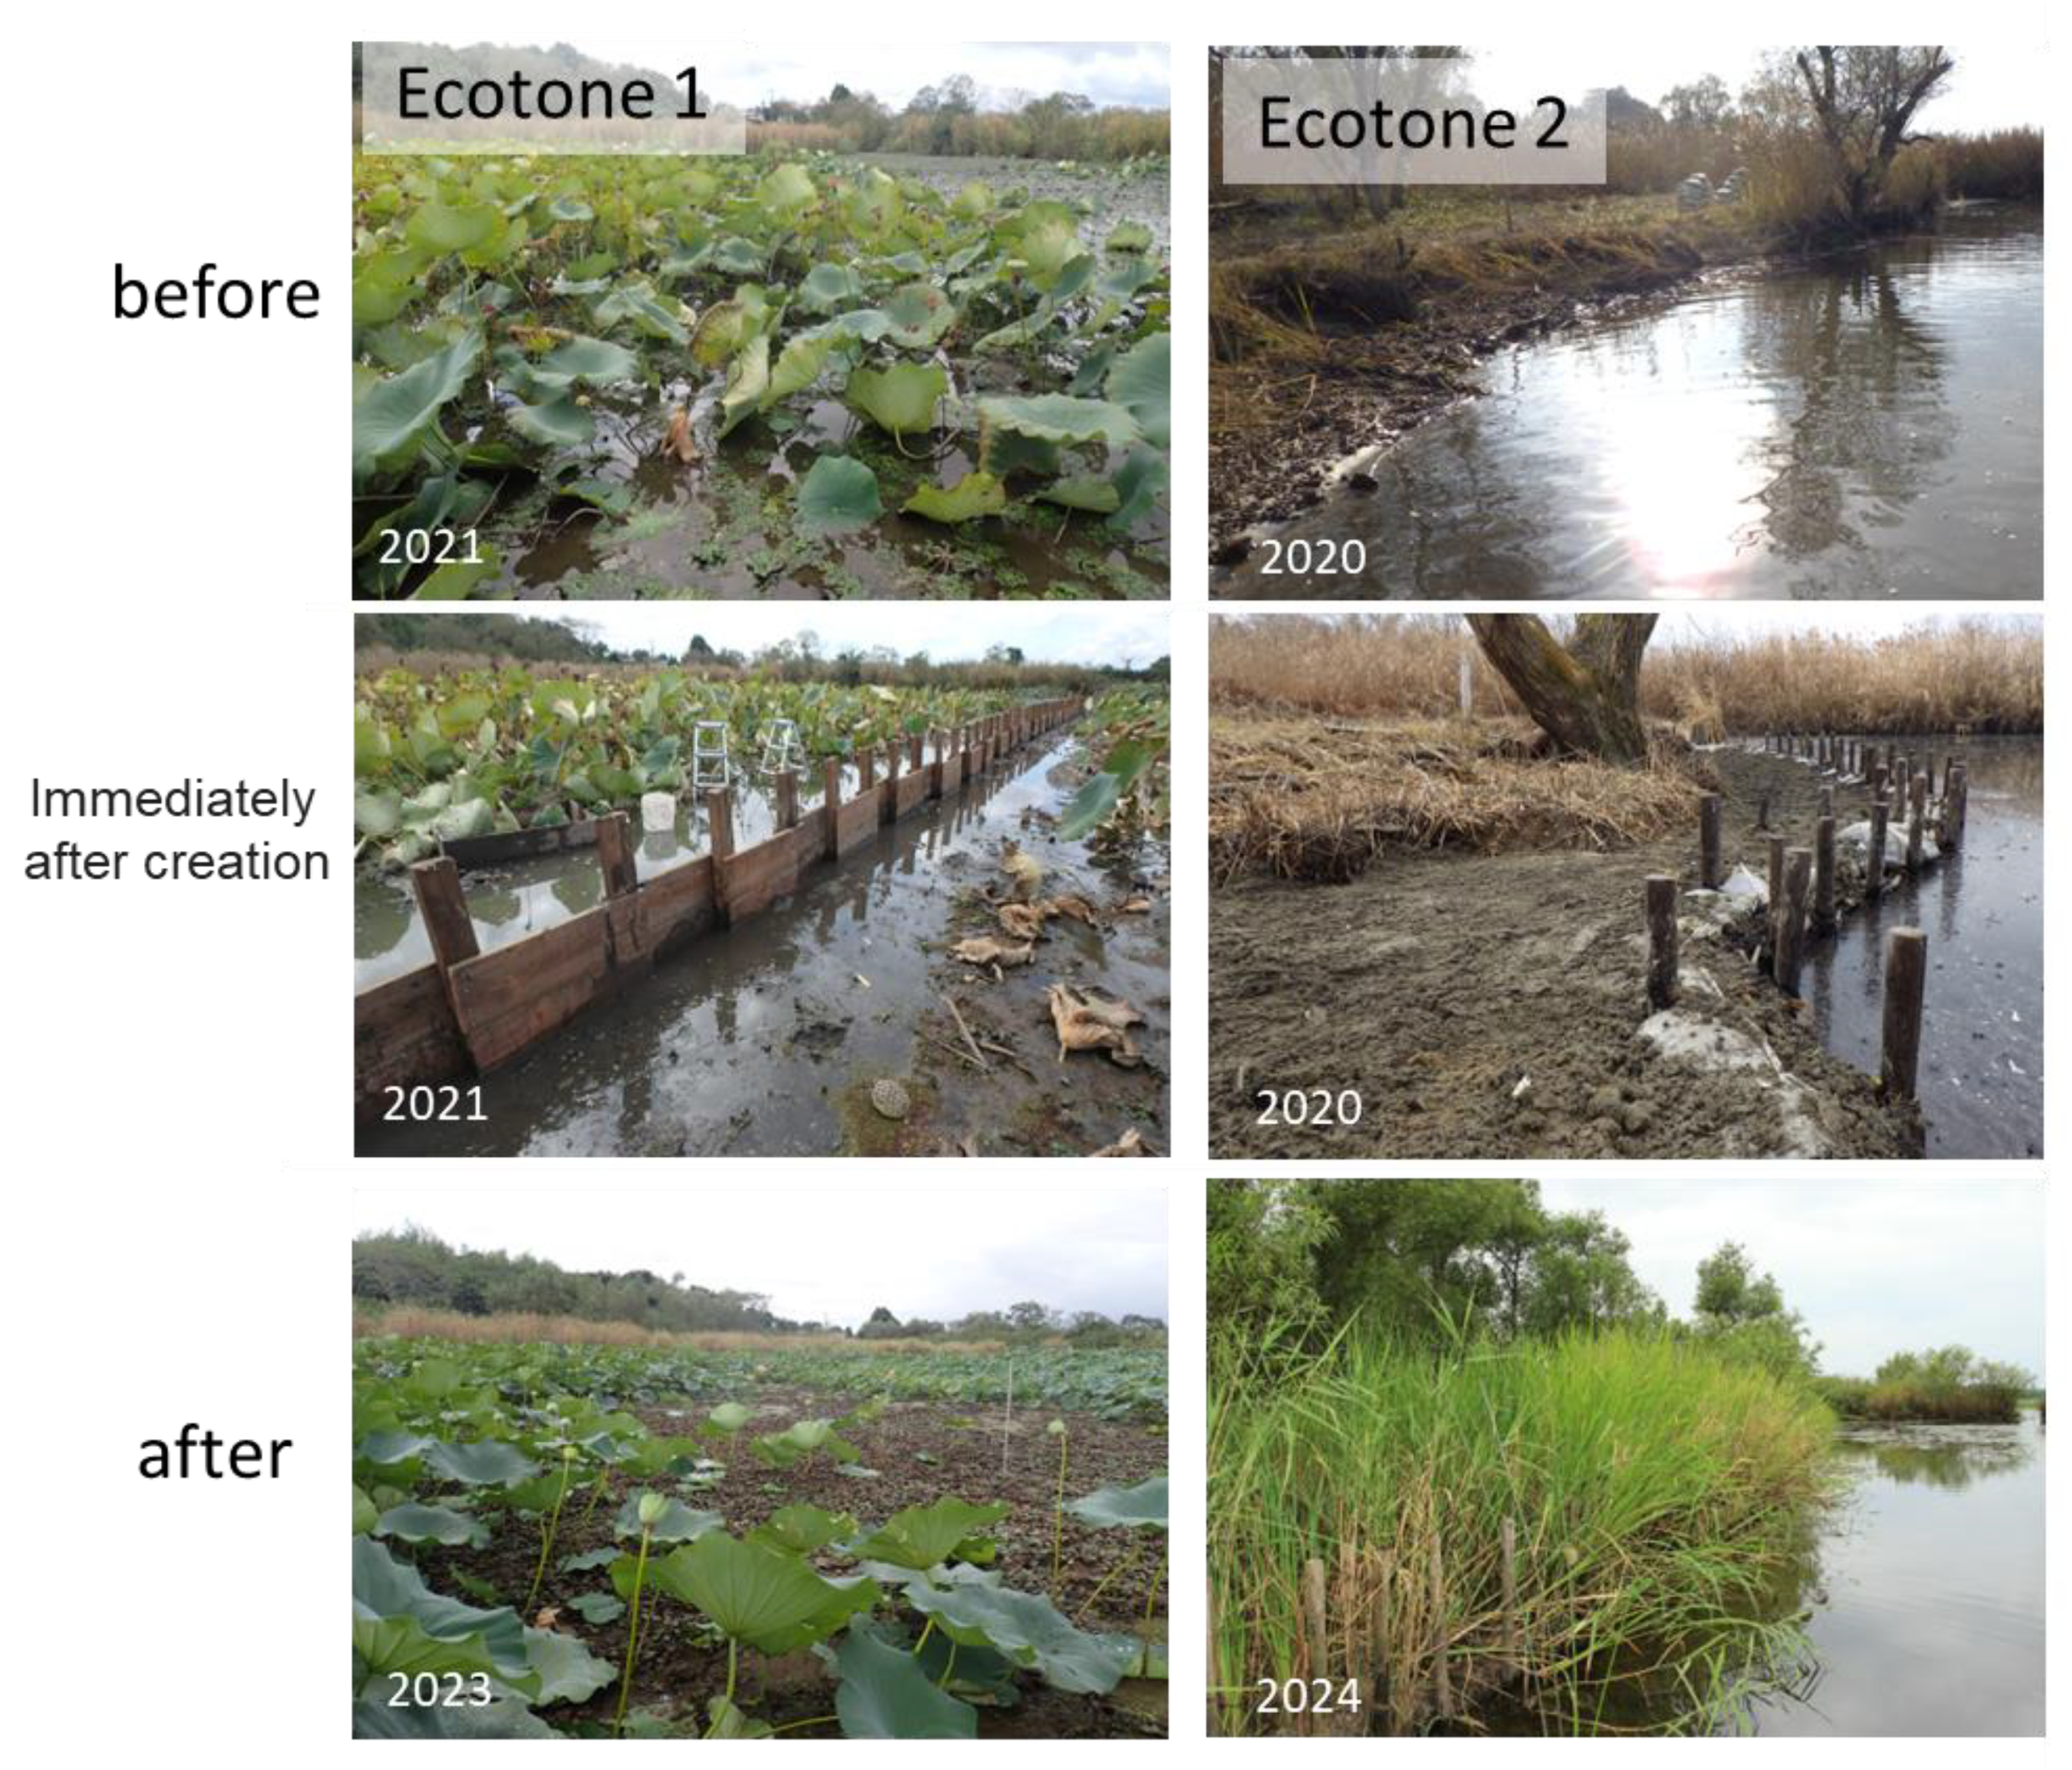
Ecotone 1, established in 2021 (Figure 6), accumulated an average of 3.0 ± 0.2 cm of sediment (range: −2 to +6 cm) over three years. Ecotone 2, located in a zone previously subjected to the highest erosion rates, retained its introduced sand without further loss by the coconut mat rolls.
The emergent vegetation cover, mainly Z. latifolia, remained almost unchanged at the reference sites (Figure 7). In contrast, Ecotone 1 increased from 328 m2 to 1537 m2, and Ecotone 2 increased from 10 m2 to 300 m2.
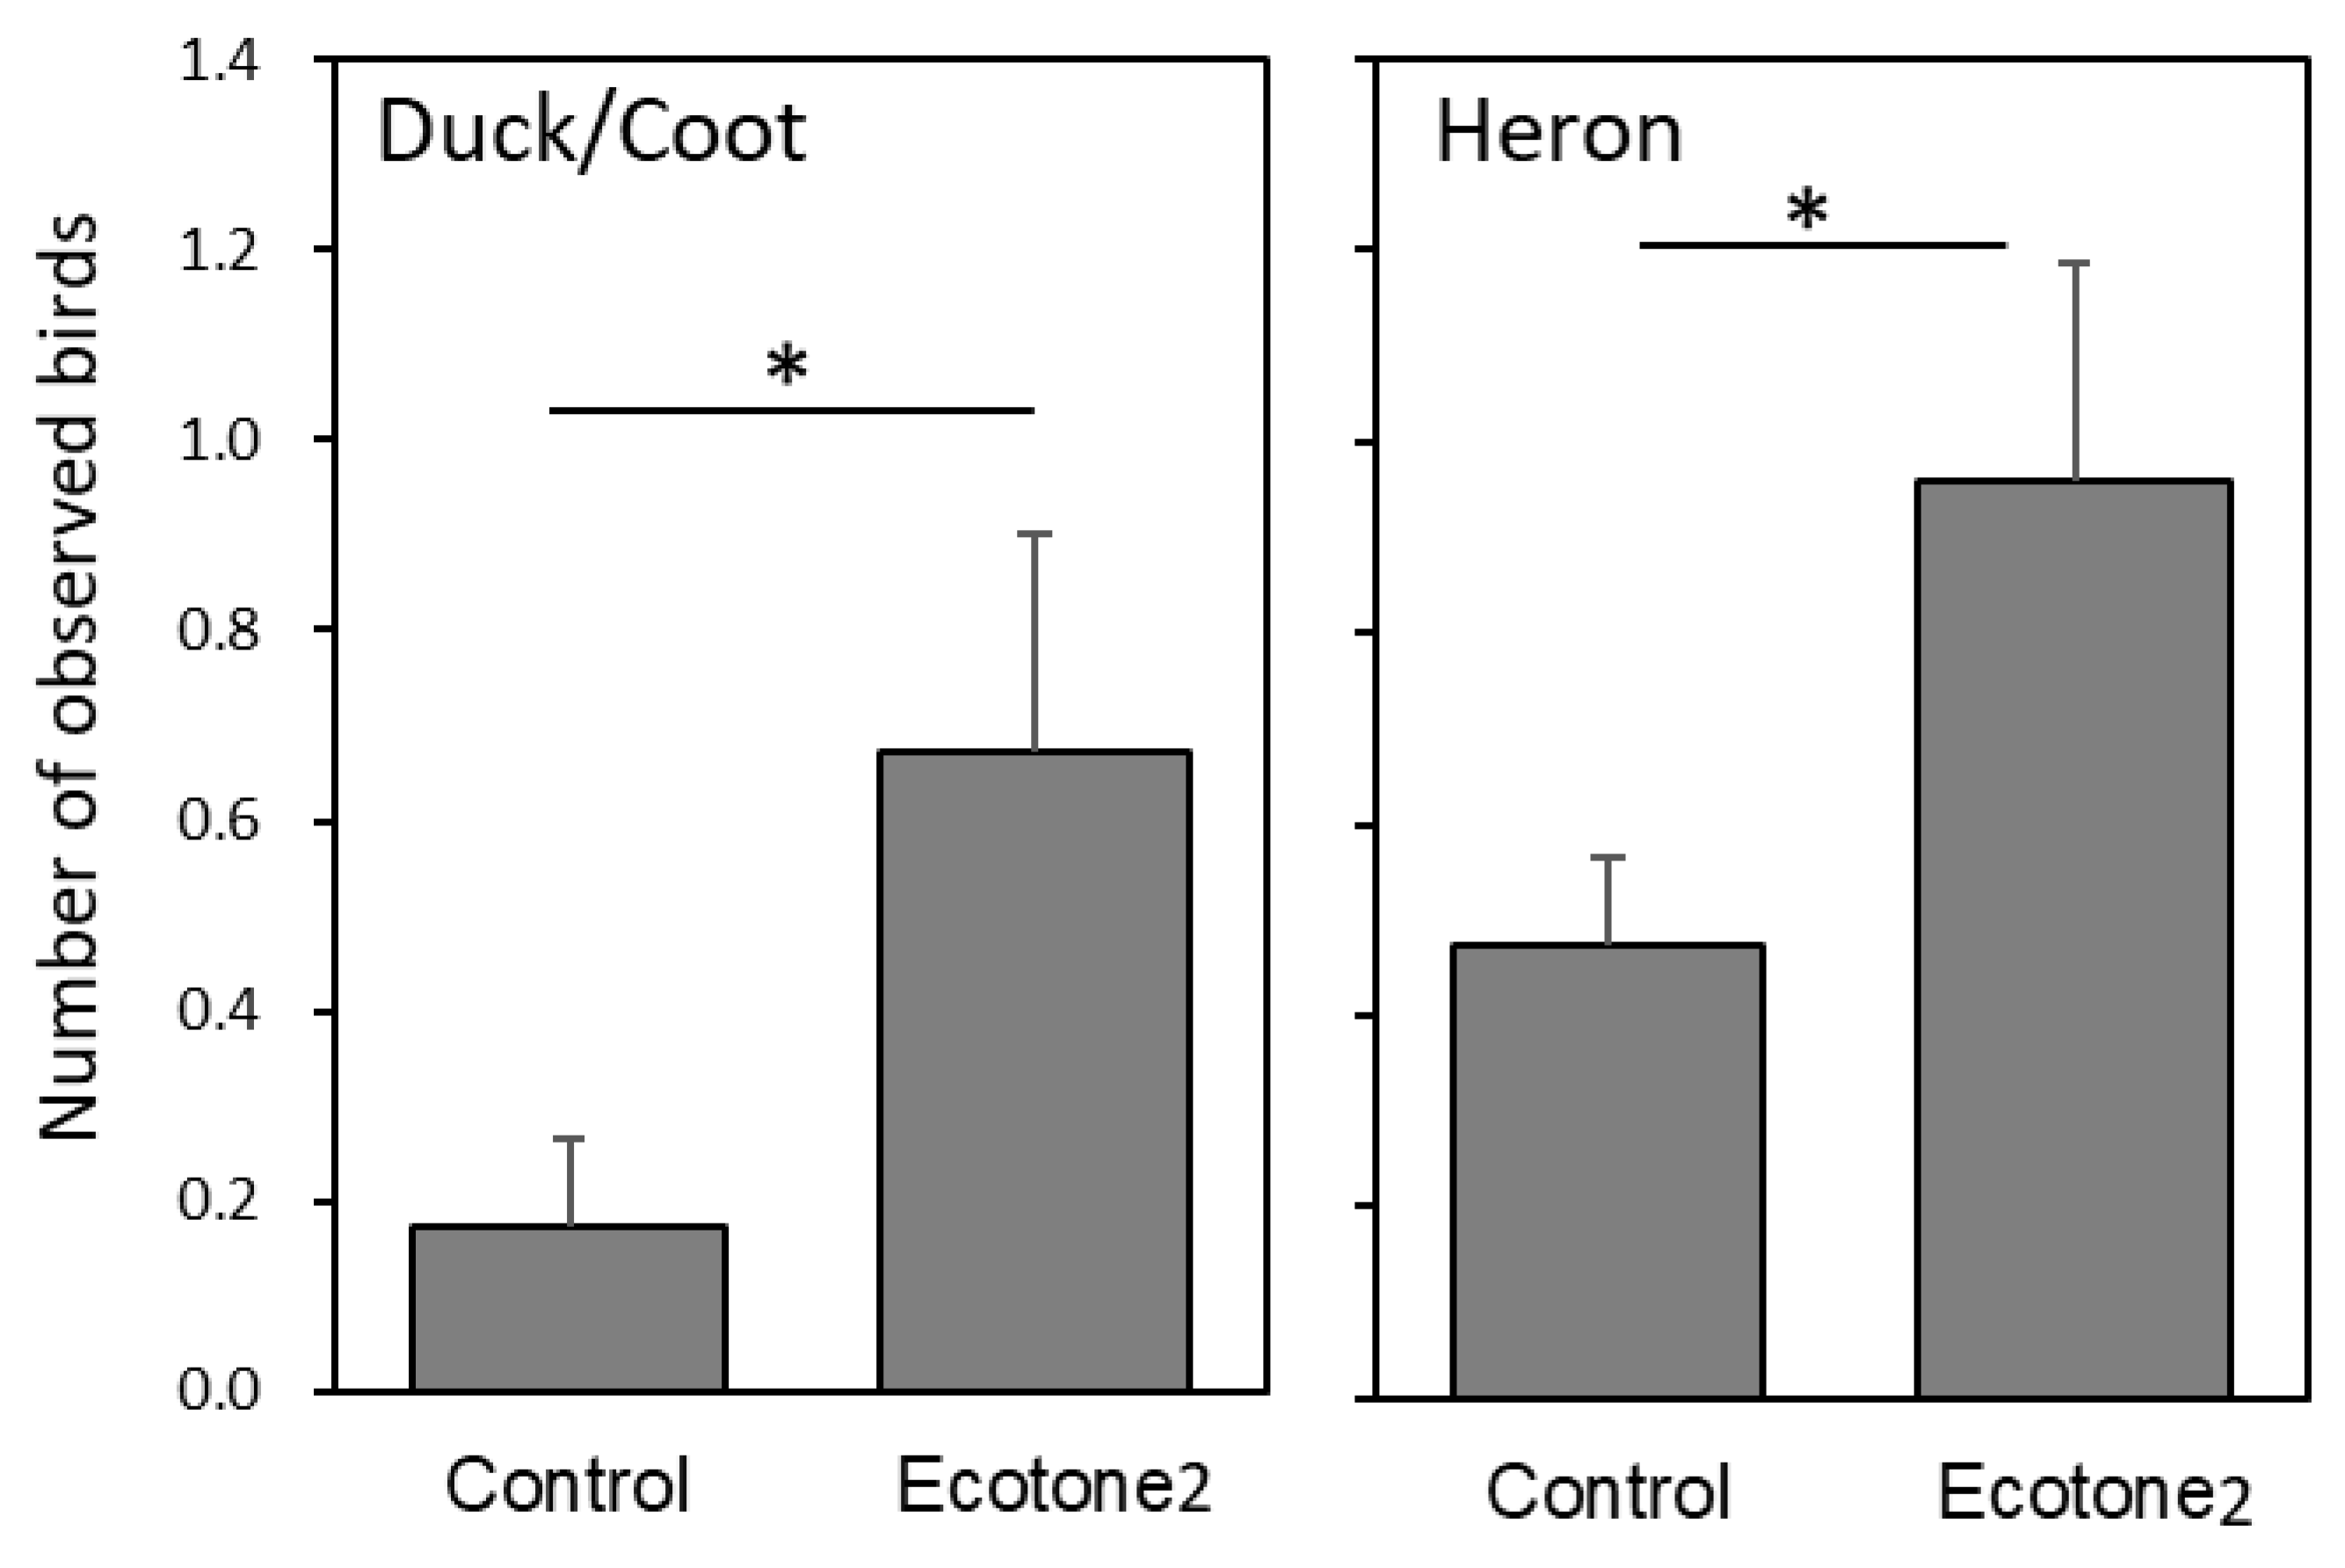
Waterbird surveys in Ecotone 2 and the control area revealed significantly greater numbers of ducks, coots, and herons (Figure 8; t-test, p < 0.05, and p < 0.001, respectively). The grey heron, Ardea cinerea, was observed perching on the constructed ecotone to forage, a behavior not seen in the control area.
Figure 9 shows the COD release rates. No significant differences were found between Ecotones 1 and 2 (t-test, p > 0.05). However, areas that became exposed (emergent) showed a significantly lower COD release than those that remained submerged (t-test, p < 0.05), suggesting that periodic exposure of the lakebed could reduce organic loading from the sediment.

4. Discussion

4.1. Hysteresis from Lakeshore Vegetation Loss

Our analysis revealed that the low water levels in Lake Izunuma-Uchinuma have substantially increased over the long term, which is consistent with previous findings that elevated low water levels drive lakeshore vegetation loss [18,46,47,48]. As this lake is exceptionally shallow, with an average depth of only 77 cm, a 40 cm rise in low water levels could profoundly affect the lakeshore vegetation communities. Historically, Z. emerlatifolia dominated the shoreline. This species relies on contact with the lakebed during low water levels for regeneration after being dislodged by wave action [38,49], making it vulnerable when low water levels increase. Consequently, an estimated 89 ha of lakeshore vegetation, including Z. latifolia, has disappeared along the shoreline.
Following the disappearance of these lakeshore vegetation communities, most shallow areas did not transition to terrestrial habitat [39], suggesting that sediment accumulation near the shore ceased. In contrast, offshore zones exposed to less wave action accumulated approximately 20 cm of mud, indicating spatial differences in the sediment dynamics and underscoring the critical role of littoral vegetation in sedimentation [50,51,52,53]. The simulation results also showed that lakeshore vegetation loss triggered a pronounced hysteresis effect, prolonging the landward migration of the shoreline. Nevertheless, even under these conditions, the fences and coconut mat rolls installed in this study successfully restored the sediment accumulation along the shore, highlighting the importance of selecting effective restoration methods.

4.2. A “Modern” Hydrosere Under Anthropogenic Pressure

Classical limnology assumes that lake basins gradually fill the shoreline inward, leading to progressive terrestrialization (Figure 10a–c) [54,55]. However, our projections indicated that once the sediment-anchoring function of lakeshore vegetation is lost, the ecotone can remain absent for an extended period (Figure 10d,e), followed by a sudden and rapid shift toward land formation (Figure 10c). The rise in low water levels, influenced by repairing a formerly leaking weir and securing irrigation water, represents direct human intervention. Another anthropogenic factor is an insufficient sand or sediment inflow. Around Lake Izunuma-Uchinuma, embankments and paved roads prevent terrestrial sediments from entering the lake (Figure 10e), whereas dredging for flood control in inflowing rivers reduces the natural sediment supply [56,57]. Thus, the prolonged disappearance of the ecotone reflects a “modern” hydrosere process shaped by high water-level management and river modifications.

4.3. Ecological Consequences and Biodiversity Loss

The long-term absence of ecotones can profoundly alter local biotic communities, potentially diminishing their diversity. For instance, an endangered damselfly (Paracercion plagiosum) [34,58] and waterbirds such as Little Grebe (Tachybaptus ruficollis) and Common Coot (Fulica atra) historically depended on dense emergent vegetation [59], but have declined since the disappearance of these stands. Once lakeshore vegetation is lost, the nearshore zone becomes deeper and gentler, limiting the wave action at the water’s edge and allowing mud to fully accumulate up to the shoreline [60]. This mud-induced dominance of lotus and water chestnut often leads to decreased dissolved oxygen levels [61], which in turn reduces freshwater mussel (Cristaria clessini) populations [62] and threatens the native bitterling (A. typus), which is reliant on freshwater mussels for spawning [35]. The proliferation of lotus and water chestnuts also displaces other floating leaves and submerged macrophytes [63]. Our findings suggest that hysteresis caused by lakeshore vegetation loss could result in prolonged biodiversity decline and water-quality deterioration. Under these conditions, many aquatic animals could become locally extinct, and seed banks of aquatic vegetation with finite viability (approximately 40–50 years) [64] could also be lost.
From vegetation ecology perspectives, such as competitor, stress-tolerator, and ruderal (CSR) triangle theory, submerged vegetation (stress-tolerant species) and emergent vegetation (disturbance-dependent species) are particularly susceptible to water pollution and rising low water levels [65]. This decline makes the competitive species dominant. Even if the ecotone begins to expand again after 150 years, many native species will likely vanish, and open niches could facilitate invasive species such as the water hyacinth (Eichhornia crassipes) [66]. Hence, allowing continued ecotone loss could lead to long-term structural shifts in lake ecosystems.

4.4. Integrated Restoration Approaches

Overcoming hysteresis often requires environmental conditions that exceed those historically present. In our experiment, lowering the water level exposed 29 ha of lakebed; however, Z. latifolia did not spread beyond the reference sites, even after three years. Although spring drawdown could be crucial [67], it is not feasible because local agriculture depends on spring water storage. Moreover, decades of transplantation efforts have not expanded the emergent vegetation, where soft mud remains widespread. Wave action and winter swan herbivory further hinder vegetation establishment in Lake Izunuma-Uchinuma [38]. Where fences or coconut mat rolls stabilized the substrate and mitigated wave and herbivory pressures, Z. latifolia began to recover. Thus, integrated management—encompassing water-level adjustments, substrate stabilization, and protection from wave damage and herbivory—appears to be essential for re-establishing emergent vegetation and could shift the lake’s trajectory from a “modern” hydrosere, shaped by anthropogenic water-level control and sediment deficits, back to a more classical pattern of succession (Figure 10f).
However, this integrated management must account for ecological and social constraints. One alternative could be to shift the ecotone inland to match the rising low water level. Nonetheless, in Lake Izunuma-Uchinuma, as in many Japanese wetlands, embankment and land development have severely reduced the available shoreline habitat. Lakeshore vegetation is strongly tied to waterbird diversity [68,69], and this region supports rare species, such as Eurasian bittern (Botaurus stellaris stellaris) and Japanese Marsh Warbler (Megalurus pryeri) [70,71]. As the Eurasian bittern requires extensive P. australis stands [72], a restoration approach that avoids a further reduction in lakeshore vegetation is vital for maintaining waterbird diversity in heavily developed lowland wetlands.
Water-level management requires careful planning. We chose to lower the historically elevated low water level by approximately 27 cm; lowering it by up to 40 cm may have accelerated vegetation recovery, but shallow sandy areas vital to submerged vegetation, dragonflies, and freshwater mussels [35,40,62] could be jeopardized. Thus, we limited the drawdown to 27 cm and emphasized substrate stabilization. We plan to continue adaptive management based on the responses of lake ecosystems.
An ongoing restoration program aims to restore approximately 89 ha of the ecotone by 2060 (Figure 10f). However, the sand supply largely depends on passive sediment drift. A larger-scale restoration may require the import of sand, possibly from dredged river sediments, as in the Mikata-goko Lakes [73]. Ultimately, fostering a large emergent zone for disturbance-dependent species, mitigating water pollution via properly managed floating leaf vegetation [74], and facilitating stress-tolerant species recovery are integral to protecting lake biodiversity (Figure 10f).

5. Conclusions

Our long-term simulations and restoration experiments at Lake Izunuma-Uchinuma revealed that human-induced alterations, including elevated low water levels and reduced sediment supply, led to a pronounced hysteresis effect, greatly delaying the recovery of natural lakeshore vegetation. Integrated management measures, specifically water-level adjustments, substrate stabilization with fences and coir rolls, and protection against wave action and herbivory, successfully promoted shoreline sediment accumulation, the re-establishment of Zizania latifolia, improved water quality, and increased waterbird utilization over three years. However, species dependent on shallow sandy substrates, such as freshwater mussels, have not yet recovered, indicating the need for complementary strategies. In particular, the recovery of freshwater mussels may require not only habitat restoration but also the restoration of native fish populations that serve as their hosts, which is being pursued through the eradication of the invasive largemouth bass [35,36]. Our findings emphasize that proactive, sustained, and integrated approaches are essential for mitigating hysteresis and enhancing the resilience of shallow lakes. The restoration practices developed in this study may provide practical guidance for managing similarly degraded wetlands worldwide under increasing anthropogenic pressures.

Author Contributions

Conceptualization, Y.F., Y.T., J.Y., T.S. and O.N.; methodology, Y.F. and Y.T.; software, Y.T.; validation, Y.F.; formal analysis, Y.T.; investigation, Y.F., H.H., M.N. and T.S.; data curation, Y.F. and Y.T.; writing—original draft, Y.F.; writing—review and editing, Y.F., J.Y. and O.N.; visualization, Y.F.; supervision, O.N.; project administration, T.S.; funding acquisition, T.S. All authors have read and agreed to the published version of the manuscript.

Funding

This research received no external funding.

Data Availability Statement

The data supporting the findings of this study are available from the corresponding author upon reasonable request.

Acknowledgments

This study was conducted as part of the Lake Izunuma-Uchinuma Nature Restoration Project by Miyagi Prefecture. Okamoto helped us with the COD elution measurements. The Izunuma Fishery Cooperative Association and the Izunuma Coastal Land Improvement District cooperated with our survey activities. The staff of The Miyagi Prefectural Izunuma-Uchinuma Environmental Foundation provided support for the work.

Conflicts of Interest

The authors declare no conflicts of interest.

References

  1. Sayer, C.A.; Fernando, E.; Jimenez, R.R.; Macfarlane, N.B.; Rapacciuolo, G.; Böhm, M.; Darwall, W.R. One-quarter of freshwater fauna threatened with extinction. Nature 2025, 638, 138–145. [Google Scholar] [CrossRef] [PubMed]
  2. Schierner, F.; Zalewski, M.; Thorpe, J. Land/Inland water ecotones: Intermediate habitats critical for conservation and management. Hydrobiologia 1995, 303, 259–264. [Google Scholar] [CrossRef]
  3. Dai, T.; Liu, R.; Zhou, X.; Zhang, J.; Song, M.; Zou, P.; Bi, X.; Li, S. Role of Lake Aquatic—Terrestrial Ecotones in the Ecological Restoration of Eutrophic Water Bodies. Toxics 2023, 11, 560. [Google Scholar] [CrossRef] [PubMed]
  4. Liu, X.; Yuan, S.; Wang, H. Periodic inundations drive community assembly of amphibious plants in floodplain lakes. Hydrobiologia 2020, 847, 4207–4217. [Google Scholar] [CrossRef]
  5. Chapman, L.; Chapman, C.; Chandler, M. Wetland ecotones as refugia for endangered fishes. Biol. Conserv. 1996, 78, 263–270. [Google Scholar] [CrossRef]
  6. Zalewski, M.; Thorpe, J.; Naiman, R. Fish and riparian ecotones: A hypothesis. Ecohydrol. Hydrobiol. 2001, 1, 11–24. [Google Scholar]
  7. Bateman, H.L.; Merritt, D.M. Complex riparian habitats predict reptile and amphibian diversity. Glob. Ecol. Conserv. 2020, 22, e00957. [Google Scholar] [CrossRef]
  8. Popova, O.; Smirnova, Y. Community of aquatic insects in forest-steppe lakes of Baraba (South of West Siberia). Contemp. Probl. Ecol. 2010, 3, 50–54. [Google Scholar] [CrossRef]
  9. Hansson, L.; Nicolle, A.; Brönmark, C.; Hargeby, A.; Lindström, Å.; Andersson, G. Waterfowl, macrophytes, and the clear water state of shallow lakes. Hydrobiologia 2010, 646, 101–109. [Google Scholar] [CrossRef]
  10. Pickens, B.; King, S. Multiscale Habitat Selection of Wetland Birds in the Northern Gulf Coast. Estuar. Coast. 2014, 37, 1301–1311. [Google Scholar] [CrossRef]
  11. Ostendorp, W. Die-back of reeds in Europe—A critical review of literature. Aquat. Bot. 1989, 35, 5–26. [Google Scholar] [CrossRef]
  12. Ostendorp, W.; Iseli, C.; Krauss, M.; Krumscheid-Plankert, P.; Moret, J.; Rollier, M.; Schanz, F. Lake shore deterioration, reed management and bank restoration in some Central European lakes. Ecol. Eng. 1995, 5, 51–75. [Google Scholar] [CrossRef]
  13. Brönmark, C.; Hansson, L. Environmental issues in lakes and ponds: Current state and perspectives. Environ. Conserv. 2002, 29, 290–307. [Google Scholar] [CrossRef]
  14. Nishihiro, J.; Washitani, I. Quantitative evaluation of water-level effects on “regeneration safe-sites” for lakeshore plants in Lake Kasumigaura, Japan. Lake Reserv. Manag. 2009, 25, 217–223. [Google Scholar] [CrossRef]
  15. Zhang, Y.; Jeppesen, E.; Liu, X.; Qin, B.; Shi, K.; Zhou, Y.; Thomaz, S.; Deng, J. Global loss of aquatic vegetation in lakes. Earth-Sci. Rev. 2017, 173, 259–265. [Google Scholar] [CrossRef]
  16. Carpenter, S.R.; Caraco, N.F.; Correll, D.L.; Howarth, R.W.; Sharpley, A.N.; Smith, V.H. Nonpoint pollution of surface waters with phosphorus and nitrogen. Ecol. Appl. 1998, 8, 559–568. [Google Scholar] [CrossRef]
  17. Mitsch, W.J.; Gosselink, J.G. Wetlands, 5th ed.; John Wiley & Sons, Inc.: Hoboken, NJ, USA, 2015. [Google Scholar]
  18. Keddy, P.A. Wetland Ecology; Cambridge University Press: Cambridge, UK, 2000. [Google Scholar]
  19. Valk, A.; Squires, L.; Welling, C. Assessing the impacts of an increase in water level on wetland vegetation. Ecol. Appl. 1994, 4, 525–534. [Google Scholar] [CrossRef]
  20. Theuerkauf, E.; Braun, K. Rapid water level rise drives unprecedented coastal habitat loss along the Great Lakes of North America. J. Great Lakes Res. 2021, 47, 945–954. [Google Scholar] [CrossRef]
  21. Harris, S.; Marshall, W. Ecology of water₋level manipulations on a northern marsh. Ecology 1963, 44, 331–343. [Google Scholar] [CrossRef]
  22. Nakamura, K.; Kadokura, N.; Munakta, Y.; Shimatani, Y.; Uda, T. Restoration of lakeshore vegetation by artificial floating island. Environ. Syst. Res. 1999, 27, 305–314. [Google Scholar] [CrossRef]
  23. Coops, H.; Hosper, S.H. Water-level management as a tool for the restoration of shallow lakes in the Netherlands. Lake Reserv. Manag. 2002, 18, 293–298. [Google Scholar] [CrossRef]
  24. Nishihiro, J.; Nishihiro, M.; Washitani, I. Restoration of wetland vegetation using soil seed banks: Lessons from a project in Lake Kasumigaura, Japan. Landsc. Ecol. Eng. 2006, 2, 171–176. [Google Scholar] [CrossRef]
  25. Abrahams, C. Sustainable shorelines: The management and re-vegetation of drawdown zones. Lakes Reserv. Res. Manag. 2008, 13, 235–246. [Google Scholar]
  26. Haskell, D.; Bales, A.; Webster, C.; Meyer, M.; Flaspohler, D. Restoring hardwood trees to lake riparian areas using three planting treatments. Restor. Ecol. 2017, 25, 933–941. [Google Scholar] [CrossRef]
  27. Janauer, G. Ecohydrological control of macrophytes in floodplain lakes. Ecohydrol. Hydrobiol. 2006, 6, 19–24. [Google Scholar] [CrossRef]
  28. Chen, F.; Lu, S.; Hu, X.; He, Q.; Feng, C.; Xu, Q.; Chen, N.; Ngo, H.; Guo, H. Multi-dimensional habitat vegetation restoration mode for lake riparian zone, Taihu, China. Ecol. Eng. 2019, 134, 56–64. [Google Scholar] [CrossRef]
  29. Zohary, T.; Ostrovsky, I. Ecological Impacts of Excessive Water Level Fluctuations in Stratified Freshwater Lakes. Inland Waters 2011, 1, 47–59. [Google Scholar] [CrossRef]
  30. Osland, M.J. Managing Invasive Plants During Wetland Restoration: The Role of Disturbance, Plant Strategies, and Environmental Filters. Dissertation, Duke University. Available online: https://hdl.handle.net/10161/1200 (accessed on 9 February 2025).
  31. Oertli, B.; Parris, K.M. Review: Toward management of urban ponds for freshwater biodiversity. Ecosphere 2019, 10, e02810. [Google Scholar] [CrossRef]
  32. Lake Izunuma-Uchinuma Nature Restoration Council. Lake Izunuma-Uchinuma Nature Regeneration Project Phase 2. Available online: https://www.pref.miyagi.jp/documents/23928/783455.pdf (accessed on 16 January 2025).
  33. The Miyagi Prefectural Izunuma-Uchinuma Environmental Foundation. A floral list around Lake Izunuma-Uchinuma. Izunuma-Uchinuma Wetl. Res. 2010, 4, 41–61. [Google Scholar] [CrossRef]
  34. Ueda, K.; Fujimoto, Y. Seasonal occurrences, reproductive seasons, and habitat environments of an endangered damselfly Paracercion plagiosum (Odonata: Coenagrionidae) in ponds neighboring Lake Izunuma–Uchinuma, Japan. Jpn. J. Entomol. 2022, 25, 153–164. [Google Scholar]
  35. Fujimoto, Y.; Takahashi, K.; Shindo, K.; Saitoh, K.; Mitsuzuka, M.; Shimada, T. Recovery of the endangered bitterling Acheilognathus typus in Lake Izunuma-Uchinuma after the removal of largemouth bass (Micropterus salmoides). Jpn. J. Ichthyol. 2021, 68, 61–66. [Google Scholar] [CrossRef]
  36. Fujimoto, Y.; Takahashi, K.; Shindo, K.; Fujiwara, T.; Arita, K.; Saitoh, K.; Shimada, T. Success in population control of the invasive largemouth bass Micropterus salmoides through removal at spawning sites in a Japanese shallow lake. Manag. Biol. Invas. 2021, 12, 997–1011. [Google Scholar] [CrossRef]
  37. Shitara, H. Geographical and topographical position of Lake Izunuma-Uchinuma. In Report on Environmental Conservation Measures for Izunuma-Uchinuma; Izunuma-Uchinuma Environmental Conservation Measures Study Committee: Sendai, Japan, 1992; pp. 1–3. [Google Scholar]
  38. Naito, T. Interactions between swans and aquatic plants. In Report on Environmental Conservation Measures for Izunuma-Uchinuma; Izunuma-Uchinuma Environmental Conservation Measures Study Committee: Sendai, Japan, 1992; pp. 265–281. [Google Scholar]
  39. Takahashi, Y.; Fujimoto, Y. Survey of shape and area of Lake Izunuma-Uchinuma, Miyagi Prefecture, Japan using aerial photographs taken in 2007. Izunuma-Uchinuma Wetl. Res. 2018, 12, 17–25. [Google Scholar]
  40. Biodiversity Center of Japan. Monitoring Site 1000 Inland Waters Survey Report. Available online: https://www.biodic.go.jp/moni1000/findings/reports/pdf/h27_inland_waters.pdf (accessed on 16 January 2025).
  41. Kamata, K.; Hraide, A.; Nishita, M.; Fujimoto, Y.; Shindo, K. Searching for spawning areas of Micropterus salmoides by Side scan sonar and inspecting the validity of this method in Lake Izunuma. Izunuma-Uchinuma Wetl. Res. 2009, 3, 31–40. [Google Scholar]
  42. Nakagawa, H.; Hibino, K. Survey of Bottom Sediments in Lake Izunuma-Uchinuma. In Lake Izunuma-Uchinuma Environmental Conservation Science Research Report; Izunuma-Uchinuma Environmental Conservation Academic Investigation Committee: Sendai, Japan, 1988; pp. 157–199. [Google Scholar]
  43. Naito, T.; Shibasaki, T.; Sugawara, K.; Iizumi, S. Plants of Lake Izunuma-Uchinuma. In Lake Izunuma-Uchinuma Environmental Conservation Science Research Report; Izunuma-Uchinuma Environmental Conservation Academic Investigation Committee: Sendai, Japan, 1988; pp. 201–262. [Google Scholar]
  44. Tsuji, M.; Hiratsuka, A. Special Issue “Ecological restoration of riverine ecotone”. Jpn. Soc. Reveget. Technol. 2008, 33, 548–553. [Google Scholar] [CrossRef]
  45. Japan Sediments Management Association. Sediment Investigation and Testing Manual: Technical Materials, 4th ed.; Japan Sediments Management Association: Tokyo, Japan, 2016. [Google Scholar]
  46. Tan, W.; Xing, J.; Yang, S.; Yu, G.; Sun, P.; Jiang, Y. Long term aquatic vegetation dynamics in Longgan Lake using Landsat time series and their responses to water level fluctuation. Water 2020, 12, 2178. [Google Scholar] [CrossRef]
  47. Wilcox, D.A.; Nichols, S.J. The effects of water-level fluctuations on vegetation in a Lake Huron wetland. Wetlands 2008, 28, 487–501. [Google Scholar] [CrossRef]
  48. Evtimova, V.; Donohue, I. Water-level fluctuations regulate the structure and functioning of natural lakes. Freshw. Biol. 2016, 61, 251–264. [Google Scholar] [CrossRef]
  49. Wen, J.; Li, B.; Xiao, H.; Gong, C.; Gao, A.; Wang, Y.; Li, D.; Zeng, H.; Li, Y.; Yuan, G.; et al. Floating Mat Formation Makes Zizania latifolia More Competitive under the Conditions of Continuous Significant Water Level Rise. Plants 2023, 12, 1193. [Google Scholar] [CrossRef]
  50. Johnston, C.A. Sediment and nutrient retention by freshwater wetlands: Effects on surface water quality. Crit. Rev. Environ. Control 1991, 21, 491–565. [Google Scholar] [CrossRef]
  51. Wu, D.; Hua, Z. The effect of vegetation on sediment resuspension and phosphorus release under hydrodynamic disturbance in shallow lakes. Ecol. Eng. 2014, 69, 55–62. [Google Scholar] [CrossRef]
  52. Zhang, Y.; Lai, X.; Zhang, L.; Song, K.; Yao, X.; Gu, L.; Pang, C. The influence of aquatic vegetation on flow structure and sediment deposition: A field study in Dongting Lake, China. J. Hydrol. 2020, 584, 124644. [Google Scholar] [CrossRef]
  53. Yuan, Y.; Bingner, R.L.; Locke, M.A. A review of effectiveness of vegetative buffers on sediment trapping in agricultural areas. Ecohydrology 2009, 2, 321–336. [Google Scholar] [CrossRef]
  54. Yoshimura, S. Limnology; Sanseido: Tokyo, Japan, 1937. [Google Scholar]
  55. Wilcox, D.A. Implications of hydrologic variability on the succession of plants in Great Lakes wetlands. Aquat. Ecosyst. Health Manag. 2004, 7, 223–231. [Google Scholar] [CrossRef]
  56. Topping, D.; Rubin, D.; Nelson, J.; Kinzel, P.; Corson, I. Colorado River sediment transport: 2. Systematic Bed-elevation and grain-size effects of sand supply limitation. Water Resour. Res. 2000, 36, 543–570. [Google Scholar] [CrossRef]
  57. Marburg, A.; Turner, M.; Kratz, T. Natural and anthropogenic variation in coarse wood among and within lakes. J. Ecol. 2006, 94, 558–568. [Google Scholar] [CrossRef]
  58. Ono, Y.; Insects of Lake Izunuma-Uchinuma. Lake Izunuma-Uchinuma Environmental Conservation Science Research Report; Izunuma-Uchinuma Environmental Conservation Academic Investigation Committee: Sendai, Japan, 1988; pp. 329–334. [Google Scholar]
  59. Kurechi, M.; Takara, S.; Kosugi, M.; Koyama, H.; Sato, T.; Takahashi, O.; Hayashi, K.; Iwai, S.; Yamaki, H.; Hiraizumi, H. On the environmental utilization during the breeding season of little grebe and Eurasian coot. In Report on the Conservation and Management Plan for the Birds of Lake Izunuma-Uchinuma; Japanese Wild Bird Society and the Miyagi Prefectural Board of Education: Sendai, Japan, 1981; pp. 181–202. [Google Scholar]
  60. Nishimura, O. Analysis of Formation Mechanism of Bottom Environment and Development of Sedimentation Control Technology in Shallow Closed Water Area. Final Research Results Report of Environment Research and Technology Development Fund (B-1004); the Ministry of the Environment: Tokyo, 2013. Available online: https://www.env.go.jp/policy/kenkyu/suishin/kadai/syuryo_report/pdf/B-1004.pdf (accessed on 16 January 2025).
  61. Fujimoto, Y.; Shimada, T.; Inoue, K.; Takahashi, Y.; Hayami, H. Below-average water level in Lake Izunuma-Uchinuma in Miyagi Pref, Japan, in the winter of 2016/17 induced whooper swan feeding activity, leading to reduced coverage of lotus vegetation and increased dissolved oxygen in the water. Jpn. J. Conserv. Ecol. 2020, 25, 99–108. [Google Scholar] [CrossRef]
  62. Zhao, F.; Mizuno, K.; Tabeta, S.; Hayami, H.; Fujimoto, Y.; Shimada, T. Survey of freshwater mussels using high-resolution acoustic imaging sonar and deep learning–based object detection in the Lake Izunuma, Japan. Aquat. Conserv. 2024, 34, e4040. [Google Scholar] [CrossRef]
  63. Fujimoto, Y. Extinction of a Vallisneria denseserrulata population by the expansion of Nelumbo nucifera in a pond around Lake Izunuma-Uchinuma. Izunuma-Uchinuma Wetl. Res. 2011, 5, 13–19. [Google Scholar] [CrossRef]
  64. Nishihiro, J.; Munemitsu, A.; Yamanouchi, T.; Takamura, N. Time-declining potential of aquatic plant recovery from the propagule banks of lake sediments. Jpn. J. Conserv. Ecol. 2016, 21, 147–154. [Google Scholar] [CrossRef]
  65. Grime, J.P. Evidence for the existence of three primary strategies in plants and its relevance to ecological and evolutionary theory. Am. Nat. 1977, 111, 1169–1194. [Google Scholar] [CrossRef]
  66. Hayami, H.; Fujimoto, Y. A record of Eichhornia crassipes (Mart.) Solms from Lake Izunuma, Miyagi Prefecture, Japan and the possibility of its establishment due to global warming. Izunuma-Uchinuma Wetl. Res. 2022, 16, 33–38. [Google Scholar] [CrossRef]
  67. Nishihiro, J. Effects of lake water-level control on lakeshore plant regeneration (Ohshima Award). Jpn. J. Conserv. Ecol. 2011, 16, 139–148. [Google Scholar] [CrossRef]
  68. Hirano, T.; Higuchi, H. The relationship between river width and the occurrence of riparian bird species in winter. Strix 1988, 7, 203–212. [Google Scholar]
  69. Zhou, J.; Zhou, L.; Xu, W. Diversity of wintering waterbirds enhanced by restoring aquatic vegetation at Shengjin Lake, China. Sci. Total Environ. 2020, 737, 140190. [Google Scholar] [CrossRef]
  70. Takemaru, K. Birds of Lake Izunuma-Uchinuma. In Lake Izunuma-Uchinuma Environmental Conservation Science Research Report; Izunuma-Uchinuma Environmental Conservation Academic Investigation Committee: Sendai, Japan, 1988; pp. 271–301. [Google Scholar]
  71. Takahashi, M.; Miya, A.; Ebina, J.; Sannohe, S.; Mugisawa, T.; Tsumagari, T. Wintering record of Japanese marsh warbler at Lake Izunuma-Uchinuma. Izunuma-Uchinuma Wetl. Res. 2017, 11, 1–5. [Google Scholar] [CrossRef]
  72. Gilbert, G.; Tyler, G.A.; Dunn, C.J.; Smith, K.W. Nesting habitat selection by bitterns Botaurus stellaris in Britain and the implications for wetland management. Biol. Conserv. 2005, 124, 547–553. [Google Scholar] [CrossRef]
  73. Miyamoto, Y.; Nishigaki, M.; Sekioka, H.; Yoshida, T. Coastal restoration in Mikata-goko: Beach nourishment and conservation guidance. Jpn. J. Conserv. Ecol. 2022, 27, 107–118. [Google Scholar] [CrossRef]
  74. Fujimoto, Y. Influence of cutting leaves of lotus plants Nelumbo nucifera on their survival. Ecol. Civ. Eng. 2018, 21, 37–43. [Google Scholar] [CrossRef]
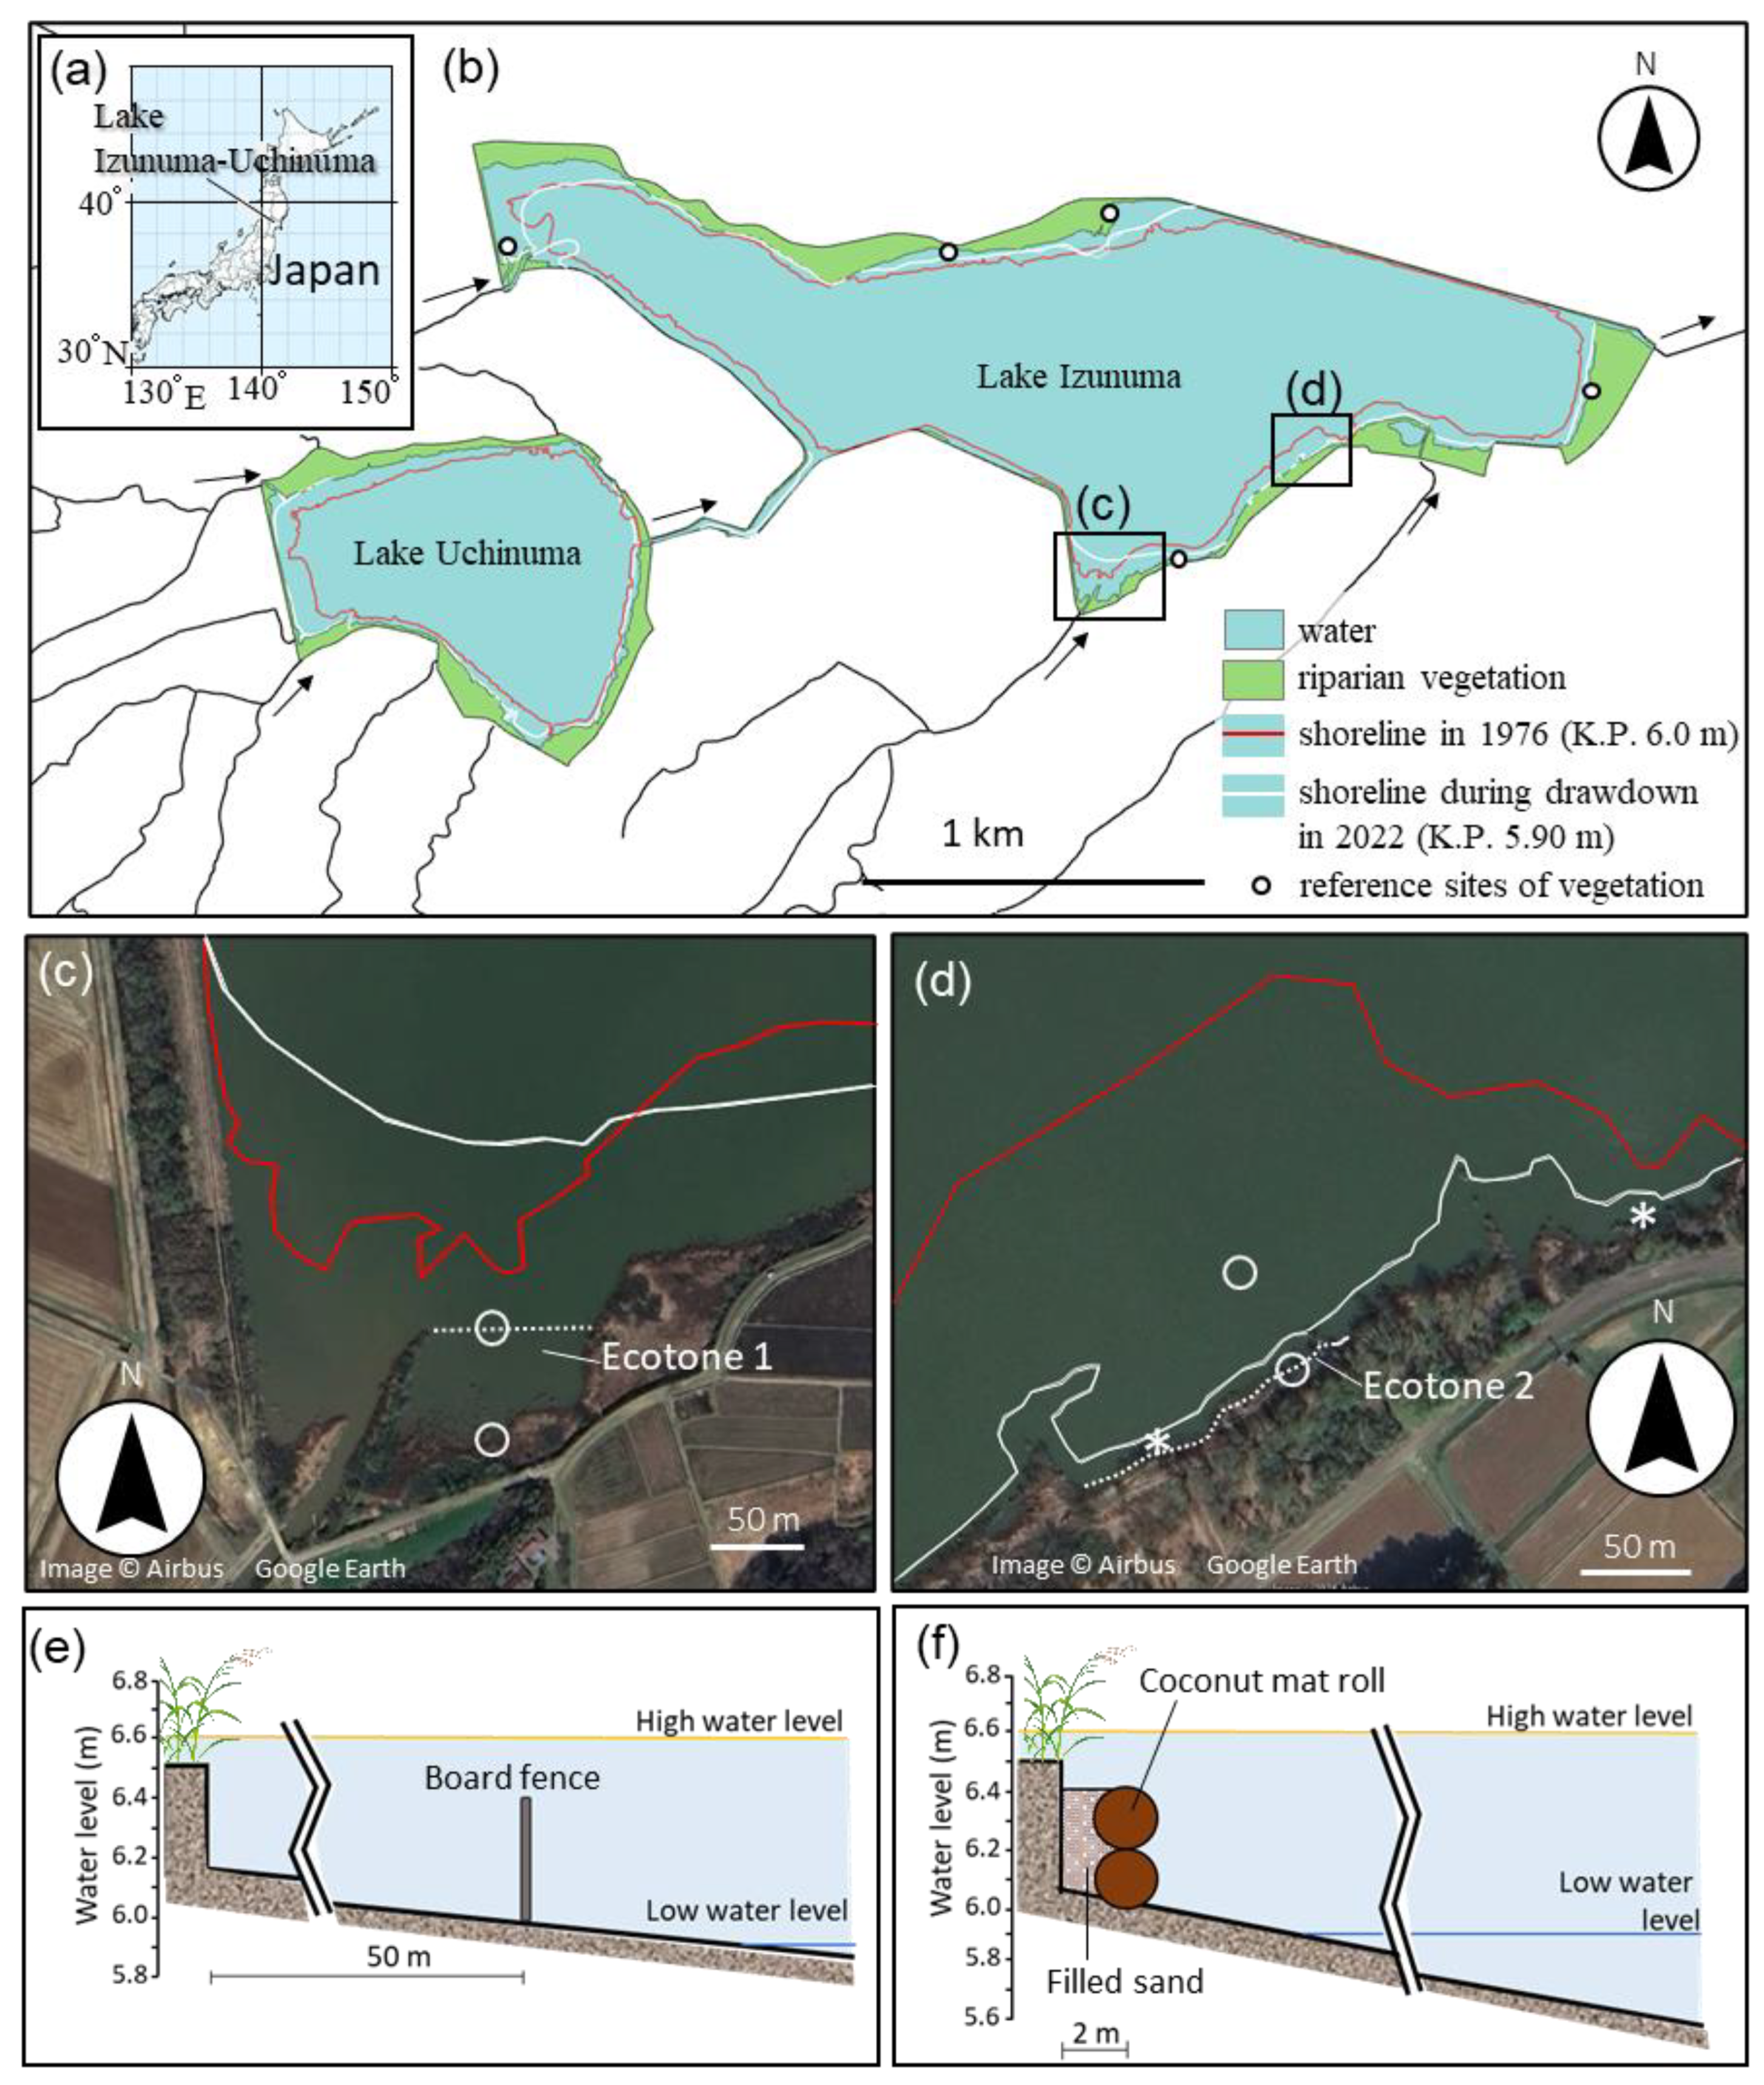
Figure 1. Locations of (a) Lake Izunuma-Uchinuma and (b) Ecotones 1 and 2. (c,d) Plan-view and (e,f) cross-sectional-view of Ecotones 1 and 2. The white dotted line in the plan-view indicates the location of the ecotone structures. The solid red line shows the location of the lakeshore line in 1976 (K.P. 6.0 m), and the solid white line shows the location of the water-level (K.P. 5.9 m) in 2022. The two asterisks indicate the location of the cameras in Ecotone 2 and control areas of the waterbird use study. The cross-sections are located on the lines connecting the circled lines in the plan-view (c,d). The left axis of the (e,f) cross-sectional views shows the water levels.
Water 17 01760 g001
Figure 2. Sedimentation simulation method for Lake Izunuma-Uchinuma. (a) Columns show sedimentation or erosion heights in each cell between 1985 and 2007. (b) Case where sedimentation heights are equally distributed in each cell. (c) Image where sedimentation heights are distributed in each cell according to historical sedimentation. (d) An image of the distribution of sediment from a cell where K.P. reached 6.0 m to other cells.
Water 17 01760 g002
Figure 3. (a) Comparison of seasonal changes in water levels in Lake Izunuma-Uchinuma before (1983–1988) and after (1989–2016) the 1988 weir modification. The black dotted line and the figures above it indicate the proposed controlled water levels (revised Lake Izunuma-Uchinuma Nature Restoration Project [32]). (b) Seasonal changes in high (blue line) and low (orange line) water levels in Lake Izunuma-Uchinuma. The dotted lines indicate approximate straight lines. The values indicate the elevation values in 1983 and 2016, as indicated by the approximate straight line. Words describing vegetation and the environment in Lake Izunuma-Uchinuma are provided above and below the lines of high and low water levels.
Water 17 01760 g003
Figure 4. Sedimentation in Lake Izunuma-Uchinuma between 1985 and 2007. The red and blue areas indicate areas of sedimentation and erosion, respectively.
Water 17 01760 g004
Figure 5. Future projections of the water bodies of Lake Izunuma-Uchinuma. (a) Projected distribution of water (blue) and terrestrial areas (ochre) from 2007 to 2307 based on sediment accumulation simulations. The shoreline is defined at an elevation of 6.0 m. (b) Changes in the total water area over time. The triangle at the top indicates the projected year when the terrestrial area reaches the same extent as the 1978 ecotone zone, as explained in the main text.
Water 17 01760 g005
Figure 6. Photographs of the ecotones in Lake Izunuma-Uchinuma. The left and right panels show Ecotones 1 and 2, respectively. The top, middle, and bottom panels show the before, immediately after, and a few years after the construction of the ecotone structures. The numbers indicate the year of photography.
Water 17 01760 g006
Figure 7. Changes in the vegetation area of Zizania latifolia at the reference sites and in Ecotones 1 and 2 in Lake Izunuma-Uchinuma, Japan. The columns represent the vegetation area recorded for each year at each site.
Water 17 01760 g007
Figure 8. Average number of waterfowl observed in the control area and Ecotone 2 of Lake Izunuma-Uchinuma, Japan. The columns represent the mean daily count of waterfowl recorded at each site during the monitoring period. Asterisks indicate significant differences (p < 0.05).
Water 17 01760 g008
Figure 9. Comparison of chemical oxygen demand (COD) elution rates from sediment in Ecotones 1 and 2 in Lake Izunuma-Uchinuma, Japan. (a) Comparison of COD release between Ecotone 1 and Ecotone 2. (b) Comparison of COD release between emergent and submerged sampling sites within both ecotones. Box-plot elements are as follows: the boxes represent the interquartile range, horizontal lines indicate medians, whiskers show the range, and asterisks indicate significant differences (p < 0.05).
Water 17 01760 g009
Figure 10. Conceptual diagram of (ac) traditional and (ce) modern hydrarch transitions, and (c,d,f) improved management based on the results of this study in Lake Izunuma-Uchinuma.
Water 17 01760 g010
Disclaimer/Publisher’s Note: The statements, opinions and data contained in all publications are solely those of the individual author(s) and contributor(s) and not of MDPI and/or the editor(s). MDPI and/or the editor(s) disclaim responsibility for any injury to people or property resulting from any ideas, methods, instructions or products referred to in the content.