
Numerical Simulation of Fracture Failure Propagation in Water-Saturated Sandstone with Pore Defects Under Non-Uniform Loading Effects

 ,
,  , ,
, ,
Abstract
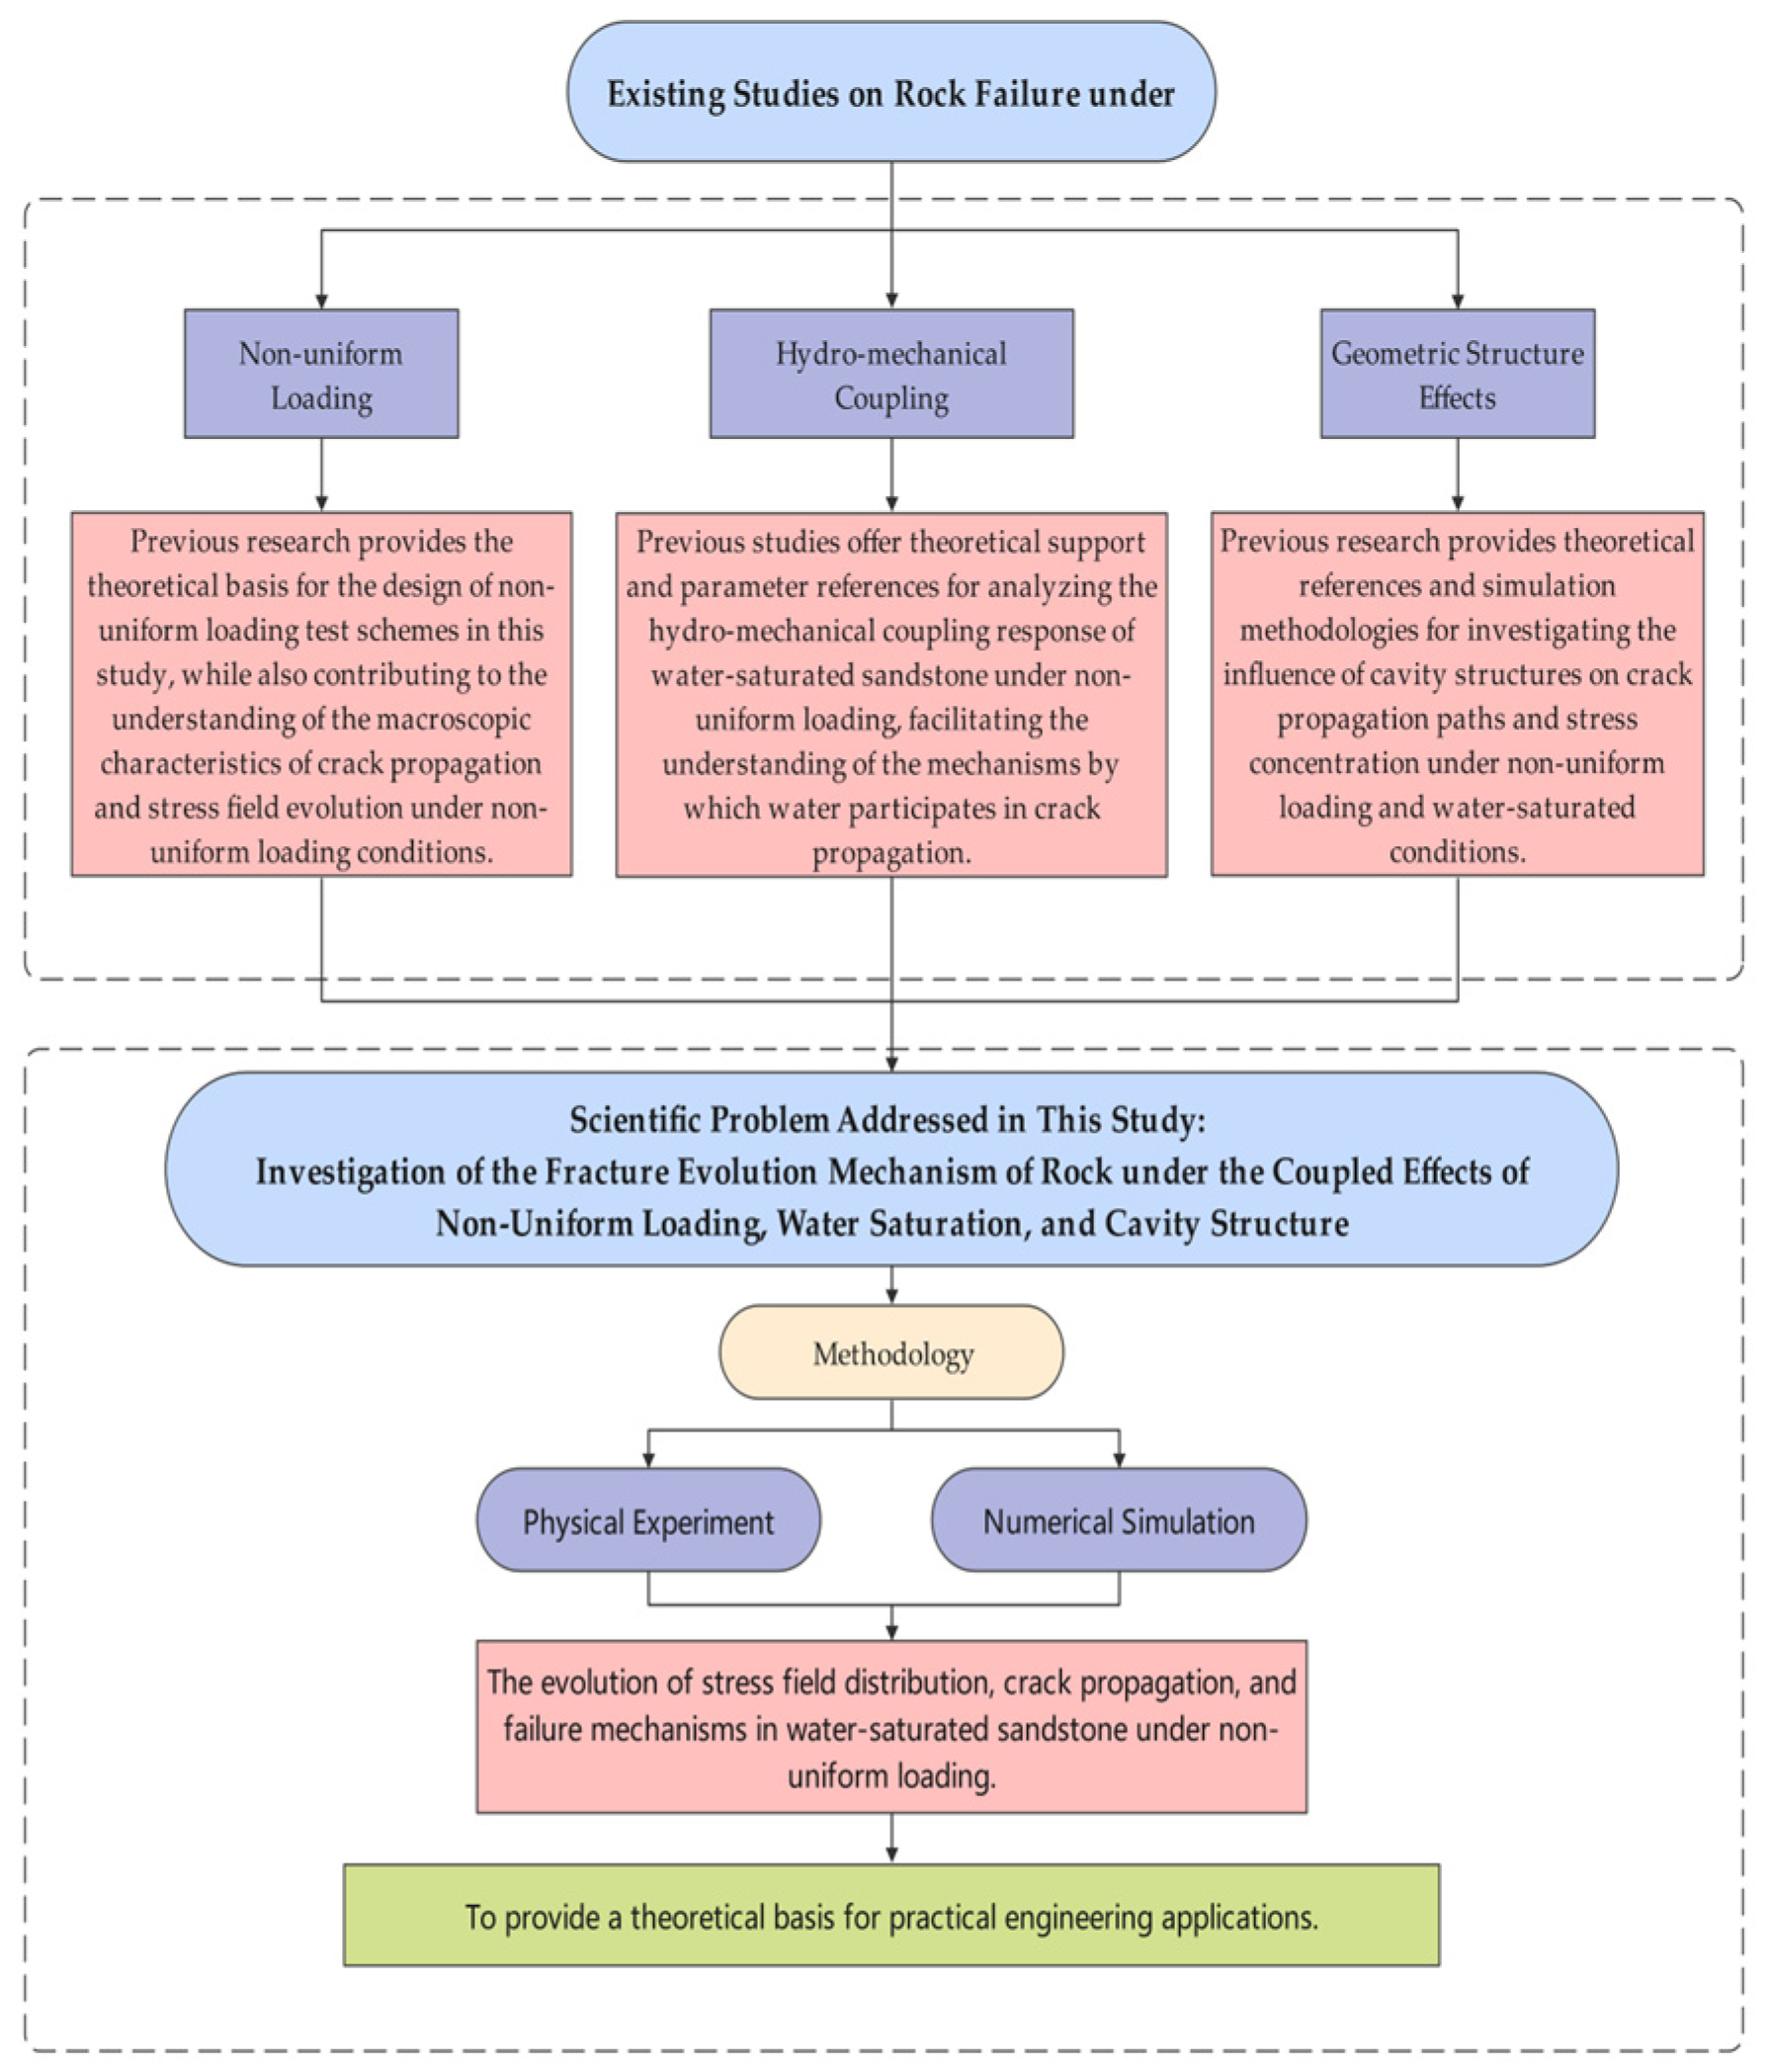
1. Introduction
2. Geological Control Factors of Mining Tunnel Stability Under Groundwater Erosion
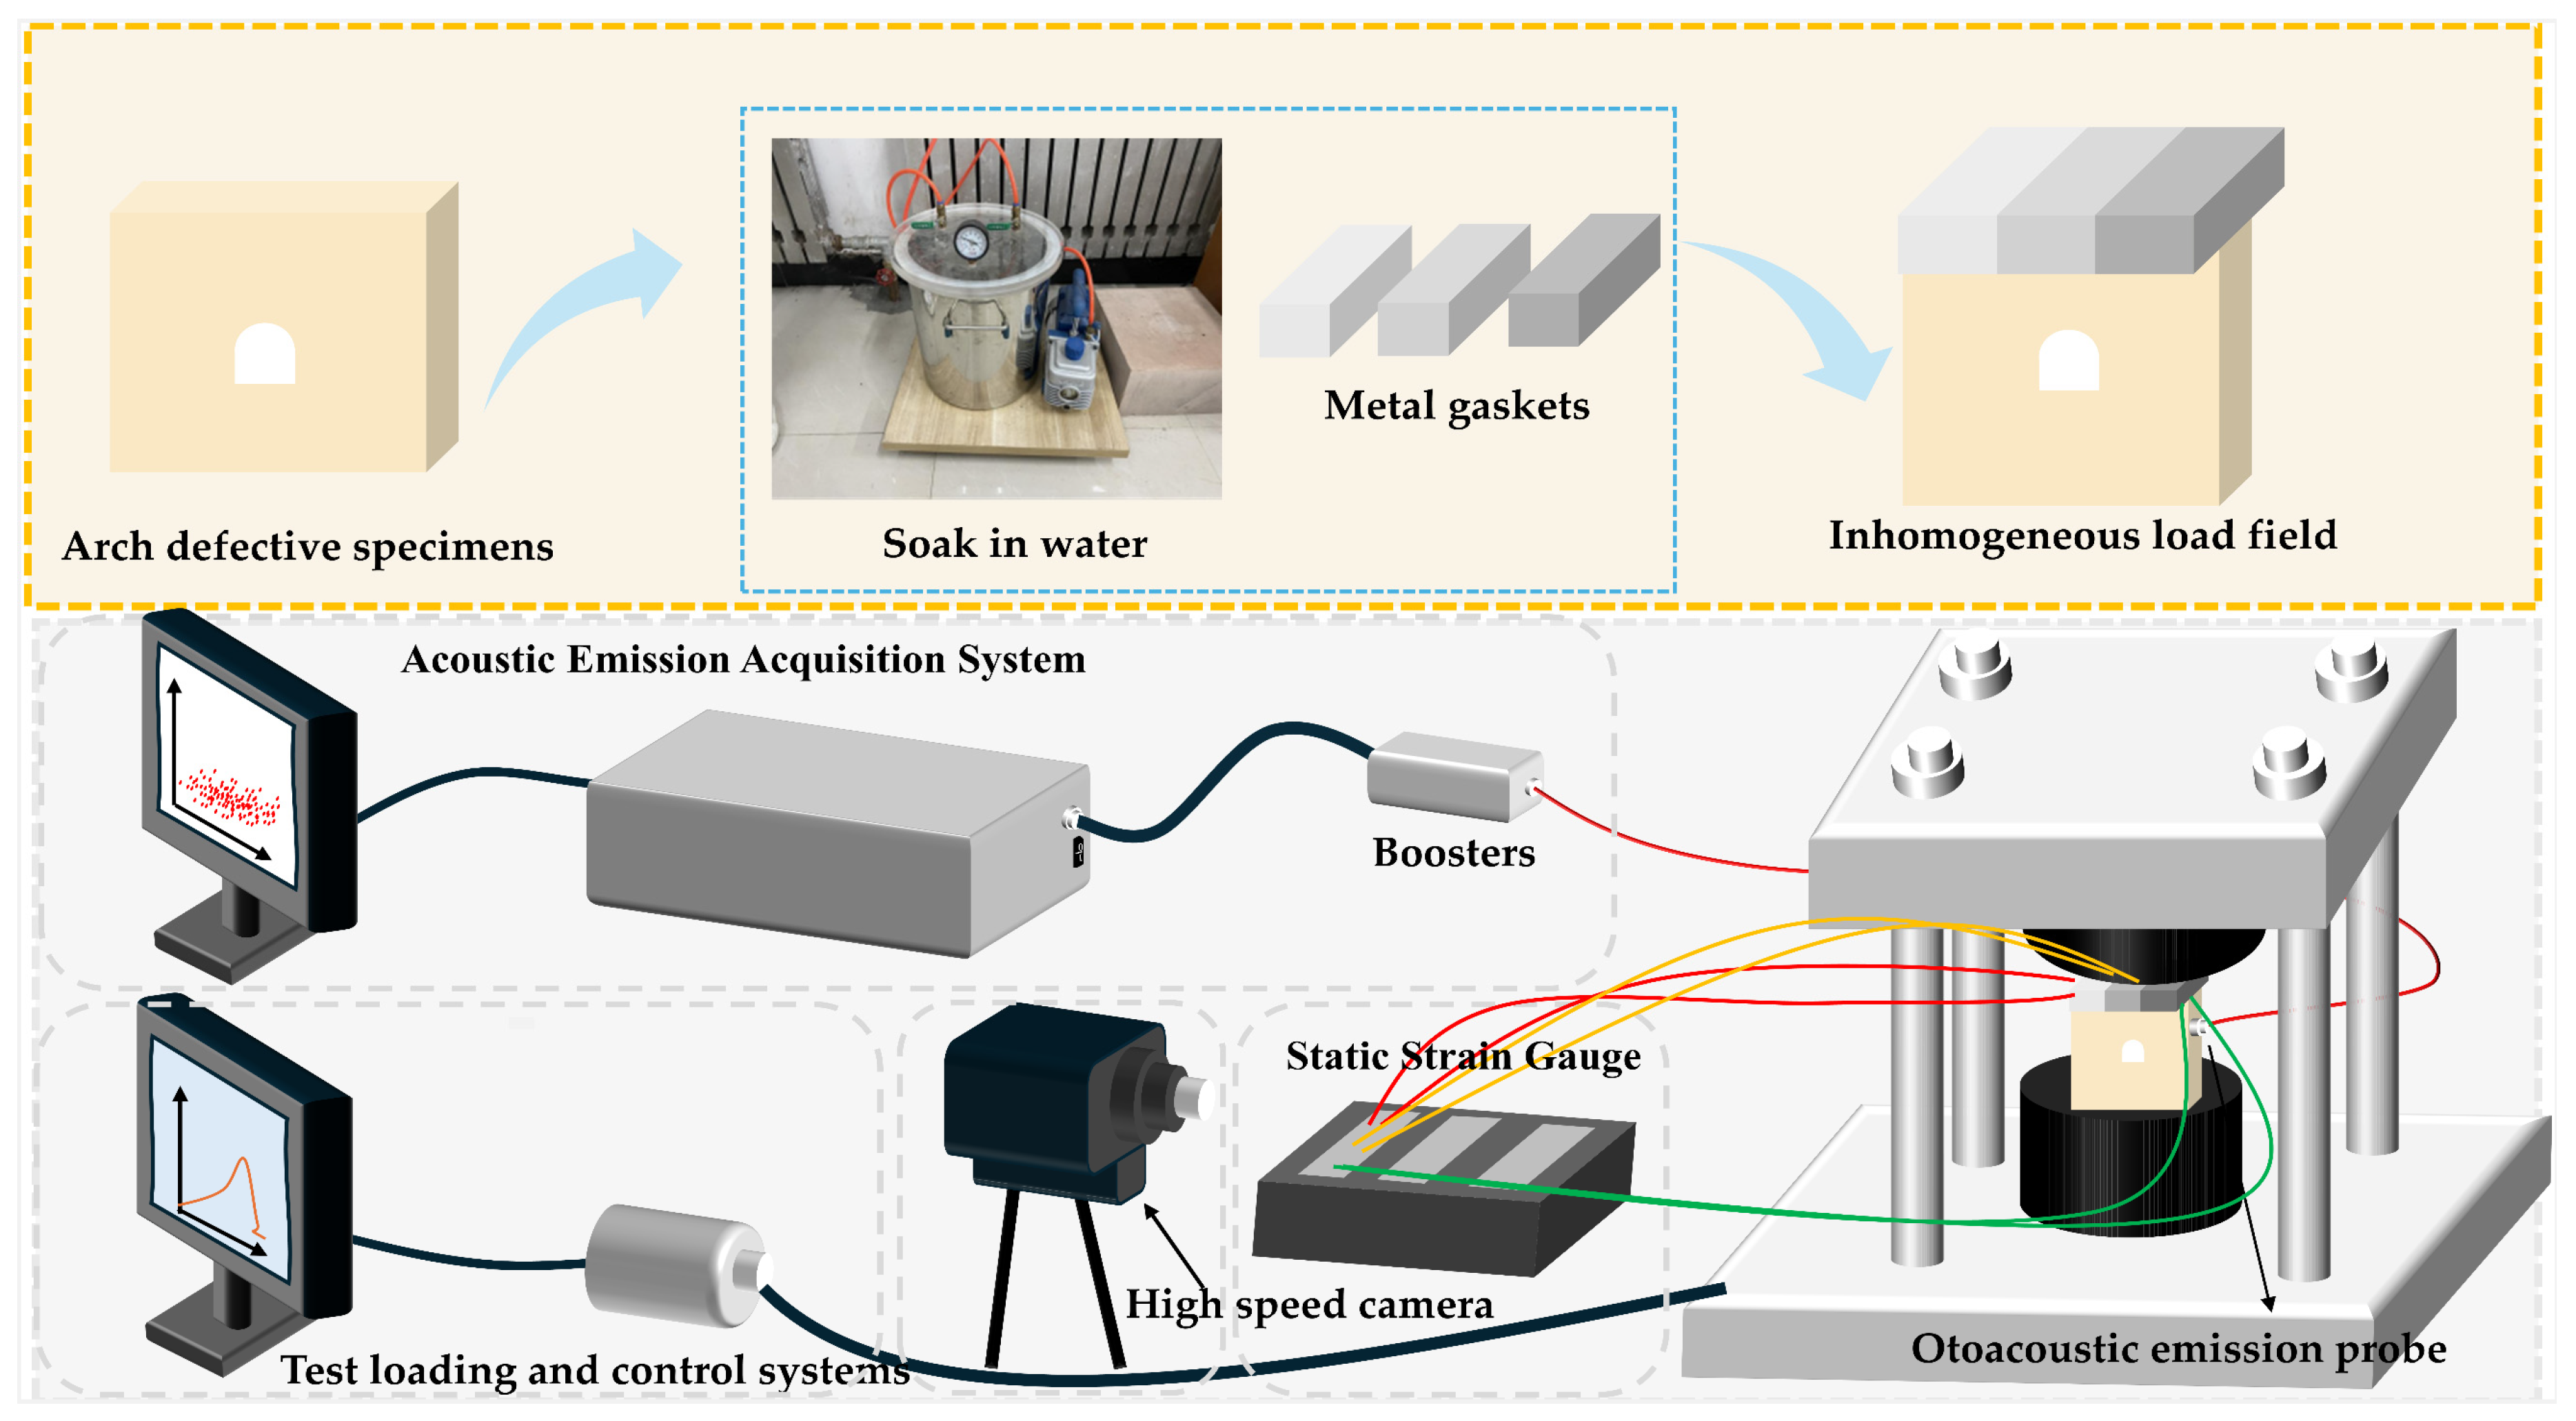
3. Specimen Preparation and Testing Program Design
3.1. Specimen Preparation
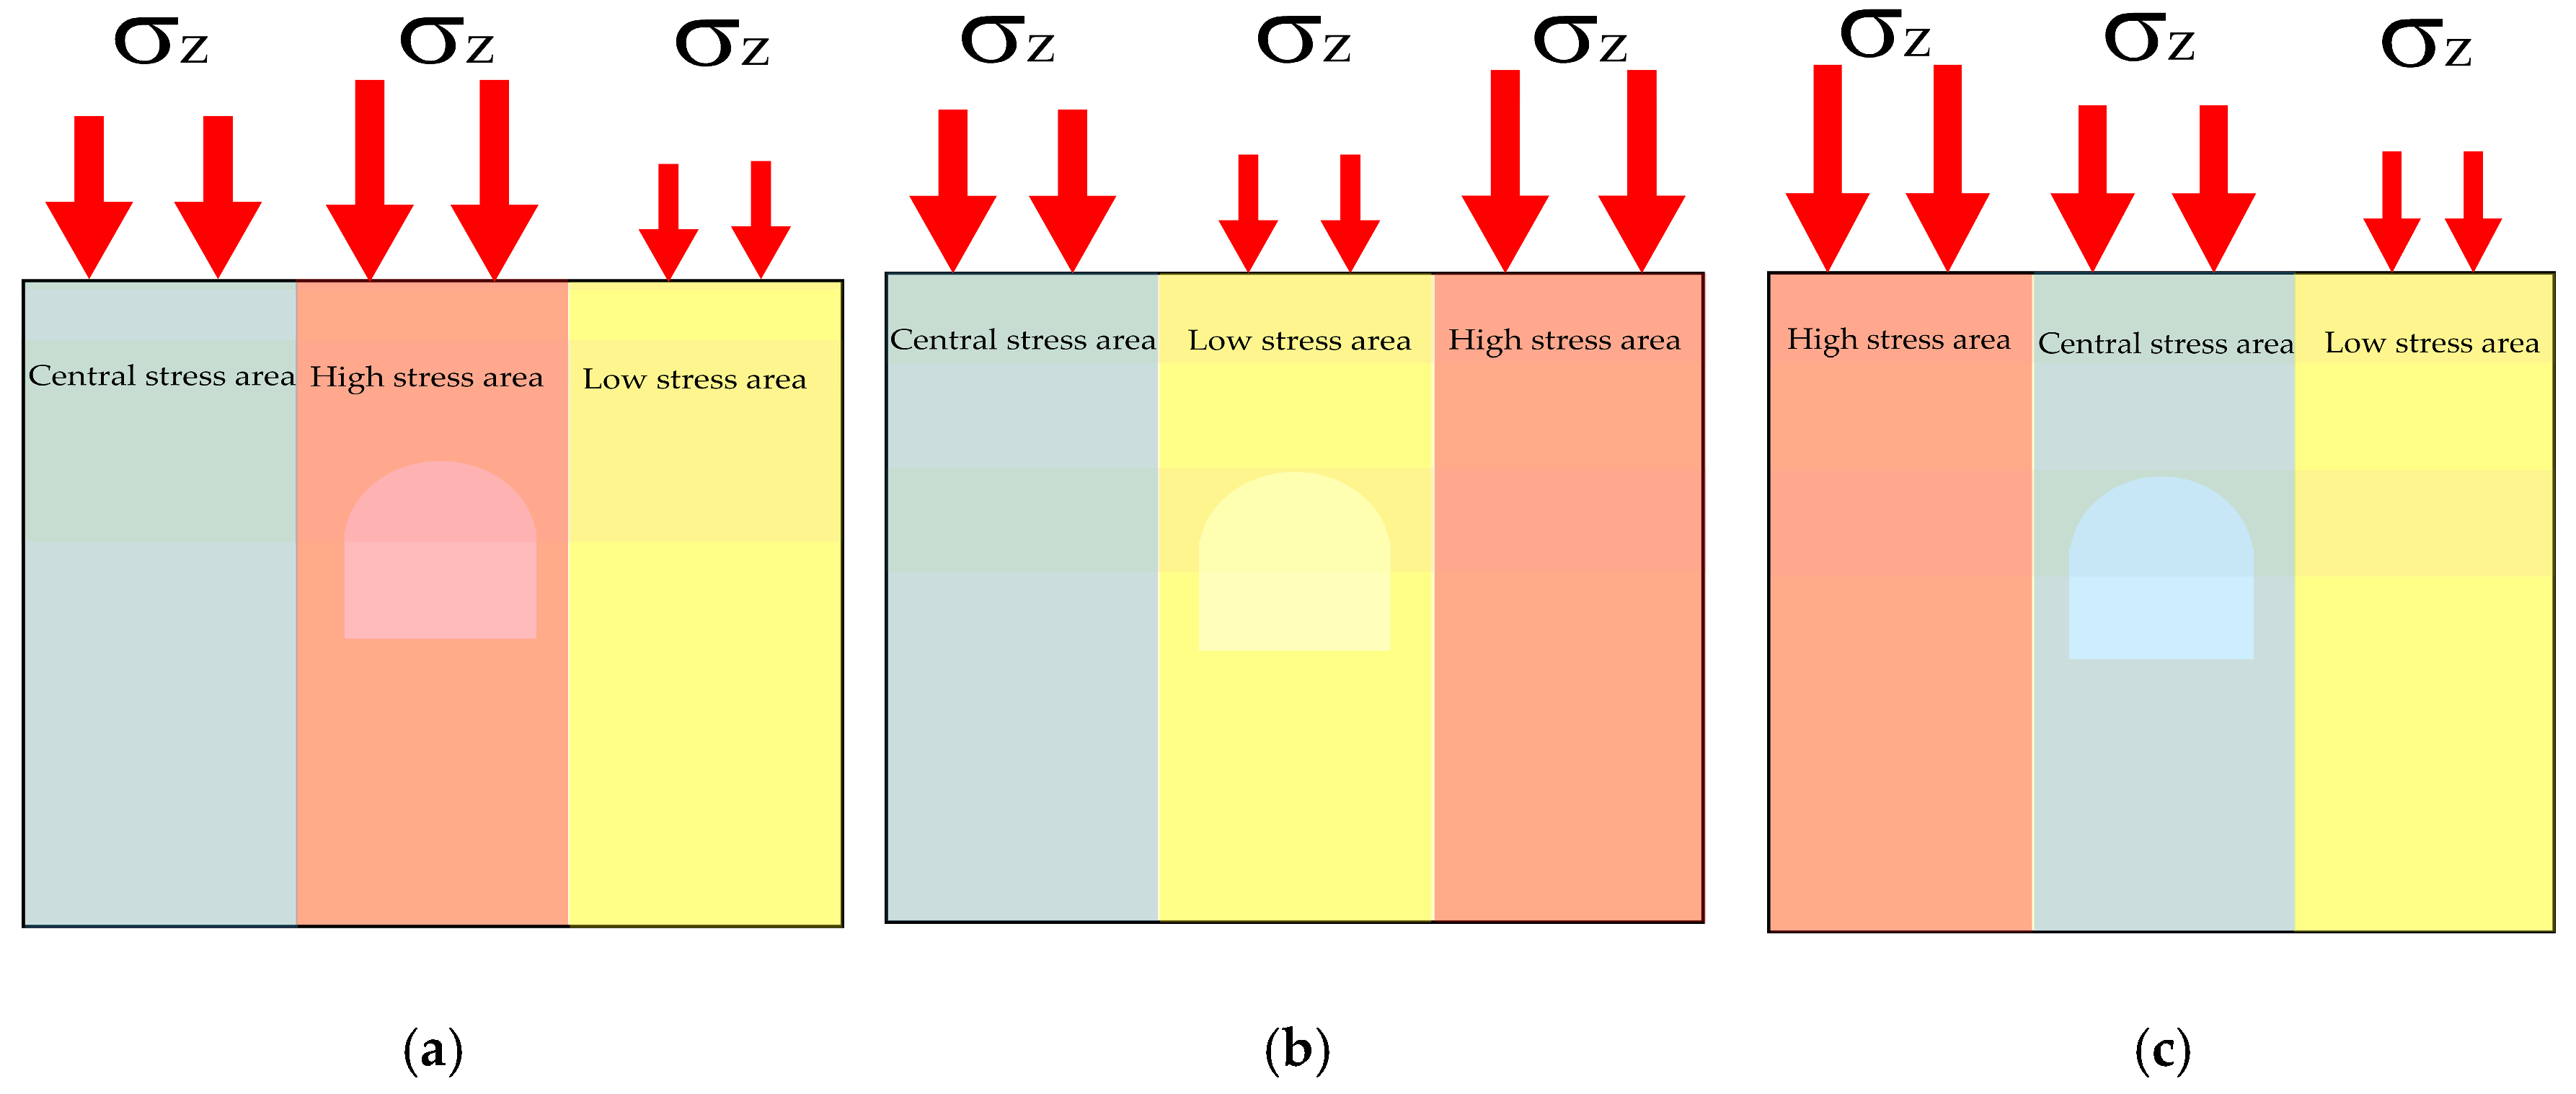
3.2. Experimental Scheme
4. Experimental Results and Analysis
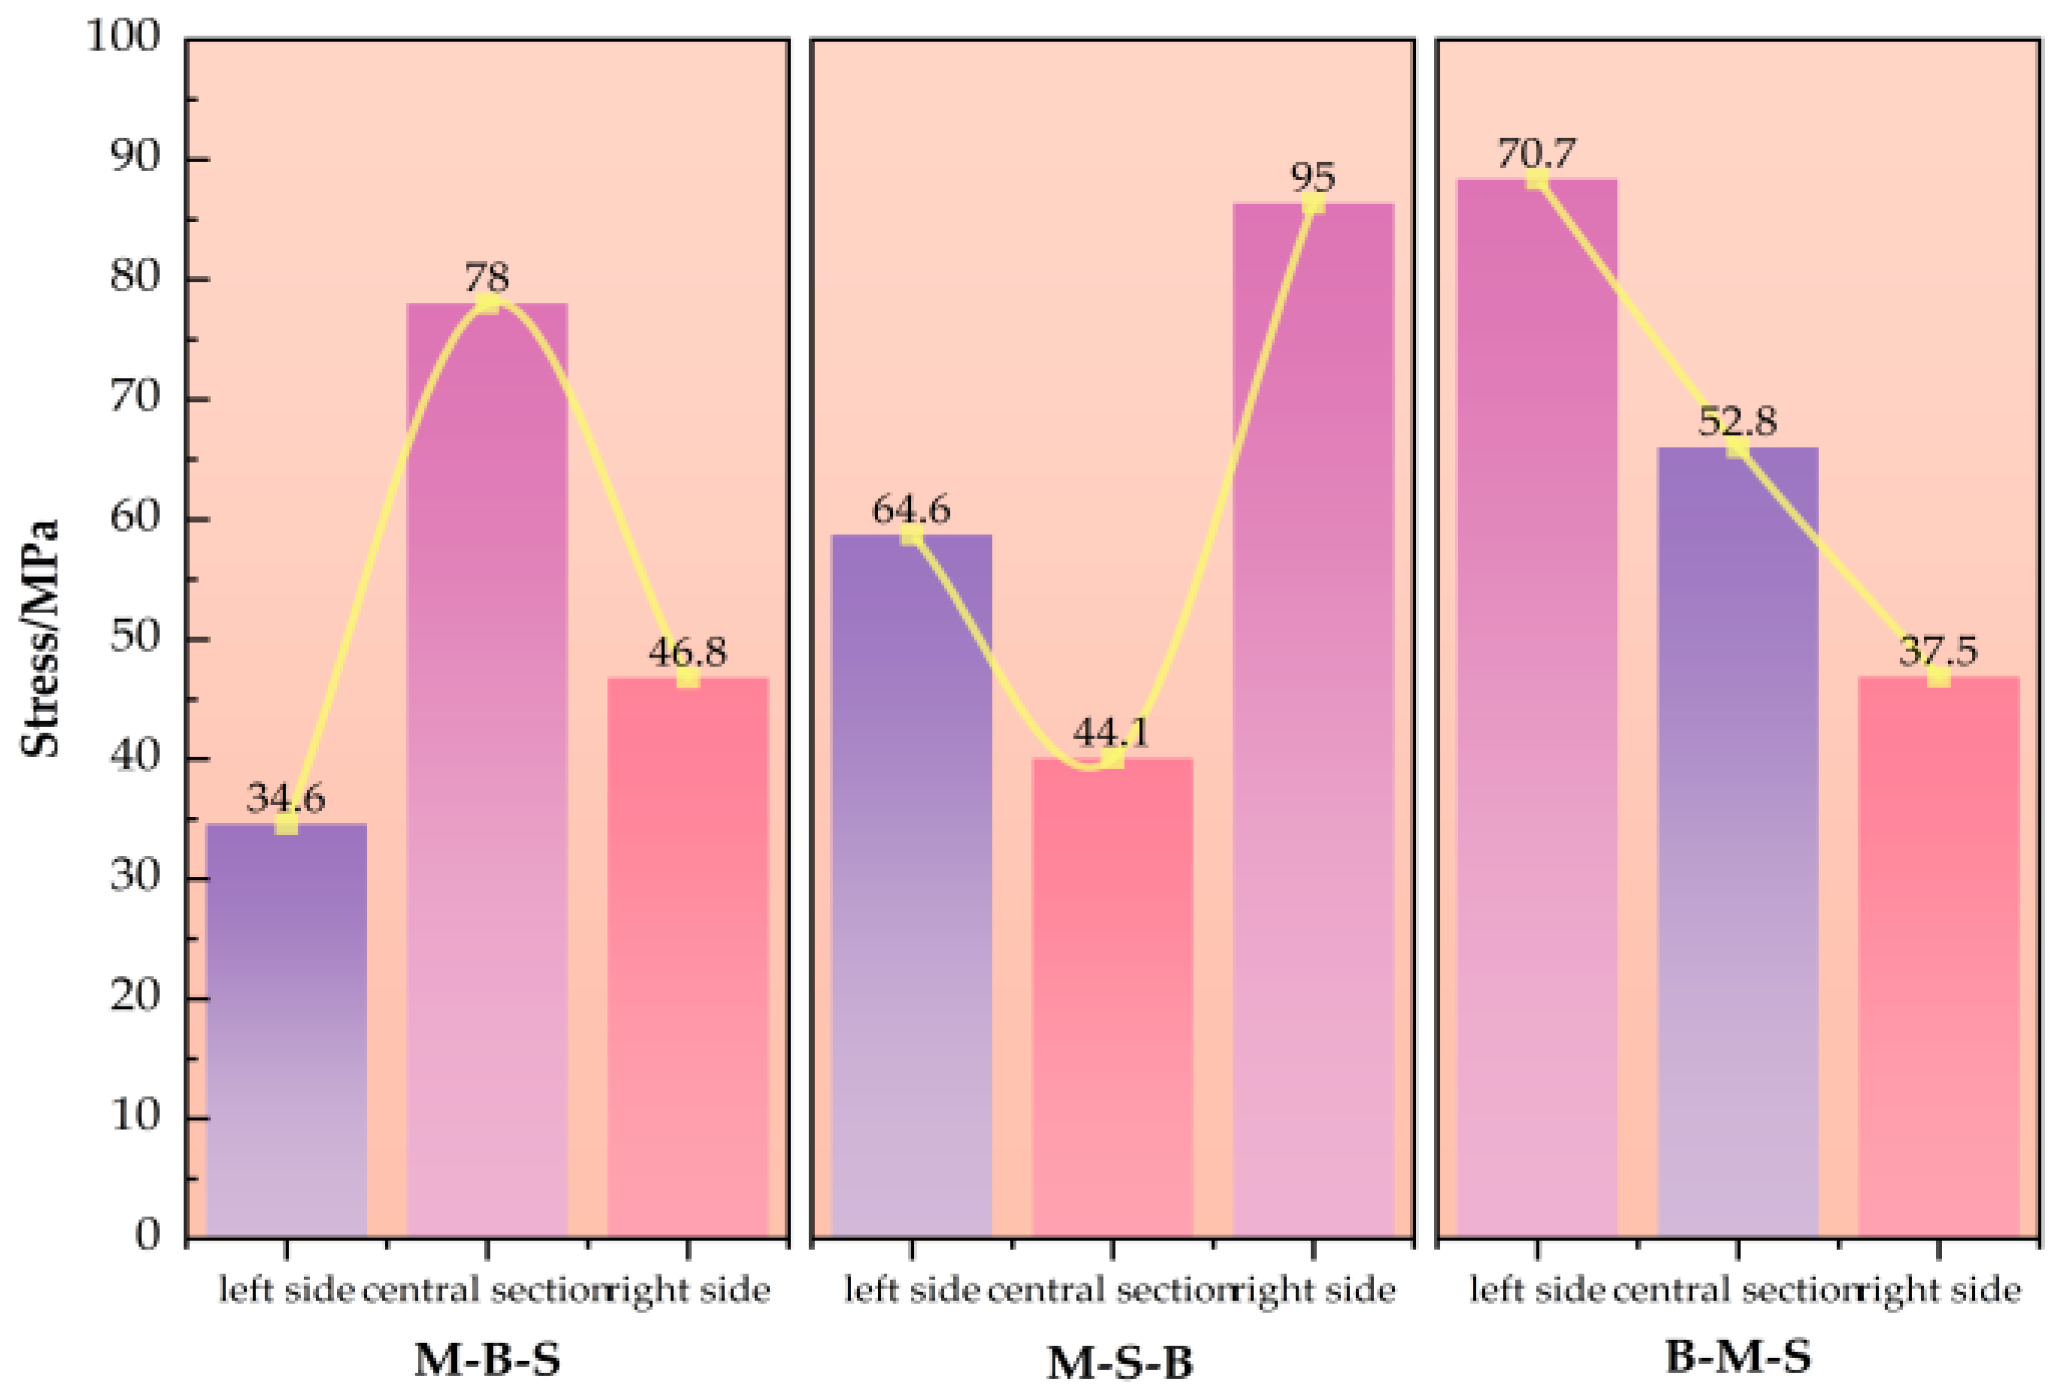
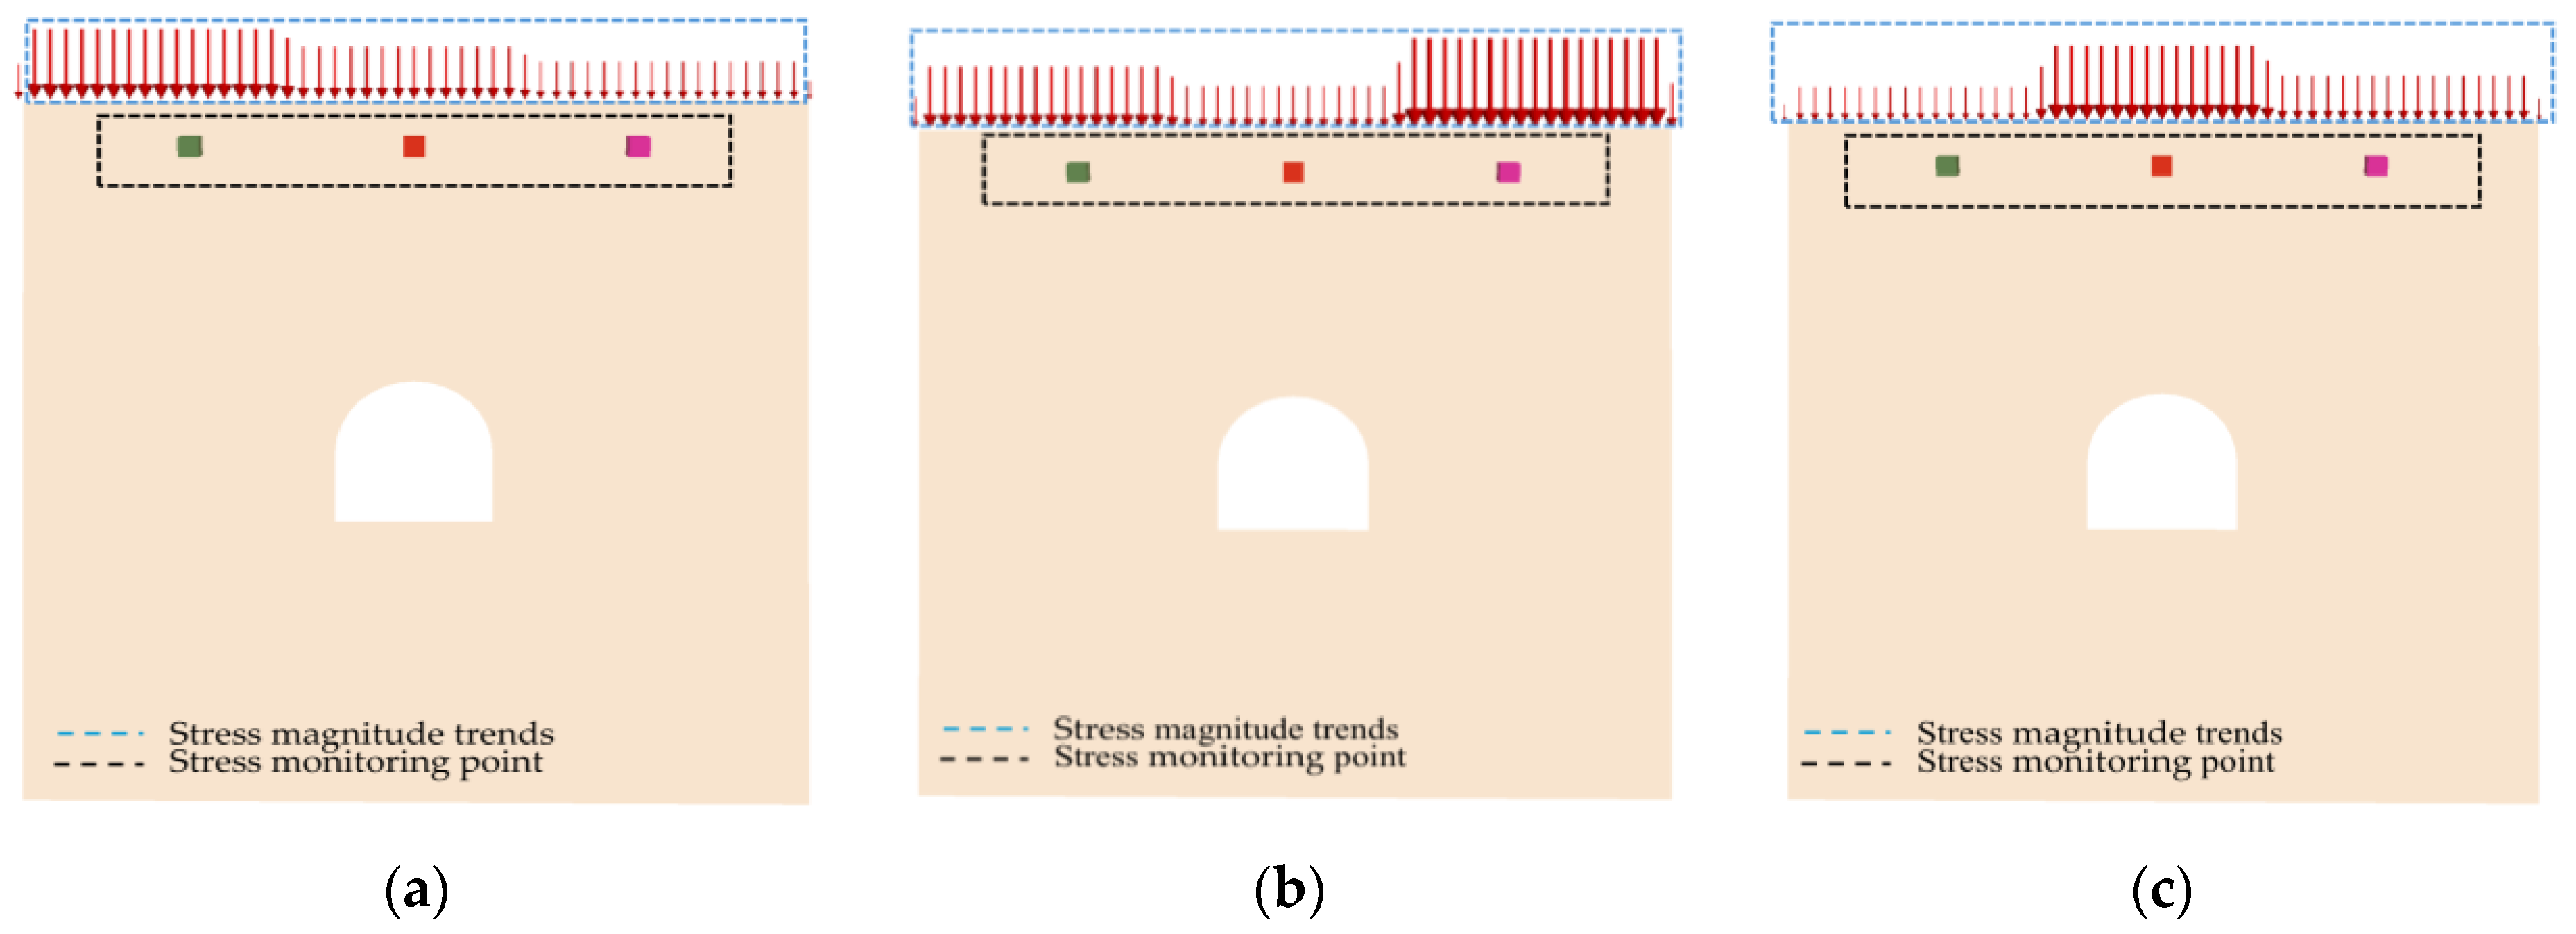
4.1. Non-Uniform Loading Zone
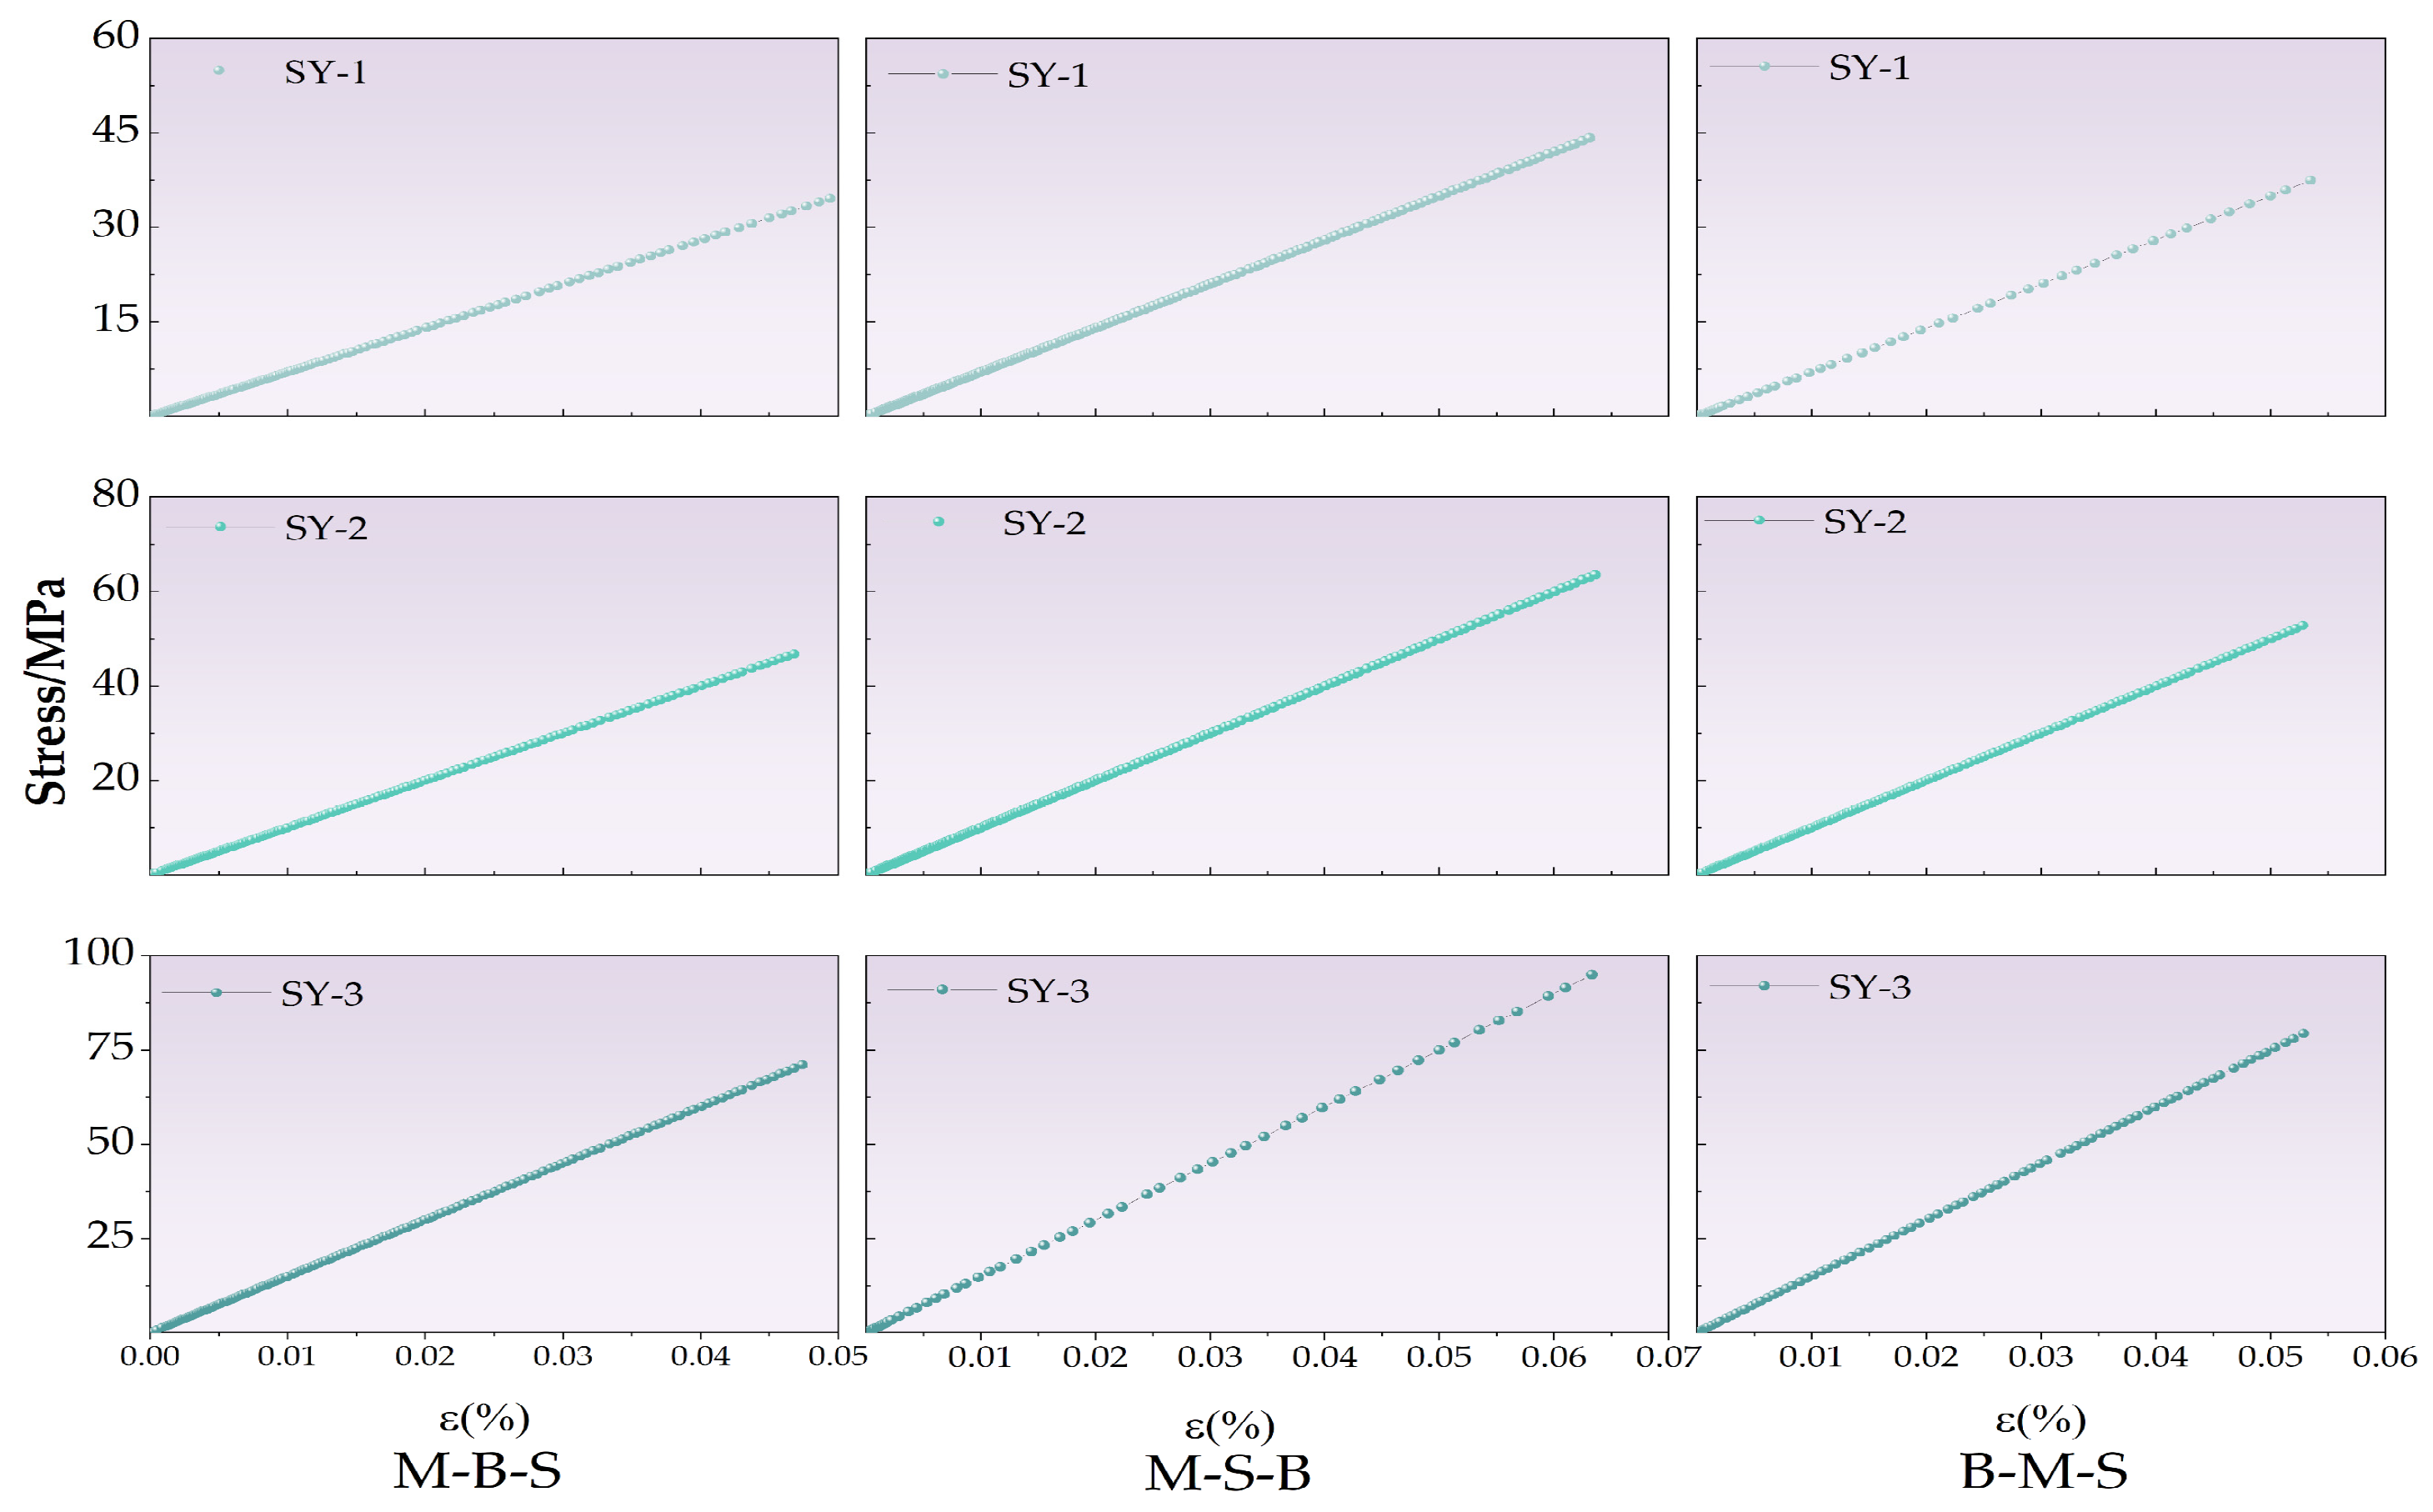
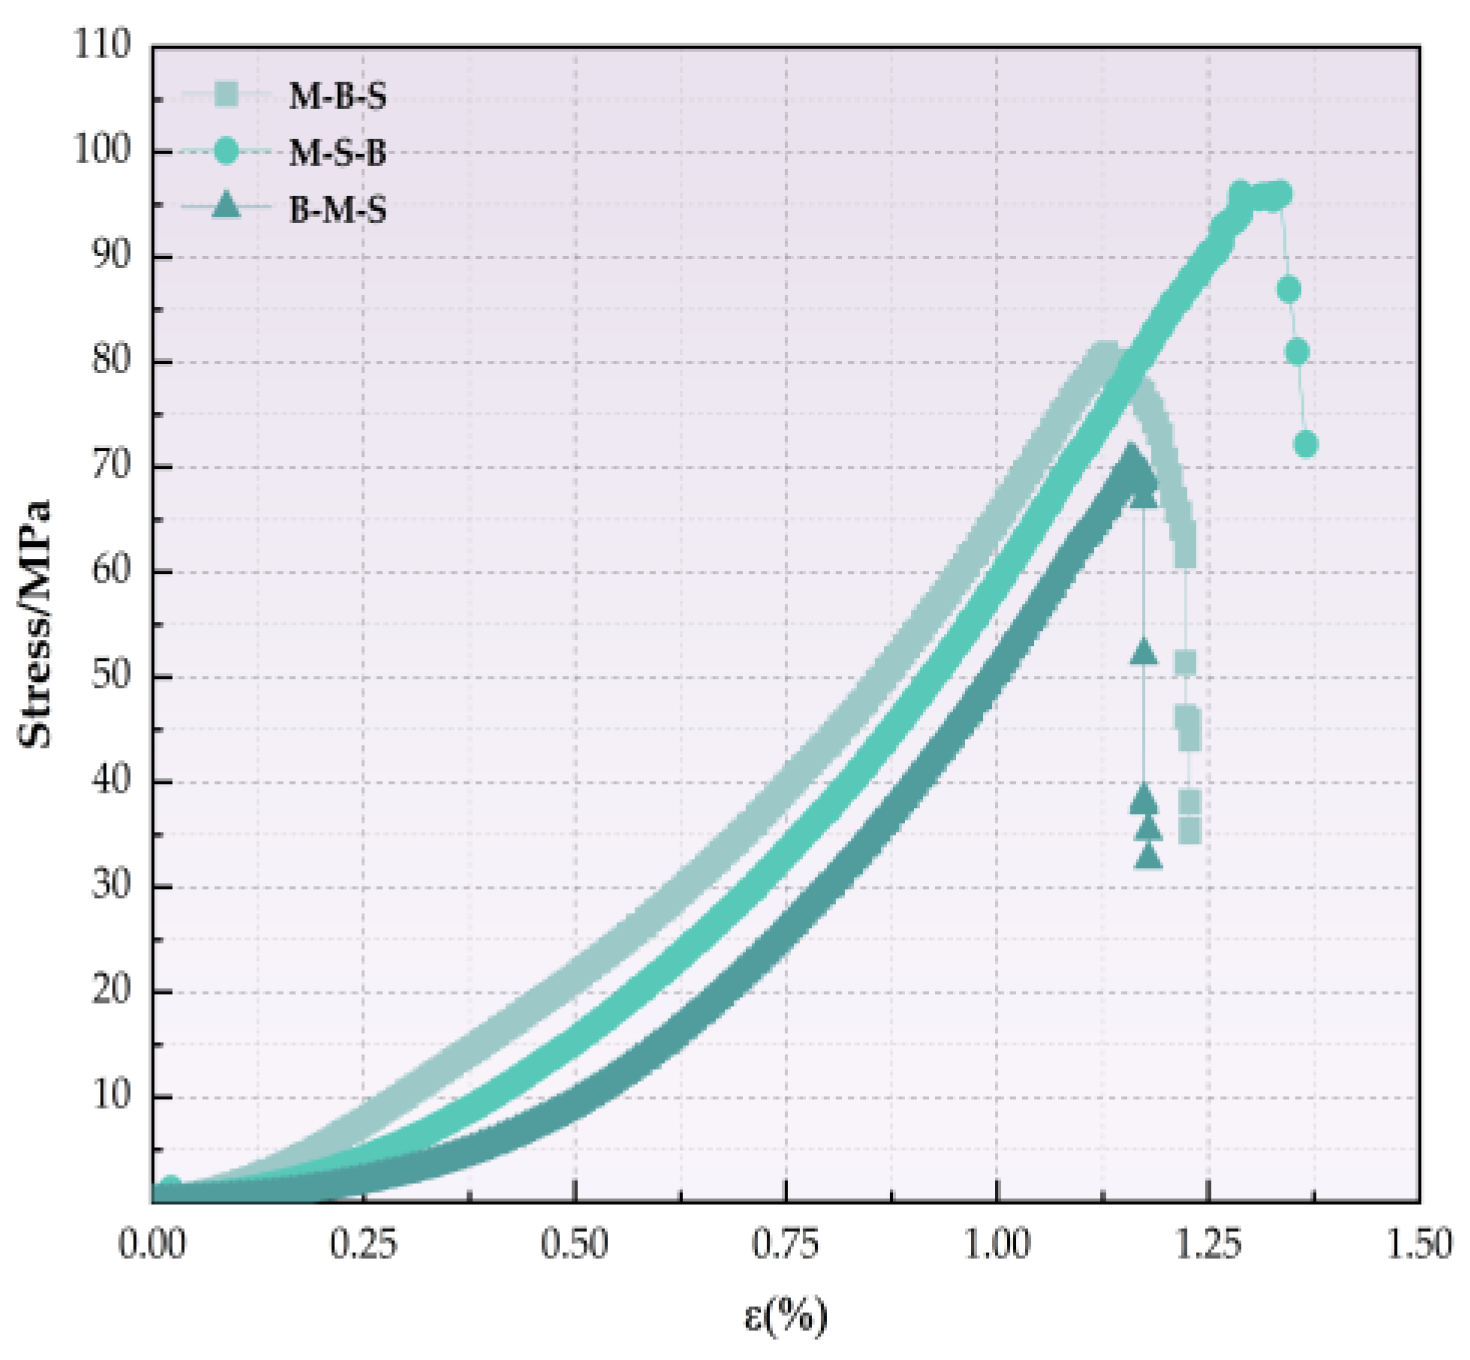
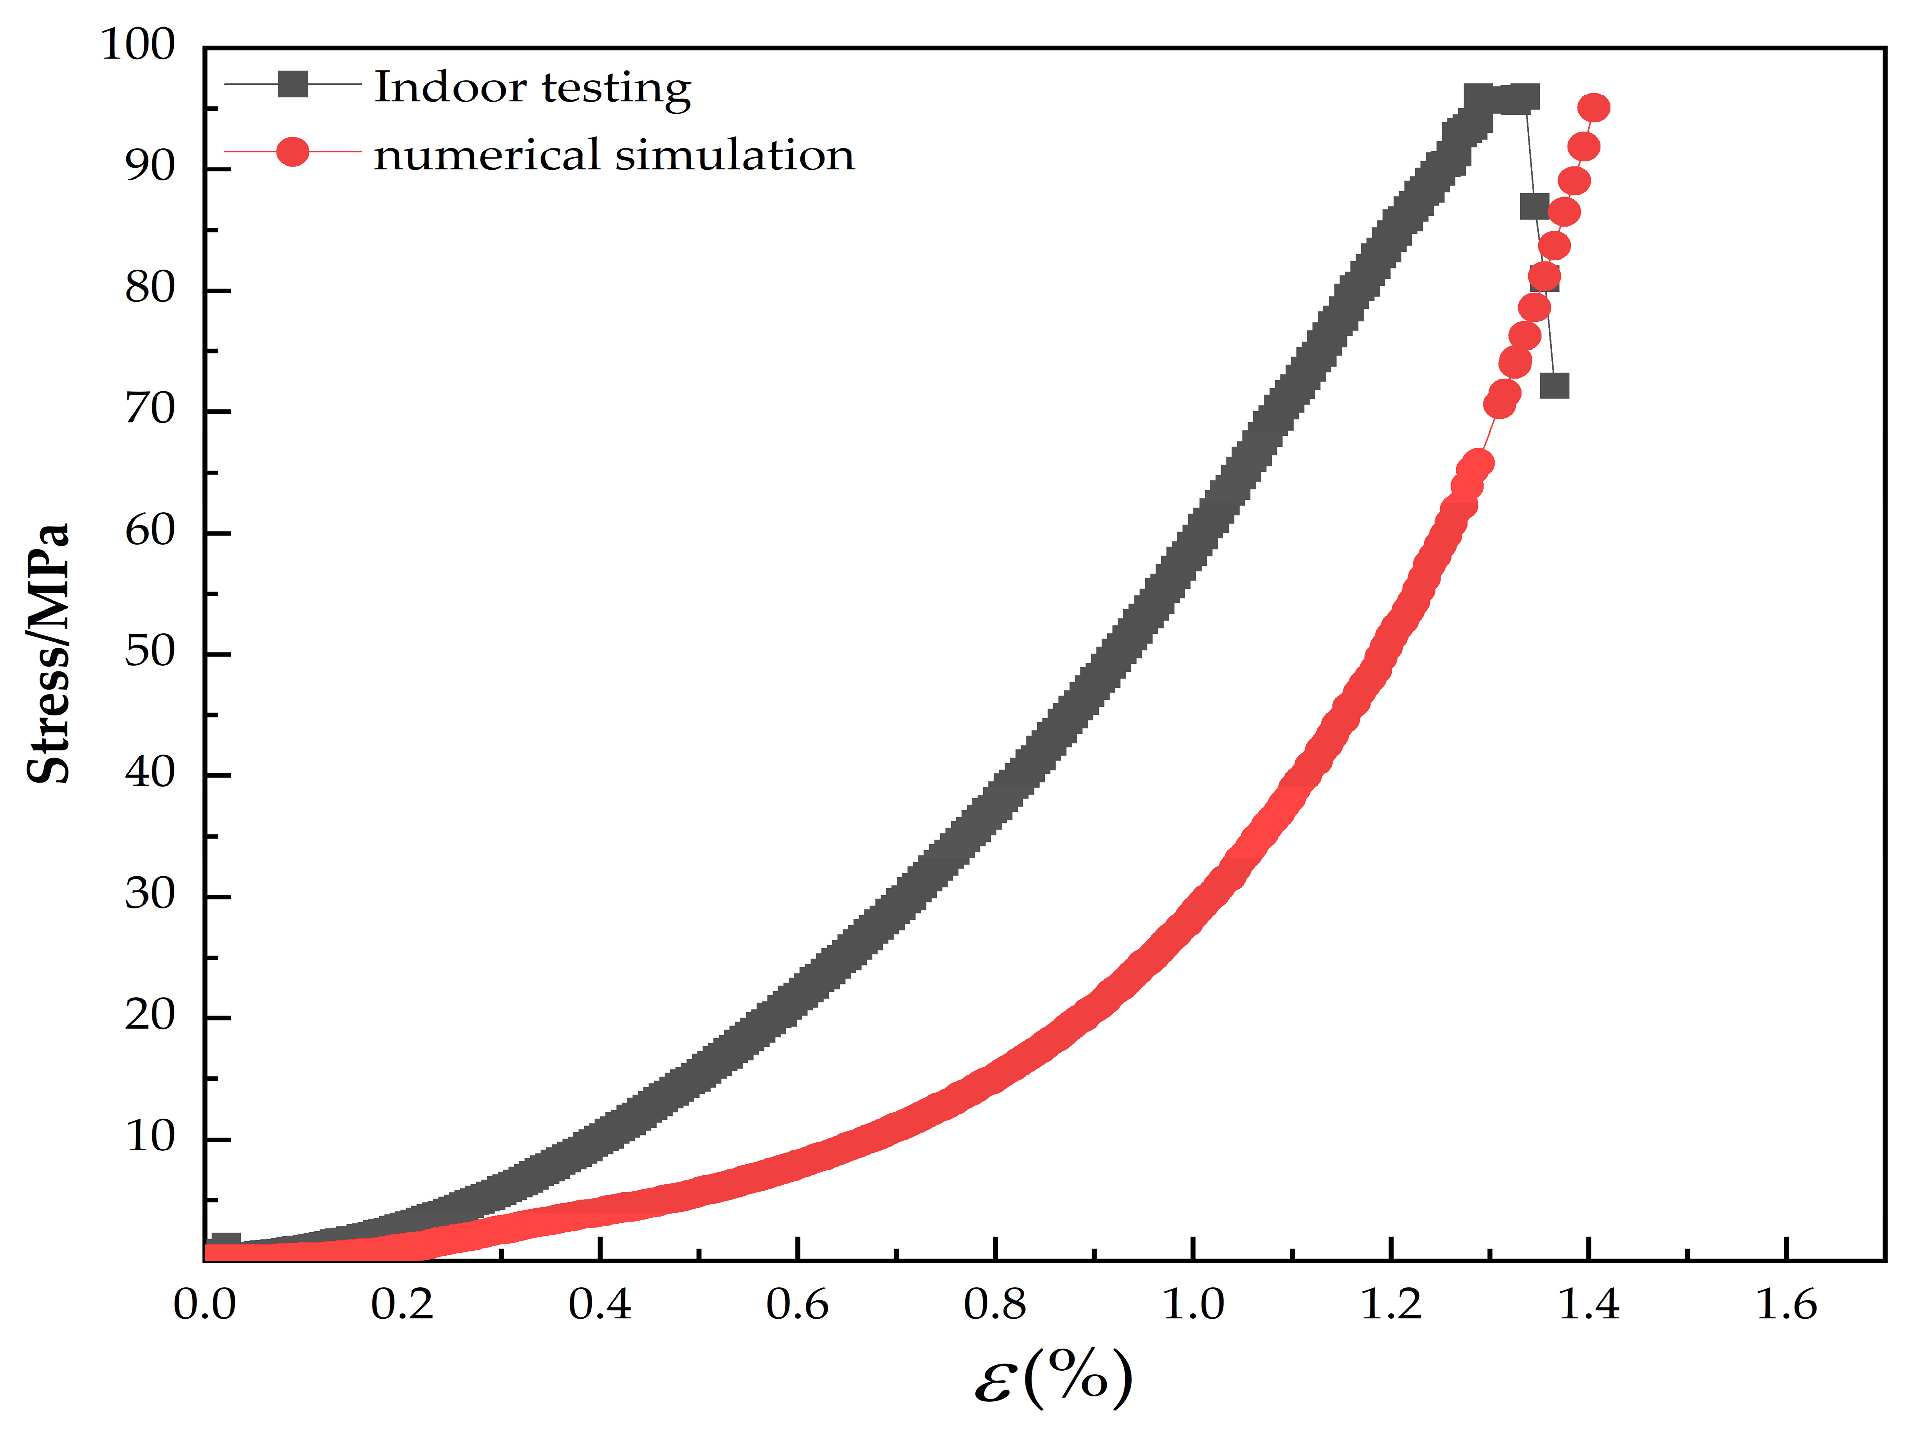
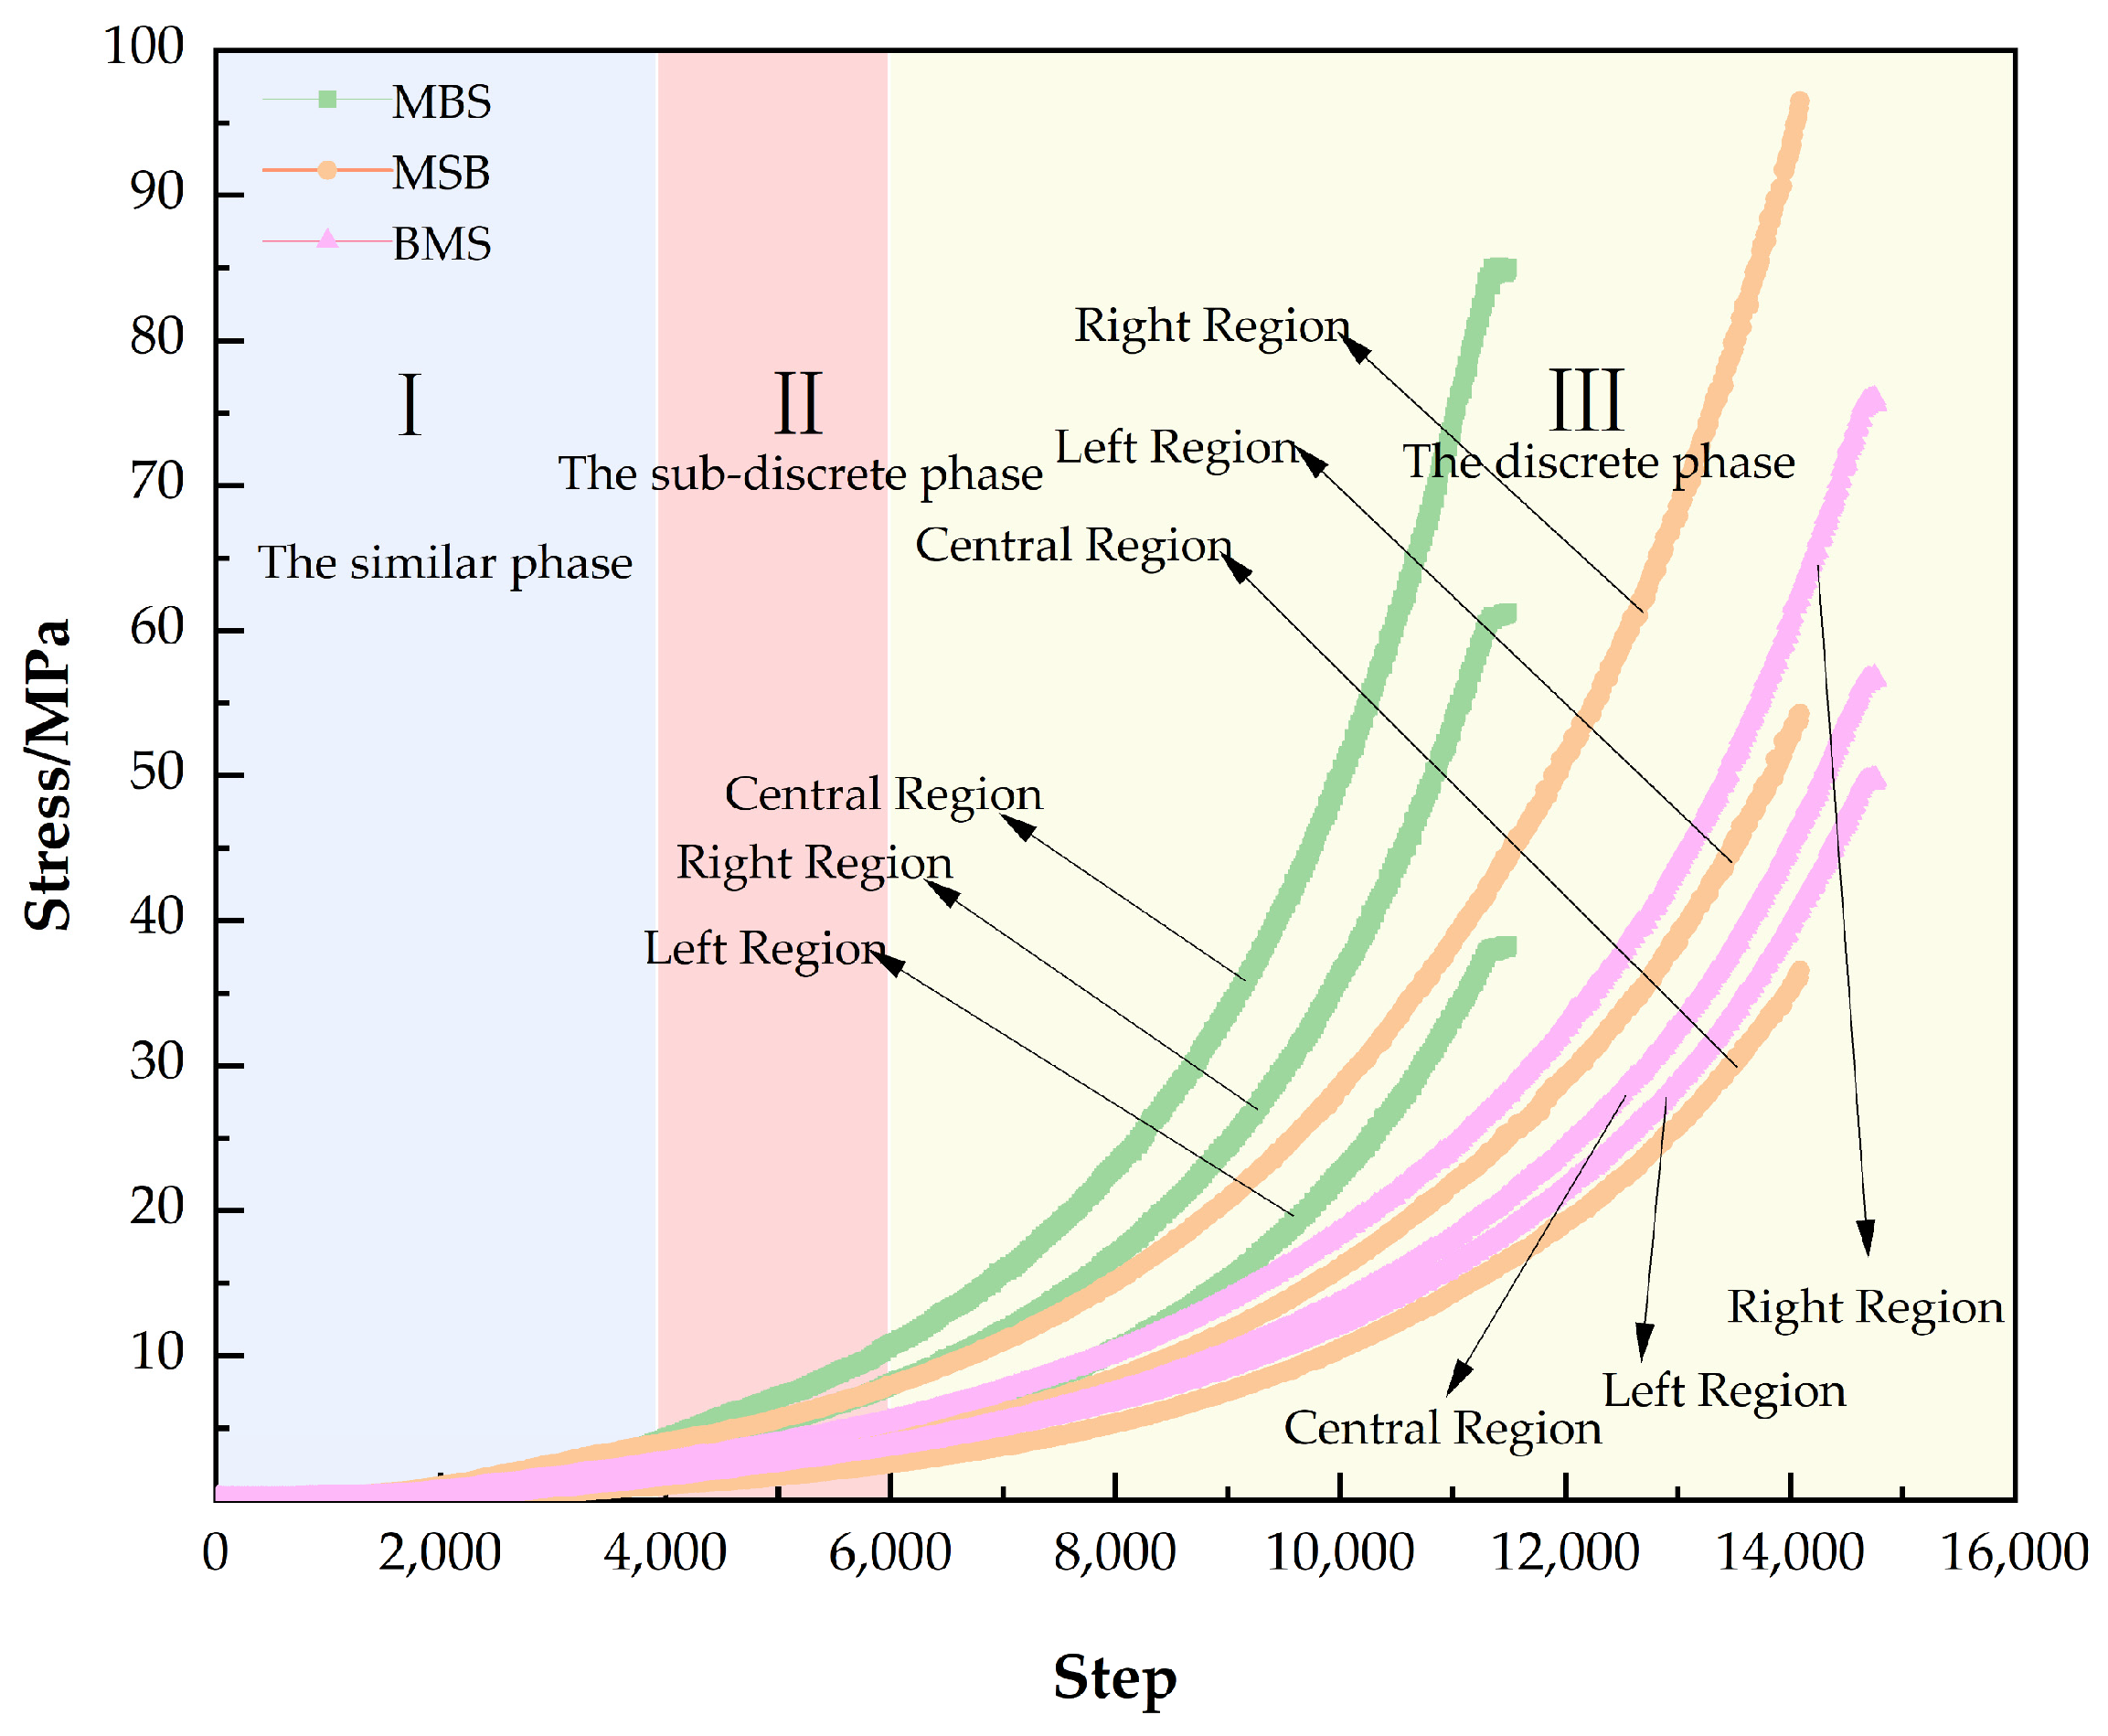
4.2. Stress–Strain Curve of Saturated Sandstone with Pore Defects
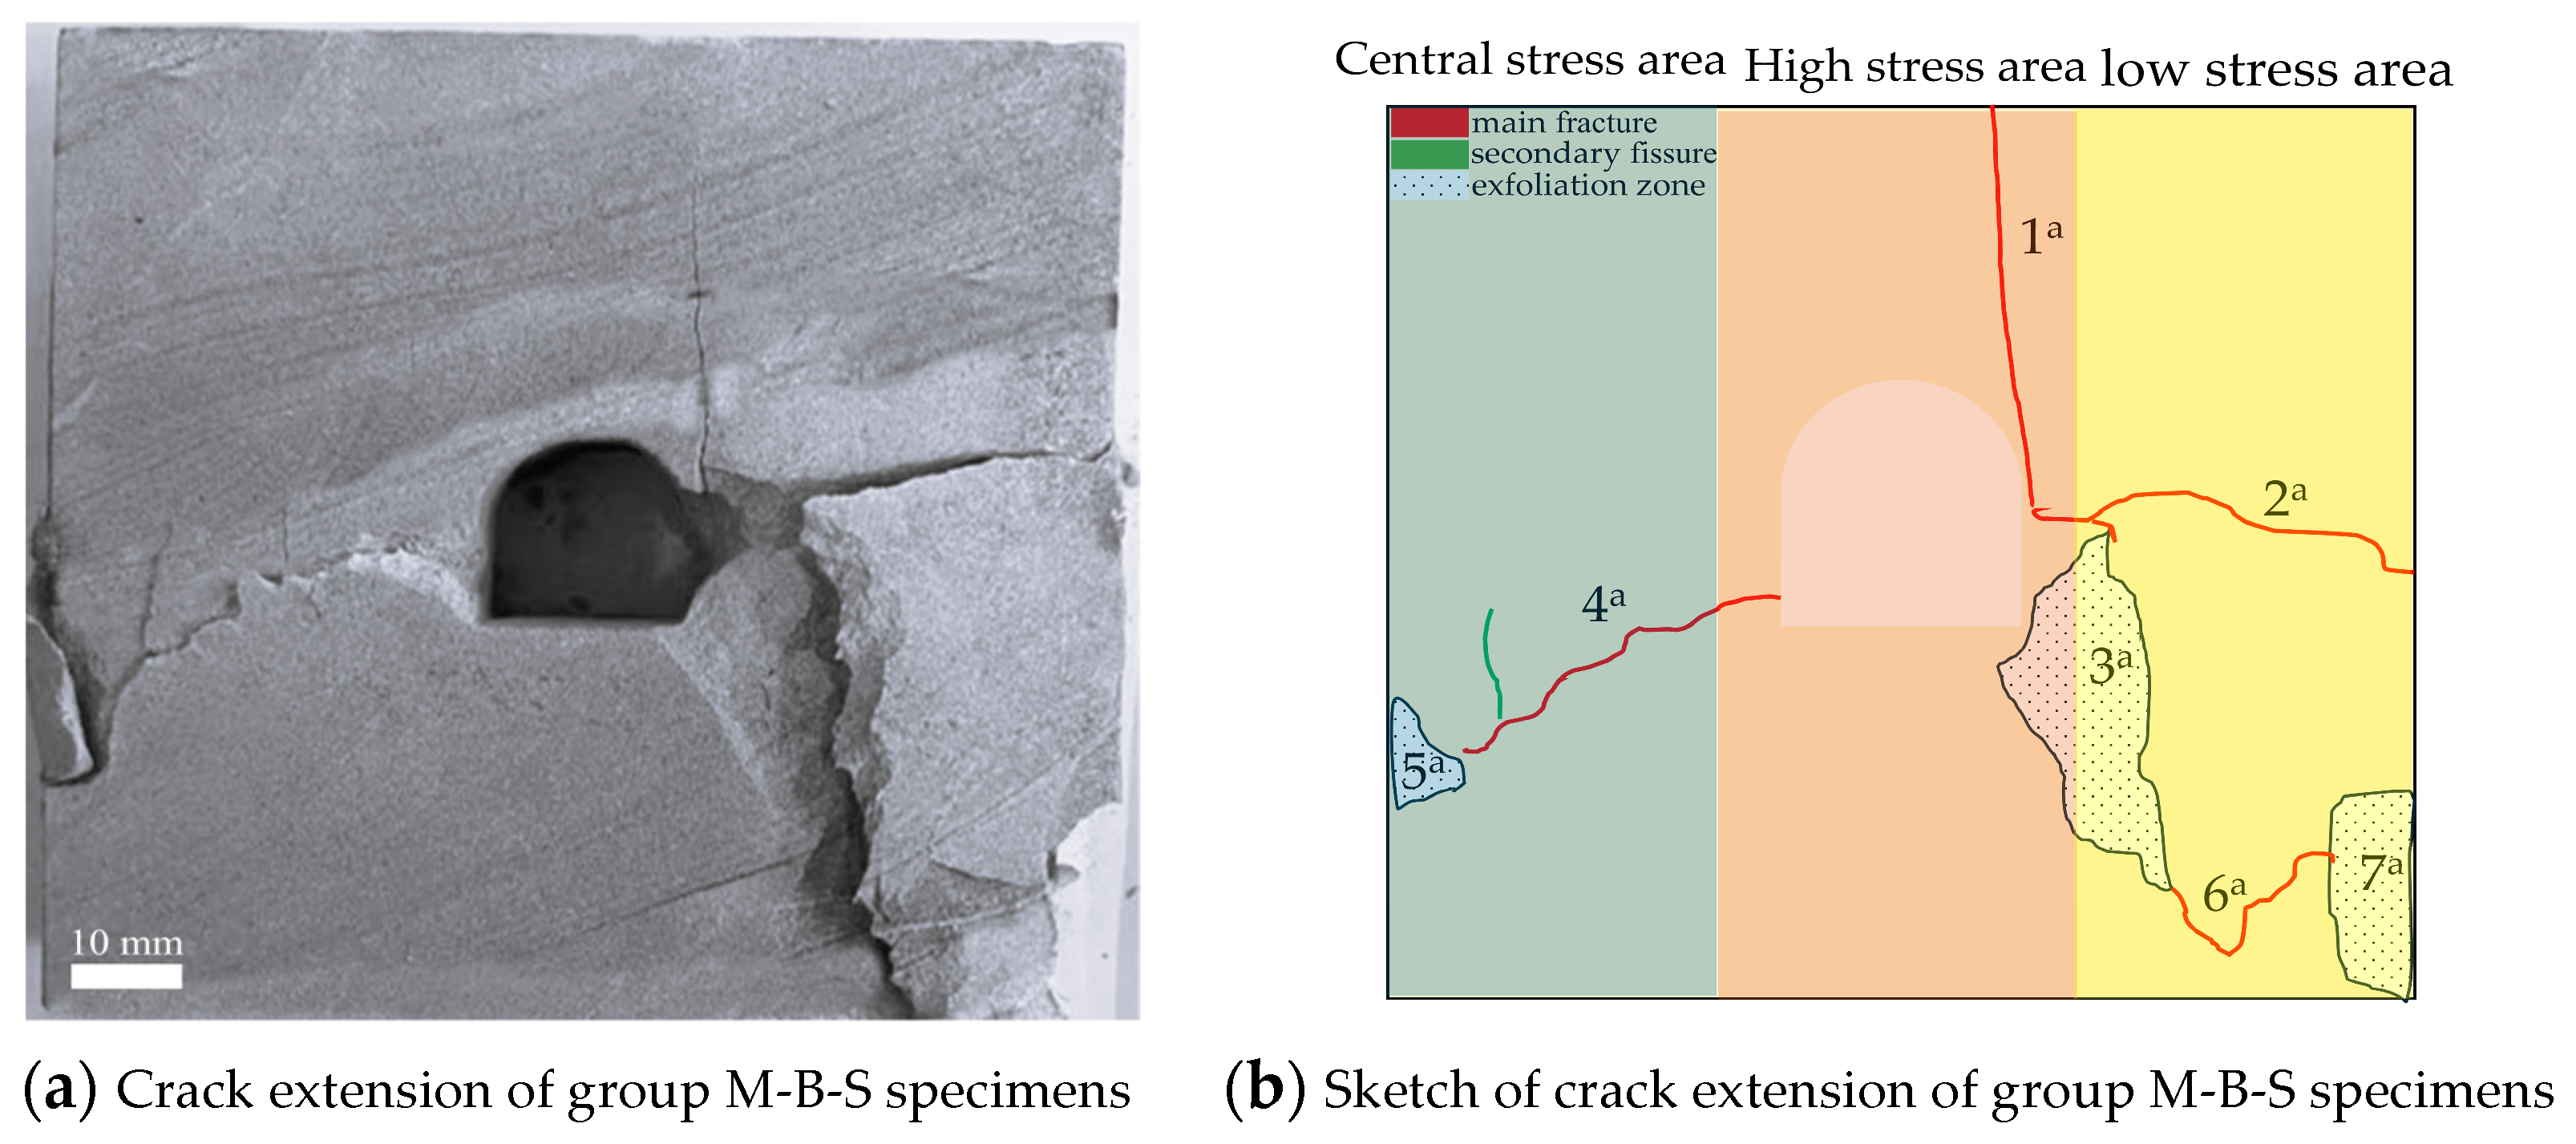
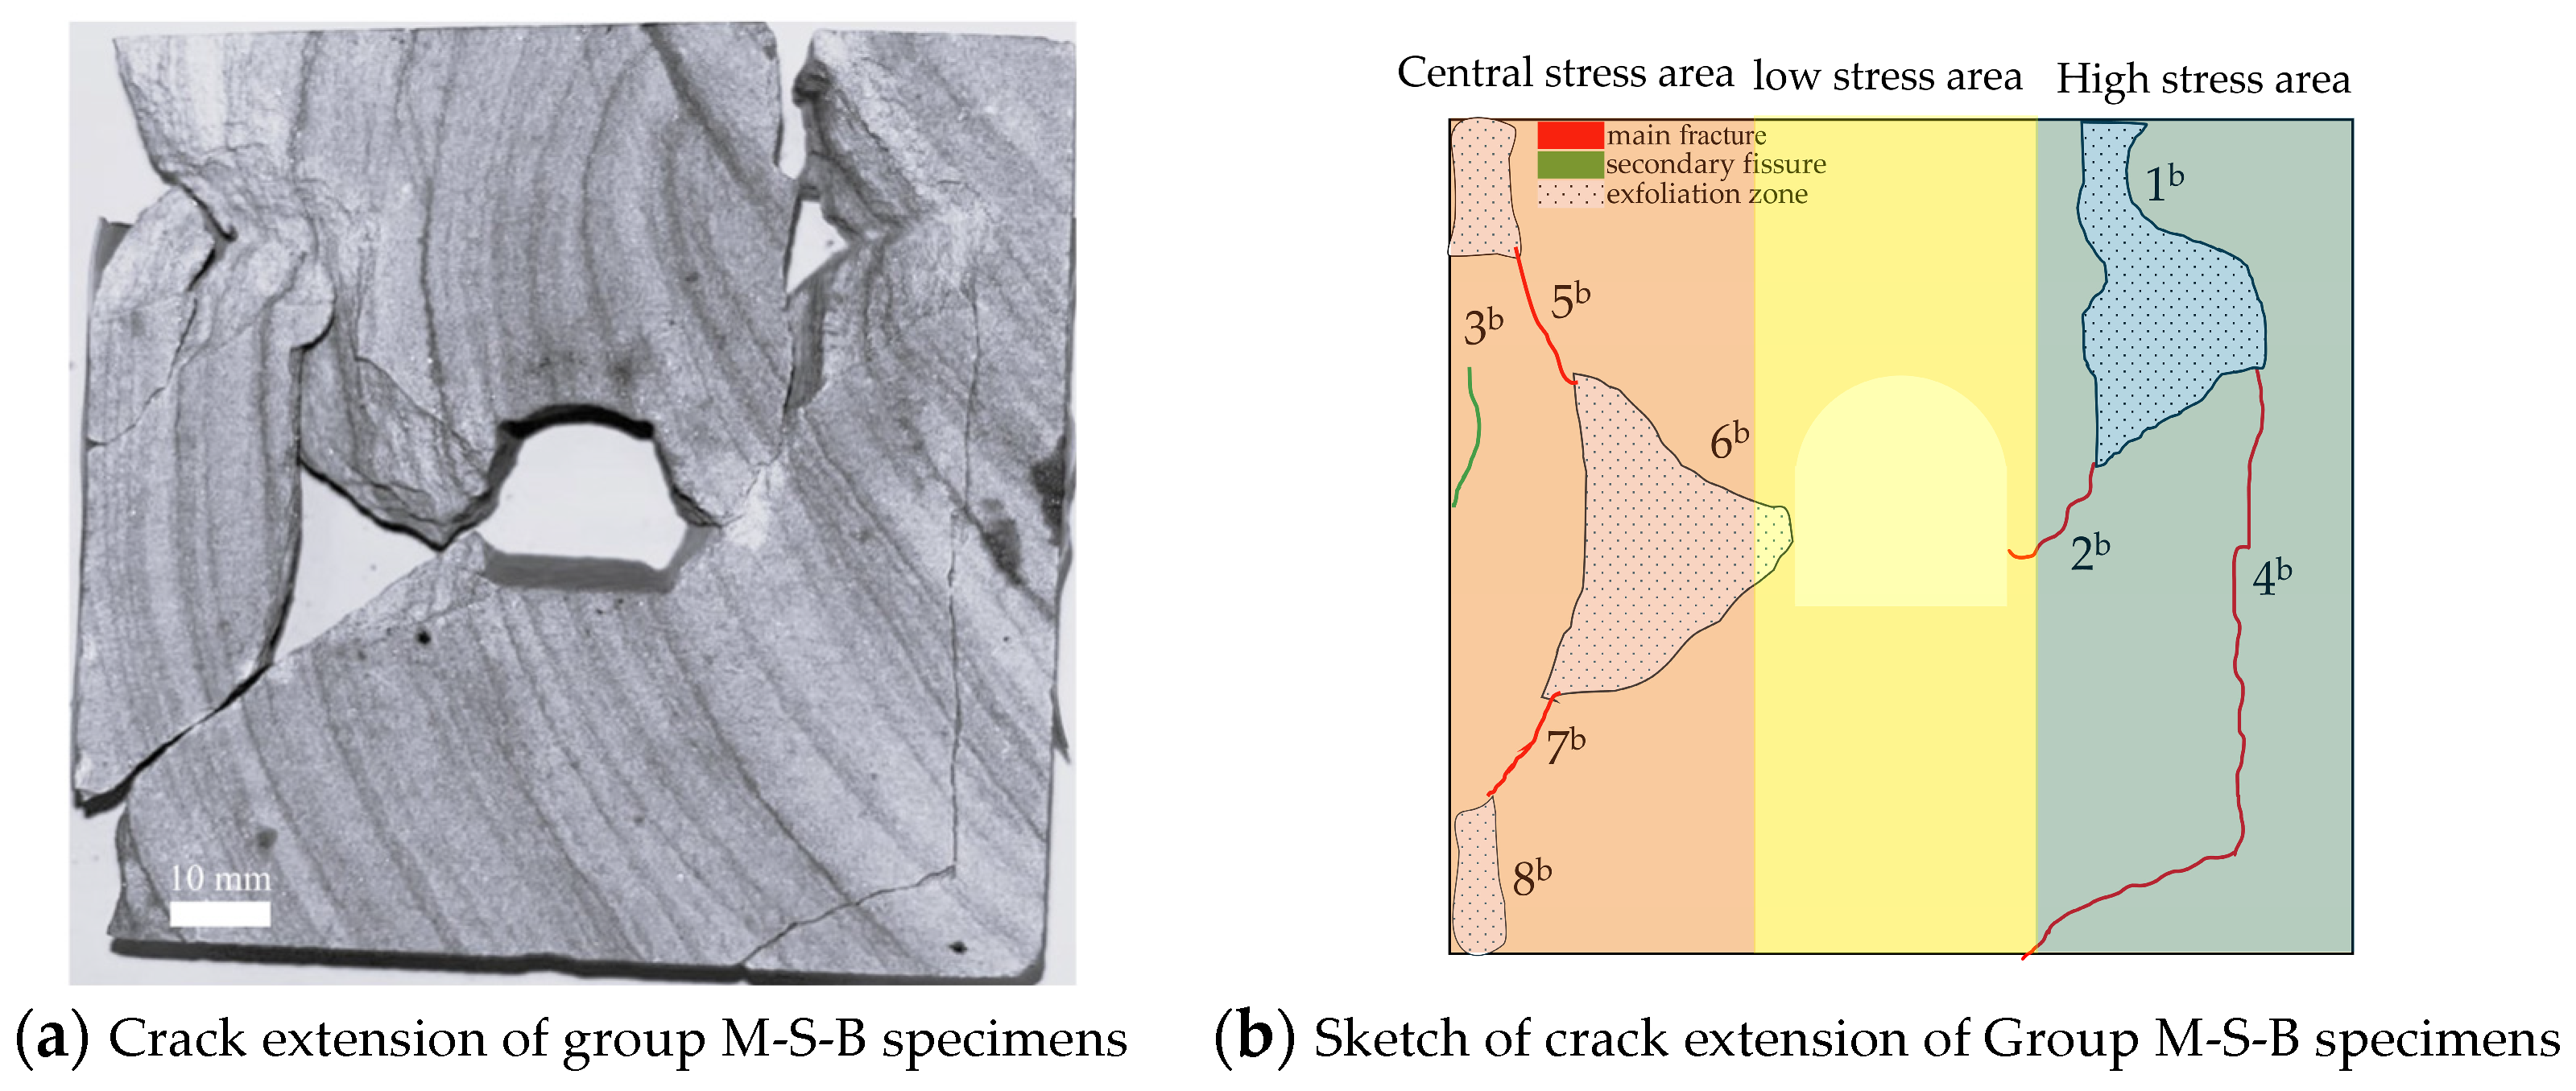
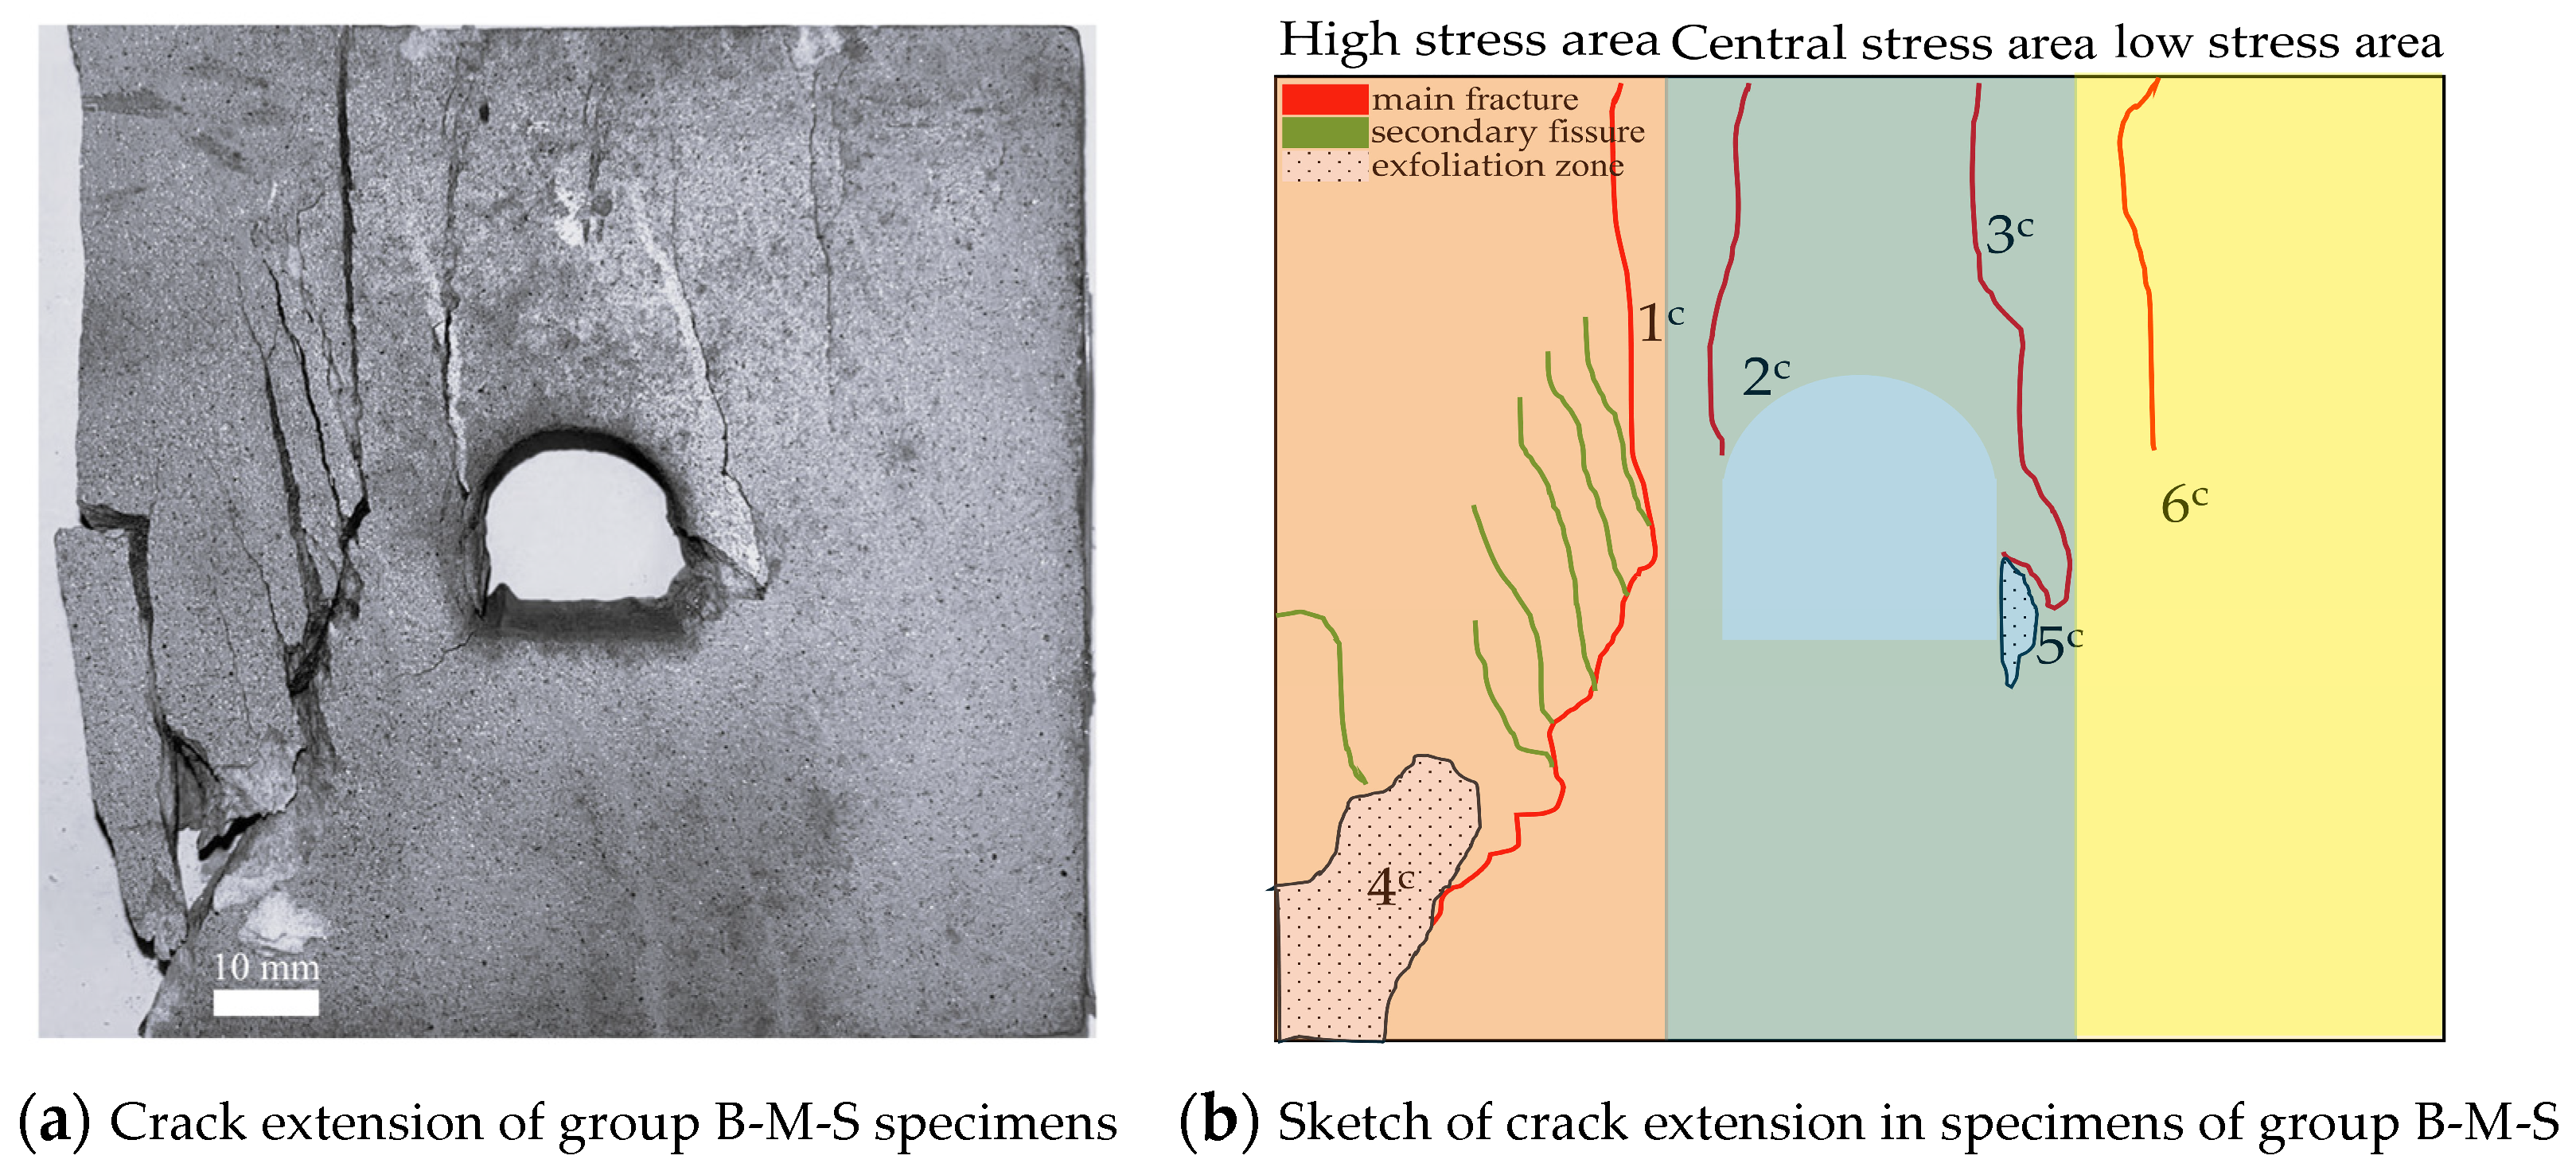
4.3. Analysis of Crack Propagation and Evolution in Saturated Sandstone with Void Defects
Fracture Characteristics of Saturated Sandstone with Void Defects
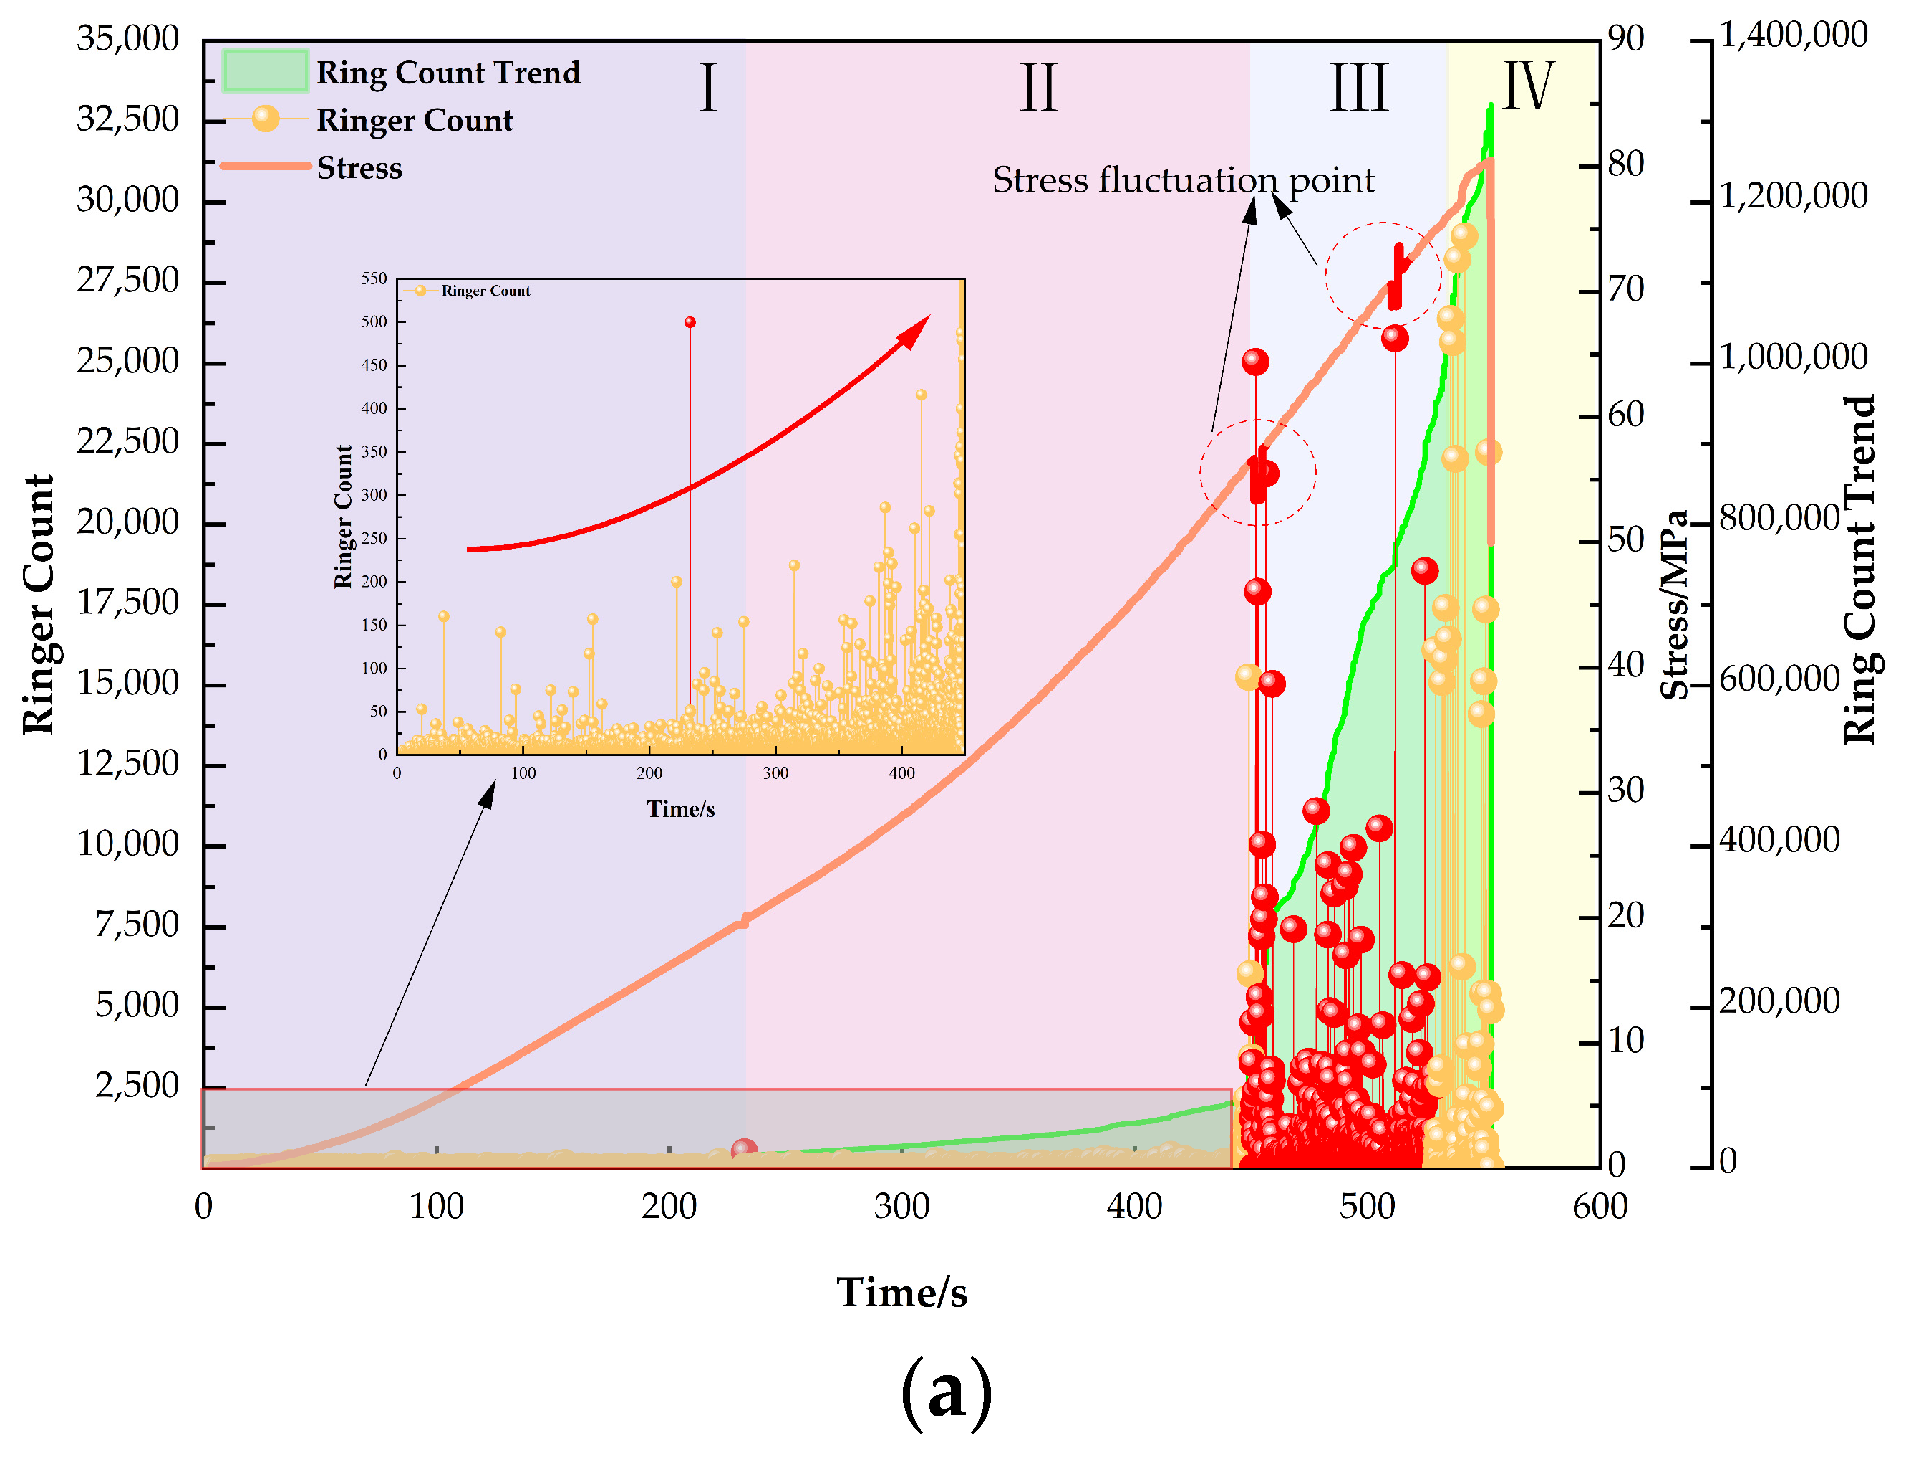
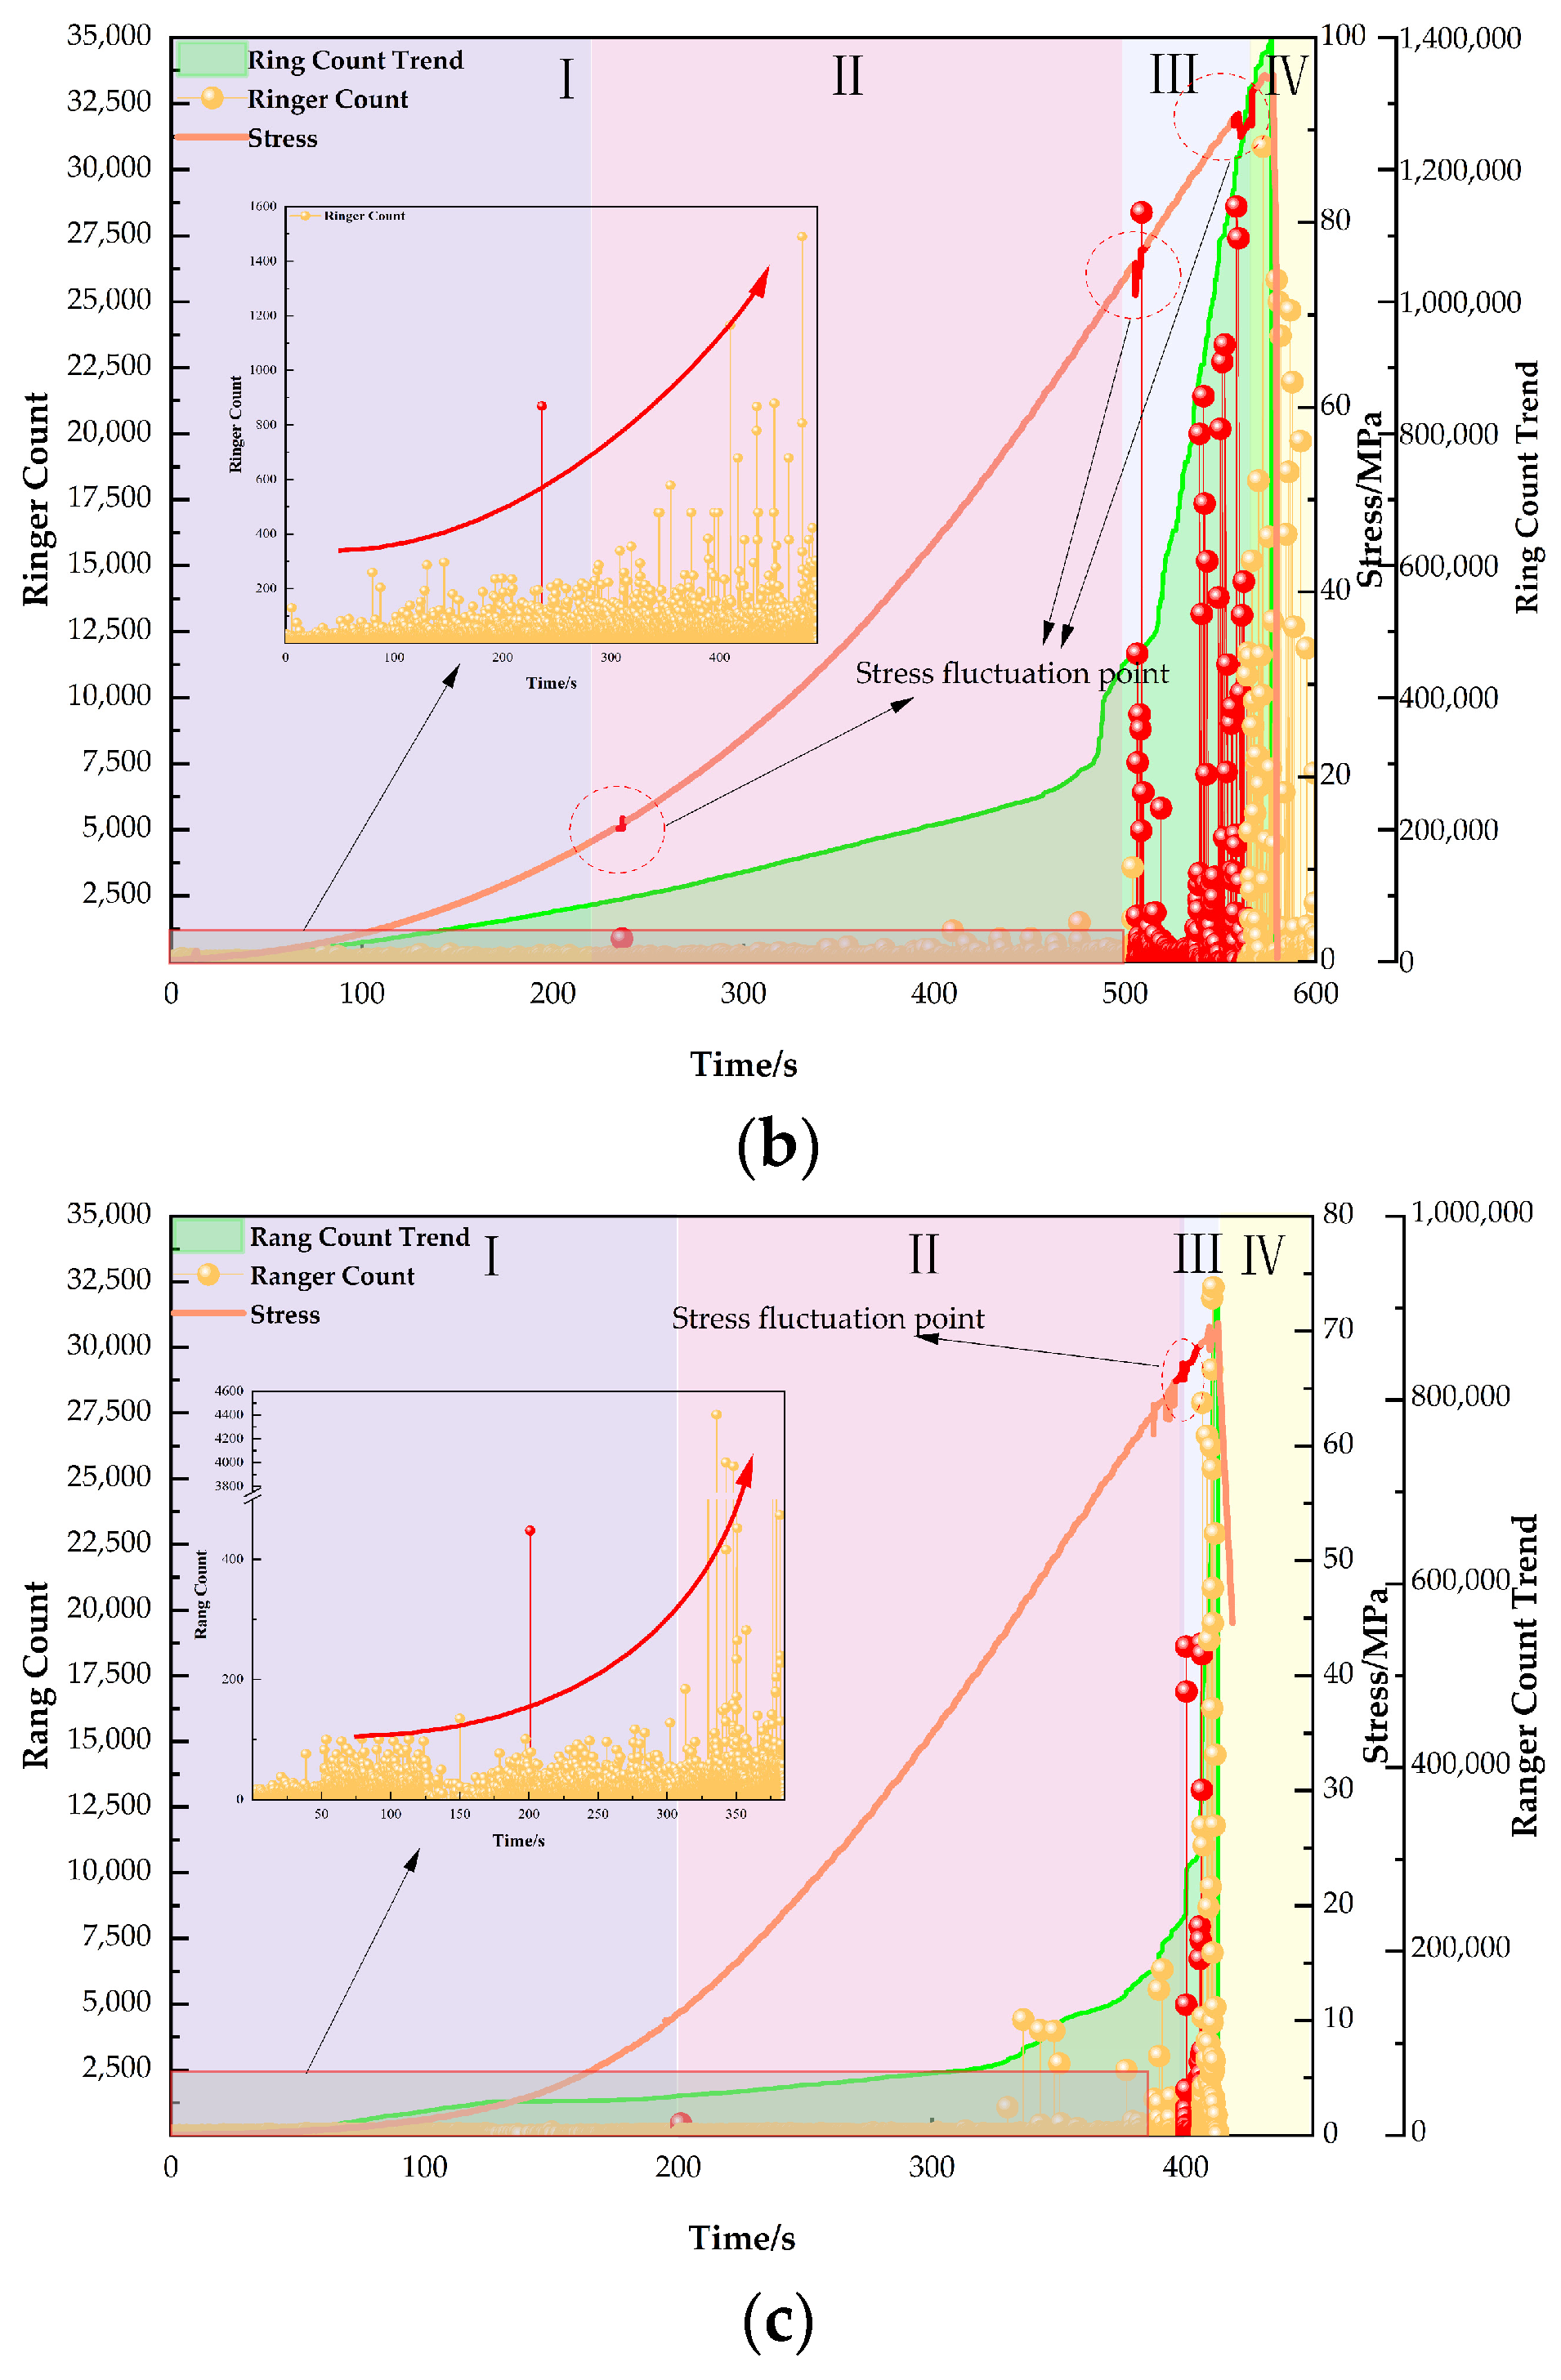
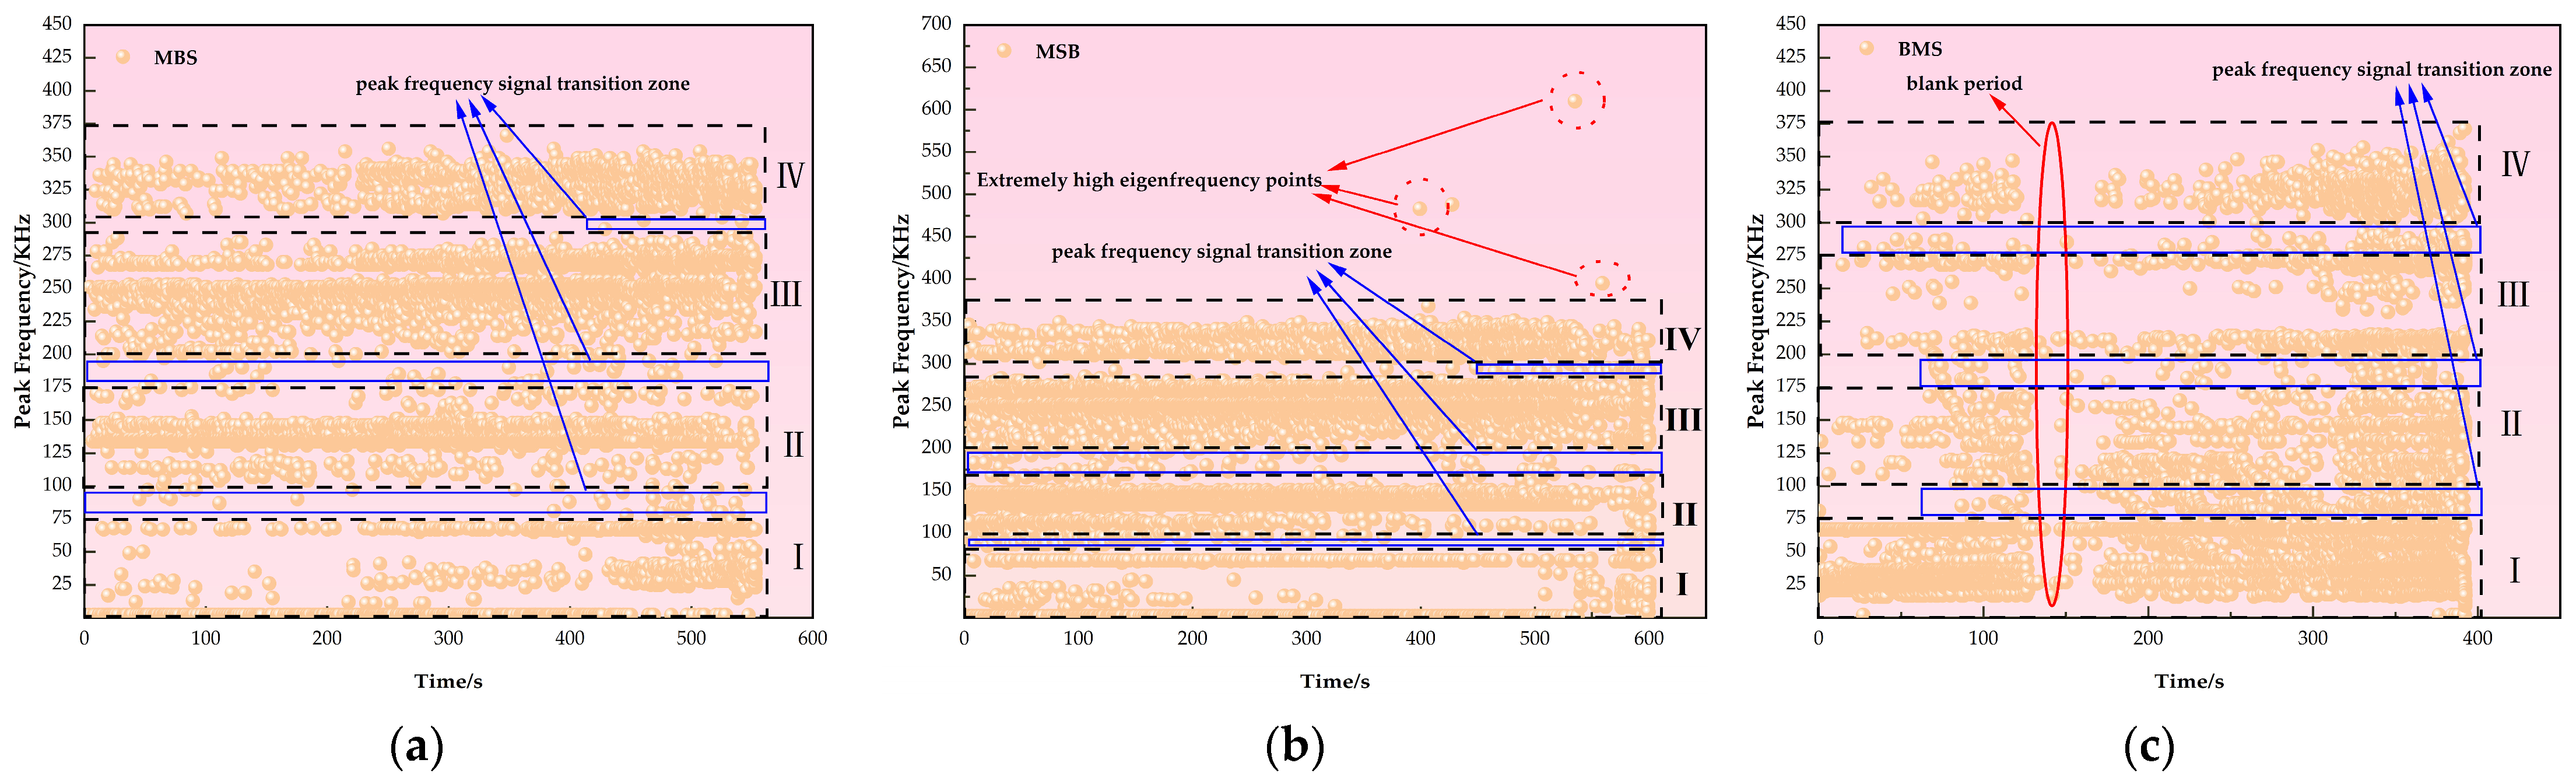
4.4. Acoustic Emission Characteristics of Saturated Sandstone with Void Defects
4.5. Numerical Simulation Results and Analysis
4.5.1. Numerical Modeling
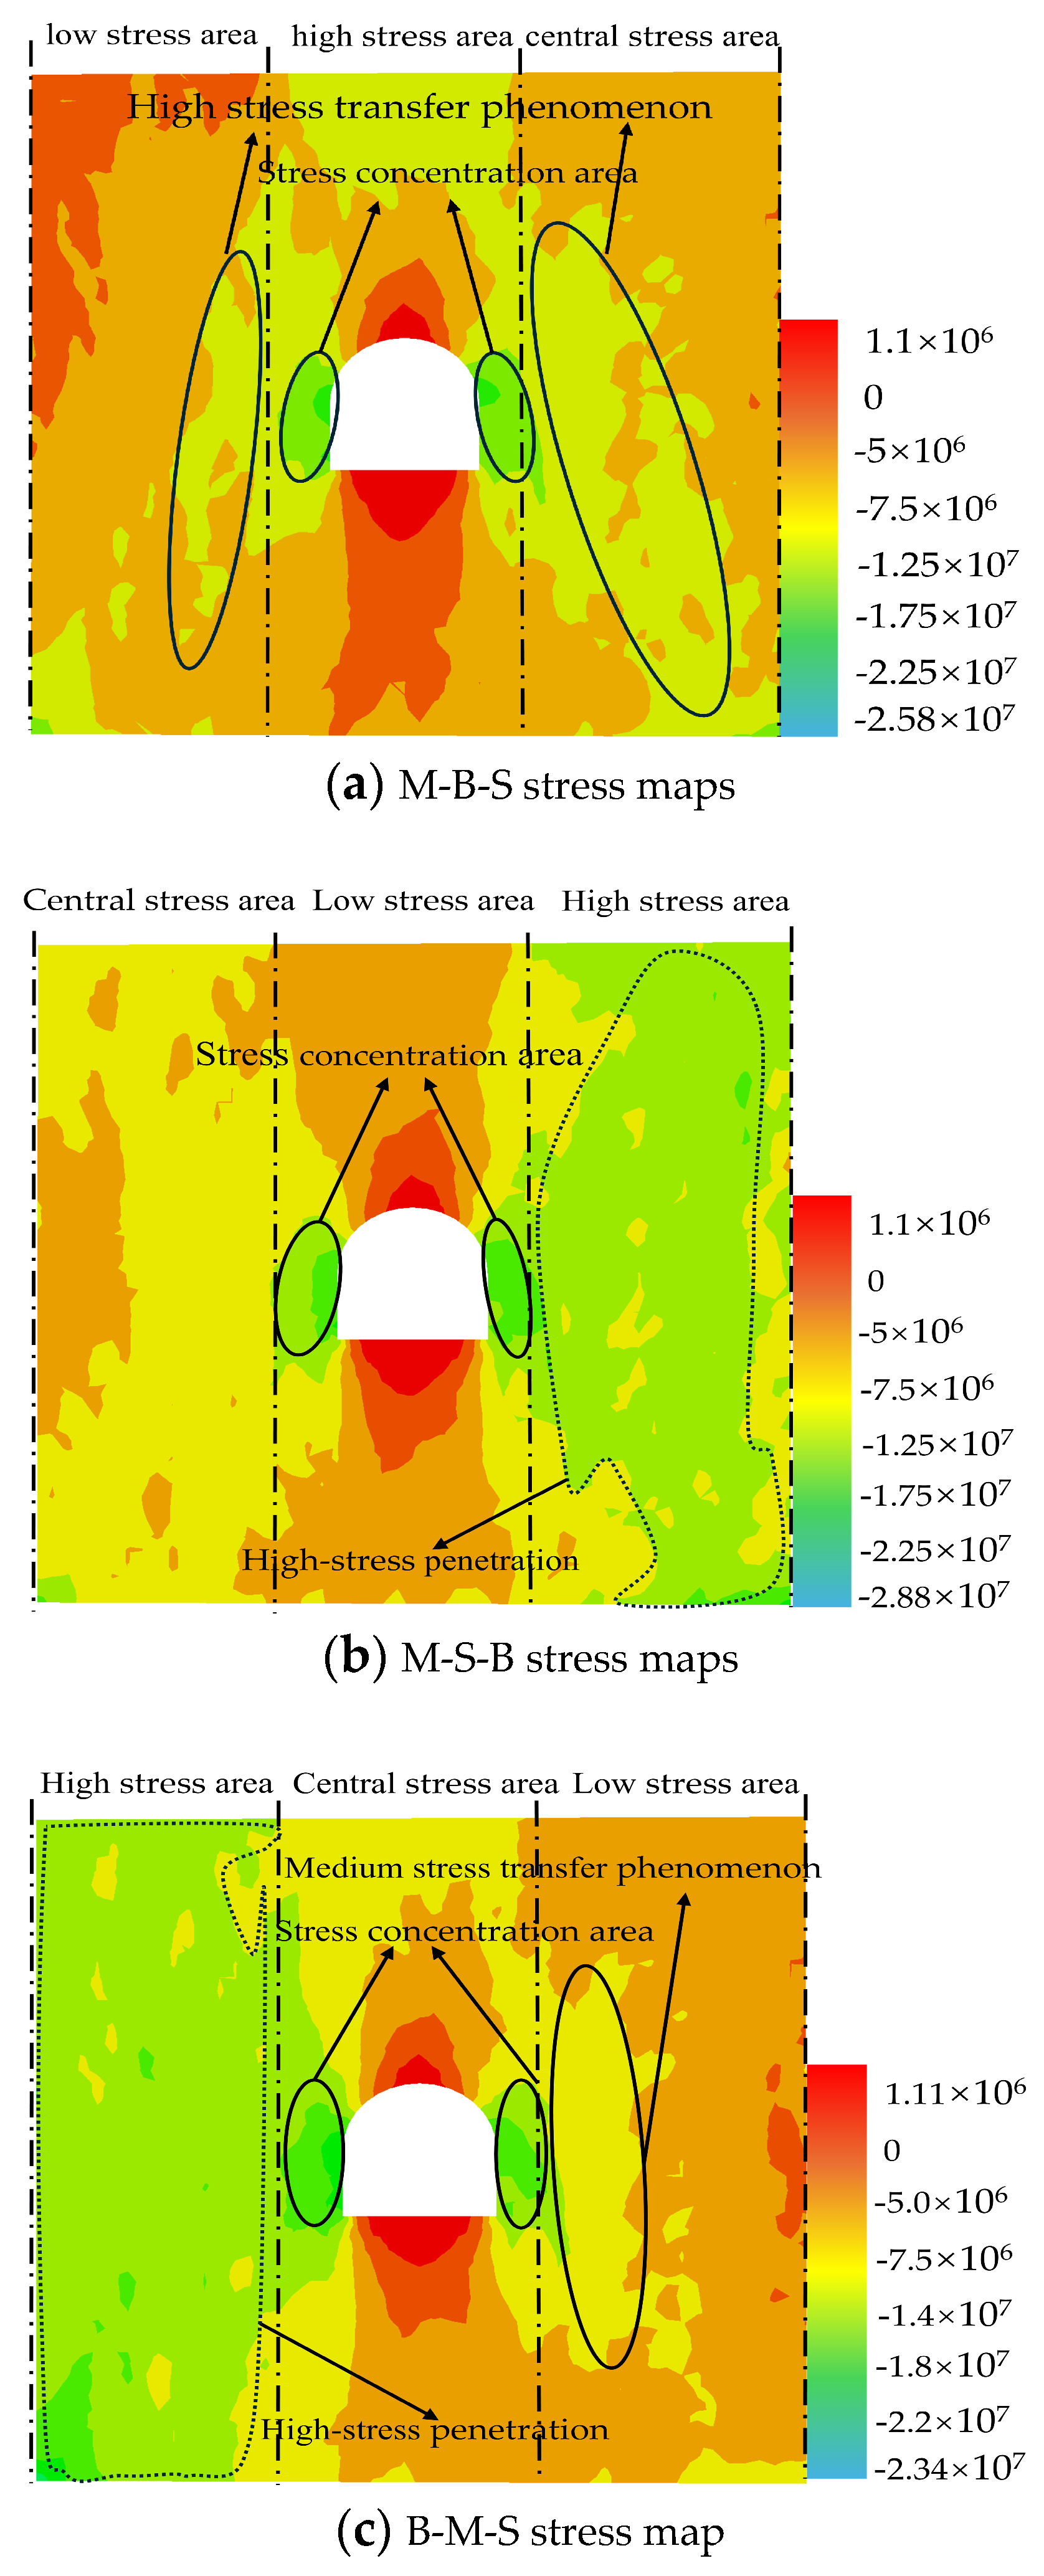
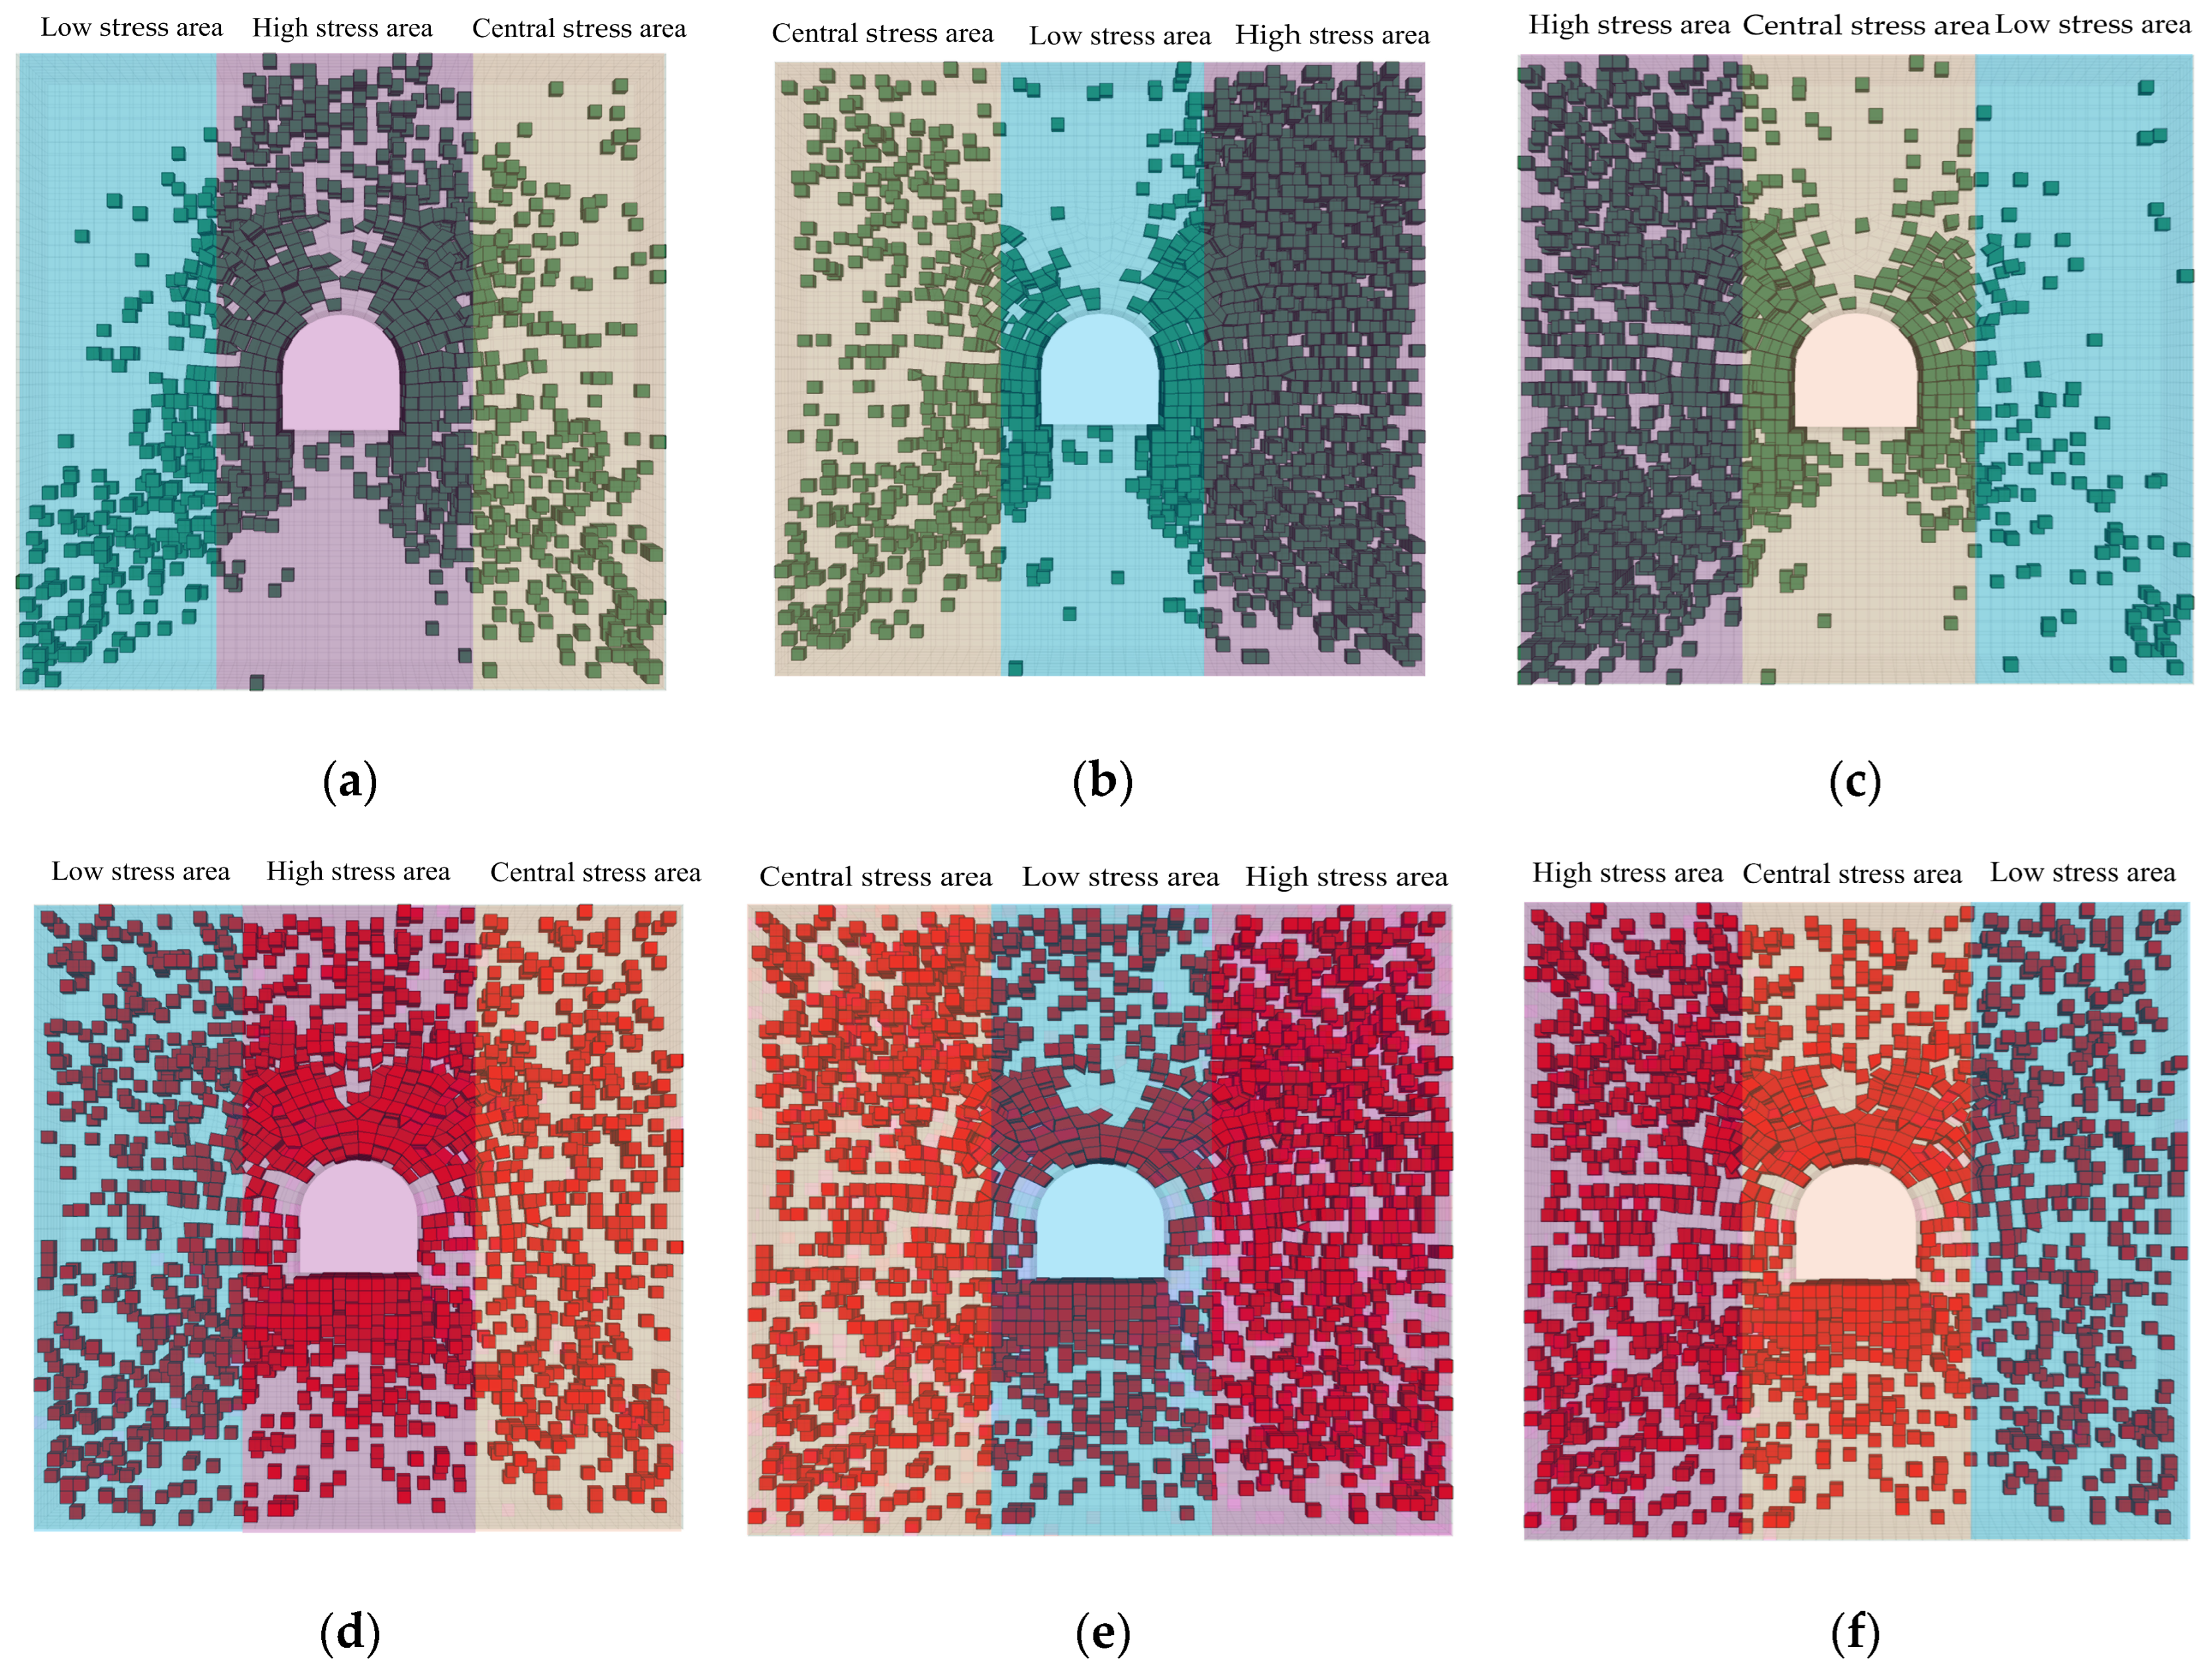
4.5.2. Distribution Law of Saturated Non-Uniform Stress Field of Defects Containing Holes
4.5.3. Stress Analysis of the Upper Part of the Specimen
5. Discussion
6. Conclusions
Author Contributions
Funding
Data Availability Statement
Acknowledgments
Conflicts of Interest
References
- Wu, J.; Yang, X.; Song, Y.; Sun, Q.; Pei, Y. Study on a new inversion method for non-uniform distribution of rock material parameters. J. Bull. Eng. Geol. Environ. 2022, 81, 280. [Google Scholar] [CrossRef]
- Liu, H.; Zhang, X.; Lin, H.; Chen, Y.; Yang, C.; Ou, K. Shear mechanical properties of rock joints under non-uniform load based on DEM. J. Appl. Sci. 2025, 15, 4257. [Google Scholar] [CrossRef]
- Wang, X.; Wen, Z.; Jiang, Y.; Huang, H. Experimental study on mechanical and acoustic emission characteristics of rock-like material under non-uniformly distributed loads. J. Rock Mech. Rock Eng. 2018, 51, 729–745. [Google Scholar] [CrossRef]
- Wang, T.; Ge, L.; Zhao, H.; Zhang, X.; Zhang, H.; Li, W. Deformation damage characteristics and constitutive model of raw coal and briquette with central hole under asymmetric loading. J. China Coal Soc. 2022, 47, 4040–4054. [Google Scholar] [CrossRef]
- Yu, W.; Pan, B.; Wu, G.; Guo, H. Experimental study on mechanical characteristics of rock of trapezoidal cross section under the equivalent non-uniform loading conditions. J. Min. Strat. Control Eng. 2024, 6, 108–117. [Google Scholar] [CrossRef]
- Zhao, H.B.; Hu, G.L.; Wang, F.H.; Ju, N.S. Quantitative analysis of crack expansion in specimens of coal having a single pre-existing hole. J. China Coal Soc. 2017, 42, 860–870. [Google Scholar] [CrossRef]
- Ge, L. Study on Mechanical Properties and Damage Mechanism of Coal and Rocks with Hole Defects Under Eccentric Load. Ph.D. Thesis, Liaoning Technical University, Fuxin, China, 2022. [Google Scholar] [CrossRef]
- Heiland, J. Laboratory testing of coupled hydro-mechanical processes during rock deformation. Hydrogeol. J. 2003, 11, 122–141. [Google Scholar] [CrossRef]
- Li, Y.; Gao, S.; Shen, S.; Zhang, Q.; Chen, W.; Hu, L. Experimental study on influence of immersion times on rock strength and failure characteristics. Chin. J. Rock Mech. Eng. 2025, 44, 1–15. [Google Scholar] [CrossRef]
- Duan, X.; Zhang, Q.; Cao, Y.; Zhao, D.; Wang, W.; Zhu, Q.; Liu, S. Study on water sensitivity effect and mechanical damage characteristics of Xiyu conglomerate under complex water environment and stress condition. Chin. J. Rock Mech. Eng. 2024, 43, 2992–3004. [Google Scholar] [CrossRef]
- Zhang, T.; Zhang, L.; Li, S.; Liu, J.; Ji, X.; Pan, H. Characteristics of wave velocity and power spectral density of hole-containing specimens under water conditions. J. China Coal Soc. 2018, 43, 3387–3394. [Google Scholar] [CrossRef]
- Zhou, Z.; Cheng, X.; Cai, X.; Zhao, Y.; Li, X.; Du, K. Mechanical and infrared radiation properties of sandstone with different water contents under uniaxial compression. J. Cent. South Univ. Sci. Technol. 2018, 49, 1189–1196. [Google Scholar]
- Thörn, J.; Ericsson, L.O.; Fransson, Å. Hydraulic and hydromechanical laboratory testing of large crystalline rock cores. J. Rock Mech. Rock Eng. 2015, 48, 61–73. [Google Scholar] [CrossRef]
- Cardona, A.; Finkbeiner, T.; Santamarina, J.C. Natural Rock Fractures: From Aperture to Fluid Flow. J. Rock Mech. Rock Eng. 2021, 54, 5827–5844. [Google Scholar] [CrossRef]
- Von Planta, C.; Vogler, D.; Chen, X.; Nestola, M.G.C.; Saar, M.O.; Krause, R. Simulation of hydro-mechanically coupled processes in rough rock fractures using an immersed boundary method and variational transfer operators. J. Comput. Geosci. 2019, 23, 1125–1140. [Google Scholar] [CrossRef]
- Hao, R.; Cao, P.; Wang, H.; Jin, J. Mechanical properties and fracture behaviors of sandstone in dry and saturated states with tip intersecting cracks. Chin. J. Rock Mech. Eng. 2024, 43, 1696–1706. [Google Scholar] [CrossRef]
- Luo, Z.S.; Zhu, Z.X.; Su, Q.; Li, J.L.; Deng, H.F.; Yang, C. Creep simulation and deterioration mechanism of sandstone under water-rock interaction based on parallel bond model. J. Rock Soil Mech. 2023, 44, 2445–2457. [Google Scholar]
- Chen, X.; Yu, F.; Tang, M.; Xiao, Y.; Zeng, P.; Zhong, Z. DEM simulation of progressive damage and permeability evolution of sandstone during direct-shearing. Chin. J. Rock Mech. Eng. 2024, 43, 3161–3174. [Google Scholar]
- Luo, K.; Zhao, G.; Zeng, J.; Zhang, X.; Pu, C.Z. Fracture experiments and numerical simulation of cracked body in rock-like materials affected by loading rate. Chin. J. Rock Mech. Eng. 2018, 37, 1833–1842. [Google Scholar]
- Tian, W.L.; Yang, S.Q.; Huang, Y.H. PFC2D simulation on crack evolution behavior of brittle sandstone containing two coplanar fissures under different confining pressures. J. Min. Saf. Eng. 2017, 34, 1207–1215. [Google Scholar] [CrossRef]
- Zhang, G.K.; Li, H.B.; Wang, M.Y.; Li, X.F. Study on characteristics of failure strength and crack propagation of granite rocks containing a single fissure. Chin. J. Rock Mech. Eng. 2019, 38, 2760–2771. [Google Scholar]
- Zhu, D.; Zong, Y.J.; Zhang, X.F.; Tao, X.L. Experimental study on influence of sandstone with dome shape defect on its mechanical characteristics. J. Saf. Sci. Technol. 2019, 15, 30–35. [Google Scholar]
- Bayat, N.; Sadeghi, E.; Nassery, H.R. Evaluating the characteristics of geological structures in karst groundwater inflow, Nowsud Tunnel. J. Mt. Sci. 2024, 21, 3434–3452. [Google Scholar] [CrossRef]
- Coli, M.; Pinzani, A. Tunnelling and hydrogeological issues: A short review of the current state of the art. J. Rock Mech. Rock Eng. 2014, 47, 839–851. [Google Scholar] [CrossRef]
- Hack, H.R.G.K. Weathering, Erosion, and Susceptibility to Weathering. In Soft Rock Mechanics and Engineering; Kanji, M., He, M., Ribeiro e Sousa, L., Eds.; Springer: Cham, Switzerland, 2020; pp. 235–254. [Google Scholar] [CrossRef]
- Xing, Y.; Kulatilake, P.H.S.W.; Sandbak, L.A. Rock mass stability investigation around tunnels in an underground mine in USA. J. Geotech. Geol. Eng. 2017, 35, 45–67. [Google Scholar] [CrossRef]
- Pettijohn, F.J.; Potter, P.E.; Siever, R. Petrography of Common Sands and Sandstones; Springer: New York, NY, USA, 1987; pp. 153–217. [Google Scholar] [CrossRef]
- Liu, G.; Wang, S.; Wang, D.; Yang, Z.; Zan, Y. Characteristics of Deformation and Damage and Acoustic Properties of Sandstone in Circular Tunnel Morphology under Varying Inundation Depths. J. Water 2024, 16, 2938. [Google Scholar] [CrossRef]
- Song, Y.J.; Cheng, K.Y.; Meng, F.D. Research on acoustic emission characteristics of fractured rock damage under freeze-thaw action. J. Min. Saf. Eng. 2023, 40, 408–419. [Google Scholar] [CrossRef]
- Zhang, X.; Zhang, S.; Wang, L.; Rong, T.; Zhou, R. Identification of pre-peak characteristic stress of sandstone under triaxial loading based on acoustic emission and wave velocity variation. Chin. J. Rock Mech. Eng. 2023, 42, 2711–2726. [Google Scholar] [CrossRef]
- Liu, S.; Gengshe, Y. Study on acoustic emission signal and damage characteristics of frozen sandstone under lateral unloading. Chin. J. Rock Mech. Eng. 2023, 42, 4237–4247. [Google Scholar]
- Garg, P.; Zafar, S.; Hedayat, A.; Moradian, O.Z.; Griffiths, D.V. A novel methodology for characterizing fracture process zone evolution in Barre granite specimens under mode I loading. Theor. Appl. Fract. Mech. 2023, 123, 103727. [Google Scholar] [CrossRef]
- Ali, M.; Wang, E.; Li, Z.; Khan, N.M.; Sabri Sabri, M.M.; Ullah, B. Investigation of the acoustic emission and fractal characteristics of coal with varying water contents during uniaxial compression failure. Sci. Rep. 2023, 13, 2238. [Google Scholar] [CrossRef]
- Mahanta, B.; Ranjith, P.G.; Vishal, V.; Singh, T.N. Temperature-induced deformational responses and microstructural alteration of sandstone. J. Pet. Sci. Eng. 2020, 192, 107239. [Google Scholar] [CrossRef]
- Shang, Z.; Guo, L.; Zhu, Q. Statistical Laws for Stress and Strain Under Uniaxial Compression Test Based on FLAC3D. J. Hunan Univ. Sci. Technol. (Nat. Sci. Ed.) 2020, 35, 18–26. [Google Scholar] [CrossRef]
- Li, Y.; Liu, J.; Tang, X.; Yang, S. Simulation analysis of mechanical properties of the soft rock mass with holes and fractures. J. Min. Saf. Eng. 2020, 37, 594–603. [Google Scholar] [CrossRef]
- Li, G.; Ma, F.; Liu, G.; Zhao, H.; Guo, A. Strain-Softening Constitutive Model of Heterogeneous Rock Mass Considering Statistical Damage and Its Application in Numerical Modeling of Deep Roadways. Sustainability 2019, 11, 2399. [Google Scholar] [CrossRef]
- Li, X.; Li, H.; Yang, Z.; Wang, X.; He, W. Numerical simulation case study by using FLAC3D of the composite coal-rock on the load-free fracture. J. Saf. Environ. 2020, 20, 2187–2195. [Google Scholar]

| Serial Number | Specimen Type | Density (kg/m³) | Elastic Modulus (GPa) | Poisson’s Ratio (ν) | State of Affairs | Metal Gasket Arrangement Order | Specimen Height × Length × Width/mm |
|---|---|---|---|---|---|---|---|
| M-B-S | Water-saturated sandstone specimens with pore defects | Saturated with water | |||||
| M-B-S-1 | 2620 | 11.0 | 0.27 | 100.14 × 100.24 × 20.11 | |||
| M-B-S-2 | 2630 | 11.2 | 0.26 | 100.02 × 100.12 × 20.05 | |||
| M-B-S-3 | 2620 | 11.1 | 0.27 | SY-2, SY-3, SY-1 | 100.07 × 100.13 × 20.01 | ||
| M-B-S-4 | 2630 | 11.3 | 0.26 | 100.12 × 100.04 × 20.03 | |||
| M-B-S-5 | 2620 | 10.9 | 0.27 | 100.06 × 100.07 × 20.06 | |||
| M-S-B | |||||||
| M-S-B-1 | 2630 | 11.2 | 0.26 | 100.09 × 100.13 × 20.12 | |||
| M-S-B-2 | 2620 | 11.0 | 0.28 | 100.04 × 100.02 × 20.14 | |||
| M-S-B-3 | 2630 | 11.3 | 0.27 | SY-2, SY-1, SY-3 | 100.05 × 100.02 × 20.10 | ||
| M-S-B-4 | 2630 | 11.1 | 0.27 | 100.07 × 100.02 × 20.10 | |||
| M-S-B-5 | 2610 | 11.2 | 0.26 | 100.05 × 100.02 × 20.10 | |||
| B-M-S | |||||||
| B-M-S-1 | 2620 | 11.1 | 0.28 | 100.03 × 100.16 × 20.13 | |||
| B-M-S-2 | 2630 | 11.2 | 0.27 | 100.13 × 100.18 × 20.06 | |||
| B-M-S-3 | 2610 | 11.0 | 0.27 | SY-3, SY-2, SY-1 | 100.06 × 100.13 × 20.10 | ||
| B-M-S-4 | 2610 | 11.3 | 0.26 | 100.05 × 100.03 × 20.05 | |||
| B-M-S-5 | 2620 | 11.1 | 0.28 | 100.02 × 100.06 × 20.02 |
| Designation | Bulk Modulus/Pa | Shear Modulus/Pa | Densities kg/m3 | Cohesion/Pa | Angle of Internal Friction/° | Tensile Strength/Pa |
|---|---|---|---|---|---|---|
| sandstone | 12 × 109 | 6 × 10⁹ | 2600 | 4 × 10⁶ | 35 | 2 × 10⁶ |
Disclaimer/Publisher’s Note: The statements, opinions and data contained in all publications are solely those of the individual author(s) and contributor(s) and not of MDPI and/or the editor(s). MDPI and/or the editor(s) disclaim responsibility for any injury to people or property resulting from any ideas, methods, instructions or products referred to in the content. |
© 2025 by the authors. Licensee MDPI, Basel, Switzerland. This article is an open access article distributed under the terms and conditions of the Creative Commons Attribution (CC BY) license (https://creativecommons.org/licenses/by/4.0/).
Share and Cite
Liu, G.; Zan, Y.; Wang, D.; Wang, S.; Yang, Z.; Zeng, Y.; Wei, G.; Shi, X. Numerical Simulation of Fracture Failure Propagation in Water-Saturated Sandstone with Pore Defects Under Non-Uniform Loading Effects. Water 2025, 17, 1725. https://doi.org/10.3390/w17121725
Liu G, Zan Y, Wang D, Wang S, Yang Z, Zeng Y, Wei G, Shi X. Numerical Simulation of Fracture Failure Propagation in Water-Saturated Sandstone with Pore Defects Under Non-Uniform Loading Effects. Water. 2025; 17(12):1725. https://doi.org/10.3390/w17121725
Chicago/Turabian StyleLiu, Gang, Yonglong Zan, Dongwei Wang, Shengxuan Wang, Zhitao Yang, Yao Zeng, Guoqing Wei, and Xiang Shi. 2025. "Numerical Simulation of Fracture Failure Propagation in Water-Saturated Sandstone with Pore Defects Under Non-Uniform Loading Effects" Water 17, no. 12: 1725. https://doi.org/10.3390/w17121725
APA StyleLiu, G., Zan, Y., Wang, D., Wang, S., Yang, Z., Zeng, Y., Wei, G., & Shi, X. (2025). Numerical Simulation of Fracture Failure Propagation in Water-Saturated Sandstone with Pore Defects Under Non-Uniform Loading Effects. Water, 17(12), 1725. https://doi.org/10.3390/w17121725