Article

Dynamics of Nitrogen and Phosphorus Release from Submerged Soil–Plant Systems in the Three Gorges Reservoir

by
Lei Hu
1,2,
Liwei Xiao
3 and
Tao Wang
1,*
1
Institute of Mountain Hazards and Environment, Chinese Academy of Sciences, Chengdu 610041, China
2
University of Chinese Academy of Sciences, Beijing 100049, China
3
College of Ecological Environment, Chengdu University of Technology, Chengdu 610059, China
*
Author to whom correspondence should be addressed.
Water 2025, 17(11), 1701; https://doi.org/10.3390/w17111701
Submission received: 24 April 2025 / Revised: 22 May 2025 / Accepted: 26 May 2025 / Published: 4 June 2025
(This article belongs to the Special Issue Advanced Research in Non-Point Source Pollution of Watersheds)

Abstract

:
The water-level fluctuation zone (WLFZ) in the Three Gorges Reservoir (TGR) has attracted significant attention because of its pivotal role in shaping environmental processes. However, with the increasing water level, the effects of nitrogen and phosphorus release from submerged soil–plant systems in the WLFZ on the deterioration in water quality remain poorly understood. In this study, a simulation experiment was conducted involving submerged undisturbed soil columns that was submerged once a year at different elevations (150, 160, and 170 m) before reservoir impoundment in the WLFZ within the TGR area. The results revealed that the concentrations of various forms of nitrogen and phosphorus in the overlying water released after system submergence first decreased, then rapidly increased after 30 days, and reached equilibrium after 120 days of flooding. Particulate N accounted for approximately 70% of the total nitrogen (TN) released, while particulate P accounted for more than 90% of the total phosphorus (TP) released by soil–plant systems after submergence for 200 days, which may be related to soil erosion and plant decomposition. The amounts of N and P released were significantly negatively correlated with the initial mass of the soil–plant system, indicating that nutrient release by the system is more susceptible to submerged soil than to submerged plants. During the flooding period of the WLFZ in the TGR, the release loads of soil–plant systems into reservoir water were 159.83 kg N ha−1 and 19.30 kg P ha−1. These results suggest that soil and plants in the WLFZ of the TGR could be at risk for water-induced deterioration. Therefore, additional vegetation management might be implemented to alleviate water eutrophication in the TGR caused by submerged soil and plants in the WLFZ.

Graphical Abstract

1. Introduction

Excessive inputs of N and P from plant decomposition and sediment have caused severe water deterioration issues in shallow lakes and reservoirs [1,2,3,4]. Like natural areas in land–lake ecotones, the WLFZ comprises transitional zones in which the exchange of substances and energy between water, plants and land systems is highly active [5,6,7,8]. The release of nutrients from soil in the WLFZ during the flooding period is driven mainly by water erosion [9] and variations in the redox potential [10] under flooding conditions. At the interface between terrestrial and aquatic environments, soil nutrients are affected by fluctuations in the water level [11,12], and mineral particles in the soil can enter the overlying water [13,14]. In the absence of oxygen in the soil under flooding conditions, anaerobic desorption facilitates nutrient release from the soil [3,15]. Soil degradation in a water-saturated environment could increase the amount of nutrients released by rewetting soil [16,17]. When soil exhibits a reducing state, ferric iron attached to soil particles changes into ferrous iron, resulting in an increase in phosphorus release [18]. Environmental factors, such as pH, dissolved oxygen (DO), and temperature, can notably affect soil nutrient loss [19,20,21].
The Three Gorges Reservoir (TGR), which is an artificial lake formed by water storage after the construction of the world’s largest hydroelectric dam project, namely, the Three Gorges Dam, on the Yangtze River, exhibits an area of 58,000 km2 and encompasses a vast water-level fluctuation zone (WLFZ) of 349 km2 [22,23]. Notably, water storage in the TGR begins in late September every year and is completed in April of the next year, with the water level gradually increasing from 145 to 175 m and then decreasing. During the flooding period, which lasts for more than six months on average every year, many live plants and soils in the WLFZ are submerged in water for a long period. Increasing attention has been given to variations in the water environment [24,25], soil erosion [23,26], and greenhouse gas concentrations [27,28] in the WLFZ of the TGR after dam completion [22,29], but limited research has addressed the potential water pollution in the TGR, which may be induced by submergence of the WLFZ. Therefore, determining the ecological and environmental impacts of soil and plant submergence in the WLFZ of the TGR is important.
The flooding period in the TGR began in September, when the plants were thriving [29]. As the water level increased in the TGR, the plants were submerged. Moreover, plants undergo 2 decomposition stages to release nutrients [24,30]. Leaching and microbial ammonization, nitrification and denitrification during the flooding period control the release of nitrogen from submerged plants in the WLFZ [31,32], while biodegradation significantly affects the amount of phosphorus released [33]. Owing to plant properties such as the content of lignin cellulose, the nitrogen-to-phosphorus ratio restricts nutrient release, especially P loss, as shown in different plant species [2,34]. Moreover, unlike plant litter, plants in the WLFZ can take up released nutrients in water stemming from the decomposition process and achieve regrowth [35].
During the flooding period of the WLFZ, variations in the redox potential at the interface between the soil and plant roots result in changes in the soil microenvironment around plant roots [36,37]. The plant root system plays a vital role in modulating the exchange of nutrients between the soil and plants. Under reducing conditions, the levels of N and P availability for roots decrease [38]. The influences of plant roots and microbial communities in the rhizosphere on nutrient release can differ across plant species [39,40]. For certain plant species, such as C. dactylon, the aboveground parts decompose under long-term submersion, but the roots may survive and absorb nutrients from the soil and water [39]. However, other plants, such as X. sibiricum and B. pilosa, regenerate not through roots but through seeds after prolonged flooding [41]. The presence of plant roots in the soil–plant system and the germination capacity of seeds are closely connected to plant regrowth during the flooding period [42]. Nutrients in water and soil are reabsorbed by plant roots and seeds; moreover, nutrients in submerged plants and soil are released into the overlying water [35]. This could cause a nutrient circulation process among the soil, plants and water. Therefore, it is critically important to consider the soil and plants in the WLFZ as a whole to better understand the effects of this zone on water quality. However, this aspect has not been resolved in previous studies.
This study was designed to evaluate the efficiency and pollution load of water nutrients released by soil–plant systems in the WLFZ. The physicochemical properties of soil and plant communities vary according to elevation, water level, slope and agricultural activities [11,43]. A comprehensive survey of plant species in the WLFZ was conducted in advance [24,41] and revealed that C. dactylon is the dominant plant species at elevations ranging from 145–155 m in the WLFZ. C. dactylon and X. sibiricum are the dominant species at elevations ranging from 155–165 m, and C. dactylon and B. pilosa are the dominant species at elevations ranging from 165–175 m. Thus, soil–plant systems with various dominant plant species under typical soil types were chosen in this study to achieve the following main objectives: (1) to determine the variation in water quality in the TGR influenced by soil–plant system submergence and (2) to estimate the N and P loadings released by soil–plant systems in the WLFZ within the TGR during flooding periods. These results are beneficial for assessing the potential impact of the WLFZ on water quality deterioration during the flooding period in the TGR.

2. Materials and Methods

2.1. Site Description

The experiment was performed at the Yanting Agro-Ecological Station of Purple Soil in the middle of the Sichuan Basin, southwestern China (105°28′ E, 31°16′ N). The average annual temperature is 17.3 °C, and the annual rainfall amount is 825.8 mm. The climate is a moderate subtropical monsoon climate, which is consistent with that in the TGR area. The size of the TGR area is 58,000 km2, extending from 105°44′ E to 111°39′ E and 28°32′ N to 31°44′ N. The WFLZ in the TGR includes 21 counties with a total area of 349 km2. The main land use types are rice fields, dry land, woodlands, grasslands, and flooded land. The slope of the WLFZ is steep and greater than 15°. According to the hydrological regime, the 140–150 m zone remains submerged for over 8 months, whereas the 170–175 m zone exhibits no more than 4 months of submergence. After several years of flow regulation, the plant species in the WLFZ are dominated by herbaceous plants.

2.2. Experimental Soil–Plant System

On the basis of a field investigation of the WLFZ in the TGR, we selected Pinshan Bridge in Zhongxian County (108°06′47.65″ E, 30°23′53.62″ N) as a typical WLFZ to collect soil–plant system samples (including in situ undisturbed soil samples and samples of the overlying plants and roots). Twelve representative samples were obtained from similar plant-covered soil–plant systems at three elevations, namely, 150, 160 and 170 m (referred to as the 150 m, 160 m, and 170 m systems, respectively, in the following sections). The soil column of each soil–plant system exhibited a diameter of 20 cm and a height of 30 cm, with different plant species at each elevation. In the 150 m system, the dominant plant species is C. dactylon (coverage: 100%); in the 160 m system, the dominant plant species are C. dactylon and X. sibiricum (coverage: 80% and 20%, respectively); and in the 170 m system, the dominant plant species are C. dactylon and B. pilosa (coverage: 70% and 30%, respectively).
C. dactylon, a perennial herbaceous plant, belongs to the Gramineae family. It is highly aggressive and resistant to extreme environments. X. sibiricum, an annual herbaceous plant, belongs to the Xanthium genus of the Compositae family and prefers a warm, slightly humid climate. B. pilosa, an annual herbaceous plant, belongs to the Compositae Bidens and develops flourishing roots.

2.3. Experimental Setup and Sampling

The experimental apparatus was an uncovered plexiglass cylinder with a diameter of 50 cm and a height of 150 cm. Each soil–plant system sample was placed at the center of the bottom of the cylinder (Figure 1). The experiment began on 20 September 2023 and ended on 7 April 2024. The water temperatures ranged from 4 °C to 22 °C. The overlying water was maintained at a level of 120 cm until the conclusion of the experiment. The water used in the experiment was pond water with a specific nutrient concentration to simulate the water in the TGR. Every 30 days, we changed the overlying water according to the water change frequency in the TGR.
At 1, 3, 5, 10, 15, 20, 30, 45, 60, 90, 120, 150, and 200 days into the experiment, water samples were collected from three outlet positions (Figure 1) and promptly preserved in a refrigerator at 4 °C for subsequent analysis. In the meanwhile, the soil samples and related plant samples (location near site of soil–plant system sample) collected from three randomly located 1 m × 1 m sampling quadrats were transported back to the laboratory to illustrate the effect of soil and plant on the water quality respectively after soaking in the soil–plant system.

2.4. Analysis Methods

The initial mass of each soil–plant system sample was determined using a calibrated electronic bench-scale balance (capacity: 30 kg, accuracy ±10 g). The water samples were immediately filtered through 0.45-µm membranes, stored at 4 °C and analyzed within 48 h. The concentrations of total nitrogen (TN), total dissolved nitrogen (TDN), NH4+-N (AN), NO3-N (NN), total phosphorus (TP), total dissolved phosphorus (TDP) and PO43−-P (OPP) in water were measured by an AutoAnalyzer 3 (AA3, Bran + Lubbe, Norderstedt, Germany). Particulate N (PN) was calculated as the difference between TN and TDN, and particulate P (PP) was calculated as the difference between TP and TDP.
The total nitrogen and phosphorus contents in the soil and plants before and after soaking were analyzed according to standard methods [44]. After drying and grinding, concentrated sulfuric acid and a catalyst (K2SO4) were added to digest the samples for approximately 30 min under heating. Then, the samples were titrated with 0.05 mol·L−1 HCl after Kjeldahl distillation (FOSS Kjeltec 8200 Auto Distillation, Alingsås, Sweden) to measure the total nitrogen content, where liberated ammonia was captured in boric acid and quantified via acid-base titration. The total phosphorus content was determined by digesting the samples with a nitric acid-perchloric acid mixture, and the pH of the supernatant was adjusted to weakly acidic/basic. After all forms of phosphorus were converted into phosphate, where phosphomolybdenum blue complexes formed by reaction with ammonium molybdate and antimony potassium tartrate were measured at 700 nm using a spectrophotometer (Agilent Cary 3500 UV-Vis Spectrophotometer, Santa Clara, CA, USA). All chemicals required for the experiments were supplied by Sinopharm Chemical Reagent Co., Ltd. (Shanghai, China).
The nutrient concentration in the overlying water and the cumulative amount of nutrients released into the overlying water of the experimental samples were calculated as follows:
Cwi = Ci − Cin + Cj
Twi = Vi × Cwi/m
where Cwi is the nutrient concentration released by the soil–plant system into the overlying water at time i, Ci is the nutrient concentration in the overlying water during the ith sampling event (mg·L−1), Cin is the nutrient concentration in the input water during the jth sampling event (mg·L−1), and Cj is the nutrient concentration in the overlying water during the jth water change event (mg·L−1). In equation (2), Twi is the nutrient release amount during the ith sampling event (mg·g−1), Vi is the volume of the overlying water before the ith sampling event (mL), m is the mass of the initial soil–plant system (g), i = 1 − n, and j = 1 − m (n is the number of sampling events that occur in the experiment, and m is the number of water change events).
Statistical analyses were conducted using SPSS 25.0 (IBM CorP, Armonk, NY, USA). The least significant difference (LSD) procedure was applied to analyze the initial characteristics and release load differences between the different soil–plant systems at a 0.05 significance level. The Pearson correlation coefficient was used to identify correlations between the release amount and initial characteristics. Means and standard deviations (SDs) were calculated using Microsoft Office Excel 2023 (Microsoft Corporation, Redmond, WA, USA). All the data provided in the tables are presented as means ± standard deviations. Origin Pro 2019 (Origin Lab CorP, Northampton, MA, USA) was used to create all the figures.

3. Result

3.1. Initial Mass and Nutrient Content of the Soil–Plant System

The initial mass, plant species and total nitrogen and phosphorus contents in the soil–plant systems were measured, and the results are listed in Table 1. The initial mass of the 150 m soil–plant system was 14.01 kg, notably lower than those of the systems at 160 and 170 m, which may be related to the different plant species in the soil–plant systems at the different elevations. In the 150 m system, the dominant plant species is C. dactylon; in the 160 m system, the dominant plant species are C. dactylon and X. sibiricum; and in the 170 m system, the dominant plant species are C. dactylon and B. pilosa. In the 170 m system, the soil total nitrogen and phosphorus contents were 0.72 and 0.54 g·kg−1, respectively, indicating a significant difference between the 150 m and 160 m systems. In contrast, the soils in the 150 m and 160 m systems exhibited higher total nitrogen and phosphorus contents than did that in the 170 m system, while the plants in the 150 m and 160 m systems demonstrated much lower total nitrogen and phosphorus contents.

3.2. The Nutrient Concentration of Overlying Water Changed During the Experiment

3.2.1. Nitrogen Form and Concentration Change of Overlying Water in Soil–Plant System

The variations in the concentrations of different types of nitrogen released into the overlying water by the submerged soil–plant systems are shown in Figure 2. The TN, TDN, and NN concentrations in the overlying water changed consistently with submerged time for all the soil–plant systems. During the first 30 days of immersion, the TN, TDN, AN and NN concentrations first decreased but then increased within a narrow range. From 30 to 60 days, the TD, TDN, and NN concentrations increased rapidly to their maximum values and remained unchanged until the end of submergence. This directly corresponds with the sudden release of TN into the overlying water by soil or plants submerged for 30 to 60 days (Figure S1). However, the AN concentration could not be measured after 60 days of immersion, except for a minor release in the 170 m system.
There was no difference between the maximum concentrations of TN released into the overlying water by the soil–plant systems from the different elevations (4.25 mg·L−1 for the 150 m system, 3.96 mg·L−1 for the 160 m system, and 4.28 mg·L−1 for the 170 m system), which followed nearly identical TN concentrations in the overlying water of the submerged soil across the different elevations. This may account for the high mass fraction of soil in the soil–plant systems, despite different plant species at different elevations. The concentrations of TDN, AN and NN released into the overlying water reached equilibrium at the later stage of submergence (after 90 days), but there was no apparent relationship with elevation. The equilibrium concentrations of TDN and NN varied with system elevation: the 160 m system exhibited higher concentrations than the 170 m and 150 m systems, whereas the AN concentration was higher in the 150 m system compared to the 170 m and 160 m systems.

3.2.2. Phosphorus Form and Concentration Change of Overlying Water in Soil–Plant System

Figure 3 shows the changes in the TP, TDP and OPP concentrations with increasing duration of soil–plant system submergence. The variation in the concentration of TP released into the overlying water by the submerged soil–plant system was similar to that of TN, which began to increase directly at 30 days and remained consistent after reaching a maximum at 60 days. This finding is also consistent with the variation in the TP concentration in the overlying water during soil submergence (Figure S1). The TDP concentration in the overlying water slowly decreased during the first 20 days of submergence and then gradually increased until the TDP concentration peaked at 60 days. After 90 days, the TDP concentration remained unchanged. The concentration of OPP released into the overlying water by the submerged soil–plant system fluctuated greatly, reaching a peak value at approximately 45 days.
The TP and TDP equilibrium concentrations in the overlying water due to the submergence of the 150 m soil–plant system were significantly greater than those in the 160 m and 170 m systems. In comparison, there was a slight difference between the 160 m and 170 m systems. This result agrees with the TP concentration in the overlying water of submerged soil. The maximum TP concentrations in the overlying water were 0.68, 0.44, and 0.43 mg·L−1 in the 150 m, 160 m, and 170 m systems, respectively. Throughout the submergence period in this study, the OPP concentration was relatively low, ranging from 0.003 to 0.04 mg·L−1.

3.3. The Release Amount of Nutrients into Overlying Water After 200-d Submergence

3.3.1. Nitrogen Release

The amounts of TN, TDN, PN, AN and NN released into the overlying water by the soil–plant system by the end of the experiment are listed in Table 2. There were significant differences in the release amounts of TN, TDN, PN, AN and NN among the systems from the different elevations (p < 0.05). However, the release amounts of TN, TDN, PN, AN, and NN did not change consistently with increasing system elevation. The morphology of nitrogen in the overlying water of the submerged soil–plant systems was dominated by a granular state, with PN accounting for more than 70% of the TN release. Within 200 days of submergence, the release rates of TN into the overlying water in the 150 m, 160 m, and 170 m systems were 0.34, 0.29, and 0.30 mg·kg−1·d−1, respectively.

3.3.2. Phosphorus Release

There were significant differences in the amounts of TP, TDP, PP, and OPP released into the overlying water after 200 days of soil–plant system submergence (p < 0.05, Table 3). Compared with the 160 m and 170 m systems, the 150 m system exhibited greater releases of TP, TDP, PP and OPP. As indicated in Table 3, particulate P was the primary form of phosphorus released into the overlying water due to soil–plant system submergence, and the amount of PP released accounted for more than 90% of the amount of TP released. The TP release rates of the 150 m, 160 m, and 170 m systems after 200 days of submergence were 0.05, 0.03, and 0.03 mg·kg−1·d−1, respectively. Notably, particulate phosphorus constituted >90% of the TP flux.

3.3.3. Correlations of Nutrient Release and Initial Properties

The correlations between the release amounts of TD, TDP, PN, TP, TDP, and PP into the overlying water by the submerged soil–plant systems after 200 days and the initial properties of the soil–plant systems were analyzed, and the results are listed in Table 4. The initial mass of the soil–plant system significantly affected the nutrient release amount, especially the initial mass, and the TN and TP release amounts were significantly negatively correlated (p < 0.01). Moreover, there were positive correlations between the soil total nitrogen content, the soil nitrogen-to-phosphorus ratio (N/P) and the release amounts of different phosphorus forms (TP, TDP, and PP) into the overlying water.

4. Discussion

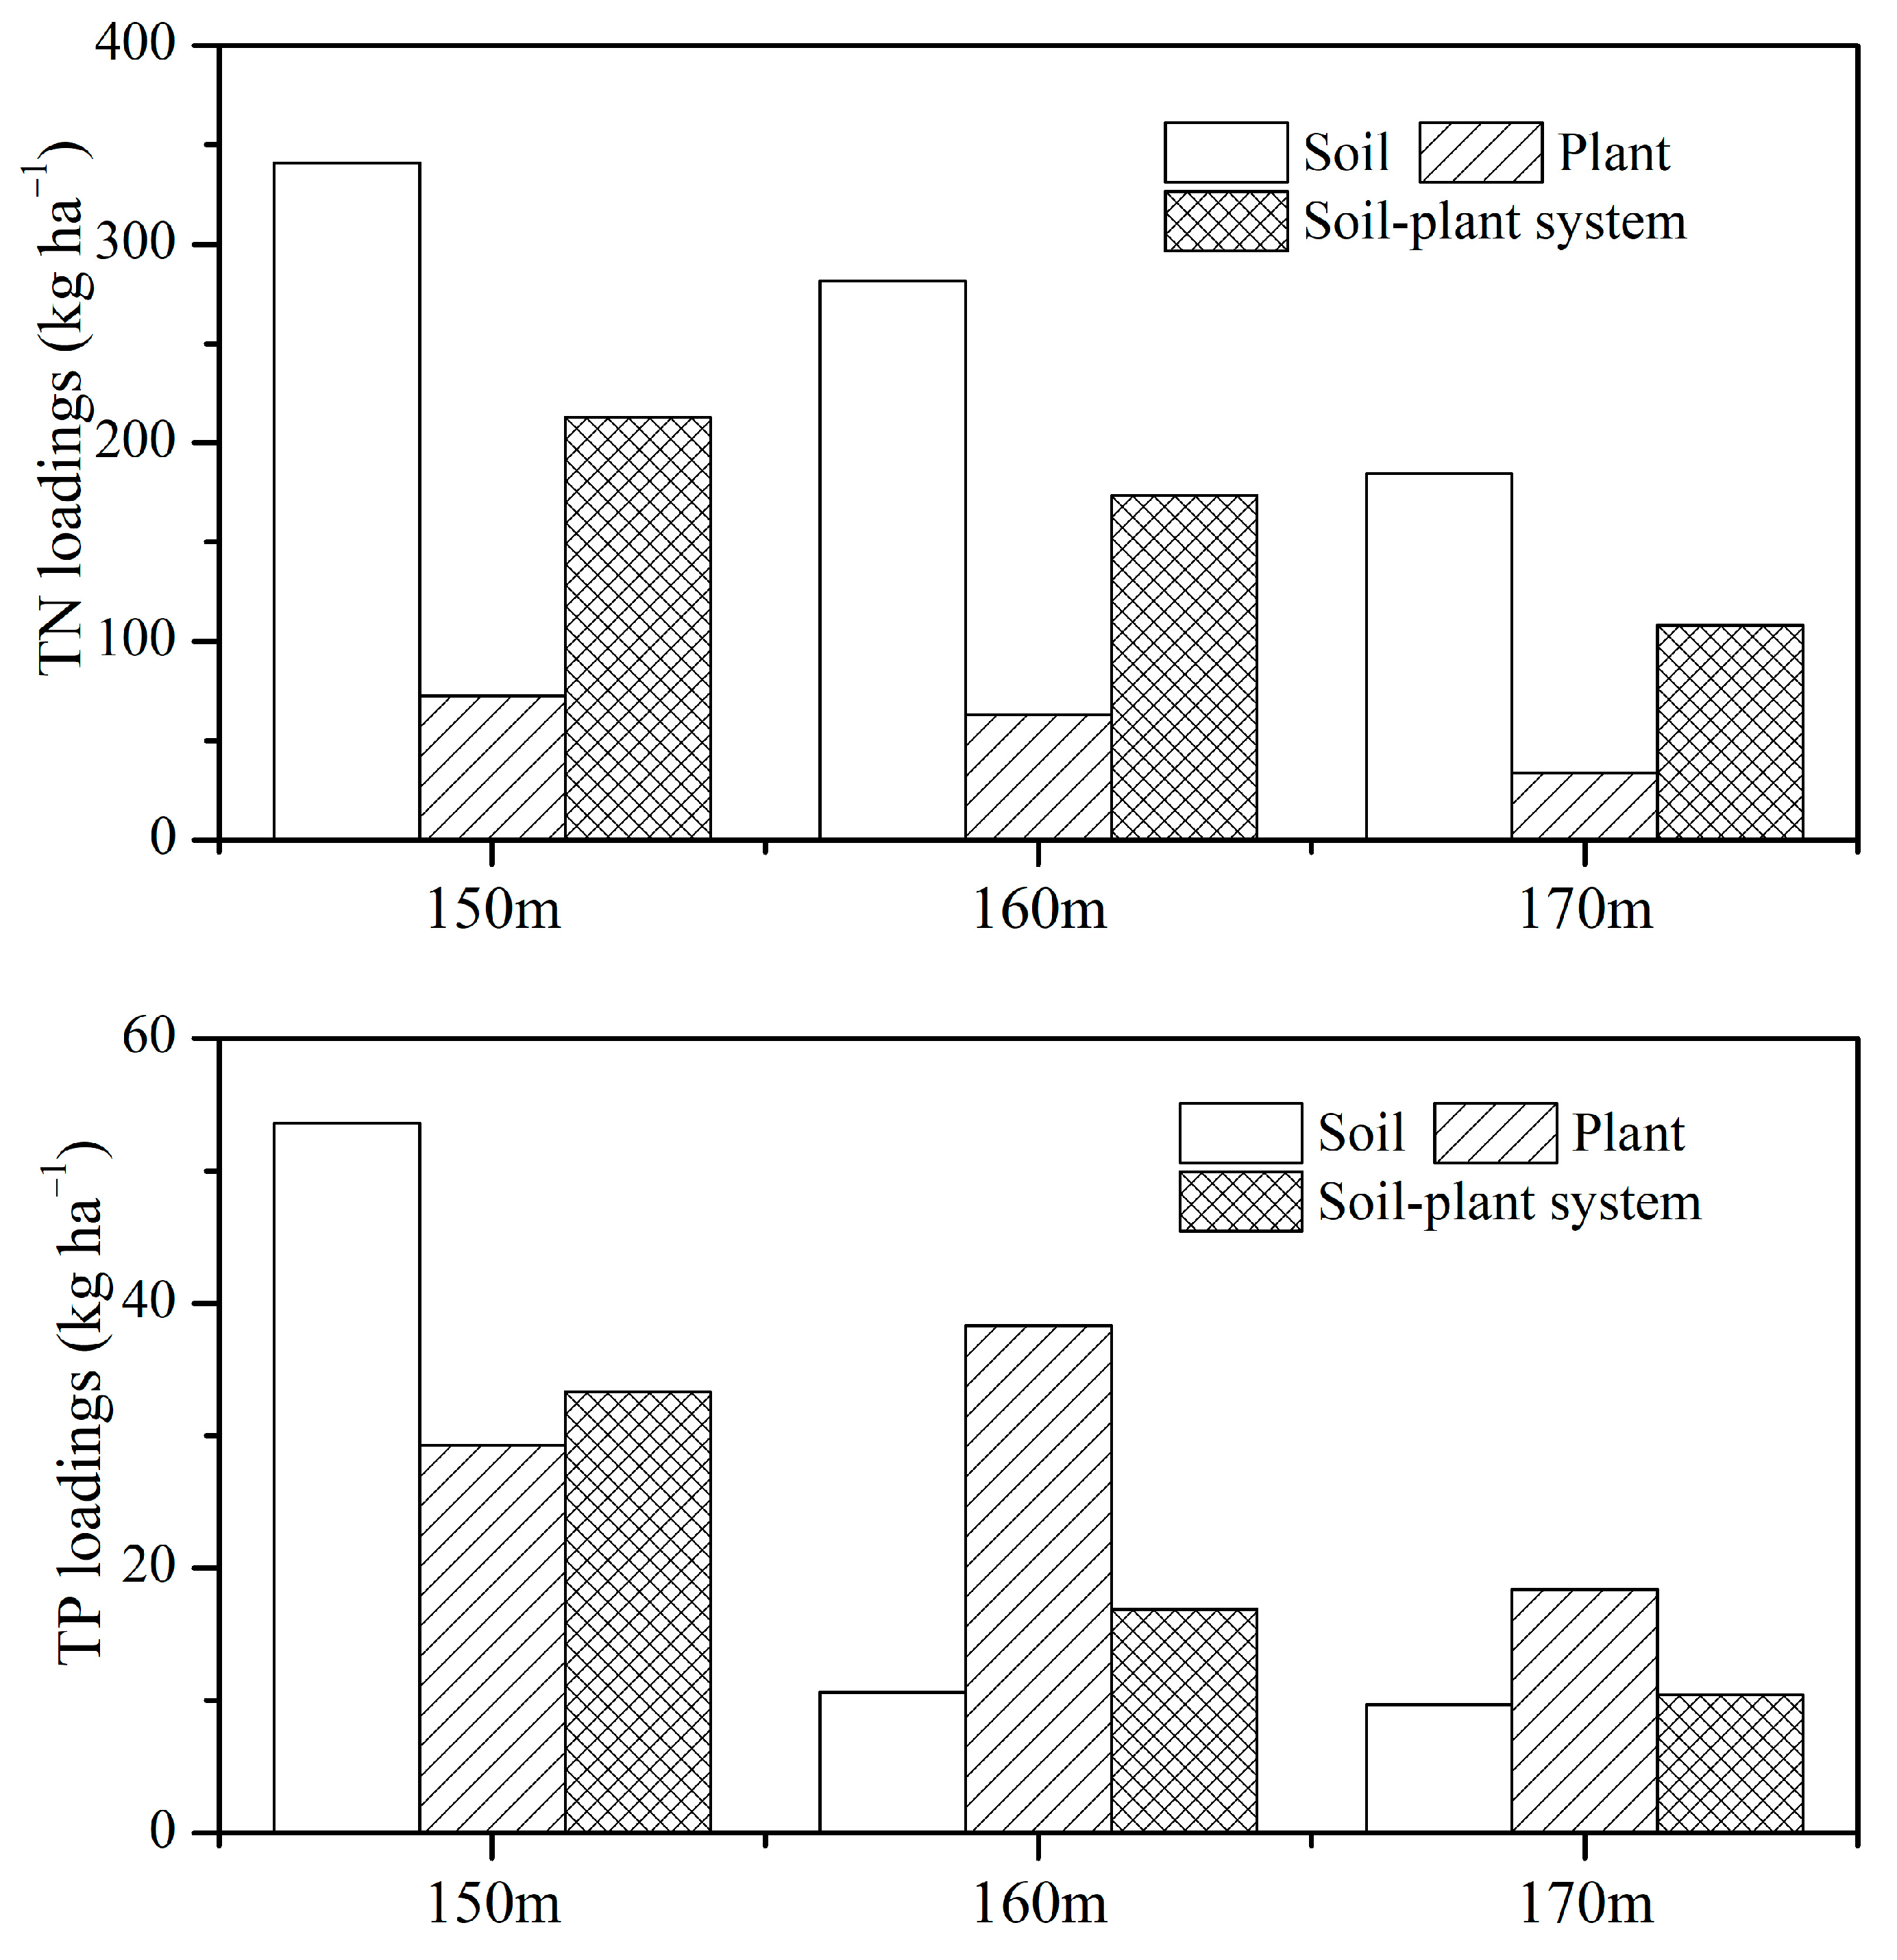
4.1. Nutrient Release and Pollution Loads via Submerged Soil–Plant System

Soil and plants in soil–plant systems within the WLFZ of the TGR release nutrients during the flooding period. The results of this study indicated that prolonged flooding (more than 30 days of submergence) facilitated the release of large amounts of N and P by soil–plant systems rather than the release of nutrients at the moment of system submergence. This may occur because after the soil has adapted to flooding conditions, soil nutrients can more readily enter the overlying water [11,18,45]. Another possible reason for this phenomenon is that the plants in the soil–plant systems collected exhibited active growth. After flooding, living plants continue growing and decomposing [35,46]. The amounts of N and P released into the overlying water after soil–plant system submergence are greater than those released due to the different release mechanisms for N and P in soil–plant systems [35,46].
The soil N cycle in the soil–plant system primarily affects N release. Submergence of the soil–plant system severely influences the biogeochemical process that controls nutrient availability through the depletion of oxygen in the soil [47]. Leaching, migration, and N desorption in soil are significantly related to the soil pH value, redox potential and soil moisture [20,21,45]. A coupled hydrobiogeochemical spatially explicit model for analyzing the N cycle of vegetation buffer strips has revealed that, with high soil moisture levels, notable denitrification can occur [21]. In that case, barely any ammonium is detected in the overlying water because of the near saturation of the soil due to soil–plant system submergence. Nevertheless, N released due to soil–plant system submergence is mainly soluble and occurs in particulate form because the amount of extractable soil N increases with flooding [43], and soil N loss occurs in the form of organic matter after water erosion [48].
Moreover, submerged plants in the soil–plant system decay and are subjected to water erosion and microbial decomposition [2,24,33]. The ammonization, nitrification, and denitrification of microorganisms are affected by plant submergence and induce the release of N [31,32,49]. Different plant properties, such as the total nitrogen, phosphorus, lignin, and cellulose contents, lead to different amounts of N release [2]. With flourishing, serrated leaves, X. sibiricum and B. pilosa can release more nutrients than C. dactylon [24]. However, the results of our study confirmed that the amount of N released into the overlying water by the 160 m (containing X. sibiricum) and 170 m systems (containing B. pilosa) was smaller than that released by the 150 m system (containing C. dactylon). This may also indicate that soil plays a greater role than plants do in the release of N by submerged soil–plant systems.
The impact of submerged plant decomposition on the water P concentration was greater than that on the water N concentration [35,50]. Organic phosphorus compounds notably influence the P cycle in the overlying water. Plants in the soil–plant system utilize soluble phosphorus in the overlying water to regrow, especially labile soluble organic phosphorus. After plant decomposition, P is released and returned to the overlying water [51]. Regrown plants subjected to submergence assimilate less P than is released [35,52], which may also be connected with soil oxidation–reduction reactions [43]. Phosphate released from soil particles, particularly particles containing iron [18], aluminum [53] and calcium, is easily absorbed by plants under reducing conditions [47,54]. At the beginning of submergence, easily desorbed P is released from the soil–plant system, and iron oxides generated by ferric iron adhere to the soil particles [18]. When the soil exhibits more reducing conditions with submergence, ferric iron is transformed into ferrous iron, which may be used by plants and facilitate the desorption of iron oxides [18,43].
Soil properties greatly affect the P cycle in submerged soil–plant systems [18,51,55]. The P released into the overlying water by the soil–plant system is associated with the mass loss of mineral particles from the soil [13]. In our study, PP and PN were the most essential nutrients released after soil–plant system submergence. This agrees with the finding that suspended sediment and particulate phosphorus are the primary pollutants in water after reservoir impoundment [14]. Anaerobic desorption is the most favorable way for the release of P from soil [3,45,56]. A low DO content in soil results in the release of much organic P into the overlying water [51]. Under aerobic conditions, the soil decomposition rate is relatively high and is directly related to the organic matter content [18], which is linearly related to the water OPP concentration. The release of OPP into water is also influenced by the soil iron content [55].
The release of N and P is not only related to the total nitrogen and total phosphorus contents in soil and plants but also related to various environmental factors, such as pH, DO and temperature of the overlying water and water-level fluctuations [57,58]. Water erosion significantly contributes to P in soil water [59,60]. Our study revealed that the N and P release amounts of the 150 m system were notably greater than those of the 160 m and 170 m systems. This may be related to the variation in phytoplankton communities with fluctuating water levels [61], thereby affecting the nutrient concentration in the water.
Furthermore, according to the water-level fluctuations in the TGR during the experimental period (Figure S2), the submergence durations of the 150 m, 160 m, and 170 m systems were determined as 240, 200 and 120 days, respectively. After 120 days of submergence, the concentrations of N and P released by the soil and plants in the soil–plant system in the WLFZ remained nearly stable. Therefore, we used the nutrient release rate at the end of the experiment to calculate the N and P loadings in the overlying water due to soil–plant system submergence during the flooding period in the TGR. The loading calculation is provided below, and the results are listed in Table 5.
R = ρ × h × v × t × 10
where R denotes the N or P loading due to soil–plant system submergence per unit area (kg·ha−1), ρ denotes the volumetric weight of soil (1.29, 1.48 and 1.46 g·cm−3 for the 150 m, 160 m, and 170 m systems, respectively), h denotes the thickness of the topsoil layer (0.2 m), v denotes the release rate of TN or TP due to soil–plant system submergence (mg·kg−1·d−1), and t denotes the duration of submergence at each elevation (d).
The N and P loadings entering the overlying water from the soil–plant system in the WLFZ during the flooding period of the TGR were determined on the basis of the loadings at the different elevations and their weights (the area of the WLFZ at each elevation). The N loading of the WLFZ was set to 159.83 kg·ha−1, and the P loading was 19.30 kg·ha−1 during the flooding period.
In our earlier study of nutrient release from dominant plant species after 200 days of in situ soaking in the WLFZ of the TGR, the estimated N and P loadings were 80.0 and 24.7 kg·ha−1, respectively [24]. The N loading due to soil–plant system submergence was more than twice that due to plant submergence, which may indicate that the soil in the system is the main contributor to the N loading. During submergence in the WLFZ, soils at the end of the backwater area (Pinshan Bridge in our study) with low total P contents exhibited unexpectedly high P release abilities because agricultural activities exacerbated the amount of desorbed P in the soil during the drought period [62,63]. Model-based assessments of non-point source pollution loadings in the TGR were performed in previous studies [62,64,65,66]. The results revealed that the N and P loadings (the total amount) under different land uses ranged from 11.8–60.3 kg·ha−1 for TN and 8.4–27.2 kg·ha−1 for TP [62], which are primarily affected by residential areas, paddy fields and forests [66,67]. The N loading due to soil–plant system submergence in the WLFZ of the TGR substantially exceeds that due to non-point source pollution, and the P loading is extremely higher than that due to non-point source pollution. This suggests that the presence of soil–plant systems in the WLFZ during the flooding period exacerbates the negative effects on the water environment in the TGR.

4.2. Interaction of Soil and Plant in the Soil–Plant System

The effect of the soil–plant system on the overlying water N and P concentrations was more similar to that of soil submergence alone than that of plant submergence alone, but the two processes yielded different effects. This may be related to the complex interactions in the rhizosphere of the soil–plant system, such as fixation, adsorption, degradation, and volatilization of nutrients [67,68]. Therefore, we compared the N and P loadings per unit of soil, plant or soil–plant system during the flooding period, as shown in Figure 4 (the relevant parameters and equations are listed in Tables S1 and S2). The N and P loadings released into the overlying water by the soil–plant system in the WLFZ were lower than the sum of those released by the soil and plants during the flooding period, which indicates that there are internal interactions between nutrients in the soil and plants in addition to the release of nutrients into the water environment [29,36,37,59].
Once the flooding period in the TGR begins in September every year, plants covering the soil of the WLFZ eventually become submerged but continue absorbing nutrients from the water environment to support their growth and metabolism [11,35,69]. This may explain our observed regrowth of B. pilosa after 5 months of submergence. Moreover, the amounts of N and P released from plant litter are much greater than those taken up by living plants [35]. The N loadings released into the overlying water by the systems containing X. sibiricum and B. pilosa were much lower than those released by the systems containing C. dactylon because of the rich root systems of the latter species. Enhanced microbial nitrification or denitrification, which is closely linked to the occurrence of rich root systems, leads to increased nitrogen removal by aquatic plants [70]. During the flooding period, denitrification decreases the N availability for plant roots, whereas phosphate mobilization increases P availability [38]. The high respiratory activity of roots also provides enough energy to support the growth of plant tissues [71]. The roots of C. dactylon are well developed and can survive during the flooding period and resume growth after water withdrawal [39]. X. sibiricum and B. pilosa, which are annual plants, propagate and grow by spreading seeds in water [41,72]. Submergence during the flooding period of the WLFZ softens the husks and coatings of seeds, subsequently accelerating seed germination [41]. The germination and flooding tolerance of plant seeds in the WLFZ are relevant to plant species dominance [42,73], as are the timing, frequency, magnitude and duration of flooding. Notably, the seeds of B. pilosa are more adaptable to germination under flooding conditions than are those of X. sibiricum because X. sibiricum, which grows at 160 m in the WLFZ, requires a sufficiently long growth phase under drought conditions to produce enough seeds [41,72].
A significant plant–soil interaction effect was detected at soil depths from 10 to 20 cm [37] as a result of the soil microbial distribution, which depends on the soil depth. Soil physiochemical properties (pH, infiltrability, clay content, nutrient content, etc.) are closely associated with the root morphology [37]. Plant roots (fibrous roots, smooth roots and fine roots) increase the noncapillary porosity and saturated hydraulic conductivity of the soil, thus promoting nutrient penetration [40]. Similarly, plant roots may notably influence soil biological properties. Coupled soil and plants in the soil–plant system yield synergistic removal effects due to root oxygenation, which critically influences the increase in N and P metabolism [36]. The oxidation–reduction potential of the soil at different depths significantly contributes to the nutrient balance in plants and soil [55]. An aerobic layer forms within the topsoil and the characteristics of the water environment depend on the duration of soil–plant system submergence, while the deep soil is largely anaerobic [74]. The presence of plant roots increases the oxygen content in the soil around the plant–root zone, thereby increasing nutrient bioavailability for rhizosphere microorganisms [75]. Different plants can provide additional oxygen in soil [76], which increases the N and P enrichment capacities through the rhizosphere effect between C. dactylon, X. sibiricum and B. pilosa during soil–plant system submergence.
Moreover, reducing conditions in deep soil can cause the enrichment of phytotoxin sulfate in the soil–plant system, which adversely affects the utilization of N by plants [38]. The different nutrient loadings between the submerged soil–plant system and the submerged soil or plants illustrate the important role of plant roots during the flooding period of the WLFZ. Therefore, the soil–plant system should be considered as a whole to better understand the influence of the WLFZ on the water quality in the TGR instead of simply combining the individual environmental impacts of soil and plants during the flooding period.

5. Conclusions

N and P are released by submerged soil–plant systems from 30 to 60 days, primarily PN and PP. The amounts of TN and TP released by the submerged soil–plant system after 200 days depend on the soil properties. During the flooding period, the N and P loadings due to soil–plant system submergence in the WLFZ of the TGR were 159.83 and 19.30 kg·ha−1, respectively. The comprehensive interactions between the soil and plants reduced nutrient release due to soil–plant system submergence, in contrast with submerged soil or plants. However, the N and P loadings due to soil–plant system submergence in this study can provide data support for the quantitative assessment of the effect of the WLFZ on the water quality. In future research, the influence of the plant rhizosphere on the environmental fate of nutrients in the TGR should be considered because of its crucial role in the soil–plant system.

Supplementary Materials

The following supporting information can be downloaded at: https://www.mdpi.com/article/10.3390/w17111701/s1, Figure S1: TN and TP concentration released into the overlying water during soils and plants (isolated from soil–plant systems) submergence; Figure S2: Periodic water-level change in the Three Gorges Reservoir from April 2023 to April 2024; Table S1: Release rate of TN and TP via soil soaking and soil volume weight; Table S2: Release rate of total nitrogen and phosphorus via different plant soaking and biomass.

Author Contributions

L.H. and T.W. designed the experiments. L.H. and L.X. participated in the acquisition and analysis of data for the work. L.H. wrote the manuscript. T.W. revised it critically for important intellectual content. All authors approved the submission. All authors have read and agreed to the published version of the manuscript.

Funding

This work was supported by the National Natural Science Foundation of China [Grant No. 42377416].

Data Availability Statement

All data generated or analyzed during this study are included in this published article and its Supplementary Information files.

Acknowledgments

We also sincerely thank the editor and the anonymous reviewers for their valuable comments and suggestions, which have significantly improved the quality of this manuscript.

Conflicts of Interest

The authors declare no competing interests.

References

  1. Elliott, J.A. Predicting the impact of changing nutrient load and temperature on the phytoplankton of England’s largest lake, Windermere. Freshw. Biol. 2012, 57, 400–413. [Google Scholar] [CrossRef]
  2. Liu, S.S.; Zhu, Y.R.; Meng, W.; He, Z.Q.; Feng, W.Y.; Zhang, C.; Giesy, J.P. Characteristics and degradation of carbon and phosphorus from aquatic macrophytes in lakes: Insights from solid-state 13C NMR and solution 31P NMR spectroscopy. Sci. Total Environ. 2016, 543, 746–756. [Google Scholar] [CrossRef] [PubMed]
  3. Wang, S.Y.; Li, H.; Xiao, J.; Zhou, Y.Y.; Song, C.L.; Bi, Y.H.; Cao, X.Y. Enhancement of sediment phosphorus release during a tunnel construction across an urban lake (Lake Donghu, China). Environ. Sci. Pollut. Res. 2016, 23, 17774–17783. [Google Scholar] [CrossRef]
  4. Meng, Z.J.; Yu, X.B.; Xia, S.X.; Zhang, Q.J.; Ma, X.; Yu, D.K. Effects of water depth on the biomass of two dominant submerged macrophyte species in floodplain lakes during flood and dry seasons. Sci. Total Environ. 2023, 877, 162690. [Google Scholar] [CrossRef]
  5. Lavoie, M.; Auclair, J.C. Phosphorus Mobilization at the Sediment-Water Interface in Softwater Shield Lakes: The Role of Organic Carbon and Metal Oxyhydroxides. Aquat. Geochem. 2012, 18, 327–341. [Google Scholar] [CrossRef]
  6. Zhang, X.; Zhu, B. Changes of riparian soil-plant system phosphorus responding to hydrological alternations of Three Gorges Reservoir. Sci. Rep. 2025, 15, 5629. [Google Scholar] [CrossRef]
  7. Zhang, S.M.; Wang, F.S.; Wang, Y.C.; Chen, X.P.; Xu, P.F.; Miao, H.C. Shifts of soil archaeal nitrification and methanogenesis with elevation in water level fluctuation zone of the three Gorges Reservoir, China. J. Environ. Manag. 2023, 339, 117871. [Google Scholar] [CrossRef]
  8. Guo, E.; Fan, Z.; Zhang, R.; Sun, J.; Yang, X. Research progresses on the response of vegetation and soil to hydrological changes in riparian ecosystems. Acta Ecol. Sin. 2021, 41, 9164–9173. [Google Scholar]
  9. Percuoco, V.P.; Kalnejais, L.H.; Officer, L.V. Nutrient release from the sediments of the Great Bay Estuary, NH USA. Coast. Shelf Sci. 2015, 161, 76–87. [Google Scholar] [CrossRef]
  10. Shaughnessy, A.R.; Sloan, J.J.; Corcoran, M.J.; Hasenmueller, E.A. Sediments in Agricultural Reservoirs Act as Sinks and Sources for Nutrients over Various Timescales. Water Resour. Res. 2019, 55, 5985–6000. [Google Scholar] [CrossRef]
  11. Hale, R.; Reich, P.; Daniel, T.; Lake, P.S.; Cavagnaro, T.R. Assessing changes in structural vegetation and soil properties following riparian restoration. Agric. Ecosyst. Environ. 2018, 252, 22–29. [Google Scholar] [CrossRef]
  12. Huang, J.T.; Luo, Z.; Xu, Z.P.; Jiang, Y.X.; Guo, J.S. Interactions between N, P in the overlying water and flooding-induced decomposition of Cynodon dactylon in the water-level fluctuation zone. Front. Plant Sci. 2025, 16, 1526507. [Google Scholar] [CrossRef]
  13. Shi, P.; Schulin, R. Erosion-induced losses of carbon, nitrogen, phosphorus and heavy metals from agricultural soils of contrasting organic matter management. Sci. Total Environ. 2018, 618, 210–218. [Google Scholar] [CrossRef]
  14. Tang, X.Q.; Wu, M.; Li, R. Distribution, sedimentation, and bioavailability of particulate phosphorus in the mainstream of the Three Gorges Reservoir. Water Res. 2018, 140, 44–55. [Google Scholar] [CrossRef]
  15. Chlot, S.; Widerlund, A.; Öhlander, B. Interaction between nitrogen and phosphorus cycles in mining-affected aquatic systems-experiences from field and laboratory measurements. Environ. Sci. Pollut. Res. 2013, 20, 5722–5736. [Google Scholar] [CrossRef]
  16. Wang, C.; Zhang, H.; Xin, X.K.; Li, J.; Jia, H.Y.; Wen, L.Q.; Yin, W. Water level-driven agricultural nonpoint source pollution dominated the ammonia variation in China’s second largest reservoir. Environ. Res. 2022, 215, 114367. [Google Scholar] [CrossRef]
  17. Ma, L.Y.; Qi, X.; Zhou, S.Q.; Niu, H.F.; Zhang, T.X. Spatiotemporal distribution of phosphorus fractions and the potential release risks in sediments in a Yangtze River connected lake: New insights into the influence of water-level fluctuation. J. Soils Sediments 2023, 23, 496–511. [Google Scholar] [CrossRef]
  18. Geurts, J.J.M.; Smolders, A.J.P.; Banach, A.M.; de Graaf, J.; Roelofs, J.G.M.; Lamers, L.P.M. The interaction between decomposition, net N and P mineralization and their mobilization to the surface water in fens. Water Res. 2010, 44, 3487–3495. [Google Scholar] [CrossRef] [PubMed]
  19. Qin, B.Q.; Zhang, Y.L.; Zhu, G.W.; Gao, G. Eutrophication control of large shallow lakes in China. Sci. Total Environ. 2023, 881, 163494. [Google Scholar] [CrossRef]
  20. Blackwell, M.S.A.; Brookes, P.C.; de la Fuente-Martinez, N.; Murray, P.J.; Snars, K.E.; Williams, J.K.; Haygarth, P.M. Effects of soil drying and rate of re-wetting on concentrations and forms of phosphorus in leachate. Biol. Fertil. Soils 2009, 45, 635–643. [Google Scholar] [CrossRef]
  21. Klatt, S.; Kraus, D.; Kraft, P.; Breuer, L.; Wlotzka, M.; Heuveline, V.; Haas, E.; Kiese, R.; Butterbach-Bahl, K. Exploring impacts of vegetated buffer strips on nitrogen cycling using a spatially explicit hydro-biogeochemical modeling approach. Environ. Model. Softw. 2017, 90, 55–67. [Google Scholar] [CrossRef]
  22. Yuan, X.Z.; Zhang, Y.W.; Liu, H.; Xiong, S.; Li, B.; Deng, W. The littoral zone in the Three Gorges Reservoir, China: Challenges and opportunities. Environ. Sci. Pollut. Res. 2013, 20, 7092–7102. [Google Scholar] [CrossRef] [PubMed]
  23. Xiao, H.; Guo, P.; Zhang, Q.H.; Hu, H.; Hong, H.; Zhang, L.; Yang, Y.S.; Xia, Z.Y.; Li, M.Y.; Kang, H.L.; et al. Variation in soil properties and its influence on the dynamic change of soil erosion resistance to overland flow in the water-level fluctuation zone of the Three Gorges Reservoir, China. Catena 2022, 213, 106141. [Google Scholar] [CrossRef]
  24. Xiao, L.W.; Zhu, B.; Kumwimba, M.N.; Jiang, S.W. Plant soaking decomposition as well as nitrogen and phosphorous release in the water-level fluctuation zone of the Three Gorges Reservoir. Sci. Total Environ. 2017, 592, 527–534. [Google Scholar] [CrossRef]
  25. Li, Y.Y.; Gao, B.; Xu, D.Y.; Lu, J.; Zhou, H.D.; Gao, L. Heavy metals in the water-level-fluctuation zone soil of the three Gorges Reservoir, China: Remobilization and catchment-wide transportation. J. Hydrol. 2022, 612, 128108. [Google Scholar] [CrossRef]
  26. Guo, P.; Xiao, H.; Gao, F.; Li, Z.J.; Hu, H.; Zhang, Q.H.; Xia, Z.Y.; Li, M.Y.; Yang, Y.S. The vertical heterogeneity of soil detachment by overland flow on the water-level fluctuation zone slope in the Three Gorges Reservoir, China The vertical heterogeneity of soil detachment capacity. Hydrol. Process. 2021, 35, e14282. [Google Scholar] [CrossRef]
  27. Wang, Z.; Hu, L.; Zhu, B. Characteristics of Greenhouse Gases Emission under Inundation from Dominant Herbaceous Plants in the Water-level Fluctuation Zone of the Three Gorges Reservoir. Resour. Environ. Yangtze Basin 2020, 29, 1965–1974. [Google Scholar]
  28. Su, Y.M.; Liu, W.B.; Rahaman, M.H.; Chen, Z.B.; Zhai, J. Methane emission from water level fluctuation zone of the Three Gorges Reservoir: Seasonal variation and microbial mechanism. Sci. Total Environ. 2024, 912, 168935. [Google Scholar] [CrossRef] [PubMed]
  29. Ye, C.; Cheng, X.L.; Zhang, Q.F. Recovery approach affects soil quality in the water level fluctuation zone of the Three Gorges Reservoir, China: Implications for revegetation. Environ. Sci. Pollut. Res. 2014, 21, 2018–2031. [Google Scholar] [CrossRef]
  30. Chen, C.D.; Cheng, H.; Jia, J.S.; Wang, X.Y.; Zhao, J.J. Use it or not: An agro-ecological perspective to flooded riparian land along the Three Gorges Reservoir. Sci. Total Environ. 2019, 650, 1062–1072. [Google Scholar] [CrossRef]
  31. Hanlon, R.D.G. The Breakdown and Decomposition of Allochthonous and Autochthonous Plant Litter in an Oligotrophic Lake Frongoch, Llyn. Hydrobiologia 1982, 88, 281–288. [Google Scholar] [CrossRef]
  32. Zhang, Q.H.; Zak, J.C. Effects of Gap Size on Litter Decomposition and Microbial Activity in a Subtropical Forest. Ecology 1995, 76, 2196–2204. [Google Scholar] [CrossRef]
  33. Jacobson, T.K.B.; Bustamante, M.M.D.; Kozovits, A.R. Diversity of shrub tree layer, leaf litter decomposition and N release in a Brazilian Cerrado under N, P and N plus P additions. Environ. Pollut. 2011, 159, 2236–2242. [Google Scholar] [CrossRef]
  34. Xie, Y.H.; Qin, H.Y.; Yu, D. Nutrient limitation to the decomposition of water hyacinth (Eichhornia crassipes). Hydrobiologia 2004, 529, 105–112. [Google Scholar] [CrossRef]
  35. Lu, J.; Bunn, S.E.; Burford, M.A. Nutrient release and uptake by littoral macrophytes during water level fluctuations. Sci. Total Environ. 2018, 622, 29–40. [Google Scholar] [CrossRef]
  36. Wang, C.; Liu, Z.S.; Zhang, Y.; Liu, B.Y.; Zhou, Q.H.; Zeng, L.; He, F.; Wu, Z.B. Synergistic removal effect of P in sediment of all fractions by combining the modified bentonite granules and submerged macrophyte. Sci. Total Environ. 2018, 626, 458–467. [Google Scholar] [CrossRef]
  37. Yao, X.D.; Zhang, N.L.; Zeng, H.; Wang, W. Effects of soil depth and plant-soil interaction onmicrobial community in temperate grasslands of northern China. Sci. Total Environ. 2018, 630, 96–102. [Google Scholar] [CrossRef] [PubMed]
  38. Smolders, A.J.P.; Lamers, L.P.M.; den Hartog, C.; Roelofs, J.G.M. Mechanisms involved in the decline of Stratiotes aloides L. in The Netherlands: Sulphate as a key variable. Hydrobiologia 2003, 506, 603–610. [Google Scholar] [CrossRef]
  39. Tan, S.D.; Zhu, M.Y.; Zhang, Q.F. Physiological responses of bermudagrass (Cynodon dactylon) to submergence. Acta Physiol. Plant. 2010, 32, 133–140. [Google Scholar] [CrossRef]
  40. Jiang, X.J.; Liu, W.J.; Chen, C.F.; Liu, J.Q.; Yuan, Z.Q.; Jin, B.C.; Yu, X.Y. Effects of three morphometric features of roots on soil water flow behavior in three sites in China. Geoderma 2018, 320, 161–171. [Google Scholar] [CrossRef]
  41. Liu, J.H.; Zeng, B.; Lin, F.; Ayi, Q.L. Effects of water level regulation on the seed germination and production of annual plant Xanthium sibiricum in the water-level-fluctuating-zone of Three Gorges Reservoir. Sci. Rep. 2017, 7, 5056. [Google Scholar] [CrossRef] [PubMed]
  42. Fraaije, R.G.A.; ter Braak, C.J.F.; Verduyn, B.; Breeman, L.B.S.; Verhoeven, J.T.A.; Soons, M.B. Early plant recruitment stages set the template for the development of vegetation patterns along a hydrological gradient. Funct. Ecol. 2015, 29, 971–980. [Google Scholar] [CrossRef]
  43. Garssen, A.G.; Baattrup-Pedersen, A.; Riis, T.; Raven, B.M.; Hoffman, C.C.; Verhoeven, J.T.A.; Soons, M.B. Effects of increased flooding on riparian vegetation: Field experiments simulating climate change along five European lowland streams. Global Change Biol. 2017, 23, 3052–3063. [Google Scholar] [CrossRef] [PubMed]
  44. Lu, R. Soil Agricultural Chemistry Analysis; Chinese Agriculture and Technology Press: Beijing, China, 1999. (In Chinese) [Google Scholar]
  45. Müller, S.; Mitrovic, S.M.; Baldwin, D.S. Oxygen and dissolved organic carbon control release of N, P and Fe from the sediments of a shallow, polymictic lake. J. Soils Sediments 2016, 16, 1109–1120. [Google Scholar] [CrossRef]
  46. Chao, C.X.; Lv, T.; Wang, L.G.; Li, Y.; Han, C.; Yu, W.C.; Yan, Z.W.; Ma, X.W.; Zhao, H.C.; Zuo, Z.J.; et al. The spatiotemporal characteristics of water quality and phytoplankton community in a shallow eutrophic lake: Implications for submerged vegetation restoration. Sci. Total Environ. 2022, 821, 153460. [Google Scholar] [CrossRef]
  47. Beumer, V.; van Wirdum, G.; Beltman, B.; Griffioen, J.; Verhoeven, J.T.A. Biogeochemical consequences of winter flooding in brook valleys. Biogeochemistry 2007, 86, 105–121. [Google Scholar] [CrossRef]
  48. Qinfei, B.; Yuhai, B.; Yantong, Y.; Jie, Y.; Yanqi, W.; Jie, W. Effects of different vegetation restoration models on soil nutrients in the water level fluctuation zone of a large reservoir. Ecol. Indic. 2024, 169, 112955. [Google Scholar] [CrossRef]
  49. Ren, S.X.; Huo, T.C.; Wang, D.J.; Liang, J.Y. Losses of native mineral-associated organic nitrogen through microbial mineralization and gaseous emissions induced by ammonium and nitrate addition. Soil Biol. Biochem. 2024, 193, 109420. [Google Scholar] [CrossRef]
  50. Lu, J.; Faggotter, S.J.; Bunn, S.E.; Burford, M.A. Macrophyte beds in a subtropical reservoir shifted from a nutrient sink to a source after drying then rewetting. Freshw. Biol. 2017, 62, 854–867. [Google Scholar] [CrossRef]
  51. Zhang, B.; Fang, F.; Guo, J.S.; Chen, Y.P.; Li, Z.; Guo, S.S. Phosphorus fractions and phosphate sorption-release characteristics relevant to the soil composition of water-level-fluctuating zone of Three Gorges Reservoir. Ecol. Eng. 2012, 40, 153–159. [Google Scholar] [CrossRef]
  52. Zhang, X.; Chen, F.; Yan, D.J.; Zhu, Y.G.; Zhang, Y.H.; Zhang, Z.B. Effects of wet-dry alternation on organic phosphorus dynamics and sediment characteristics in the intertidal zone of Nansi Lake. Ecotox. Environ. Safe. 2024, 281, 116668. [Google Scholar] [CrossRef] [PubMed]
  53. Rydin, E.; Huser, B.; Welch, E.B. Amount of phosphorus inactivated by alum treatments in Washington lakes. Limnol. Oceanogr. 2000, 45, 226–230. [Google Scholar] [CrossRef]
  54. Walls, R.L.; Wardrop, D.H.; Brooks, R.P. The impact of experimental sedimentation and flooding on the growth and germination of floodplain trees. Plant Ecolog. 2005, 176, 203–213. [Google Scholar] [CrossRef]
  55. Rao, K.; Zhang, X.; Yi, X.J.; Li, Z.S.; Wang, P.; Huang, G.W.; Guo, X.X. Interactive effects of environmental factors on phytoplankton communities and benthic nutrient interactions in a shallow lake and adjoining rivers in China. Sci. Total Environ. 2018, 619, 1661–1672. [Google Scholar] [CrossRef]
  56. Li, H.; Cai, Y.Y.; Song, C.L.; Cao, Z.; Li, J.; Qin, Z.H.; Zhang, S.X.; Li, J.F.; Cao, X.Y.; Zhou, Y.Y. Comparison of phosphorus migration and transformation characteristics in sediments of lakes within the Yangtze River basin and reservoirs on the Wujiang River. J. Soils Sediments 2024, 24, 991–1001. [Google Scholar] [CrossRef]
  57. Wang, Y.K.; Ji, Z.H.; Li, X.Q.; Long, Z.W.; Pei, Y.S. Comprehensive analysis of the migration and transformation of nutrients between sediment and overlying water in complex habitat systems. Sci. Total Environ. 2022, 852, 158433. [Google Scholar] [CrossRef]
  58. Liu, B.; Zhang, X.F.; Tong, Y.; Ao, W.; Wang, Z.L.; Zhu, S.L.; Wang, Y.P. Quantification of Nutrient Fluxes from Sediments of Lake Hulun, China: Implications for Plateau Lake Management. Sustainability 2023, 15, 8680. [Google Scholar] [CrossRef]
  59. Miller, R.B.; Fox, G.A.; Penn, C.J.; Wilson, S.; Parnell, A.; Purvis, R.A.; Criswell, K. Estimating sediment and phosphorus loads from streambanks with and without riparian protection. Agric. Ecosyst. Environ. 2014, 189, 70–81. [Google Scholar] [CrossRef]
  60. Chen, Y.; Ma, T.; Chen, L.Z.; Liu, W.H.; Zhang, M.T.; Shang, R.H. Multimedia Nitrogen and Phosphorus Migration and Source Control Using Multivariate Analysis and XGBoost: The Case Study in a Typical Agricultural Basin, Danjiangkou Reservoir. Water 2024, 16, 1936. [Google Scholar] [CrossRef]
  61. Haldna, M.; Milius, A.; Laugaste, R.; Kangur, K. Nutrients and phytoplankton in Lake Peipsi during two periods that differed in water level and temperature. Hydrobiologia 2008, 599, 3–11. [Google Scholar] [CrossRef]
  62. Shen, Z.Y.; Chen, L.; Hong, Q.; Qiu, J.L.; Xie, H.; Liu, R.M. Assessment of nitrogen and phosphorus loads and causal factors from different land use and soil types in the Three Gorges Reservoir Area. Sci. Total Environ. 2013, 454, 383–392. [Google Scholar] [CrossRef] [PubMed]
  63. Zhang, Z.Y.; Hu, H.Q.; Wan, C.Y.; Peng, J.H.; Xu, F.L.; Shi, F. Lateral and longitudinal variation in phosphorus fractions in surface sediment and adjacent riparian soil in the Three Gorges Reservoir, China. Environ. Sci. Pollut. Res. 2018, 25, 31262–31271. [Google Scholar] [CrossRef] [PubMed]
  64. Zhu, B.; Wang, Z.H.; Wang, T.; Dong, Z.X. Non-Point-Source Nitrogen and Phosphorus Loadings from a Small Watershed in the Three Gorges Reservoir Area. J. Mountain Sci. 2012, 9, 10–15. [Google Scholar] [CrossRef]
  65. Shen, Z.Y.; Qiu, J.L.; Hong, Q.; Chen, L. Simulation of spatial and temporal distributions of non-point source pollution load in the Three Gorges Reservoir Region. Sci. Total Environ. 2014, 493, 138–146. [Google Scholar] [CrossRef]
  66. Yang, H.C.; Wang, G.Q.; Wang, L.J.; Zheng, B.H. Impact of land use changes on water quality in headwaters of the Three Gorges Reservoir. Environ. Sci. Pollut. Res. 2016, 23, 11448–11460. [Google Scholar] [CrossRef]
  67. Huang, C.; Zhao, D.; Fan, X.; Liu, C.; Zhao, G. Landscape dynamics facilitated non-point source pollution control and regional water security of the Three Gorges Reservoir area, China. Environ. Impact Assess. Rev. 2022, 92, 106696. [Google Scholar] [CrossRef]
  68. Smits, E.; Freeman, J.L. Environmental cleanup using plants: Biotechnological advances and ecological considerations. Front. Ecol. Environ. 2006, 4, 203–210. [Google Scholar] [CrossRef]
  69. Qiu, S.R.; Wang, Y.C.; Wang, J.F.; Li, S.Z.; Ji, Y.X.; Jin, Z.X.; Chen, J.A. Effects of artificial vegetation restoration on the fractions and availability of soil phosphorus in the water-level-fluctuating zone of Three Gorges Reservoir, China. J. Soils Sediments 2023, 24, 1826–1837. [Google Scholar] [CrossRef]
  70. Lu, B.; Xu, Z.S.; Li, J.G.; Chai, X. Removal of water nutrients by different aquatic plant species: An alternative way to remediate polluted rural rivers. Ecol. Eng. 2018, 110, 18–26. [Google Scholar] [CrossRef]
  71. Mito, M.S.; Silva, A.A.; Kagami, F.L.; Almeida, J.D.; Mantovanelli, G.C.; Barbosa, M.C.; Kern-Cardoso, K.A.; Ishii-Iwamoto, E.L. Responses of the weed Bidens pilosa L. to exogenous application of the steroidal saponin protodioscin and plant growth regulators 24-epibrassinolide, indol-3-acetic acid and abscisic acid. Plant Biol. 2019, 21, 326–335. [Google Scholar] [CrossRef]
  72. Forsyth, C.; Brown, N.A.C. Germination of the Dimorphic Fruits of Bidens-Pilosa L. New Phytol. 1982, 90, 151–164. [Google Scholar] [CrossRef]
  73. Garssen, A.G.; Baattrup-Pedersen, A.; Voesenek, L.; Verhoeven, J.T.A.; Soons, M.B. Riparian plant community responses to increased flooding: A meta-analysis. Global Change Biol. 2015, 21, 2881–2890. [Google Scholar] [CrossRef] [PubMed]
  74. Lorah, M.M.; Olsen, L.D. Natural attenuation of chlorinated volatile organic compounds in a freshwater tidal wetland: Field evidence of anaerobic biodegradation. Water Resour. Res. 1999, 35, 3811–3827. [Google Scholar] [CrossRef]
  75. Verma, S.K.; Kingsley, K.; Bergen, M.; English, C.; Elmore, M.; Kharwar, R.N.; White, J.F. Bacterial endophytes from rice cut grass (Leersia oryzoides L.) increase growth, promote root gravitropic response, stimulate root hair formation, and protect rice seedlings from disease. Plant Soil 2018, 422, 223–238. [Google Scholar] [CrossRef]
  76. Wiessner, A.; Kuschk, P.; Kästner, M.; Stottmeister, U. Abilities of helophyte species to release oxygen into rhizospheres with varying redox conditions in laboratory-scale hydroponic systems. Int. J. Phytorem. 2002, 4, 1–15. [Google Scholar] [CrossRef]
Figure 1. Experimental framework.
Water 17 01701 g001
Figure 2. Variations of TN/TDN/NH4+-N/NO3-N concentration of the overlying water released via submerged soil-plants system.
Water 17 01701 g002
Figure 3. Variations of TP/TDP/PO43−-P concentration of the overlying water released via submerged soil-plants system.
Water 17 01701 g003
Figure 4. Pollution loads of TN/TP via soil, plants, or soil–plant system soaking at different elevations.
Water 17 01701 g004
Table 1. Initial mass, plant species and nutrient content of soil–plant systems.
Characteristics150 m System160 m System170 m System
Initial mass (kg)14.01 ± 0.41 b15.30 ± 0.55 a15.72 ± 0.85 a
Plant species (Coverage)C. dactylon (100%)C. dactylon and X. sibiricum (80%, 20%)C. Dactylon and B. pilosa (70%, 30%)
Total nitrogen content of the soil (g·kg−1)1.26 ± 0.11 a1.10 ± 0.07 a0.72 ± 0.17 b
Total phosphorus content of the soil (g·kg−1)0.61 ± 0.02 a0.60 ± 0.03 a0.54 ± 0.02 b
Total nitrogen content of the aboveground plant (g·kg−1)10.06 ± 1.82 b10.88 ± 0.24 b10.89 ± 2.40 a
Total phosphorus content of the aboveground plant (g·kg−1)2.09 ± 0.49 b2.06 ± 0.08 b2.66 ± 0.12 a
Notes: (1) Initial mass refers to the weight of each soil–plant system sample. (2) The mean values in each row followed by the same letter are not significantly different (LSD, p < 0.05).
Table 2. Release amounts of different nitrogen forms in the overlying water via submerged soil–plant systems after 200-d (mg·kg−1).
Release AmountsTNTDNPNANNN
150 m system69.54 ± 3.93 a,*0.61 ± 0.28 c69.08 ± 3.75 a--6.17 ± 0.71 c
160 m system58.91 ± 4.40 b19.30 ± 1.39 a39.76 ± 4.64 c--14.79 ± 1.37 a
170 m system61.20 ± 3.79 b14.85 ± 1.33 b46.50 ± 3.23 b0.73 ± 0.088.98 ± 0.95 b
Note: * means showed in each column followed by the same letter identifier are not significantly different (LSD, p < 0.05).
Table 3. Release amounts of different phosphorus forms in the overlying water via submerged soil–plant systems after 200-d (mg·kg−1).
Release AmountsTPTDPPPOPP
150 m system10.30 ± 1.26 a,*0.66 ± 0.13 a9.40 ± 1.32 a0.51 ± 0.09 a
160 m system5.75 ± 0.63 b0.08 ± 0.07 b5.45 ± 0.66 b0.11 ± 0.02 c
170 m system6.07 ± 0.49 b0.00 ± 0.07 c5.85 ± 0.51 b0.20 ± 0.06 b
Note: * means showed in each column followed by the same letter identifier are not significantly different (LSD, p < 0.05).
Table 4. Relationship of nutrient release amount with initial nitrogen and phosphorus content.
PropertiesTNTDNPNTPTDPPP
Initial mass−0.832 **0.694 *−0.780 **−0.803 **−0.759 **−0.796 **
Soil total nitrogen content0.434−0.5150.5040.626 *0.710 **0.603 *
Soil total phosphorus content0.366−0.3010.3400.4430.5320.421
Plant total nitrogen content0.434−0.5150.5040.626 *0.710 **0.603 *
Plant total phosphorus content0.366−0.3010.3400.4430.5320.421
Soil N/P0.403−0.5190.4930.612 *0.690 *0.591 *
Plant N/P0.185−0.0780.1250.1690.2400.154
Note: * indicated correlation with significant levels at p < 0.05, ** indicated correlation with significant levels at p < 0.01.
Table 5. N and P loadings via soil–plant system in the WLFZ of the TGR.
Elevation150 m
(145–155 m)
160 m
(155–165 m)
170 m
(165–175 m)
Total (Weighted Average)
Area of WLFZ (km2)110.30112.23126.47349.00
Weighted value (%)31.6032.1636.24100
Flooding time (d)240200120--
Pollution load of TN (kg·ha−1)210.53 171.68 105.12 (159.83)
Pollution load of TP (kg·ha−1)30.96 17.76 10.51 (19.30)
Disclaimer/Publisher’s Note: The statements, opinions and data contained in all publications are solely those of the individual author(s) and contributor(s) and not of MDPI and/or the editor(s). MDPI and/or the editor(s) disclaim responsibility for any injury to people or property resulting from any ideas, methods, instructions or products referred to in the content.

